regeneration after logging in the crowsnest forest
TRANSCRIPT

Forest Research Branch
REGENERATION AFTER LOGGING IN
THE CROWSNEST FOREST
. by
R. J. DAY and P. J. B. DUFFY
Sommaire en fran�ais
DEPARTMENT OF FORESTRY PUBLICATION NO. 1007 1963

PUQlished under the authority of
The Honourable Hugh John Flemming, P.C., M.P.,
Minister of Forestry
Ottawa, 1963
ROGER DUHAMEL, F.R.S.C. QUEEN'S PRINTER AND CONTROLLER OF STATIONERY
OTTAWA, 1963
Cat. No. Fo 47-1007

TABLE OF CONTENTS
PAGE
INTRODUCTION. . . . . . . . . . . . . . . . . . . . . . . . . . . . . . . . . . . . . . . . . . . . . . . . • . . • 5
DESCRIPTION OF THE AREA..... . . . . . . . . . . . . . . . . . . . . . . . . . . . . . . . • . . . 5
Location and Extent . . . . . . . . . . . . . . . . . . . . . . . . . . . . . . . . . . . . . . . . . . 5
Geology and Topography. . . . . . . . . . . . . . . . . . . . . . . . . . . . . . . . . . . . . . 5
Climate. . . . . . . . . . . . .. .. . . . . . . . . . . . . . . . .. . . . . . . . .. . . . . . . . .. ... 7 The Forest . . . . . . . . . . . . . . . . . . . . . . . . . . . . . . . . . . . . . . . . . . . . . . . . . . . 8
METHODS........................................................ 9 The Site Classification .. . . . . .. . ..... ...... . ..... . ... . . ..... , . . . 9 The Reproduction Survey . . . . . . . . . . . . . . . . . . . . . . . . . . . . . . . . . . . . . . 11
ANALYSIS. . • . . . . . . . . . . . . . . . . . . . . . . . . . . . . . . . . . . . . . . . . . . . . . . . .. . . . . 14
RESULTS AND DISCUSSION....... . . . . . . . . . . . . . . . . . . . . . . . . . . . . . . . . . . 14
Reproduction in the Crowsnest Forest.. . . . . . . . . . . . . . . . . . . . . . . . .. 14
Site . . . . . . . . . . . . . . . . . . . . . . . . . . . . . . . . . . . . . . . . . . . . . . . . . . . . . 16
Within-Site Moisture Variation. . . . . . . . . . . . . .. . . . . . . . . . . . . .. 18
Logging Method and Time Elapsed Since Logging . . . . . . . . . . . .. 20
Distance from Seed Supply . . . ... . . .. .. . . . . . . . . .. . .. .. ..... , 20
Abundance of Vegetation. . . . . . . . . . . . . . . . . . . . . . . . . . . . . . . . . . 21 Seedbed . . . . . . . . . . . . . . . . . . . . . . . . . . . . . . . . . . . . . . . . . . . . . . . . . . 22
Regeneration SiI viculture. . . . . . . . . . . . . . . . . . . . . . . . . . . . . . . . . . . . . .. 24
SUMMARy........................................................ 25
SOMMAIRE. . . . . . . . . . . . . . . . . . . . . . . . . . . . . . . . . . . . . . . . . . . . . . . . . . . . . • .. 26
ApPENDICES. . . . . . . . . . . . . . . . . . . . . . . . . . . . . . . . . . . . . . . . . . . . . • . . . . . . .. 28
REFERENCES . . . . . . . . . . . . . . . . . . . . . . . . . . . . . . . . . . . . . . . . . . • . . . . . . . . . , 32
3 63212-5-11

'.
Regeneration After Logging in the Crowsnest Forest! by
R. J. DAY and P. J. B. DUFFy2
INTRODUCTION
The problem of securing adequate forest reproduction in logged-over areas of the Crowsnest and other East Slopes Forests of Alberta is a prime concern of government and industry. Such areas do not appear to have sufficient natural reproduction to ensure a future crop even after a lapse of several decades. The status of the reproduction on these logged-over lands has been a matter for speculation and the expression of widely differing opinions.
The matter should have been resolved with publication of the results of Candy's ( 195 1) nationwide survey of reproduction which showed that stocking to regeneration was only 42 per cent in forest types equivalent to those sampled in this work. Though foresters were sceptical of results presented in so broad a manner, the present study clearly shows that Candy's estimate was essentially correct.
This reproduction survey was made in 1958 in the Crowsnest Forest to assess the variation in stocking per cent and numbers per acre of reproduction and to relate any variations to physiographic site and treatment factors.
DESCRIPTION OF THE AREA
Location and Extent
The Crowsnest Forest, 1,295 square miles in extent, is situated in the extreme southwest corner of Alberta, from latitude 49° 10' to 50°15' north and longitude 1 13°50' to 1 14°45' west. It is the most southerly of a series of similar Montane and Subalpine forests that occupy the rugged mountains between the Continental Divide and the lower foothills of the Canadian Rockies. These forests are under the jurisdiction of the Eastern Rockies Forest Conservation Board for the primary purpose of watershed protection. However, logging and summer grazing are extensively practised.
The only part of the Crowsnest Forest with unburned logged-over areas suitable for this study lies south of the Crowsnest Pass, and is termed "the study area" see Figure 1.
Geology and Topography
The region is dominated by two major mountain ranges. The Flathead Range is the more important , its ridge and lofty peaks extending in an almost north-south direction on the west side of the study area. The Clarke Range extends southeast from the southern end of the Flathead Range and borders the study area to the southwest. These mountains are composed of subparallel blocks of Precambrian, Paleozoic and Mesozoic rocks which were thrust up by Tertiary mountain building forces from the west and southwest.
The foothills are formed from rocks of Mesozoic and Tertiary age. The main uplift of the Rocky Mountains took place at the beginning of Oligocene time
I Department of Forestry, Forest Research Branch, Contribution No. 516 2Forestry Officers, Department of Forestry , Forest Research Branch, Calgary, Alberta.
5

, "
I
6
------_ ..........
THE STUDY AREA IN
THE CROWSNEST FOREST SCALE: I
"' 12 MI.
LEGEND
CROWSNEST FOREST BORDER
STUDY AREA BORDER
NATIONAL PARK
WATERCOURSES
ROADS
o
50�------�--�-+������--------�.-------------\
• 49
115
BRITISH . COLUMBIA
\ \
\ I I I I I I \ \
\FORT MocLEOD \ \ \ I 1 1 1 I 1 \
\ I I I 1 1 1 1 I / 1 ,
: //"-I / I / 1/
.... _ ........ � CARDS TON
I ;-..... -.... 1\ I " ........... _-....------l ) \\
f � / \ I , " " J ' ...
.. -.. --.. -.---.. --.. --.-- . .Ji:j��=\""'''''''''''''''''�-----/ \-U.S.A.
114°
FIGURE 1. The study area in the Crowsnest Forest
I I
I I
(Warren 1938). This uplift was followed by an erosional interval, during which peneplanation took place. In Pliocene time another continental uplift took place, and another erosional cycle occurred. This last erosional period resulted in the present contours of the mountains (Clow and Crockford 19.5 1).
7
Extensive glaciation in the area is evidenced by numerous cirques along the fronts of the Flathead and Clarke ranges, a thick covering of glacial till in places, abundant glacial erratics, and topographic features indicative of the passage of glacial ice. The valleys of the Carbondale River, Castle River, Lynx Creek and Lost Creek are U-shaped. Glacial erratics may be found as high as 800 feet above vaHey level. Most of these hills have rounded contours and resemble roches moutonees. Certain of the higher hills of the area and some of the mountain spurs were nunataks during the Pleistocene glacial epoch (Clow and Crockford 195 1 ).
Stalker ( 196 1) has prepared a surface geology map of the Fernie Sheet (East Half) which includes the study area in this report. Surface materials in the study area are described as Wisconsin in age. Ground moraines occur on the mountain and foothill slopes. Pre-Wisconsin(?) deposits may be found above 4,700 feet. Esker ridges, kame mounds and terraces, and stream alluvium occupy the vaHey bottom situations and on steep valley slopes colluvial deposits (talus, slump and slide materials) are common.
The logged-over areas which were surveyed in this study are all situated in the upper reaches of the valleys between 4,500 and 6,000 feet elevation. (See frontispiece).
Climate
The climate varies widely across the narrow belt of Subalpine and Montane forest which divides the dry treeless prairie grassland from the cold and treeless alpine heights. For this reason the local climates of the study area are particularly variable with respect to location and elevation.
Variation in local climate is exaggerated by the major topographic relief that directs weather masses, causes precipitation shadows, and provides a complex of slopes and aspects that receive highly variable amounts of solar radiation. The clarity of the atmosphere further contributes to the wide range in microclimate, and radiation-induced temperature effects are a major feature of the climate.
Spring usually comes suddenly bet\veen May 14 and June 2 1 during a clear period accompanied by intense solar radiation as the sun approaches the summer solstice. Summer is marked by intense solar radiation and by low daytime relative humidities of from 10 to 20 per cent. Even though the sun is hot, air temperatures remain below 90°F. and nights tend to be cool to cold under clear skies. Adiabatic 'Chinook' winds are common at this season. These act to reduce the normal daytime relative humidity further and cause low humidity without dew at night. With clear weather and Chinook winds, drying of the soil surface can be severe. Owing to the occurrence of radiation frosts under clear skies, there is no frost-free season. Such frosts increase in severity in late August and early September and terminate the growing season. The growing season for herbaceous plants and forest regeneration is only about one hundred days and may be further curtailed by soil surface drought.
Mateer ( 1955) has calculated that radiation on cloudless days from February to September is higher in the Rocky Mountain Region than anywhere else in western Canada. Surface temperatures on exposed seedbed materials may rise to over 130°F. for periods of several hours and reach maxima of 150 to 160°F. Cooling at night is rapid under a clear sky and temperature in \·ersions are common. The difference between minimum and maximum air temperatures is from 40 to 50°F. during clear summer weather. Similar differences measured at the soil surface vary from 90 to 1l0°F.

8
TABLE I-SEMI-A N N UAL PRECIPITATION! IN T H E C ROWSNEST FOREST
Elevation Average Precipitation in Inches of Station
in Feet Oct. to May
4,500 10. 8 H.5OO 16. 4 H.5OO 16. 9 t5.000 13.1 t5.000 30. 1 t5.000 . 28.6
5.400 24.1 t5.400 25. 4
6,000 24.5 6,500 19. 7
t6,800 13. 4 6,800 29. 8
Mean . . . . . . . . . . . • . . . 2 1.1
tStations i n the study area. '-Interim years data missing.
May to Oct. Annual
8. 0 18.8 10.7 27.1 10.6 27.5 10.0 23.1 13.0 43.1 15.7 44.3 14.8 38.9 12. 5 37.9 15. 2 39.7 15. 4 35. 1 10. 8 24.2 15.9 47 . 4
12.7 33.9
, Period Number
of Years of Years Measured Measured
1952-1958 6 1952-1958 5" 1952-1958 5" 1953-1958 3" 1953-1958 4" 1955-1958 3" 1953-1958 4'-1953-1958 5 1953-1958 5 1953-1958 5 1953-1958 5 1955-1958 3
Table 1 gives the variation in mean annual and semi-annual precipitation. Much of the variation owing to elevation, aspect and location occurs during the season of snowfall. Other precipitation data reveal actual monthly values as low as 0.36 of an inch (Anon. 1958 and Connor 1920). Such low precipitation can occur up to four months each year. A series of such dry months will cause severe droughts and high fire hazard. Some temperature and precipitation data for three weather stations2 in the nearby Crowsnest Pass have been averaged and are tabulated below;-
The Range of Mean Annual Temperature and Precipitation for the Crowsnest Pass in Three Locations
(Elevation 3781 to 4812 feet) Mean annual temperature . . . . . . . . . . . . . . . . . . . . . . . . . . . 37° to 39°F. Maximum annual temperature . . . . . . . . . . .. . . .. . . . . . . . 90° to -95°F. Minimum annual temperature . . . . .. . . .. . . . . . . . . . . . . . . -29° to -31°F. Mean annual precipitation . . . . . . ... . . . . . .... . . . . .. . . . 20.4 to 21.3 inches.
The Forest
The Douglas Fir and Lodgepole Pine Section of the Montane Forest Region, and the East Slopes Section of the Subalpine Forest Region (Rowe 1959) are represented in the Crowsnest Forest. The study area was limited almost exclusively to the latter section.
The Subalpine Forest extends from timberline at about 7,000 feet to elevations as low as 4,500 feet where it meets the Montane Forest. The climax forest is characterized by both Engelmann spruce (Picea engelmannii Parry)3 or by the Engelmann spruce-white spruce hybrid (P. engelmannii Parry X P. glauca (Moench) Voss.) and alpine fir (Abies lasiocarpa (Hook.) Nutt.), (Horton 1959). Numerous successional stands of lodgepole pine (Pinus contorta Doug!. var latifolia Engelm.) have replaced the mature forest following fire. Douglas fir (Pseudotsuqa menziesii (Mirb.) Franco) occurs occasionally at elevations up to 5,500 feet on warm south facing slopes and dry ridges. It is fairly common at lower elevations in some of the broader valleys in the study area. Whitebark pine (Pinus albicaulis Engelm.) and alpine larch (Larix lyalli Par!.) are locally abundant above 6,000 feet ; occasionally whitebark pine is found at lower elevations.
lData from: Compilation of complete data from storage precipitation gauges in the Crowsnest Forest. Eastern Rockies Forest Conservation Board, Unpuh. MS. , Calgary, Alberta, 1959.
'Michel and Natal, B.C. , and Coleman, Alberta. 3Nomenclature follows Moss (1959).

9
Limber pine (Pinusflexilis James) is rare in the study area but does occur on warm dry stony outcrops at elevations of about 4,500 feet. Aspen (Populus tremuloides Michx.) grows at elevations of up to 6,000 feet, and the balsam poplar complex (Populus trichocarpa T. and G., P. balsamifera L. and others) is found occasionally along streamsides.
The 194.5 inventory report for the Crowsnest Forestl stated that 36 per cent of the land area was above 6,000 feet and was not suitable for lumbering. Another 18 per cent was occupied by stunted, non-productive forest, rivers, marshes, rock barrens, and roads. This left 46 per cent of the land suitable for forest production. Well over half of this (29 per cent of the total land area) was classified as 'young growth' and included areas that has either failed to regenerate satisfactorily or had regenerated to lodgepole pine following various fires since 1936. Only 17 per cent of the area of the Crowsnest Forest carried mature merchantable timber in 1954 and less than half of the volume of this was over ten inches in diameter. There are some stands of mature timber left in the forest but after these are cut a considerable time must elapse before the area will again produce sawtimber.
The logging methods since the turn of this century have been either clear cuttil).g or heavy partial cutting; the latter usually resulted in either death or wind throw of much of the residual stand. Current operations in the study area are only two miles from the Continental Divide and operators estimate that logging of mature spruce-fir stands in the study area can only continue for about seven more years.
METHODS
The field study was in two parts :-( 1) site classification, and (2) regeneration sun'ey.
The Site Classification
The site classification was designed so that simple physiographic features could be used to stratify the logged-over lands for reproduction surveys and for silvicultural treatment after cutting. Obvious differences in aspect, exposure, and slope were used as classification criteria together with physiographic factors of moisture regime, permeability, and ecoclimate (Hills 1952).
After a reconnaissance of the study area in 1957, the following site classification was adopted. It includes refinements that were made during its application in the summers of 1958 and 1959.
Site Type (A) Bottomland Alluvium . .. . . . . . . . . .. . . . . . . . . . . . . . . . . . . . .
(B) Moderate Slopes (i) Exposed-poorly drained . . . . . . . . . . . . . . . .. . . . . . . . . . . .
Exposed-well drained . . . . . . . . . . . . .. . . . . . . . . . . . . . . . . (ii) Protected-poorly drained . . . ... .. . . . . . . . . . .. . . . . . . . .
Protected-well drained .... . . . . . . . . . . . . . . . . . . . . . . . . .
(C) Steep Slopes (i) Exposed-well drained .. .. . . . . . . .. . . . . . . .. . . . . . . . . . .
(ii) Protected-well drained . . . . . . . . . . . . . .. . . .. . . . . . . . . . .
Site Numbers I
II III IV V
VI VII
A schematic diagram of the location of the site types is given in Figure 2, and some of the sites are shown in Figures 3, 4 and 5. Descriptions are given in Appendix 1.
IEastern Ro("kip� FOrf'ot Con3crn.tion Board. 1955. Report of the forest inventory of the Forest Service of the Eastern Rockie" For("st Conscn-ation Board. unpub. MS., Calgary, Alberta.
63212-5-2

""I Ci c: :0 '" ''''
UJ <0 0-'" S '" ,.. r;' '" 0-'< '"
�' ; '" 0-r;' '"
S '"
[ 51 " '"
g. '"
Q o " ui '" '" � ""I o @ �
S CHEMATIC
, I
PHYSIOGRAPHIC SITE CLASSIFICATION
CR OWSNEST F OREST
1\1 T'f'-- ... STEEP PROTECTED: STEEP EXPOSED
:m Moderately
retentive,
fresh to very
fresh.
, I I I , MODERATE
PROTECTED WELL
DRAINED
::sr : , I
MODERATE PROTECTED
P OORLY DRAINED
'lSz:
BOT T OM LAN D
ALLUVIUM
:I
Retentive; l Very retentive; : Moderately I I
open; I I I
:fresh to moderately: very fresh to : moderately , I I moist. moist " : to very I I I I
dry
fresh,
MODERATE EXPOSED
POORLY DRAINED
I I I I
MODERATE
'It : :m: :so: I I
Very retentive;: Retentive i Moderately I
I • I I : moderately moist: fresh to retentive; I I , t • I, : to moist, :moderately moist.:moderately dry to I I
fresh.
..... o

The


13
An example of the coded data recorded is given below :-
Regeneration Advance Growth Quadrat Number �---
Spruce Fir Pine Spl"uce Fir Pine -
1 3 1 0 0 2 1
2 0 2 0 1 1 0 etc.
Key Key o = U nstocked o = U nstocked 1 = Stocked to 0.0"-3" 1 = Stocked to good 2 = Stocked to 3.1"-6" 2 = Stocked to poor potential 3 = Stocked to 6.1"-9+" size class seed ling. class advance growth.
Thus for each quadrat only the presence of the best example of each species of regeneration and advance growth was recorded, regardless of the total number of seedlings. On each quadrat in every fifth-plot cluster all the regeneration and advance growth were counted.
Six factors of significance to regeneration were recorded for each plot cluster.
These are listed as follows:-1. Seedbed (six types):
(a) Mineral soil-included all pure mineral soils and mineral soils with incorporated humus.
(b) Humus-included litter, fermentation and humification (L., F. and H.) layers of the soil profile. Humus accumulation is not generally thick in the Subalpine forest and humus seedbeds are relatively thin with well-decomposed layers.
(c) Decayed wood-included all forms of wood in various stages of decomposition, from entire rotten logs to the scattered debris from completely rotten slash.
(d) Moss-applied to living and dead feather moss, usually Hylocomium splendens1 (Hedw.) (B and G.) or Pleurozium schreberi; (Brid) Mitt. This seedbed is scarce in the study area.
(e) Coniferous litter-was separated from humus to distinguish where there had been a considerable build up of undecomposed spruce and fir needles.
(f) Black muck-included the very moist black soils with moist amorphous and colloidal highly organic upper layers from 6 to 24 inches thick. These soils are of limited extent and occur only where drainage is severely impeded.
The seedbed of a plot cluster was judged as that one supporting most of the regeneration. If there were no seedlings, the seedbed covering the greatest area was recorded. These definitions were necessary to clarify the description of seedbeds which commonly vary widely within plot clusters.
2. Depth to Mineral Soil The depth of L., F. and H. humus was measured on a soil core at the center of
each plot cluster. Where humus was absent the depth was recorded as zero. Black muck was treated as organic material and its depth was recorded.
3. Moisture Variation The moisture status of each plot cluster was classified as (a) normal, (b) wet
ter than normal, or (c) drier than normal than that assigned to the site.
INomenclature follows Watson (1959)

14
4. Abundance of Vegetation The abundance of the ground vegetation was assessed on each plot cluster
as either absent, light, medium or heavy. The term "light" was for scattered herb cover with bare soil inter-spaces; "medium" was for moderate herb and light shrub cover; and "heavy" for dense herb and shrub cover with little space for seedling establishment.
5. and 6. Distance to Seed Tree and Forest Front
The distance to the nearest seed source (a) in the residual stand, and (b) in the adjoining forest was recorded in chains.
ANALYSIS
Field data were from 2,755 plot clusters with 13,775 milliacre quadrats. These were distributed over 77 sample areas each designated by site type. For each area there were six site and treatment factors common to all plot clusters and six factors peculiar to each plot cluster. International Business Machines were used to analyse the various factors in relation to per cent stocking and numbers per acre of reproduction. Data were drawn from replicate areas in the northern and southern halves of the study area. Each replicate included an approximately equal and comparable series of site types. Statistical "t" tests were used to determine significant differences in stocking between the site and treatment factors (Snedecor 1956).
RESULTS AND DISCUSSION
More importance is placed upon percentage stocking than upon numbers per acre of reproduction, for it is believed that stocking percentage gives a more accurate estimate of effective reproduction and its potential for development of a new stand. Numbers per acre data are of little value unless they are qualified as to distribution.
The graphs in Figure 6 demonstrate the relationship of average stocking per cent at various levels within plot clusters to numbers per acre for spruce, fir, pine, and all three species combined. Because the proportion of stocked plots at the 20, 40, 60, 80, and 100 per cent levels varies on every area and because the number of seedlings does not increase regularly in proportion to the stocking per cent, caution is advised in applying these graphs for individual areas. An estimate of numbers per acre from percentage stocking values for individual site areas is therefore likely to be low.
Reproduction in the Crowsnest Forest
The per cent stocking values for all regeneration, advance growth, and both combined. for the entire study area are given in Table 2 together with the results obtained by Candy (1951). Candy's results are from a sample of 7,600 milliacre quadrats in similar logged-over areas in the Crowsnest Forest.
TABLE 2-STOCKI N G TO REPRO D UCTION I N THE C ROWSN EST FO REST
Survey by Year Regeneration Advance Regeneration and Growth Advance Growth
(per cent) (per cent) (per cent)
Candy ............................ 1951 42 24 56
Day and Duffy ................... 1958 46 25 56

9000
8000
1000
6000
II.! 5000 a:
0 <l
a: II.! a.
III 4000 Cl z :J a II.! II.! III
3000
2000
1000
o
15
SEEDLINGS PER ACRE AT VARIOUS
% STOCKING LEVELS FOR
PLOT CLUSTERS
20 4 0
STO CKING
60
% LEVEL
8 0
ALL SPECIES
FIR
SPRUCE
100
FIGURE 6. Seedlings per acre at various % stocking levels for plot clusters

16
The stocking to spruce was only about half that to fir both in regeneration and advance growth (Table 4). Lodgepole pine was poorly represented and forms only ten per cent of all the regeneration in the study area.
The figures for advance growth need clarification (Tables 2 to 4). Of the total 25 per cent advance growth, only 7 per cent was classified as 'good potential' and likely to reproduce the stand. Since some regeneration and advance growth will stock the same quadrat, the average effective combined reproduction is only 50 per cent (Bickerstaff and Matte 1961). Thus advance growth only improves the figure for effective reproduction by 4 per cent. For this reason the discussion in this study is limited mainly to the regeneration that has appeared since logging.
The average values in Table 2 might lead one to conclude that stocking is satisfactory. However, such mean values are for a large land area composed of small units at all levels of stocking. Table 3 gives a more accurate picture of the situation. This shows that only 45 per cent of the area is stocked to more than 41 per cent of regeneration, and 68 per cent of the area to more than 41 per cent if all advance growth is included. As fir, the least preferred species of regeneration, constitutes the largest proportion of the reproduction, the situation cannot be viewed with complacency.
TABLE 3-P E RCENTAGE OF A REA STOCKED TO VARIOUS PERCENTAGE LEVELS
Stocking Level
(per cent)
Unstocked ...... ......... . ................ . 1-20 ....................... ................. . 2 1-40 ....................................... . 4 1-60 ........... . ....... . ................... . 61- 100 ............... ....................... .
Site
Regeneration
Actual I Accumulated
(per cent)
24 100 16 76 15 60 14 45 3 1 31
Regeneration and Advance Growth
Actual I Accumulated
(per cent)
15 100 13 85
4 72 16 68 52 52
Table 4 shows that stocking to "all species" was best on site IV with 58 per cent, intermediate on sites II, III, V, VI, and VII which range from 40 to 48 per cent, and least on site I with 28 per cent.
TABLE 4-STOCKI N G TO REGENE RATION A N D A DVA NCE G ROWTH IN THE CROWSNEST FOREST BY SITE TYPES
Regeneration Site Type ----
Spruce I Fir I Pine I All
(per cent)
1. ........ : . . . . . 17 17 2 28 11.. ............. 2 1 39 3 48 III ... ......... 15 33 5 40 IV ............... 34 43 6 58 V ................ 2 1 41 8 48 V1.. ........ . ... . 16 40 1 1 48 VII .............. 22 4 1 4 48
Ad vance Growth -------
Spruce I Fir I Pine I All
(per cent)
6 13 t 18 4 20 1 23 6 18 1 23
10 24 1 30 6 22 1 26 3 24 1 26 5 23 t 26
- _ ..
Regeneration and Advance Growth
-
Spruce I Fir I Pine I
(per cent)
20 26 2 23 45 4 19 43 6 38 53 7 25 52 8 18 52 1 1 25 52 5
All
38 55 5 1 67 60 60 59
- -- -- --- - --- -- "-- :- -- --
"All Sites ....... . 2 1 36 6 46 6
"Not a mean value because of unequal site samples. tIndicates less than 0.5 per cent.
2 1 1 25 24 46 6 56 I
Spruce regeneration was generally poor in the study area. At best its stocking was only 34 per cent on the moist protected site IV. Of the remaining sites which range from 15 to 22 per cent stocking, the better stocked sites were either

17
protected, such as sites V and VII, or moist such as site II. The poorest stocking was found on sites that are either well drained, such as site I or both exposed and well drained, such as sites III and VI.
The variation in stocking to fir between sites was small except for site I with 17 per cent and site III with 33 pel' �ent. All other sites lie within the range of 39 to 43 per cent stocking.
Stocking to pine ranged from 2 to 11 per cent. This species is best represented on sites III, IV and VI but within-site variation is too great to attribute this to site differences.
Statistical Ct' tests of difference in stocking between sites were mainly nonsignificant. Site IV alone was significantly better stocked than site V for spruce, and significantly better stocked than sites V and VI for all species.
TABLE 5-N UM B E R OF SEEDLINGS P E R AC R E O N VARIOUS SITE T YPES
Site Spruce Fir Pine All
(numhers)
1.. . . . . . . . . .......... ......... . . . .... 410 4.'i0 50 910 II ...... . . . . . ... . ...... 460 1650 30 2130 IlL ................................. 290 1 190 140 1610 IV .................................. IlIO 1 700 470 3280 V ................................... 470 2630 190 3290 V!. .......... . .... . ....... . ........ 330 1580 420 2330 VII.. ...... . . . . . . . . . . . . . . . . 560 2050 140 2750
• All sites .... . . . .... . . . . . ... . ..... 530 1610 220 2360
·Not a mean value due to unequal site samples of seedlings.
The numbers of seedlings per acre by site types are given in Table 5. The variation has much the same trend as the percent stocking (Table 4) except where clumping of seedlings is high. An Index of Clumping, representing the average number of seedlings per stocked quadrat, is derived as follows :-
Number of Seedlings Per Acre Index of Clumping .= --------------
N umber of Stocked Quadrats Per Acre
Table 6 shows the Index according to site and species.
Sites
1.. .. II .... .. ... III .... .. IV. .. .. .. .. V .. ... .' . VI. . . . .. VII. .. . . .. ..
All Sites ... . . .
TABLE 6-IN D EX OF CLUMPING ON SITE TYPES
. . ..
.... ... ..
.. . .
.. ..
.. ...
. . . . . . .
. .
. .
..
.. . .. .
.. ...
. . . . .. . ... ..
Spruce Fir Pine
2.4 2.6 2.5 2.2 4.2 1.0 1.9 3.6 2.8 3.3 4.0 7.8 2.2 6.4 2.4 2.1 4.0 3.8 2.5 5.0 3.5
2.5 4 . .5 3.7
All
3.3 4.4 4.0 5.7 6 . 9 4.9 5.7
.5.1
Spruce is relatively well distributed over the ground and this accounts for the similarity in trend of both stocking per cent and numbers per acre. By contrast, fir is poorly distributed and heavily clumped on sites V and VII. This helps to explain the increase in numbers per acre of fir on these sites over the equally wellstocked sites IV and VI. Pine has a high degree of clumping on site IV. For this reason site IV has more trees per acre than all other sites including those with higher per cent stocking values.

18
The percentage area of each site stocked to various levels is given in Table 7.
TABLE 7-PERCENTAGE A REA OF SITES STOCKED TO VARIOUS LEVELS
Site Type Stocking Level
I I I I I III I IV I V I VI I VII
(per cent) (per cent)
Unstocked ........... . . .. . . . . 39 17 29 to 24 2.3 24 1-20 ......................... 23 1 7 1 5 12 14 15 16 21-40 ........................ 15 19 1 7 18 14 1 5 15 41-60 ...... , ... . ... . . . ........ 9 16 14 17 13 12 14 61-100 ....................... 14 3 1 25 43 35 :15 3 1
Summation of the per cent area in the various site types at any stocking level shows that site I requires the most remedial regeneration treatment per unit area. Site III has a slightly smaller proportional area with low stocking and is followed by sites II, V, VI, and VII which will require about the same degree of treatment. Site IV requires the least remedial treatment.
Tables 4 and 7 both show that large differences in regeneration occurred between sites I and IV and that stocking was similar on the five remaining sites.
A broad relationship is demonstrated between stocking and the physiographic site classification used in this study, and future regeneration surveys in the region should yield more useful results if conducted within the framework of a similar physiographic stratification. Also, the site classification provides a valuable basis for further regeneration research and operations in the study area. At the same time it should be pointed out that the most important factors affecting germination and seedling development are microenvironmental. The number of microsites suitable for germination, survival, and development on any site is not only dependent on inherent site characteristics, but upon minor modifications of the seedling environment resulting from history, treatment, and chance. The environment of trees in the regenerative phase is less closely controlled by major factors of site such as moisture regime, soil permeability, and local climate than it is by factors of the microenvironment such as shade, available soil surface moisture, and the type and depth of seedbed. Thus the type of physiographic site classification used in this study is only likely to be meaningful where site characteristics dominate the balance of microsites controlled by history, treatment, and chance.
Witkin-Site ivloisture Variation Plot clusters in moist hollows, in gullies, and on creeksides were classified as
'wetter than normal' for the site. Plots on average conditions were classified as 'normal' and those falling upon the drier hillocks and banks as 'drier than normal'. This classification permits some analysis of the species representation which occurs within site types with change in microsite moisture status.
Spruce, which has already been shown to tend to have the highest stocking on the moist site types, increases in stocking with increasing microsite moisture status on the drier site types, I, III, V, and VII, (Table 8). By contrast, stocking to fir is generally better on the normal and drier microsites of each site type. Stocking to pine decreases from normal to wet, but varies little between normal and dry microsites.
Though there is better stocking to fir under nearly all conditions, improved average stocking to spruce on moist microsites and site types suggests that moisture is more important for the establishment of this species than for either fir or pine. The greater relative abundance of fir in drier situations may be explained by a superior inherent ability for seedling taproot development (Place 1955 and Day 196P).
' Day, R. J, 1962. The microcnvironment3 occupied by spruce and fir regeneration in the Rocky Moun. tains. Canada. Dept of Forestry. Calgary. Unpuh. MS.
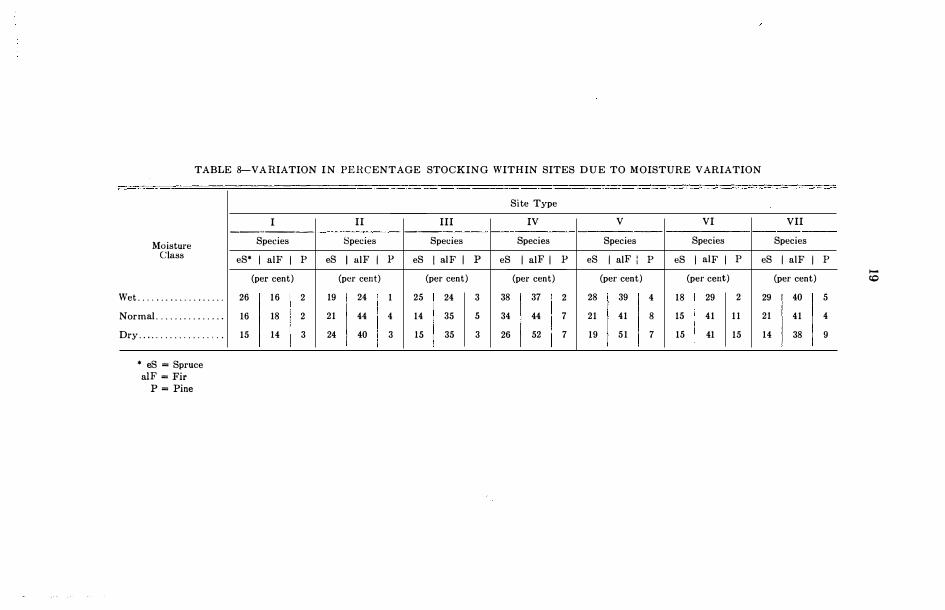
TABLE 8-VAHIATION I N PEHCENTAGE STOCKING WITHIN SITES D U E TO MOISTURE VARIATION
I -------
Moisture Species
Class eS' I all" I P
(per cent)
Wet ................... 26 16 2
Normal. ..... . .. . .. . . . 16 18 2
Dry .. ................. 15 14 3
-------... -
• eS = Spruce all" = Fir
P = Pine
eS
19
21
24
II III ----
Species Species
I all" I p eS I all" I
(per cent) (per cent)
24 1 25 24
44 4 14 35
40 3 15 35
Site Type
IV V VI
Species Species Species
P eS I all" I p eS I all": P eS I all" I P
(per cent) (per cent) (per cent)
3 38 37 2 28 39 4 18 29 2
5 34 44 7 21 41 8 15 41 11
3 26 52 7 19 51 7 15 41 15
VII
Species
eS I all" I P ....
(per cent) (0
29 40 5
21 41 4
14 38 9
20
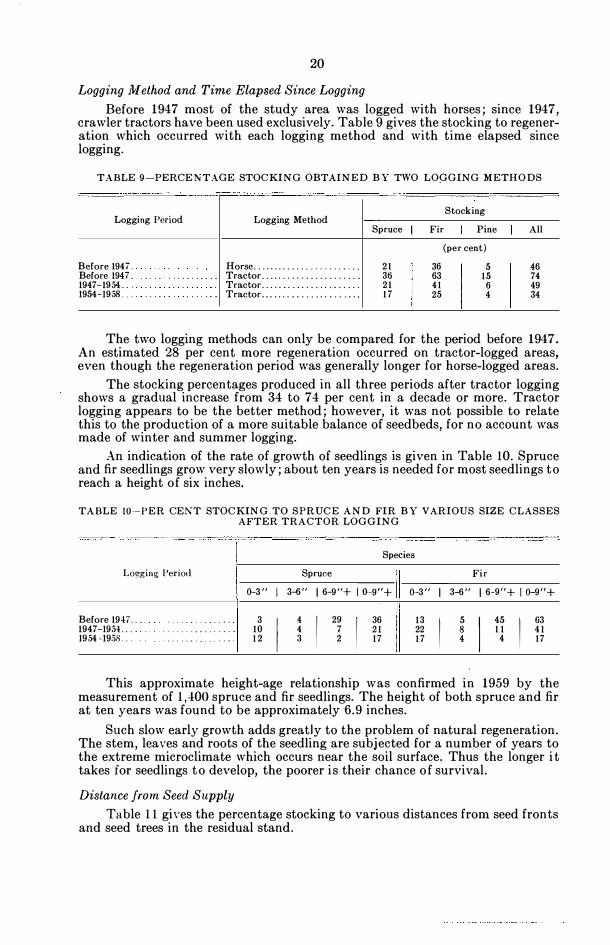
Logging IVethod and Time Elapsed Since Logging
Before 1947 most of the study area was logged with horses; since 1947, crawler tractors have been used exclusively. Table 9 gives the stocking to regeneration which occurred with each logging method and with time elapsed since logging.
TABLE 9-PERCEI'<TAGE STOCKIN G OBTAIN E D B Y TWO LOGGING METHO DS
Logging Period Logging Method Stocking
Spruce I Fir Pine All
(per cent)
Before 194i. Horse ............ . . . . . . . . . . . 21 36 5 46 Before 1947. Tractor ..................... 36 63 15 74 1947-1954 .. Tractor ..................... 21 41 6 49 1954-1958 .. Tractor ..................... 1 7 25 4 34
The two logging methods can only be compared for the period before 1947. An estimated 28 per cent more regeneration occurred on tractor-logged areas, even though the regeneration period was generally longer for horse-logged areas.
The stocking percentages produced in all three periods after tractor logging shows a gradual increase from 34 to 74 per cent in a decade or more. Tractor logging appears to be the better method; however, it was not possible to relate this to the production of a more suitable balance of seedbeds, for no account was made of winter and summer logging.
An indication of the rate of growth of seedlings is given in Table 10. Spruce and fir seedlings grow very slowly; about ten years is needed for most seedlings to reach a height of six inches.
TABLE too-P E R CEr\T STOCKIN G TO SPRUC E A N D FIR B Y VARIOUS SIZE CLASSES AFTER TRACTOR LOGGING
Lo!:!ging Period
Before 1947 . . . . . . . . . . . . . . . 1947-1954 . .. - . . . . . . . . . .
1954-19.';8 . . . . . . . . .
. . .
. . .
. ..
6-3"
3 10 1 2
I
I
Species
Spruce
3-6" I 6-9"+ 16-9"+ 6-3"
4
I 29
I 36 13
4 7 21 22 3 2 17 1 7
Fir
I 3-6" I 6-9"+ 16-9"+
I 5
I 45
I 63
8 1 1 41 4 4 17
This approximate height-age relationship was confirmed in 1959 by the measurement of 1,400 spruce and fir seedlings. The height of both spruce and fir at ten years was found to be approximately 6.9 inches.
Such slow early growth adds greatly to the problem of natural regeneration. The stem, leaves and roots of the seedling are subjected for a number of years to the extreme microclimate which occurs near the soil surface. Thus the longer it takes for seedlings to develop, the poorer is their chance of survival.
Distance from Seed Supply
Table 11 gi\"es the percentage stocking to various distances from seed fronts and seed trees in the residual stand.

21 TABLE ll-PE RCENTAG E STOCK I N G TO REGENERATION AT VARIOUS DISTANCES
FROM SEED SOURCE
Seed Source
Distance Seed Tree Distance Seed Front in
Chains in Spruce I Fir I Pine I All Chains Spruce I Fir I Pine I All
(per cent) (per cent)
0-1 22 39 5 48 0-5 19 34 4 43 1-2 19 29 7 40 5-10 22 37 5 47 2--3 21 33 7 43 10-20 2.1 39 9 49 3-4 20 29 5 40 20+ 34 53 11 65 4-5+ 18 31 6 40
With one exception there is little difference in stocking with distance from the seed supply. Stocking to fir is slightly better within one chain of a seed tree than at greater distances.
TABLE 12-THE PROPORTION OF THE A REA AT VARIOUS DISTANCES F ROM SEED SOURCE
Seed Tree
Distance in Chains
0-1. ........... . ................ . 1-2 .................. .
2-3 .... . ............. . ........ . . 3-4 ............... .
4-5+ .... ........... . ...... . ... .
Seed Source
Proportion
(per cent)
71 14
5 4 6
Seed Front
Distance in Chains
0-5 . .. . .... . . . . ..... . .... . . . . 5-10 ........................ .
10-20 ........................ .
20+
Proportion
(per cent)
58 23 13
6
Since 71 per cent of the area is within one chain of a seed tree and 85 per cent of the area is within two chains of a seed tree (Table 12), seed supply is not likely to be a limiting factor. This considerable residual stand must account for the uniformity in stocking at various distances up to twenty chains from seed fronts. The residual stand is probably the primary seed source, for seed fall generally occurs in the autumn before there is a possibility of seed being blown long distances from fronts over the snow.
A.bundance of Vegetation
Per cent stocking to spruce fir and pine seedlings by vegetation abundance classes is given in Table 13.
TABLE 13-T HE EFFECT OF THE AB U N DA NCE OF THE VEGETATION UPON STOCKING
Vegetation .·\hundanee Class
Ab;ent . ...... .
Light .. Mediulll .. .
Heavy ......... .
Stocking
Spruce I Fir Pine
17 21 25 17
(per cent)
27 38 43 29
11 9 6 3
Proportion of Area in
All Each Class
(per cent)
33 3 45 22 53 47 38 28

22
Stocking to spruce and fir regeneration increases with increasing abundance of shrub and herbaceous vegetation until the vegetation is classed as "heavy"; then there is a marked decrease, probably due to competition. The increase in stocking to spruce and fir regeneration with a moderate increase in abundance of vegetation may be attributed to improvement of the seedling microenvironment by mulching the seedbed and shading the seedlings. In this region where high solar radiation intensities and.soil surface droughts are common in the summer months, protection from excessive insolation and evapotranspiration is important for seedling survival.
In contrast, pine decreases gradually in stocking with increasing abundance of vegetation. Indeed all levels, from light to heavy, appear to offer competition. The statistical test results given in Appendix II confirm this.
Seedbed The stocking to regeneration on various seedbed types is given in Table 14.
TABLE 14-STOCKI N G TO REGENERATION BY SEEDBEDS
Seedbed
MineraL. ... ........ ....................... . Humus .... ................................ . Decayed Wood ..... ....................... . Moss' ........ _ . . . . . . . . . _ _ . . . . . . . . . . . . . . . . . .
_ Coniferous Litter . ......................... . Black Muck. _ _ _ . _ _ _ _ . . . . . . . . . . . . . . . . . . . . . . .
Spruce
20 20 28 50 10 28
Stocking
Fir Pine
(per cent)
32 9 38 5 42 4 44 2 32 5 21 1
* The moss data are based upon only ten plots and are not discussed.
All
41 47 55 62 35 38
Proportion of Stocked
Plots
(per cent)
20.4 56. 1 16. 0
0. 4 3 . 3 3 . 8
Mineral soil, humus and decayed wood are.the most important seedbeds and carry 92.5 per cent of the regeneration stocking the area. Spruce, fir, and "all species" are better stocked on decayed wood than on humus or mineral soil. (The stocking on decayed wood is significantly better than on mineral soil for "all species". Stocking to spruce is significantly better on decayed wood than on humus. See Appendix III.) Humus and mineral soil are equally stocked to spruce, yet fir and "all species" are both 6 per cent better stocked on humus than on mineral soil. Pine, by contrast, is best stocked on mineral soil and poorest stocked on decayed wood.
Coniferous litter and black muck supported only 7. 1 per cent of the regeneration stocking the area. On these two minor seedbeds spruce is best represented on the very moist black muck; fir and pine on the comparatively dry coniferous litter.
The numbers per acre of the regeneration by seedbeds are given in Table 15. The trend is not the same as for per cent stocking.
TABLE 15-SEEDLINGS P E R ACRE O N VARIOUS SEEDBEDS
Seedbed
Mineral. . . ..... _ _ .... _ . . . . . . . . . . . . . . . . . . . . . . . . . . . . . . . Hurnu� . . .. _ . ..... . . ... . .. _ ......................... . Decayed Wood ..................................... . Moss·.. ... _ _ . . . ......... . . . ....... . ........ . Coniferous Litter . . . Black Muck ........ .
Spruce
500 460 810
1600 110
1020
Seedlings Per Acre
Fir Pine
(numbers)
2530 360 1220 130 2270 500 2100 0 1020 230
270 10
• The moss data are based upon only ten plots and are not discussed.
All
3400 1810 3580 3700 1350 1300

23
The index of clumping for each species by seedbed given in Table 16 shows that the regeneration is poorly distributed on certain seedbeds.
TABLE 16-IN D EX OF CLUMPI N G B Y SEEDBEDS
Seedbed
Mineral ............................................ . Humus ............................................. . Decayed Wood ..................................... . Moss ............................................... . Coniferous Litter ................................... . Black Muck ........................................ .
S
���I 2.5 2.3 2.9 3.2 1.1 3.6
Index of Clumping
Fir
7.9 3.2 5.4 4.8 3.2 1 . 3
Pine
4.0 2.6
12.5
4.6 1 . 0
All
8 . 3 3 . 9 6.5 6.0 3.9 3.4
An index of clumping of 8.3 for "all species" shows the regeneration on mineral soil to have the poorest distribution. The distribution on decayed wood is a little better with an index of 6.5. The distribution on humus is much better with an index of 3.9. Thus, though there are nearly twice as many seedlings per acre on mineral soil and decayed wood, the stocking to "all species" on humus is 6 per cent better than that on mineral soil and only 8 per cent poorer than that on decayed wood.
Fir is distributed in a very similar manner to "all species". Spruce is well distributed on all seedbeds, and with the exception of black
muck, is more uniformly distributed than either fir or pine. Distribution of pine is poor on decayed wood, moderately good on mineral
soil and coniferous litter and best on humus and black muck. The difference between stocking per cent and numbers per acre in spruce
and fir regeneration on humus and mineral soil may account for the alleged superiority of mineral soil as a seedbed on logged-over land in the study area. The results of this regeneration survey show that the stocking per cent on other seedbeds is equal to or better than that on mineral soil. This suggests that this seedbed type requires much additional research with respect to regeneration, and in the meantime, caution is advised in applying scarification treatment in clear cut areas in the region.
In 1961 a check was made of the proportional area of each seedbed with 5,574 systematically placed samples' in several drainages in the study area. The results are given in Table 17.
TABLE 17-PROPORTIONAL A REAS OF SEEDBEDS
Seedbed Proportional Area
(percent)
Mineral Soil. . . . . . . . . . . . . . . . . . . . . . . . . . . . . . . . . . . . . . . . . . . . . . . . . . . . . . . . . . . . . . . . . . . . . 20. 4 F . & H . humus.................................................................. 44. 9 Decayed wood. .... . . . . . . . . . . . . . . . . . . . . . . . . . . . . . . . . . . . . . . . . . . . . . . . . . . . . . . . . . . . . . . 16.5 Moss. ... . ..... .................................................................. 6.3 Litter (all types)........................................... . . ............ 1 1.8
There is a close agreement between the proportional areas given in Table 17 with the per cent proportion of stocked plots given in Table 14, even though two methods of seedbed classification were used. Both tables give 20.4 per cent for mineral soil, and if all humus types are lumped, give 56.7 and 59.4 per cent respectively for humus. The fact that 44.9 per cent of the area was classed as F.

24 and H. humus and only 1 1.8 per cent as l itter, together with the large proportion of hare mineral soil, suggests that decomposition of litter is rapid in the region. This is corroborated by the fact that the average depth of the organic layers1 above the mineral soil is only 2.2 inches. The areal proportions of each depth class are given in Table 18; these data were also from the 196 1 survey.
TABLE 18-THE AREAL PERCE NTAGE COVERED BY VARIOUS DEPTHS OF THE O RGANIC SOIL LAYER
Depth of the Organic Layer
(inches)
Mineral Soil. . . . . . . . . . . . . . . . ..... . . . ..... . . . . . . . .. . . . 0.1-1. 0..................... . . . . . . . . . . . . . . .. . . ... . . . . . 1 . 1-2.0 . . . ... . ..... . . . .... . . . ... . . . . . . . . . . ... . . ... . . ..... . .. .
2 . 1-3.0 ... . . . ......... . . . . . . . . .... . . .. . .. . . . . . ..... . . . . . . . . . . .
3. 1-4.0 . . .. . .. . . .... . . . . . . . . ........ . .. . . . . . . . . . . . . . .. . . . . . . . .
4. 1-5.0 .. . . . . . .... . . . . . . . . . .. . .. . . . . . . . . . . . . . . . .. . . .... . . . . .
5 . 1-6. 0 . .. . . .. . . . .. . . . . . . .... . .. . . . . . . . ..... . . . . . . . . . ... . . . . . . 6.1-7 . 0 .... . . . . .. . .. . .. . ... . . . . . . . . . . .. . . . ....... . ...... . . . . .
7. 1-8.0 . . ... . . . . . .... . . . . . . . . ........ . . . . .. . . . . . . ..... . . . . . . . .
8. 1--9+ ... . . .. . . .. . . ... . . . ..... . ...... . ..... . ... . . . . . .. . . . . .. .
Proportion of Actual
Area
(per cent)
20.4 21.3 30.2 16.8 .1. 1 1.8 0.7 0.3 0.4 3.0
Proportion of Area
Accumulated
(per cent)
20.4 41. 7 71.9 88.7 93.8 95.6 96.3 96.6 97.0
100.0
The deep organic matter which has impeded regeneration in other forest regions is not found in the study area. The extent and depth of the various seedbed materials help to explain the variations in stocking to regeneration in the area. The rather unexpected fact that stocking to regeneration tends to be better on the organic seedbeds in the region must be related to the shallow depth of the OI:ganic materials and to the rapid decomposition of organic matter. In such conditions the presence of organic matter may benefit rather than hinder the establishment of regeneration.
Regeneration Silviculture
Regeneration silviculture in the Subalpine Forest has been directed to application of various seedbed scarification methods (Blyth 1955, Crossley 1955, and Ackerman 1957). The results generally supported the hypothesis that mineral soil is a good seedbed for spruce, fir and pine. Howe\"er, it is recognized that successful germination required a good seed year and a growing season with abundant and well-distributed rain. Unfortunately, with the incidence of high radiation temperatures and extended periods of soil surface drought, the occurrence of a combination of a good seed year and suitable weather conditions is infrequent.
The habitat requirements of spruce and fir seedlings appear to change with their development. While an exposed seedbed may be most suited to germination, it may also be very susceptible to drought and heat causing mortality of the germinating seed and establishing seedling. In contrast germination may be less spectacular on some of the organic seedbeds with light to moderate shade, but stocking to established seedlings is superior.
There are two general silvicultural problems in the Subalpine Forest. One is the method of harvesting the remaining merchantable stands to provide adequate regeneration. The second and possibly more important problem is the reforestation of the existing understocked logged-over lands.
Because of the effects of adverse weather in the open, the chances of obtaining prompt regeneration appear to be better under a form of shelterwood cutting, possibly w ith seedbed treatment either before or after the first felling. Experi-
'The organic layers include all organic seedbeds, Litter. F. and H. Humu;', Decayed Wood and Moss.

25
mental work has indicated that the residual stand prevents excessive heating and drying of the soil surface, provides seed and protects the young seedlings. It also follows that stands managed by a shelterwood method should afford a better degree of protection to the watershed values of the region than will areas which have been clear cut, and scarified by crawler tractors.
Reforestation on the moist protected sites of the logged-over areas might be done effectively by either direct seeding or direct seeding with seedbed treatment. However, any natural regeneration method which follows logging will lead to considerable loss of productivity owing to the very slow growth of both spruce and fir seedlings (See Table 10). Reforestation of the drier areas will have to be carried out by planting. Variations in soil moisture and shade will be factors affecting the survival and growth of planted stock. Deep, well-developed root systems may be necessary for establishment on dry exposed sites ; however, if the moist protected sites are also to be planted, younger stock will probably suffice.
SUMMARY
In 1958 a study was made of the reproduction in a number of l ogged-over areas in the Crowsnest Forest of southwest Alberta. To examine general siteregeneration relationships, the survey areas were first stratified by a seven-part physiographic site classification.
This paper describes the study area, outlines the site classification and the method of survey, and gives an analysis of ; ( 1) reproduction in the Crowsnest Forest; (2) the effect of site on the establishment of seedlings ; (3) the effect of within-site moisture variation ; (4) the influence of logging methods and time elapsed since logging ; (5) the seed source ; (6) the influence of vegetation upon stocking; (7) the degree of stocking to seedlings on various seedbed types. The implications of the results are discussed briefly in relation to regeneration silviculture.
The important findings and conclusions of the study may be summarized as follows :-
1. Regeneration on logged-over areas in the Crowsnest Forest is not generally adequate to restock the stands. Stocking to spruce, fir and lodgepole pine is estimated to be 2 1, 36, and 6 per cent respectively. The average value for all species is 46 per cent and if satisfactory advance growth is included, average stocking is raised to 50 per cent. However, 55 per cent of the area sampled was found to be less than 40 per cent stocked or belo\\! the minimum acceptable standard of stocking in Alberta. It is important to note that low quality alpine fir predominates in the regeneration over the more valuable species, spruce and pine .
2. A moist substrate and protection from extremes in local climate, particularly solar radiation, are important factors controlling spruce and fir regeneration. Stocking to these species is best on the fresh-to-moist moderately protected till slopes and poorest on the moderately dry-to-fresh bottomland alluvium. Stocking increases with moderate amounts of vegetation. In contrast, lodgepole pine is best stocked in dry exposed microsites which are free from vegetation.
3. Spruce and fir seedlings tend to be better represented on decayed wood and humus seedbeds than on mineral soiL Organic seedbeds are on the average only 2.2 inches thick in the region. A thin organic layer of this type may prove to be advantageous to spruce and fir seedling extablishment. Mineral soil was the best seedbed for lodgepole pine.
4. Seed supply is not a problem. Approximately 7 1 per cent of the loggedover area lies within one chain of a seed tree or forest border .
. 5. Adequate stocking will usually be procured over a period of 10 to 20 years since there is a slow continuous colonization of soft\vood regeneration on

26
logged-over areas. Stocking to softwood regeneration was found to increase from 34 to 49 to 74 per cent at the end of four, ten and ten to twenty year periods respectively after tractor logging.
The implications of the study are that clear cutting in the Crowsnest Forest has not been favourable for reproduction. The natural regeneration period is a very long one and this method tends to favour alpine fir. More research is needed to develop other cutting methods and in the meantime caution is advised in applying scarification treatment for regeneration in clear cut areas. The shelter-wood method is tentatively suggested.
.
Reforestation of existing unstocked areas is a most important problem. Planting is recommended to ensure adequate stocking and to minimize the loss of productivity caused by very slow seedling growth.
SOMMAIRE
En 1958, on a effectue une etude portant sur la reproduction des essences dans un certain nombre de buches de la foret dans la passe du Crowsnest dans Ie sud-ouest de l' Alberta. Pour examiner les relations generales existant entre la station et la regeneration, les aires faisant l 'objet de la presente etude ont d'abord ete stratifiees selon une classification physiographique des stations en sept parties .
Ce memoire decrit la place d'etude, etablit la classification des stations et la methode suivie au cours de 1'etude et fait une analyse de : 1° la reproduction des essences dans la foret de la passe du Crowsnest ; 2° l'influence du milieu sur l 'etablissement des semis; 3° l 'effet de la variation de l 'humidite dans les limites de chaque station; 40 l 'influence des methodes d 'exploitation et du laps de temps ecoule depuis la coupe; 5° la source de la semence; 6° l 'influence de la vegetation sur la reconstitution du peuplement; 7° Ie degre de reconstitution du peuplement attribuable aux semis dans divers genres de terrains de germination. Suit un bref expose de la signification des resultats par rapport a la regeneration forestiere.
Les constat at ions \importantes et les conclusions de l 'etude peuvent se resumer comme suit :
1. La regeneration des aires exploitees dans la foret de la passe du Crowsnest n'est pas, de faGon generale, suffisante pour reconstituer les peuplements. La reconstitution des peuplements d'epinette, de sapin et de pin de Murray est estimee a 21, 36 et 6 p. 100 respectivement. La valeur moyenne pour toutes les essences est de 46 p. 100 et si l' on comprend les semis preetablis en quantites satisfaisantes , la moyenne de reconstitution du peuplement est portee a 50 p. 100. Toutefois, on a constate que 55 p. 100 de l 'aire d'echantillonnage se reconstituaient a raison de moins de 40 p . 100 ou au-dessous du minimum de repeuplement acceptable en Alberta. II importe de souligner que dans la regeneration Ie sapin concolore de qualite inferieure l 'emporte sur les essences plus precieuses, comme l 'epinette et Ie pin.
2. Un substratum hum ide et une protection c�ntre les extremes du climat local, du rayonnement solaire en particulier, sont des facteurs importants qui regissent la f(3generation de 1'epinette et du sap in. La meilleure reconstitution des peuplements de ces essences se fait sur des pentes, moderement protegees, de till qui varie de frais a humide, tandis que la reconstitution la plus mediocre se remarque dans des alluvions, moderement seches a frarches, des terres basses. La reconstitution des peuplements s'ameliore en presence d'une vegetation moderee . Par c�ntre, Ie pin de Murray reconstitue Ie mieux ses peuplements dans des microstations seches degarnies de vegetation.

27
3. Les semis de l 'epinette et du sapin semblent etre mieux representes dans des terrains de germination composes de bois pourri et d 'humus que dans Ie sol mineral. Les terrains de germination riches en matieres organiques ont en moyenne une epaisseur de seulement 2.2 pouces dans la region. Une mince couche de matieres organiques de ce genre peut se reveler avantageuse pour l 'etablissement des semis d'epinette et de sapin. Le sol mineral offrait Ie terrain de germination Ie plus avantageux pour Ie pin de Murray.
4. Les semenciers ne manquent pas a proximite de l 'aire exploitee. En effet, environ 71 p. 100 de l 'aire exploitee se trouvent a une distance d 'au plus une chaIne d 'un semencier ou de l 'oree du bois.
5. Une reconstitution suffisante du peuplement se fera habituellement au cours d 'une periode de 10 a 20 ans aux endroits ou s 'effectue un etablissement lent et continu de semis dans les aires exploitees. On a constate que la reconstitution des peuplements par rapport a la regeneration des resineux passait de 34 a 49 p. 100, pour atteindre 74 p. 100 a la fin d 'une peri ode de quatre ans, de dix ans et de dix a vingt ans, respectivement, apres Ie debusquage au tracteur.
Cette etude fait ressortir que dans la foret de la passe du Crowsnest, la coupe a blanc n'a pas favorise la reproduction. La regeneration naturelle exige une periode tres longue et cet etat de choses tend a favoriser Ie sapin concolore. La creation de nouvelles methodes de coupe exige plus de recherches et, dans l 'intervalle, on conseille la prudence si l 'on utilise la methode dite de scarification en vue de favoriser la regeneration dans les aires coupees a blanc. On conseille, en guise d 'essai, la methode par coupes progressives.
Le reboisement des aires actuellement degarnies pose un probleme plus important. On conseille la methode de plantation pour assurer une reconstitution suffisante des peuplements et pour minimiser la perte de productivite causee par la grande lenteur de la croissance des semis.

28
APPENDIX I DESCRIPTIONS OF SITES
Site I-Bottomland Alluvium This site occurs on the valley floor alluvium deposits adjacent to the streams.
The relief is flat to gentle with grades of less than 8 per cent. In general, the alluvium is composed of interbanded silts, sands, and gravels with the finer particles near the surface; the large variations in soil texture have resulted from changes in stream course and velocity. Because of a large content of coarsetextured material, these soils have high permeabilities and excessive internal drainage, although large fluctuations in the water table are common due to spring snowmelt and summer drought. Some bottomland alluvium sites hold an enduring supply of soil moisture; this is evident from stumps which show that this site can support some of the largest trees.
The local climate is characterized by moderate sunshine for most of the day and by stratification of cooling air at night.
Site II-Moderate Exposed Slopes with Poorly Drained Soils
This site occurs directly above Site I on the lower mountain slopes with grades between 8 and 20 per cent. The aspect is south to west. The parent material is a stony, heavy clay loam t ill which is kept moist by laterally moving groundwater and springs; gleyed horizons frequently occur at depths between 12 and 30 inches. Hangmoors are common and represent the wettest condition in this s ite type.
A typical soil is a grey-brown heavy clay loam with 30 per cent stones and with gley conditions at 12 inches. The soil is leached to 4 inches and is topped by 5 inches of litter and fibrous humus.
The local c limate as has its main features moderate sunshine for most of the day, good drainage of cool night air, and moderately warm night-time temperatures.
Site III-Moderate Exposed Slopes With Well-Drained Soils Site III lies up-slope and adjacent to Site II. Both have the same grade and
aspect. The parent material is a coarse textured glacial till with laterally moving ground water. The soils are fresh to moderately moist and are retentive. A typical soil profile is a grey-brown sandy clay loam till which is weathered to 18 inches and has a shallow ashy grey silt loam Ae horizon. The profile is topped by half an inch of litter and from one to two inches of granular humus.
The local climate is the same as for Site II.
Site IV-Moderate Protected Slopes With Poorly Drained Soils. Site IV is above the bottomland alluvium (Site 1) on lower north and east
facing slopes with grades between 8 and 20 per cent. The parent material and soil are the same as for Site II.
The local climate is characterized by weak sunshine all day, good cold air drainage at night, and moderately warm night air.
Site V-Moderate Protected Slopes with Well-Drained Soils Site V is located upslope and adjacent to Site IV on coarse textured stony
glacial till at grades of 8 to 20 per cent. The soil is moisture retentive. A typical soil on Site V is a deep, grey-brown sandy loam of variable stoniness
with an eluviated Ae horizon 2 inches in depth and a B horizon 14 inches in depth. The profile is topped by 2 inches of granular mor humus.
The local climate is the same as for Site IV.

29
Site VI-Steep Exposed Slopes Site VI is situated on south and west facing slopes with grades over 20 per
cent. It represents the steepest logged-over terrain covered by this study. The parent material is a stony clay loam till. The moisture status of the soils
is moderately dry to fresh and moderately retentive. Because of the steep angle of the slope, external drainage is excessive. The soils on a small percentage of the steep sites have developed from bedrock which has been exposed by erosion of the glacial till mantle.
A typical soil profile in Site VI is a light brown stony clay loam. A 2-inch leached layer underlies 1 to 2 inches of litter and granular humus.
The local climate is characterized by moderate to strong sunshine most of the day, and by moderately drying winds and warm night air.
Site VII-Sleep Protected Slopes Site VII is situated on north and east-facing slopes. The topography, par
ent material, and soils are similar to those in Site VI. The local climate is characterized by weak sunshine all day, by good cold air
drainage, and by moderately warm night-time temperatures.

30
NOTE TO APPENDICES II AND III
The Appendices II and III give the results of "t" tests carried out between replicates for the various factors. Following a table showing the percentage stocking, the results of the "t" tests are presented in terms of probability. The .percentage stocking values were converted to angles (Arc sin V Percentage) for these tests (Snedecor 1956).
APPENDIX II T H E EFFECT O F ABU NDANC E O F T H E VEGETATION
Stocking to Species by Replicates Abundance
of Spruce Fir Others All Vegetation
1 I 2 I H2 1 I 2 I H2 1 I 2 I H2 1 I 2 I H2
(per cent) (per cent) (per cent) (per cent)
Absent . . . . . . ..... .... . 22 15 17 29 26 27 11 11 11 37 31 33 Light .. ........... . . . . . 23 19 21 38 39 38 6 10 9 42 46 45 Medium . . ...... . . ..... 24 25 25 41 44 43 4 8 6 52 54 53 Heavy ........... .. . . . 16 18 17 28 29 29 1 3 3 37 38 38
Probability Levels by Species and Abundance Classes Abundance
of Spruce Fir Vegetation
Light Medium Heavy Light Medium Heavy
Absent .................. . ...... . >0. 5 0. 4-0.2 > 0.5 < 0 . 05- < 0 . 05 - > 0. 5 Light . . . . ..... . . . . .. . ......... . . - 0 . 4-0.2 0. 4- 0 . 2 - 0.2-0. 1 <0.05-Medium .. ................. ...... - - <0.05- - - <0.05*
Probability Levels by Species and Abundance Classes Abundance
of Others All Vegetation
Light Medium Heavy Light Medium Heavy
Absent . . ................ . . . . . ... 0.4-0.2 0. 2-0.1 <0.05- 0. 2-0.1 < 0.05- 0. 4-0. 2 Light ....... . . .......... . . .. . . .. - 0 . 5-0.4 0.2-0. 1 - 0.1-0. 5 0.1-0.05 Medium ....... . . . . .. . . . . . ....... - - 0.4-0 . 2 - - <0. 05-
- 0.05 - Significant.

Seedbed Number--
1 " 2 3 4 5 6
Seedbed Number"
2 ' -
1 * ' 0 . 4-0 . 2 2 -
3 -
4 -
Seedbed Number"
2"
1 *' 0.4-0 . 2 2 -
3 -
4 -
, 0 . 05 = Significant. *' Note: 1 = Mineral
6 = Black Muck.
31
APPENDIX III T H E EFFECT O F SEEDBED
Stocking to Species by Replicates
Spruce Fir Others All I 1 2 1 1 +2 1 1 2 1 H2 1 I 2 1 H2 1 I 2 I H2
(per cent) (per cent) (per cent) (per cent)
22 20 20 28 34 32 7 10 9 39 42 4 1 19 20 20 39 38 38 3 6 5 47 46 47 26 30 28 35 47 42 2 5 4 52 57 55 35 60 50 50 40 44 5 - 2 GO 63 62
6 12 10 31 32 32 5 4 5 36 35 35 36 2 1 28 19 22 21 - 2 I 43 32 38
Probability Level� by Species and Seedbeds (Numbers)
Spruce Fir
3 4 5 6 2 3 4 5 6 --- ---! - --- --- ---
0. 1--0 . 05 0 . 2-0. 1 0. 1-0. 05 0.5-0. 4 0. 2-0. 1 0.4-0. 2 0.2-0. 1 > 0 . 5 0. 1--0.05 <0.05� 0.2-0. 1 0 . 2-0. 1 0. 4-0.2 - >0.5 0 . 4-0. 2 < 0.05' <0.05*
- 0 . 4-0.2 <0.05' > 0.5 - - > 0.5 0 . 4--0. 2 0. 1--0.05 - - 0.1--0. 05 0.4-0. 2 - - - 0. 1--0.05 <0.05'
0.2-0. 1 <0.05'
Probability Levels by Species and Seedbeds ( Numbers)
Others All
3 4 5 6 2 3 4 5 6 --- --- --- --- --- --- --- --- ---
0 . 2-0. 1 0. 4-0. 2 0.2-0.1 0.1--0.05 0. 1--0. 05 < 0.05- <0.05- 0. 1--0.05 > 0.5 > 0.5 0 . 5-0. 4 > 0.5 0 . 4--0. 2 - 0.2-0. 1 <0.05 - <0.05' 0.4--0. 2
- >0.5 0. 4-0.5 0.4-0. 2 - - 0. 2-0. 1 <0.05* 0 . 2--0. 1 - - 0. 4-0.5 >0.5 - - - <0.05' 0. 1--0. 05
0. 1--0.05 0. 1--0. 05
2 = Humus 3 = Decayed Wood 4 = Moss 5 = Coniferous Litter
/

32
REFERENCES
ACKERMAN, R. F. 1957. The effect of various seedbed treatments on the germination and survival of white spruce and lodgepole pine seedlings. Can. Dept. of N. A. and N. R., For. Br. For. Res. Div., Tech. Note 63.
ANON, 1958. Climate of British Columbia, Province of British Columbia, Dept. of Agric., Report for 1958.
BICKERSTAFF, A. and L. MATTE 196 1 . The combined stocking of multiple species combinations. For. Chron., 37( 1) :35-38.
BLYTH, A. W. 1955. Seeding and planting of spruce on cut-over lands of the Subalpine Region of Alberta. Can. Dept. of N. A. and R., For. Br., For. Res. Div. Tech. Note 2.
CANDY, N. H. 195 1. Reproduction on cut-over and burned-over land in Canada. Can. Dept. of Resources and Development, For. Br., For. Res. Div., Silvicultural Research Note No. 92.
CLOW, W. H. A. and M. B. B. CROCKFORD 195 1. Geology of Carbondale River area, Alberta. Research Council of Alberta, Report No. 59. University of Alberta, Edmonton.
CONNOR, A. J. 1 920. The temperature and precipitation of Alberta, Saskatchewan and Manitoba. The Meteorological Service of Canada, Dept. of Marine and Fisheries.
CROSSLEY, D. L 1955. Mechanical scarification to induce white spruce regeneration in old cutover spruce stands. Can. Dept. of N. A. and N. R., For. Br., For. Res. Div., Tech. Note 24.
HILI,!), G. A. 1 952. The classification and evaluation of site for forestry. Ontario Dept. of Lands and Forests, Division of Research, Research Report No. 24.
HORTON, K. W. 1959. Characteristics of subalpine spruce in Alberta. Can. Dept. of N. A. and N. R., For. Br., For. Res. Div., Tech. Note 76.
MATEER, C. L. 1955. Average insolation in Canada during cloudless days. Canadian Journal of Technology, 33 :12-32.
Moss, E. H. 1959. The flora of Alberta. University of Toronto Press. Toronto, Ontario.
PLACE, 1. C. M. 1955. The influence of seedbed conditions on the regeneration of spruce and balsam-fir. Can. Dept. N. A. and N. R., For Br., Bull. No. 1 17.
ROWE, J. S. 1959. Forest regions of Canada. Can. Dept. of N. A. and N. R., For. Br., BuI. No. 12.3 .
SNEDECOR, G. W . 1956. Statistical methods. The Iowa State College Press, Ames, Iowa, 5th Edition.
STALKER, A. M. 1961. Surface geology, Fernie Sheet 82G ( East half). Dept. Mines and Tech. Surveys, Geological Survey of Canada. Map 31-196 1.
WARREN, P. S. 1938. Age of the Selkirk and Rocky Mountain uplifts in Canada. Am. J. Science, 36: 67-7 1.
WATSON, E. V. 1959. British mosses and liverworts, Cambridge University Press.