reforming states group – november 12, 2015 reducing
TRANSCRIPT

Reducing Avoidable Emergency Department Utilization
Reforming States Group – November 12, 2015

First things first…• Conflicts or disclosures: None• Thanks and acknowledgements• A brief follow-up from RSG 2014

Case 1 – Minor outpatient surgery
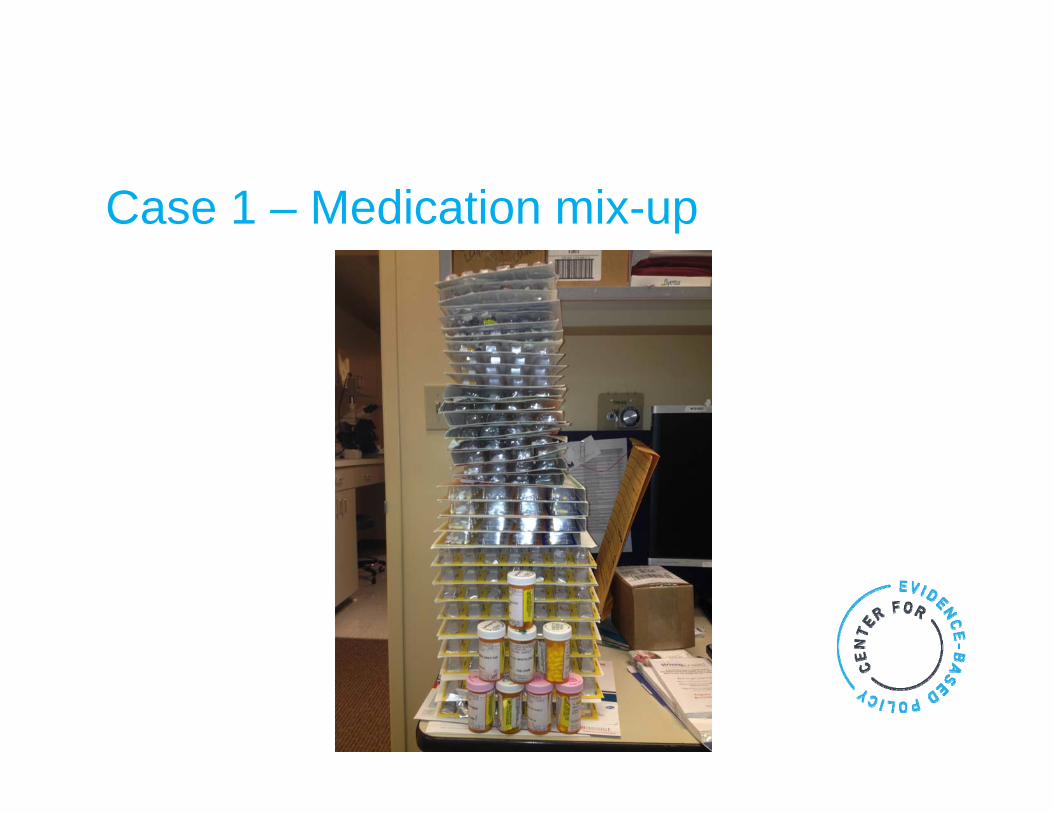
Case 1 – Medication mix-up

Case 2 – Swedish light bulbs

The scope of the problem
Is avoidable ED use a major problem?

Background• About 10-15% of all ED visits are for non-urgent or
primary care treatable issues• Medicaid beneficiaries are more likely to use the ED
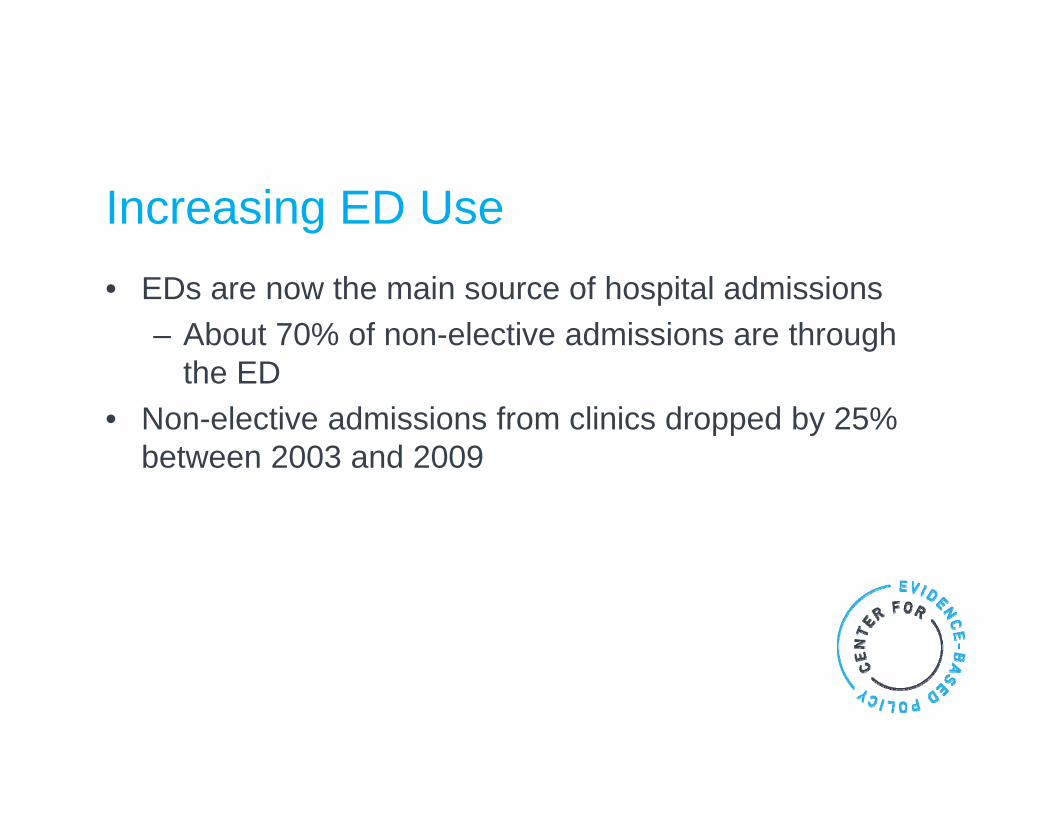
Increasing ED Use• EDs are now the main source of hospital admissions
– About 70% of non-elective admissions are through the ED
• Non-elective admissions from clinics dropped by 25% between 2003 and 2009

A snapshot of ED use in the VAUsage category (visits/year)
# of patients (%) # of visits (%)
1 493,391 (53) 493,391 (24.5)
2‐4 356,258 (38.3) 910,195 (45.3)
5‐10 70,741 (7.6) 447,875 (22.3)
11‐25 9,705 (1.0) 137,152 (6.8)
>25 617 (0.07) 21,669 (1.1)
Raven, et al. (2013). Annals of Emergency Medicine. 62(2):151‐159

Measuring avoidable ED use• Identifying avoidable ED visits is challenging
– ED discharge diagnoses that are “non-emergent” or “primary care treatable”
– Various algorithms are promoted– Poor correlation between the patient’s complaint and the
seriousness of the issue or ultimate need for admission• A patient with chest pain could have acid reflux or could be
having a heart attack
Raven, et al. (2013). JAMA. 309(11):1145‐1153.

Area of interest and innovation• CMS Diversion Grant Program, 2008-2012
– $50 million to support 29 projects in 20 states• Increased primary care capacity• ED to primary care linkages• Programs targeting superutilizers
– 12 states (16 programs) submitted brief results– Effect and sustainability of the programs was mixed

Causes of avoidable ED utilization
Why do people go to the ED anyway?

Access
Gindi, et al. (2014). NCHS Data Brief. No. 160

Access
Gindi, et al. (2014). NCHS Data Brief. No. 160

Patient factorsCharacteristics Odds ratio for 11‐25 visits Odds ratio for >25 visits
Homelessness 4.43 6.60
Schizophrenia 3.72 6.86
Opioid prescription 5.06 5.08
Substance abuse 2.85 2.97
Raven, et al. (2013). Annals of Emergency Medicine. 62(2):151‐159

Patient factorsPatient Subgroup Number % of all superutilizers
Terminal cancer patients
11 0.7%
Emergency dialysispatients
30 1.8%
Orthopedic surgery patients
60 3.6%
Trauma patients 195 11.6%
Patients with serious mental healthdiagnosis
685 40.7%
Patients with multiple chronic conditions
701 41.6%
Johnson, et al. (2015). Health Affairs. 34(8):1312‐1319.

Practice culture and patterns• Changing relationships between PCPs, EDs, and
hospitalists• Productivity demands for PCPs make it hard to
accommodate acutely ill patients– These patients are often referred to the ED– Fewer direct admissions from outpatient clinics– Ease of complex diagnostic work-ups
Morganti, et al. (2013). RAND Research Report.

Impacts of avoidable ED utilization
Does overuse of the ED matter?

Overcrowding• ED use grew at twice the rate of population growth from
2001 to 2008• 198,000 fewer hospital beds during the same period• This has led to overcrowding and boarding
– Associated with poorer patient outcomes
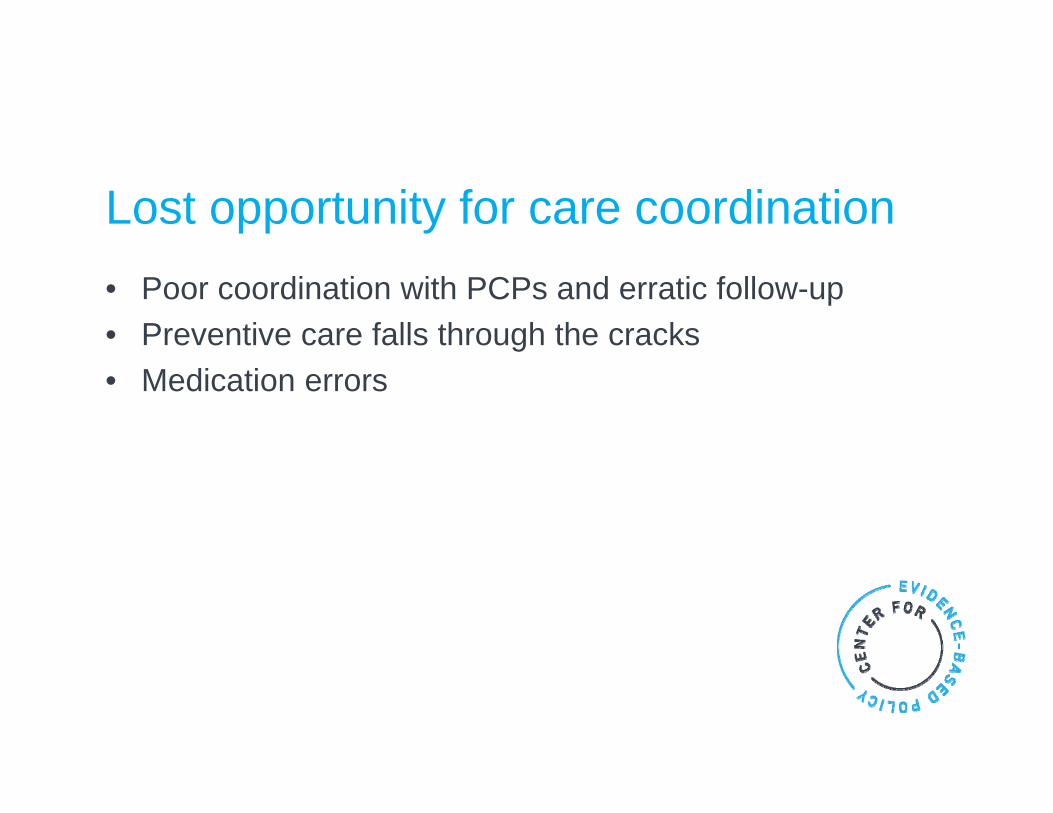
Lost opportunity for care coordination• Poor coordination with PCPs and erratic follow-up• Preventive care falls through the cracks• Medication errors

Perspectives on ED “cost”
Diagnosis Mean total ED bill Mean total PC office bill
Otitis media $410 $157
Acute pharyngitis $562 $152
Urinary tract infection $776 $189
Mehrotra, et al. (2009). Annals of Internal Medicine. 151(5): 321‐328.

Perspectives on ED “cost”
Caldwell, et al. (2013). PloS One. 8(2): e55491.

Perspectives on ED “cost”
Inpatient29%
Office‐based provider24%
Prescriptions20%
Hospital outpatient
10%
Dental7%
Home health4%
ED4%
Other2%
Medical Expenditure Panel Survey, 2009

Perspectives on ED “cost”
Alhassani, et al. (2012). New England Journal of Medicine. 366(4): 289‐291.

Perspectives on ED “cost”“Put simply, when an ED is fully staffed to manage 2 major traumas, a myocardial infarction and a septic neonate at the same time, it does not take many additional resources to evaluate a sprained ankle or a headache.”
Lowe, et al. (2012). Annals of Emergency Medicine. 58(3):235‐238.

Proposed solutionsWhat is being tried to reduce avoidable ED use?

CMS Guidance• Center for Medicaid and CHIP Services (CMCS) Bulletin on
reducing non-urgent use (July 2014)– Three proposed strategies:
• Expanded primary care access• Programs targeting super-utilizers• Programs addressing co-morbid mental health and substance
abuse issues– Differential payments and cost-sharing

CMS Guidance• CMCS Bulletin on super-utilizer programs
– Offers support by way of:• Enhanced federal match for MMIS redesign or health
information exchanges• Assistance with utilization review and data analysis• Temporary enhanced match for Medicaid health homes• Shared savings methodologies for integrated care and case
management– Super-utilizer program case studies
• OR, NC, MN, ME, MI, VT

Studied interventions• Patient education programs• Increased primary care capacity• Pre-hospital diversion• Managed care: Capitation and gatekeeping• Patient financial incentives

Studied Interventions• Intensive case management programs
– Care coordination by social workers– Crisis intervention– Supportive therapy– Assistance with benefits applications– Substance abuse treatment– Supportive housing– “Assertive community outreach”

Discussion
1. Is this issue serious enough to warrant attention from policymakers?
2. What kind of evidence would you want that these programs work before moving forward?

Systematic reviews of the evidence
What does the evidence say about these programs?

Systematic Review – Morgan 2012• Non-ED interventions to reduce ED visits• 5 RCTs, 34 observational studies• Mostly very low quality because of design• Mix of public and private insurance• Some studies outside the U.S.

Systematic Review – Patient Education• Patient education interventions (5 studies)
– 2 studies showed 20-80% decrease in ED use– 3 studies with non-significant decreases

Systematic Review – Expanded access• Expanded non-ED capacity interventions (10 studies)
– Mix of new community clinics and increased access at existing clinics
– 4 studies showed decreased ED use (9% to 54%)– 5 studies found no difference– 1 study found a 21% increase in ED use– Most found significant increase in non-ED care– 2 reported on total cost with mixed results (-16% to +20%)

Systematic Review – Pre-hospital diversion
• Pre-hospital diversion interventions (2 studies)– 1 study (U.S.-based) offered ~1,000 low acuity
patients care at home or in the PC office– 7% decrease in ED use compared with matched
historical controls

Systematic Review – Managed care• Managed care interventions (12 studies)
– 6 studies on effects of capitation, 5 studies on PC gatekeeping, 1 hybrid study
– 9 studies found decreases in ED use of 1% to 46%– 3 studies found no difference in ED use– 2 reported total cost decreases with capitation– Better designed trials showed more modest effects

Systematic Review – Financial incentives
• Financial incentive interventions (10 studies)– Mix of co-payments, co-insurance, or high-
deductibles– 9 studies found decreases in ED use of 3% to 50%– 1 study found increased ED use of 34%– 3 reported mixed cost outcomes

Systematic Review – Althaus 2011• Programs targeting super-utilizers• 3 RCTs, 8 before-and-after studies• Low-to-moderate quality evidence• About half conducted in the U.S.• Mostly case management of varying intensity• Relatively short follow-up periods (5 to 24 months)

Systematic Review – Althaus 2011• 7 programs showed decreases in ED use• 3 programs showed no difference• 1 program showed an increase in ED use• Effect on total cost (from perspective of the hospital) was mixed in 3
studies– 1 RCT reporting on cost found better social and clinical
outcomes at the same cost as “usual care”• Other benefits: decreased substance abuse and homelessness,
increased primary care engagement

Discussion
1. Is this evidence adequate to support wider adoption of these programs?
2. What concerns do you have about the evidence, and what other outcomes would be of interest?

Risk of bias in study designs

Risk of bias in study design• Higher quality studies less likely to show effects• Outcomes are often preliminary (6 or 12 month effects)• Publication bias

Risk of before-and-after studies• Observed differences in a group after the intervention
could be due to:– Other changes occurring simultaneously– Natural history of the problem
Johnson, et al. (2015). Health Affairs. 34(8):1312‐1319.

Risk of before-and-after studies• The natural history of ED use may also vary by
enrollment time

Indirectness• Caution with multicomponent interventions• Broader use of highly targeted interventions• Lack of head-to-head comparisons (choosing among
multiple policy options)

Imprecision• Wide estimates of the effects in the studies• “Discounting” for effects in the real world

Unintended outcomes• Co-pays in Oregon Medicaid (OHP vs OHP Plus)
Service type Probability of service use
Expenditure per user
Expenditureper person
ED ‐8% +8% ‐2%
Inpatient +27% ‐6% +20
Overall +2%
Wallace, et al. (2008). Health Services Research. 43(2):1312‐1319.

Dealing with insufficient evidence
The evidence isn’t clear – how do we move forward?

An opportunity• When the evidence is lacking, policy innovation can be
even more important– Must be done with careful plans for evaluation– Focus on outcomes that matter to you as
policymakers– Academic and agency collaborations

Washington ER is for Emergencies• Collaboration with hospitals and providers• Seven best practices:
– Health information exchange– Patient education– Identification of frequent users– Care plans and primary care follow-up– Strict narcotic guidelines– Participation in prescription drug monitoring– Feedback to hospitals on performance

Washington ER is for Emergencies• 10% reduction in ED use with a 23% reduction for the
most frequent users• Overall cost savings of $10 million in fee-for-service and
$23 million in managed care

Emerging data and ideas
What’s on the horizon?

Effect of primary care medical homes• Medicare beneficiaries in PCMHs had lower rates of ED
use than those in non-PCMHs• A pilot PCMH and shared saving program in PA reduced
ED (and inpatient) utilization and improved quality• A multipayer PCMH pilot in CO reduced ED use by 8-
10%
Pines, et al. (2015). Annals of Emergency Medicine. 65(6):652‐660Friedberg, et al. (2015). JAMA Internal Medicine. 175(8):1362‐1368Rosenthal, et al. (2015). Journal of General Internal Medicine. Pre‐pub [Oct 8, 2015]

Cold-spotting?• Seeks to understand and address community factors
that lead to avoidable healthcare use
Westfall, J.M. (2013). Journal of the American Board of Family Medicine. 26(3):228‐230

Questions and DiscussionContact: [email protected]