reforestation, relocation and resources: a casestudy of
TRANSCRIPT

Reforestation, Relocation and Resources: A casestudy of forest-based livelihoods in Northeastern Thailand
Asta Hooge Poulsen, Eleni Gkotsi, Enno Sonntag & Maja Kirstine Dahl Jeppesen

2

3
Abstract
This project examines the ways in which the relocation of the rural Thai village Ban Huai Nam
Khem, resulting from increased forest conservation efforts, has influenced the villager’s
livelihoods. An interdisciplinary approach was chosen to illuminate different perspectives on
the issue.
We found that the villagers, most of whom were previously farmers, have adapted their
livelihood strategies in a way that made them more dependent on collecting and selling forest
resources. Incoherent policies and rules of different institutions creates uncertainty about the
future, for example by making it impossible for the villagers to get an official permission to
collect forest resources.. The economical dependency on the forest is highest for low income
households, but to most villagers the forest also has a symbolic value. The most important
resources they collect are mushrooms, bamboo shoots, Litchi, Satoh and broom grass and all
are influenced by the environmental changes resulting from reforestation in the area. This
process has decreased the availability of broom grasses, but increased the availability of
mushrooms and other important resources. Additionally water scarcity is a main issue for the
availability of forest resources which may influence this contribution to the villagers’
livelihoods.
Furthermore the lack of an official collection permit, together with uncertainty concerning a
possible new relocation is also seen as a possible threat by the villagers. They deal with these
threats by sharing knowledge on resource collection, bending constraining rules and
diversifying their livelihoods, so they are not solely dependent on the forest resources.

4
Acknowledgements
We want to thank the people and institutions who made this project possible. First of all we
want to thank our professors at Copenhagen University Dr. Myles Oelofse and Dr. Paul Stacey
for their guidance and support throughout the project. Furthermore we want to send thanks
to the professors from Kasetsart University in Thailand. Also thanks to our interpreters.
Without them, we would not have been able to do this project.
But most of all we want to send a special thanks to the villagers and especially the headwoman
of Moo 11 for their warm welcome to the village and willingness to help with our project.
Table of contribution
Chapter Author Contributors
0 Abstract All All
1 Introduction Enno All
2 Methods Eleni All
3.1 Research area and history of relocation Eleni & Enno All
3.2 Authorities Maja All
3.3 The use of forest resources Enno All
3.4 State of the forest Asta All
3.5 Perception of the forest Maja All
3.6 Strategies Asta & Maja All
4 Conclusion All All

5
Inhalt Acknowledgements .................................................................................................................... 4
Table of contribution .................................................................................................................. 4
List of Abbreviations ................................................................................................................... 7
1 Introduction ........................................................................................................................ 8
2 Methods ........................................................................................................................... 12
2.1 Semi-structured Interviews ....................................................................................... 12
2.1.1 Reflections .......................................................................................................... 12
2.2 Surveys ....................................................................................................................... 13
2.2.1 Questionnaire ..................................................................................................... 13
2.2.2 School visit .......................................................................................................... 13
2.2.3 Reflections .......................................................................................................... 14
2.3 Transect walks ........................................................................................................... 14
2.3.1 Reflections .......................................................................................................... 15
2.4 Focus group discussion .............................................................................................. 15
2.4.1 Community meeting ........................................................................................... 16
2.4.2 Reflections .......................................................................................................... 16
2.5 Botanical specimen collection ................................................................................... 16
2.6 Soil sampling .............................................................................................................. 16
2.6.1 Reflections .......................................................................................................... 17
2.7 Group dynamics ......................................................................................................... 18
3 Findings and Analysis ....................................................................................................... 19
3.1 Research Location and Historical Background .......................................................... 19
3.1.1 Climate................................................................................................................ 20
3.1.2 Land use and land cover change ........................................................................ 20
3.1.3 Conservation induced displacement .................................................................. 21
3.1.4 Today’s village and it’s people ........................................................................... 22
3.2 Authorities and Moo 11 ............................................................................................. 23
3.2.1 No authority takes responsibility for the villagers ............................................. 23
3.2.2 Gap between law and practice........................................................................... 24
3.2.3 Considerations .................................................................................................... 25
3.3 The Use of Forest Resources ..................................................................................... 26
3.3.1 Considerations .................................................................................................... 32
3.4 State of the Forest ..................................................................................................... 32

6
3.4.1 Impacts on forest resource availability .............................................................. 34
3.4.2 Considerations .................................................................................................... 36
3.5 Perception of the Forest ............................................................................................ 36
3.5.1 Importance of the forest .................................................................................... 36
3.5.2 Forest dependency ............................................................................................. 37
3.5.3 Considerations .................................................................................................... 38
3.6 Strategies ................................................................................................................... 39
3.6.1 Considerations .................................................................................................... 40
4 Conclusion ........................................................................................................................ 41
5 References ........................................................................................................................ 43
Appendix I – List of Informants ................................................................................................ 45
Appendix II – SSI Topics ............................................................................................................ 47
Appendix III – Questionnaire .................................................................................................... 49
Appendix IV – Questionnaire Results 1 .................................................................................... 50
Appendix V – List of Useful Species .......................................................................................... 54
Appendix VI – Sakaerat Silvicultural Research Station ............................................................. 58
Appendix VII – Synopsis ............................................................................................................ 63

7
List of Abbreviations
Name / Term Abbreviation
Carbon C
Focus group discussion FGD
National forest reserves NFR
National park NP
National research forest NRF
Nitrogen N
Royal forest department RFD
Research centre RC
Sor Tor Gor (certificate) STG
Semi-structured interview SSI
Transect walk TW
Water holding capacity WHC

8
1 Introduction
In the 1980s and 90s Thailand was one of the most
rapidly growing economies in the world. This
development was accompanied by fundamental changes
of land use and land cover, and consequently affected
livelihoods and social realities based on the use of
natural resources. A complex interplay of inconsistent
policies has shaped these processes.
Thailand’s rural development has often been described
as characterized by two phases (Leturque & Wiggins,
2010; Rigg, 1993). The early policies in the 1960s mainly
promoted industrialization, infrastructure and
development in the economic centre of Bangkok
(Gullette & Singto, 2015). In the rural provinces 70 % of
the population was working in the agricultural sector and
infrastructure was poorly developed (Leturque &
Wiggins, 2010). The most important natural resources,
arable land and forest, were abundant and formed the basis of rural livelihoods. In 1961
forests covered 53.33 % of Thailand (Phanurak, 2012). To generate foreign currency and fuel
economic development, the central government promoted commercial logging and rice
farming for export (ibid). Additionally the drastic population-increase (Figure 1) drove
expansion of rice farming and consequently led to a rapidly progressing encroachment on
lowland forests (Rigg, 1993).
The second phase of rural development promoted periurbanization and infrastructural
improvements which increased accessibility of remote provinces such as our study area in
Nakhon Ratchasima (Gullette & Singto, 2015). Starting in 1975, easy credit access encouraged
commercialization of agriculture and promoted production of cash crops such as manioc,
maize and sugarcane (Leturque & Wiggins, 2010; Rigg, 1993). These are mainly cultivated in
the uplands which led to further forest encroachment (Rigg, 1993). Consequently forest cover
was reduced to 25.28 % of Thailand’s land surface in 1998 (Phanurak, 2012). Growing demands
Figure 1: This graphic illustrates the increase in population paralleled by drastic deforestation for agricultural expansion that occurred in Thailand between 1960 and 1988 (Rigg, 1993).

9
from urban centers furthermore increased the pressure on natural resources and exacerbated
degradation of remaining forests. In the Northeastern Isan region where our research was
conducted, forest cover declined dramatically from 93 % in the 1940s to barely 8 % in 2010
(Moreno-Black & Somnasang, 2010).
Forest protection became necessary and was first implemented in the National Park Act of
1961 (Phanurak, 2012). In the same year Khao Yai in the southern part of Isan region was
created as Thailand’s first National Park (NP) (Rigg, 1993). Following the National Forest
Reserve Act of 1964 the legally protected area, including NPs and National Forest Reserves
(NFR), increased to cover 63.2 % of Thailand today (Phanurak, 2012). Notwithstanding 20 % of
the protected area is under cultivation now and only about one third was initially covered in
forest (Rigg, 1993). Additionally about 20 % of Thailand’s villages, supporting several million
squatter households in the 1980s, are situated within NFR, making forest protection a matter
of potential social conflict (Leblond, 2014; Phanurak, 2012). Addressing this issue the Royal
Forest Department (RFD) began to offer these families usufruct certificates ‘Sor Tor Gor’,
giving 624,000 farm households temporary cultivation rights by 1985 (Rigg, 1993). The turn to
a more aggressive conservation approach in the 1980s, marked by the Forest Policy of 1985,
has been seen as measures against communist guerilla who were occupying forests (Leblond,
2014). Consequently at least 55,000 people were displaced between 1986 and 2005 (ibid).
Forests that were once an abundant and easily accessible resource, perceived by villagers as
common land, are now legally protected by the government, used for commercial interests or
controlled by influential local landowners (Rigg, 1993). Consequently access to forest
resources, whose importance in the village economy has often been underplayed, has become
increasingly limited (Rigg, 1993). The rural population in Northeast Thailand consumes many
different species of non-domesticated plants, fungi and animals (Moreno-Black & Somansang,
2014). These wild foods, which constitute an important component of the diverse Thai diet,

10
are commonly gathered within the
agroecosystem (Photo 1) (Shirai &
Rambo, 2014). Since this cultural trait
appears to be resilient to urbanization
as demand for wild foods is growing in
urban centers, it opens up possible
livelihood alternatives for villagers
without farmland or employment
(ibid). Notwithstanding, access is often
restricted by the above mentioned
factors and permission from the RFD is
usually necessary to harvest non-
timber forest products (Ting et al.,
2010).
Within this socioeconomic,
environmental and political context we
investigate the interrelations between
rural Thai people and the forest.
According to Leblond (2010) many
cases of conservation induced displacement resulted from stricter forest protection and
reforestation policies implemented by the RFD during the 1980s and 90s. Such cases have
been reported especially for the Northeastern Isan region, but information on the history and
impacts of conservation induced displacement on rural livelihoods still remains anecdotal
(Leblond, 2010). Therefore our research focuses on the households of Ban Huai Nam Khem
(Moo 11) a village at the border of Thap Lan NP which experienced relocation. We will examine
how the relocation has changed the villagers’ use of natural resources with focus on forest-
based resources since this is one of the most important livelihood strategies in the village.
Furthermore we will discuss potential threats to this livelihood. First we investigate (1) how
the relocation has affected the villagers’ dependency on forest resources. We attempt to
reconstruct the historical background of the village and describe the types of forest resources
which are most important to the villagers. In addition we investigate which people rely most
on these resources and how important collecting is for their total income. We then examine
Photo 1: We often met boys using long bamboo poles with a plastic bag attached to the end to catch large cicadas in the village. The cicadas are fried and eaten.

11
(2) the state of the used forest and what it indicates about the future security of this livelihood
resource basis. Therefore we analyse soil parameters and describe succession states of the
forest. Finally we discuss (3) potential risks to the villagers’ forest-based livelihood strategies
and identify possible coping strategies.
Table 1: Research problem formulation and research questions (RQ).
Problem: How has the relocation of Moo 11 changed the villagers’ use of natural
resources and what are the potential threats to their new strategies?
RQ1: How has the relocation affected the villager’s dependency on forest resources?
RQ2: What does the state of the used forest indicate about the future security of this
livelihood resource basis?
RQ3: What are potential risks to the villagers’ forest-based livelihood strategies and
how do they deal with these risks?

12
2 Methods
In this chapter we present the methods that we applied in order to generate various kinds of
data and approach our research problem from different angles. We discuss the aim of each
method alongside with critical reflections and finally the dynamic in our research group.
2.1 Semi-structured Interviews
Semi-structured interviews (SSIs) are the main method we used to obtain contextual and
specific information concerning our research questions. SSIs are especially useful as open-
ended questions give room for changes in the themes and allowed us to explore different
aspects emerging from conversation with the informant (Brinkmann & Kvale, 2009).
We conducted a total of 34 SSIs with 26 informants during our field work. Seven informants
were interviewed more than once, as questions arose along the way or to clarify information.
A list giving the interview references and short information on all informants can be found in
Appendix I. Prior to each interview, we prepared a list of specific topics (Appendix II) we
wanted to address and a group member was appointed as the interviewer. The others kept
notes and supplied follow up-questions.
2.1.1 Reflections
Many of the villagers were to some extend inaccessible for interviews, because most of them
are working during the day. This left us with a bias in the selection of our respondents, since
people we interviewed during the day were usually old or without regular employment. We
tried to increase the representability of our sample by also interviewing on the weekend and
late in the afternoon. Another factor that influenced our sample was that in the beginning we
relied on being introduced to villagers by the headwoman. She possibly wanted to introduce
us to poor villagers and those who rely on forest resources empathizing the problem of land
scarcity they face.
Difficulties we faced during the SSIs were mainly due to linguistic and translational barriers.
After our first interviews with the interpreters we realized information can be lost along the
way. In our case this was especially apparent for information concerning our respondents’
attitude and emotions towards a topic. Scientific terms or concepts were sometimes hard for

13
the interpreters to translate. In addition, we regularly noticed that we did not receive the
whole answer given by the informant, but rather a summarized version. This was often the
case when the interpreters struggled with the linguistic barriers presented by local dialect.
Hence, the collected data may be biased to some extent.
Finally, we acknowledge the fact that there were times when the informants influenced the
flow of the interview, possibly overemphasizing the relocation and use of forest resources
after hearing about our research. This worked as an advantage by revealing a lot of data on
our topics of interest, but also as a disadvantage when we wanted to go into more depth with
another topic.
2.2 Surveys
2.2.1 Questionnaire
On arrival to the field and after our first interviews, we revised the original questionnaire
together with our interpreters. We had realized that some of the questions would be hard to
answer and not as useful as we initially thought. Therefore we constructed a simple
questionnaire to obtain demographic data as well as to get an overview on topics of specific
interest, such as collection from the forest, annual income and income from selling forest
products (Appendix III). In addition, the questionnaires were often useful to make first contact
and based on the answers in few cases we proceeded to SSIs.
After a pilot test with 5 respondents we modified details in some questions. Initially, most
questionnaires were filled in at the savings club meeting (04.03.17), to which the headwoman
invited us. Additional questionnaires were filled in during SSIs. In total we interviewed 28
villagers from zone 1 & zone 2.
2.2.2 School visit
We conducted a quick survey using show of hands with 17 kids from the 4th, 5th and 6th grade at
the village school to investigate the extent to which parents pass on their knowledge on
collection of forest resources.

14
2.2.3 Reflections
During the savings club meeting we acquired preliminary data with a relatively high number
of respondents in short time. The meeting was a nice opportunity for us to get in touch with
villagers which beforehand were inaccessible to us due to their working hours. However, the
selection of the respondents was biased to some degree as people present were mainly
members of the savings club and from zone 1. In addition, the way we filled the questionnaires
during the meeting might have affected our data. People were sitting in groups and their
answers could have been influenced by the others, as they possibly did not want to stand out.
The questionnaires filled in during our days in the village show the same weakness as
mentioned above for the SSIs.
When trying to analyse the questionnaire data (Appendix IV) we realized, that the last
question concerning the total annual income made by collecting from the forest was asked in
an inconvenient way. Unfortunately many who make an income which indirectly depends on
forest resources, like the broom makers or people who sell forest products in street stalls,
indicated that they had no earnings from the forest. This decreased the forest income in
relation to other incomes.
The survey conducted at the school could be biased because the children might be influenced
by each other, their teachers and the unusual presence of Europeans.
2.3 Transect walks
This type of tool is a walk around an area of interest, where villagers and project group
members talk about observed things (Chandra, 2010). In total we conducted 5 transect walks
(TW) for various reasons. Our informants and the specific topics are detailed in Table 2. We
used TW as a straightforward approach to see not only the two zones that experienced
relocation, but also to understand where and how people collect forest resources.
Additionally, we used the opportunity to choose sites for soil sampling. During all TW points
of possible interest were logged on the GPS.

15
Table 2: Informants & Topics from the Transect Walk
Informants Topics
1. Headwoman (Int. 1) o Spatial overview of zone 1
o Introduction to villagers
o Preliminary information on households
2. Headwoman’s Assistant (Int. 8) o Spatial overview of zone 2
o Introduction to villagers
o Preliminary information on households
3. Forest walk with guy from focus
group (Int. 19)
o Mushroom collection area
o Fruit collection area
o Information on forest use
4. Old grass lady (Int. 24) o Grass collection area
o Information on resource use
5. Dr. Duangchai & Dr. Chatchai o Specimen collection
o Landscape succession assessment
2.3.1 Reflections
The information recorded during the TW has to be considered as the subjective perspective
of individual informants. This became apparent when two group members discovered a part
of zone 1 on the last day that remained hidden during our TW with the headwoman and was
left out for the rest of our research period.
2.4 Focus group discussion
We conducted a focus group discussion (FGD) with six to ten villagers of both sexes and
different ages. FGD are useful to identify various types of group dynamics and facilitate an
open talk about key topics (Chandra, 2010). In our case concerning the collection of forest
resources. The aim of the focus group discussion was to identify important forest resources
and the way they are used (processing / sale or self-sufficiency). Additionally we asked for
collection periods, possible threats and changes to the availability and amount of the
resources over the years and how knowledge on collecting is shared between the villagers.
The focus group discussion was organized around a resource mapping during which villagers
collaborated to draw where different forest resources can be found, indicated by a specific

16
symbol. We asked them to include the village and significant landmarks such as the highway,
NP and RC.
2.4.1 Community meeting
On our last day, we presented our research and findings to about ten villagers of Moo 11, the
headwoman and her assistant at a community meeting. We took this opportunity to confirm
some of our data with them, creating a sort of focus group discussion.
2.4.2 Reflections
Interviewing several people at once made it easy to obtain a large amount of information in
relatively short time. However, detailed information which was mentioned during the
discussions amongst people was possibly lost. In addition, the dynamic of the focus group
might have affected the data, as some informants especially the younger ones did not express
their opinion to the same extent as older people. The FGD took place in an open room next to
the temple of the village. Many villagers were present, but not part of the FGD, which could
have influenced our informants’ answers. However, this also worked to our advantage, as
villagers that were present at the beginning of the FGD left and others took their place.
The discussion at the community meeting was mainly dominated by the headwoman, which
possibly biased the confirmation of our data. The discussion was also highly focused on the
findings we presented, thus limiting possible responses.
2.5 Botanical specimen collection
A list of Thai names of useful plants was made by the focus group informants. With the help
of Dr. Chathai a botanical taxonomist we were able to translate most Thai names and identify
the species (Appendix V). This approach can on its own not be considered as scientifically
sound and was hence backed up by collection of botanical specimens to ensure correct
botanical identification and scientific reproducibility.
2.6 Soil sampling
A total of 32 soil samples were taken at eight sites (Figure 2) in order to collect data that we
can use to support our observations on the state of the landscape surrounding Moo 11. At

17
each site we dug six holes and took samples from the top layer (0-30 cm). We mixed them in
a bucket, and took three replicas in addition to one bag of extra soil, from each site. All the
samples were taken back to Denmark. Consequently soil texture, water-holding capacity
(WHC), total Carbon (C) and Nitrogen (N) were analysed in the lab. The sites were first chosen
based on where the forest resources were collected. Afterwards more sites were chosen in
zone 1 and 2, because villagers talked about their soil being unproductive. This was also done
because there was a clear difference between the two zones usage of the area.
2.6.1 Reflections
All eight sites can be biased and not representative of the area in focus. For the first three
sites, we had to rely on our informants from the TW’s, to show us places people go to collect
forest resources. However, the sample cannot be considered representative as we only took
Figure 2: Soil sampling sites are depicted in relation to the two zones of Ban Huai Nam Khem. (Image was taken from Google Earth, 2017)

18
from one place and villagers have indicated several areas of resource collection. The rest of
the sites were chosen without any guidance. The area was new to us which does not make us
capable of assessing the best spot for taking the samples.
2.7 Group dynamics
The interdisciplinary work has been challenging throughout our research project. Different
educational backgrounds and preferences for different methods were many times an obstacle
in conducting our field work. Group discussions about different ways of interpreting the data
were often time consuming. However, academic differences also proved useful in gaining a
multifaceted perspective on our work.

19
3 Findings and Analysis
3.1 Research Location and Historical Background
This paragraph presents first hand findings as well as secondary data obtained from Sakaerat
Silvicultural Research Station (RC) or additionally found in the literature. It allows us to
describe the research location in its climatic, physical and ecological aspects. Particularly our
historical and social understanding of the village (Ban) Huai Nam Khem (Moo 11) and the
surrounding forest, which are also presented here, form the background for the interpretation
of our further observations.
Moo 11 is situated at the Northern border of Thap Lan NP (Figure 3) in Wang Nam Khiao
district, Nakhon Ratchasima Province, which is part of one of the poorest areas in Thailand
(Moreno-Black & Somnasang, 2010). The NP, outlined in red on the map was established in
December 1981 (Phanurak, 2012).
Figure 3: The Map shows the area of Thap Lan National Park divided into different Land Use and Land Cover categories as identified by Phanurak (2012) for the year 2000. The black arrow indicates the location of the Ban Huai Nam Khem (Moo 11) where our research will take place.
Moo 11
*

20
3.1.1 Climate
In general the area is known for its pleasantly cool and humid climate which is created by the
forested hills that catch and hold moisture. Characteristic are three distinct monsoonal
seasons (Phanurak, 2012). We conducted our research in March, in the middle of the hot
season (mid-February to mid-May) during which highest temperatures of the year reach 37°C
(Appendix VI). It is followed by the rainy season from mid-May to mid-October with high
seasonal rainfall of up to 303.2 mm in September (ibid.). The year ends with a four month cold
and dry period from November to February reaching minimum annual temperatures of 8°C in
January (Appendix VI).
3.1.2 Land use and land cover change
In 2000, the Royal Forest Department
classified four forest types in Thap Lan NP: dry
evergreen, mixed deciduous, dry dipterocarp,
and bamboo forest (Phanurak, 2012). The
vicinity of the study site (Figure 3) was covered
with dry evergreen forest until the 1960s
(Appendix VI). The forest was then encroached
by local people, who converted it into
Photo 2: This photo shows the hills around Ban Huai Nam Khem deforested and with tall grass as the only soil cover (recorded by Sakaerat Silvicultural Research Station in 1985).
1982 2002
Figure 4: The autophotos provided by Sakaerat Silvicultural Research Station show the rapid increase of forest cover in the area of Ban Huai Nam Khem following the reforestation efforts which started in 1982.
21
farmland for cash crop production (Appendix VI). According to the head and second head of
RC most of the land was subsequently abandoned and found covered with tall grasses, such
as Saccharum spontaneum (Photo 2), when the RC was established in 1982 (Int. 7; Int. 9; RC
document). The results of the RCs’ reforestation efforts in the area are illustrated by Figure 4
3.1.3 Conservation induced displacement
The state-planned conservation
efforts, namely the RC and NP, on
both sides of the current location of
Moo 11 had a major impact on
people’s access to land and
consequently their livelihood
strategies.
The first village by the name of Ban
Huai Nam Khem was made up of
approximately 100 farming
households and located in the area
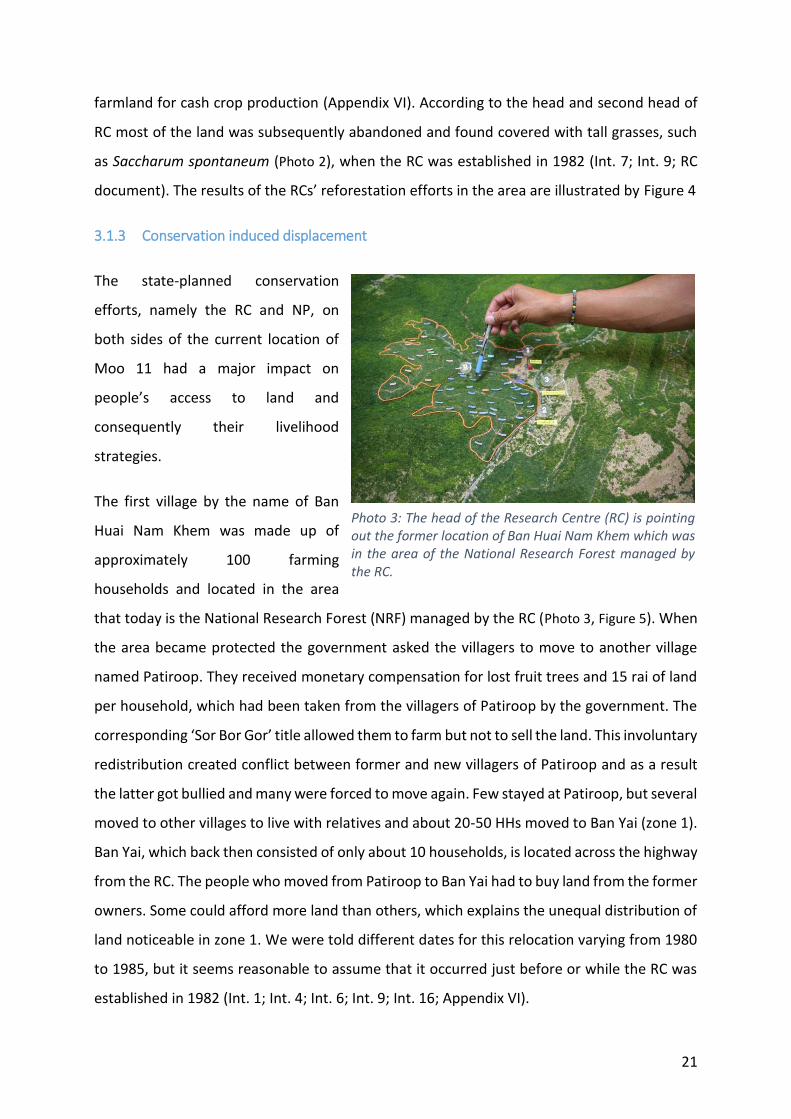
that today is the National Research Forest (NRF) managed by the RC (Photo 3, Figure 5). When
the area became protected the government asked the villagers to move to another village
named Patiroop. They received monetary compensation for lost fruit trees and 15 rai of land
per household, which had been taken from the villagers of Patiroop by the government. The
corresponding ‘Sor Bor Gor’ title allowed them to farm but not to sell the land. This involuntary
redistribution created conflict between former and new villagers of Patiroop and as a result
the latter got bullied and many were forced to move again. Few stayed at Patiroop, but several
moved to other villages to live with relatives and about 20-50 HHs moved to Ban Yai (zone 1).
Ban Yai, which back then consisted of only about 10 households, is located across the highway
from the RC. The people who moved from Patiroop to Ban Yai had to buy land from the former
owners. Some could afford more land than others, which explains the unequal distribution of
land noticeable in zone 1. We were told different dates for this relocation varying from 1980
to 1985, but it seems reasonable to assume that it occurred just before or while the RC was
established in 1982 (Int. 1; Int. 4; Int. 6; Int. 9; Int. 16; Appendix VI).
Photo 3: The head of the Research Centre (RC) is pointing out the former location of Ban Huai Nam Khem which was in the area of the National Research Forest managed by the RC.

22
Since the establishment of Thap Lan NP in 1981 several expansions of the known boundaries
have taken place (eg. 2002 and 2016). For this reason another village by the name of Nhong
Phue, consisting of 18 households who were farming maize and manioc on the hill-top across
the highway from the RC (Figure 5), had to move. According to our informants the relocation
occurred sometime between 1991 and 2002, but it appears to be linked to and therefore likely
occurred prior to the 2002 NP-expansion (Int. 1; Int. 4; Int. 7; Int. 21; Int. 28). For compensation
the displaced households received 1.2 rai at the location of today’s Ban Mai (zone 2) which
was partly cultivated before; 0.2 rai for living and 1 rai for farming respectively (Int. 1; Int. 8).
The uncertainty about the relocation dates could result from difficulties to remember events
which lie far in the past, or from the fact that people really moved in different years. Another
explanation could be that the year does not really concern them, as they possibly experienced
the relocation as something that one cannot influence and simply has to adapt to.
3.1.4 Today’s village and it’s people
The turbulent history of Moo 11 is reflected in its multifaceted social and physical structure as
well as in the distribution of land among villagers. Today Moo 11 consists of five separate
Figure 5: Relocation Map showing highway 304 which separates the Research Centre (RC) and the two zones of today’s Ban Huai Nam Khem where our research was conducted. The villagers of the old village of Ban Huai Nam Khem were first relocated to Patiroop and many households then moved back to Ban Yai (zone 1) between1980 and 1985. The 18 households of Nhong Phue were moved to Ban Yai (zone 2) in between 1991 and 2002. (Image was taken from Google Earth, 2017)

23
zones spread out for 8 km along the 304 highway. In our research, only the two zones that
experienced relocation (zone 1 & zone 2) were investigated.
According to Udom Sap sub-district office, 226 HHs and 556 people are officially registered in
Moo 11 (Int. 4). However, the headwoman informed us that only approximately 100
households are inhabited, housing around 250 people (Int. 1). All land in zone 1 and zone 2
has the official title ‘Por Bor Tor 5’, which makes it illegal to sell the land. This factually
immobilizes the villagers’ capital, binding them to the village. In consequence many houses
are abandoned by people who manage to raise the necessary financial resources and moved
to cities for work or to live with family. Those who stay either work at the RC or have other
jobs, such as farming or selling things. Many, especially those who work as seasonal laborers
make an additional income by collecting forest resources (Appendix IV).
3.2 Authorities and Moo 11
The relocation involved different authorities like the RC, NP, sub-district, government and the
head of the villages at the time. The interrelation between these authorities is quite complex
and it is hard to define the responsibilities of each institution.
Moo 11 does not have much land and only some have a small garden to grow fruits and
vegetables that they according to the RC can only use for their own consumption (Int. 9). Many
people base a part of their livelihoods on collecting forest resources even though it, according
to NP law, is prohibited. However regional authorities accept that the villagers collect
particular forest resources, and they can relatively freely use the forest as long as they do not
cut the trees or hunt (Int. 1; Int. 4; Int. 7; Int. 9). However it is not possible to get an official
permit to collect since this would be against regulations of the protected areas (Int. 4; Int. 9).
3.2.1 No authority takes responsibility for the villagers
It is difficult to determine which authorities are involved in deciding the rights and restrictions
of Moo 11. The subdistrict office says they are only in charge of utilities and can accordingly
not do much about the villagers’ situation (Int. 4). The NP seems to be the most powerful
institution when it comes to the faith of Moo 11, since it can claim any land as protected area
and thereby put it under its regulation (National Park Act 1961). The villagers’ land title ‘Por
Bor Tor 5’ reflects this, as it means their land officially belongs to the park and can only be

24
used for housing. This also means that they are not officially allowed to sell the produce they
grow. The interviews gives us the impression that the park is not much bothered with the
villagers except when someone breaks the unofficial agreement by illegally logging or hunting
(Int. 1; Int. 4; Int. 6; Int. 19). The RC officials seem to have a similar mindset, stating that the
villagers are not their concern, but rather of the subdistrict office (Int. 9). It appears that no
authority is both capable and willing to secure the villagers’ right to collect forest resources
and sell things from their land. The villager’s interests are simply overshadowed by the
reforestation project. It is problematized further by lack of cooperation between different
institutions which is exemplified by the disagreement about how the relocation took place
and confusion about the NP boundaries (Int. 1; Int. 5; Int. 6; Int. 8; Int. 33). One of the last days
of the fieldwork the road department suddenly comes into the picture, when we interview
some women selling brooms and fruits by the road (Int. 32; Int. 33). According to them all
villagers have been given permission to grow and sell stuff from their gardens by the road
department, something other authorities so far have said was illegal. This is a good image of
the confusing complexity of institutions not talking to each other, and in this case even making
contradicting rules.
3.2.2 Gap between law and practice
Instead of operating within the official law, which is not always clear or enforced, the villagers
operate within what is tolerated in practice. People are aware of what is accepted and what
is not, despite the lack of written rules. A few days after having interviewed an old lady, we
discovered that she was taking care of a manioc field near her house in zone 1 (Int. 14). When
we went back to ask more into it she was reluctant to talk about it and said she was just taking
care of it for a relative to get some exercise (ibid). According to her she did it herself and
neither used chemicals nor weeded it, something the large and nicely tended field
contradicted. It seems that cultivating a field went beyond the limits of how far the rules could
be bended and was not something you would tell some outsiders about (Int. 13). Another case
of a person knowing, that the boundaries of the acceptable were crossed, was the charcoal
guy, a seemingly very poor and marginalized old man living in the outskirts of zone 1. It seems
quite likely that he cut eucalyptus trees growing in the forest close to his house to make
charcoal, though when asked if he ever collected something from the forest he very
defensively answered that he never went into the forest because this was not allowed at all

25
(Int. 11). His daughter being a broom maker collecting grass from the forest (Int. 15), he must
have known that going into the forest was accepted. Furthermore, he has a snare and net lying
on his roof, which indicate that he hunts in the area. The charcoal guy knew he was
overstepping the line of what was tolerated and therefore his livelihood strategy was not
something he could talk openly about. Instead he denied it by completely rejecting using the
forest as well as giving contradicting and evasive responses when asked about the charcoal
business (Int. 11; Int. 12).
Despite the official rules, prohibiting the villagers to collect forest resources and sell produce
from their garden, not being acted out in practice, they do compose a risk to the villagers’
livelihood strategies. The villagers are very dependent on keeping good relations with the NP,
RFD and RC (Int. 1; Int. 2; Int. 4). These relations can be threatened if villagers do not stick to
the unwritten agreement by logging or hunting as the RC mentions (int. 7). Changes in the
political environment could also pose a threat since a new head of the NP or RC might not be
as accepting to the deal (Int. 36). The unpredictability and autonomy of the NP seems to create
some uncertainty about the future since the villagers and the headwoman anticipate another
relocation (Int. 2). The subdistrict also expects the NP to continue to expand and move the
border further into people’s lands (Int. 5). If the unofficial permission to collect from the forest
is withdrawn it would be fully according to the law and give the villagers no rights for
compensation. The legal base of the forest resource dependent villagers’ livelihoods does
therefore seem quite unstable.
3.2.3 Considerations
The people that have the loudest voice and seem quite well off like the headwoman, the
shopkeeper and the forest collector, we did the TW with, are those who seem most concerned
about the future and possibility of another relocation or lack of official permit (Int. 1; Int. 2;
Int. 16; Int. 19). However the people most vulnerable to changes in accessibility of the forest
resources, mostly the people who seem poorer, do not mention the problem as much (Int. 11;
Int. 15; Int. 25). This could be because they lack the social and cultural resources to protest or
perhaps it is not an issue at all for them. We believe it makes sense to listen to those who
might have a bigger overview of the situation, but we also have to be careful not to have
certain people’s opinions take up too much of our analysis. Especially the headwoman seems
to stress the unfairness in the villager’s situation in her agenda to get more land for the

26
villagers. It was not
until the last day that
we realized zone 1
was a lot larger than
what we saw when
the headwoman
showed us around.
She only showed the
part of the zone with
the houses which
were in the worst
state (Photo 4). This
might be intentional, so that the people we talked to from zone 1 only were the people, who
actually use the forest, but nonetheless promotes a particular image of the village.
There might have been a misunderstanding in relation to the road department giving people
permission to sell things from the garden. Something might have gone wrong in the translation
or the women misunderstood the question. It seems more likely that the road department
just gave them permission to sell by the road, not caring where the products came from.
However several women told us that it was not just the selling by the road that the department
had allowed, but also selling from their houses. It could be that the women, since they had
been given permission to sell by the road, just interpreted this as a general permission to sell
from their gardens.
3.3 The Use of Forest Resources
As discussed in the previous chapter the rules and boundaries in Moo 11 regarding the
collection of forest products are far from clear. This has in the past often created conflict
between institutions concerned with conservation and the local people who are economically
dependent on the forest (Leblond, 2010). Therefore we investigate the importance of forest
resources for Moo 11 analysing data from SSIs, the FGD and resource mapping exercise. We
were able to compile a list of different species (Appendix V) of plants and mushrooms that
were indicated by the villagers as useful (Int. 38). They also identified the economically most
Photo 4: This pictures shows one of the poorest households we encountered in zone 1 of Moo 11.

27
important species,
corresponding collection
periods and whether it is
allowed to collect them
or not. Our findings on
important forest plant
resources including the
utilized plant parts are
presented in Table 3. Out
of 28 questionnaire
respondents 18 say they
collect forest resources
and 17 generate income
by selling or processing them which underpins the economic relevance of this activity. The
most commonly mentioned and apparently most important resources were mushrooms and
bamboo shoots (Appendix IV).
Table 3: This table presents collection period and utilized parts for plants indicated as economically important and allowed for collection by the villagers. The botanical species were derived from their Thai names and had to be validated by identification of collected specimens or photos (Appendix V). The asterisk (*) indicates species where this was impossible.
ECONOMICALLY IMPORTANT PLANT SPECIES
Name: Species: Family: Collection
period: Utilized part:
Bamboo - * Poaceae July – Oct. Shoot
Satoh Parkia speciosa Fabaceae April – June Seedpod
Rambutan Nephelium lappaceum* Sapindaceae ? Fruit
Litchi Litchi sinensis Sapindaceae April – June Fruit
Broom-grass Saccharum spontaneum Poacea Oct. – Dec. Inflorescence
Broom-grass Thysanolaena latifolia Poacea mid. Dec. – Feb. Inflorescence
Table 4 shows the amount of different types of mushrooms collected on NRF land in 2016
including prices at the street stalls along the highway. Mushrooms are very important as they
are collected by 16 out of 18 people who stated to use forest resources (Appendix IV).
Photo 5: On a transect walk the old grass lady shows us where and how to harvest the late type of broom grass (Thysanolaena latifolia). The collected inflorescences are visible beside her.

28
Table 4: The total amount collected on NRF land by villagers for different types of mushrooms was recorded in the year 2016. Species names are unconfirmed translations from Thai terms. Prices were indicated by street stall sellers. According to them the value of ‘Hed ra-ngoke’ varies significantly depending on precipitation and its availability.
The fruits of Rambutan
and Litchi and the
immature seedpods of
Satoh are sold fresh.
Because their season lasts
for three months (Table 3),
they generate income
only for a relatively short
time. Bamboo shoots,
which are harvested for
three month during the
rainy season (Table 3), on
the other hand are conserved by boiling or pickling (Int. 22) to extend the period of income
generation (Photo 8). The early broom grass can be collected from October until December
and is followed by the late variety which can be collected until February (Table 3). Photos 5 to
8 show the different steps involved in making and selling the brooms. This work is generally
ECONOMICALLY IMPORTANT MUSHROOM SPECIES
Thai name: Species: Family: Amount
collected (kg): Price
(TBH / kg):
Hed khom Boletus griseipurpureus
Boletaceae 747.5 -
Hed ruam - - 114.3 60
Hed pluak Termitomyces fuliginosus
Lyophyllaceae 1.0 -
Hed takrai Russula delica Russulaceae 10.3 -
Hed khone Termitomyces spp. Lyophyllaceae 2.5 -
Hed phueng whan Boletus edulis Boletacea 1.0 -
Hed nahm mark Russula emetica Russulaceae 3.7 300
Hed ra-ngoke Amanita hemibapha
Amanitaceae 15.9 60 / 280 -
300
Hed kra-ti - - 1.0 -
Hed pos Astraeus hygrometricus
Diplocystaceae 270.2 -
Hed than Russula densfolia Russulaceae - 60
Photo 6: After the harvest the dried inflorescences are rubbed on a rough surface to remove the husks and seeds, then cut to length and put away for storage.

29
done by women in times
when no other labour is
available and brooms are
sold for around 50 TBH a
piece throughout the
year, most during
weekends and public
holidays (Int. 22; Int. 24).
Mushrooms are
commonly available
throughout the rainy
season from May until
November. The most
collected species in the
NRF area in 2016 were
Hed khom, Hed ruam and
Hed pos (Table 4). Prices
of valued species are
higher and some vary
depending on their
abundance (Table 4). A
successful collector can
make up to 5000 TBH a
day during the season
(Int. 19).
The resource map (Figure
6) shows where the villagers find different forest resources. Interestingly they mentioned that
changes of the environment affected the availability of two important resources, mushrooms
and grass, around the village, so they now have to go further to find them (Int. 38). During the
TWs we realized that different types of vegetation are linked with certain resources. The
broom grasses only occurs in open areas (Photo 9; Int. 25), while mushrooms grow best under
native tree species (e.g. Hopea odorata, Dipterocarpus alatus) (Int.19). Litchi, Rambutan and
Photo 7: Here we see one of our informants at work in front of her house. The brooms are made from previously prepared grass bundles and young bamboo sticks.
Photo 8: In most cases the broom makers sell the finished product to a street stall owner who then sell it to Thai tourists as a local speciality. At the far right end of the stall the pickled bamboo shoots are visible in jar, while the boiled ones are hanging in plastic bags from the roof.

30
Satoh are collected in
native forest that grew
up around the former
location of Nhong Phue
(Int. 19) and bamboo
grows well in heavily
disturbed forest areas
(Photo 10; Gardner et al.,
2007; Int. 25). This is in
line with the findings
from the resource
mapping, since changes
in the type, extent, or
succession state of the
re-growing forest affects
the availability of certain
resources.
Our findings reveal the
most important forest
resources collected by
the villagers as well as a
seasonal variation in the
dependency on these
resources. We also found
that resources are
influenced by environmental factors and they particularly occur alongside specific vegetation
types. This connection will be further explored in the next chapter.
Photo 9: The area below the powerline is frequently cleared so that the late broom grass (Thysanolaena latifolia) dominates over forest vegetation which is suppressing it elsewhere.
Photo 10: A view from Saladdai cliff overlooking a bamboo forest where villagers collect bamboo shoots. This type of forest indicates that the area was deforested until recently and only became protected within the last 30 years, since the native forest is only starting to re-grow.

31
Figure 6: This resource map was created by villagers who collect resources from the forest. Symbols indicate the five most important resources (mushrooms, bamboo shoots, broom grass, Satoh and Litchi). The highway (route 304) separates the RC from Moo 11. Squares indicate the different zones of the village. And the headwoman’s house. Roads are indicated by to lines.

32
3.3.1 Considerations
With the help of Dr. Chatchai the botanical species names were derived from the Thai terms
listed during the FGD, who told us that this approach alone is not scientifically sound. To
ensure the validity and reproducibility of our identification botanical specimens or photos
were collected (Appendix V). For lack of time we were only able to do this for most of the
important species (Table 3). For the mushrooms species names were translated by our
interpreters who have no taxonomic expertise. Accordingly the given species names should
be treated as estimates.
3.4 State of the Forest
In this chapter there will
be given an overview of
the relation between the
state of the forest and
the availability of forest
resources. In the initial
phase of reforestation
fast growing tree species
such as Acacia mangium,
A. auriculiformis and
Eucalyptus camaldulensis
were planted to increase
nitrogen levels and soil organic matter. These trees use a lot of water, mature quickly and die
after 15-25 years, which we observed in much of the surrounding forest plantations (Photo
11). They are then replaced by native forest (Int. 9; Int. 19; Int. 37). As mentioned in chapter
3.3 the availability of some resources is influenced by the changing environment, especially
the forest.
In order to investigate how different stages of forest succession (grassland, acacia, secondary
native forest) are linked with the availability of important forest resources, we analyse soil
from different sites (2.6 Soil sampling). Soil analysis might give an indication of the conditions
of the area, and if the condition of the soil is supporting the growth of the resources. An
Photo 11: We observed that much of the Acacia forest plantations around Moo 11 was starting to die. It will then be replaced by native species.

33
overview of the soil analysis results is shown in Table 5. Total C and N gives an indication of soil
fertility, where WHC is related to plant available water.
Table 5: Different site names with the results from the soil analysis.
Site name Texture Water- holding capacity (%) Total C (%) Total N (%)
Grass Sandy clay loam 30,13 1,11 0,12
Acacia Silty clay 35,48 1,35 0,16
Zone 1 field Sandy clay 27,70 1,07 0,13
Zone 1 forest Silty clay loam 33,71 1,25 0,15
Zone 2 field Sandy clay loam 26,04 0,40 0,08
Zone 2 forest Sandy clay loam 30,69 1,07 0,17
Mushroom Silty clay 39,45 1,10 0,12
Fruit Clay loam 32,47 1,66 0,18
The most common soil texture found at sampling
sites is sandy clay loam (Table 5). This is in
compliance with the information stated in the RC
document. In sandy clay loam, sand is
dominating, which increases the necessity for
water input to the soil for healthy plant growth
(Petersen, 1994). Soil texture also influences
WHC (Zotarelli, Dukes, & Barreto, 2010) which
gives an indication of the field capacity for the
different sites (Table 5). A lower field capacity
indicates a lower amount of water available to
the plants (Petersen, 1994). In relation to Table 6
it appears that the sites’ WHC in general are
below the field capacity expected for the soil textures. Since the WHC in general is low the
plant available water in the soil is quickly depleted. In combination with precipitation being
unevenly distributed over the year (Figure 7) this renders the soils prone to drought.
The C and N content is closely linked to the fertility of the soil, and therefore may influence
growth of different species in the forest (Petersen, 1994). For all soil samples N was below the
detection line of the analysis, where measurements can be inaccurate. This means that N
Table 6: Field capacity for different soil texture (Decagon Devices, 2015).

34
values given in Figure 7 might be lower than the detected level. Furthermore C was only below
the detection line for Zone 2 field. A one-way ANOVA, which was conducted to determine
differences between the samples, indicates that there is a significant difference in both C and
N values between the sites. This is in line with the fact that the sites vary a lot in surrounding
conditions and land use. For all samples there are however generally low contents of C and N,
which indicate a low fertility of the soil (Evert & Eichhorn, 2013; Petersen, 1994).
It appears that C and N values increase as a result of the succession to native forest (Table 6).
Grass with lowest C and N values represents the area before reforestation. The Acacia
plantations possibly increase soil N and C, which seems to drops a little when native species
are introduced after this type of forest dies. The Fruit area likely has the highest C and N values
because it was never completely deforested and native forest regrew since the relocation of
Nhong Phue. This likely explains the higher organic matter in the soil and hence the fertility.
3.4.1 Impacts on forest resource availability
As mentioned in chapter 3.3 the state of the forest has an influence on the forest resources
available to the villagers. A threat that was often mentioned is water scarcity (Int. 10; Int. 19;
Int. 24; Int. 38). As shown in Figure 7, precipitation is not evenly distributed over the year
which in combination with low WHC possibly increases the risk of drought. Five years ago
there was a big drought, which significantly decreased the amount of resources available (Int.
37). As shown in Figure 8 all resources are influenced by drought.
Figure 7: Overview of temperature and precipitation measurements at Sakaerat Silvicultural Research Station in 2016 (Appendix VI).

35
Close to the village acacia forest been planted, which suppresses the broom grass and limits
the amount of mushrooms that can be found because the trees reduce the water availability
(Int. 19). The villagers also stated this effect of the acacia forest plantations for all other
important resources (Figure 8). We observed that much of the acacia forest that was planted
in the area 20 to 30 years ago is dying and consequently turned into native forest. This could
be an improvement for the villagers as mushrooms, Litchi and Satoh grow well in this type of
forest and their availability will likely increase (Figure 8). Although the grass will permanently
be suppressed by the reforestation efforts (Int. 9) in the villages surrounding as it cannot
compete with the dense forest (Figure 8). When we presented our finding at the village
meeting and proposed that overuse might potentially affect the availability of mushrooms
they disagreed (Figure 8).
Overall it seems as if the increase in forest area might change the availability of the resources.
Bamboo and grass for example rely on conditions that were present before the NP was
established (see chapter 3.1). This might be because most villagers gained knowledge about
the resources from their parents, who lived in the area before the reforestation (Int. 10; Int.
Figure 8: The symbols indicate the 5 most important resources for the villagers (mushrooms, bamboo shoots, Satoh, Litchi, broom grass). On the left the following threats are listed from top to bottom: drought, increase of acacia forest, increase of native forest, reforestation and lastly overuse of resources. This table was validated by the villagers at the community meeting (Int. 35), whereas data for the table was collected during interviews.

36
15; Int. 26). This means that some of the forest resources aren’t actually related to the current
forest, but to the landscape before the reforestation and therefore likely to become less
abundant.
3.4.2 Considerations
The threats in this chapter are based on the villagers’ current knowledge about the growth
conditions for the resources, which are then set in relation to the changes in forest area in the
future. Since they do not have complete knowledge about how changes in weather and forest
growth conditions may influence the resources, there is an uncertainty related to the future
availability.
The determination of soil texture has been based on a very subjective method, which may
have influenced the outcome of the analysis. The fact that the soil samples have been taken
from very different places makes them difficult to compare. They were influenced by not only
vegetation, but also slope and historic land use. The results can therefore be very biased. In
addition to this the results from analysis of WHC could have been strengthened by increasing
the sample size and also determining the wilting point. By doing so it would have been possible
to determine the actual amount of plant available water.
The soil samples cannot on their own give a complete indication of the state of the forest. It
was the idea that soil samples should be compared with the growth conditions of important
resources. However it was not possible to get this information for the species, which in the
end has influenced the use of the soil samples in the project
3.5 Perception of the Forest
3.5.1 Importance of the forest
The importance of the forest has been stressed by the villagers and authorities throughout
our stay in Moo 11. Our first interview was with the headwoman, and we started off by
introducing ourselves as students investigating use of natural resources. Before we asked any
questions, she began a long talk about the villagers’ lack of land, their great dependence on
the forest and their difficulties with getting an official right to collect (Int. 1). The villager’s use
of the forest was obviously something she was very passionate about and we experienced for
the rest of the fieldwork that most people, as soon as we mentioned natural resources, were

37
quite eager to talk about how important the forest was to them,, an impression that was
confirmed at the community meeting (Int. 36). So the forest is undeniably important to many
of the villagers in Moo 11, however exactly why this is, is more ambiguous.
3.5.2 Forest dependency
Many of the villagers including the headwoman say that the forest is their way of surviving
(Int. 1; Int. 13; Int. 15; Int. 24). As one villager puts it: “If I can’t have access to the forest, I will
die” (Int. 28). Furthermore the assistant of the headwoman claims that around 70 % of the
villagers are dependent on the forest as their main income, which at first gives the image that
forest resources are crucial for most of the villagers’ livelihoods (Int. 8). However, looking at
our questionnaire and digging into how important the forest resources are as a source of
income, we see that the villagers might not be as dependent on the forest as they express, at
least not economically. Comparing forest income with total income data from our
questionnaire shows that the forest resources only make up a smaller fraction of the
respondents’ income (Figure 9). On the other hand, as discussed in chapter 2.2.1, more people
generate income from the forest than our questionnaire was able to capture.
It is apparent here and confirmed in our interviews as well that the poorer people are the
most dependent on the forest resources. Yet even for those most dependent, the forest
income generally does not make up more than half of their total income (Figure 9). For the
many people who collect in addition to their regular employment, the contribution to their
Figure 9: Annual income for 25 respondents from questionnaire. Some people are more dependent on the forest than others. First respondent has the highest dependency and doesn’t have a high income, whereas villagers with high income doesn’t use the forest very much.

38
income is even less. The shopkeeper, for example, has what seems to be a quite successful
business with a continuous flow of customers, but he still collects and sells mushrooms (Int.
16). Many people also just collect things for their own use. At the school visit we found that 9
out of the 17 children’s parents, who all collect from the forest, only did so for domestic use
(Int. 34). Since it is not a crucial source of income for all villagers of Moo 11, the value of the
forest cannot only be accounted for in economic terms.
Dependency on the forest appears to be a question of village identity. Being dependent on
the forest seems to unite Moo 11 in a way and several informants mention that they have to
stick together and help each other collect, now that they have no land (Int. 1; Int. 24; Int. 19).
They thereby directly link the dependency on forest resources to the relocation. Many of the
villagers used to be farmers before the relocation and the constant mentioning of land scarcity
when we ask about forest resource use (Int. 1; Int. 13; Int. 16; Int. 21), indicates that for some
collection of forest resources is a way to substitute farming and to hold on to the use of
natural resources. Furthermore, stressing their dependence could be seen as a justification
for the collection practice, as well as an argument for an official collection permit.
3.5.3 Considerations
The way we have distinguished between poor villagers and those better-off in the interview is
based mainly on indicators like the clothes they are wearing, the house they live in and their
job. The disadvantage of this approach is that it is not as accurate as using income and based
on a more subjective perception of what constitutes wealth. However, since there was a very
obvious difference in for example how nice and big the house of a person working at the RC
was, compared to a broom maker, we believe it to be a decent indicator. Furthermore, people
might not be very accurate in determining their incomes especially those where it varies a lot
throughout the year along with the availability of forest resources and labour jobs.
To emphasise their dependency on forest resources people may say that they earn more
money from collecting than they actually do. Another possibility is that we underestimate the
economical relevance of forest resources since people were sometimes unable to estimate
their income from this activity. Another issue is that some people who make an income from
processing forest resources or selling them at the street stalls did not state a forest income
because of the way we asked this question in the questionnaire.

39
3.6 Strategies
Above several threats to the villagers' forest resource based livelihoods such as the
uncertainty about rules and borders, the perceived increase of drought and the reforestation
have been discussed. In this chapter we have identified the most important strategies that
help the villagers cope with these factors.
Many villagers help each other and share their knowledge about forest resources. They do this
because they feel they have to stick together under tough circumstances (Int. 1; Int. 8; Int. 19;
Int. 24). The older people help each other by sharing knowledge about the resources and the
younger people help collect forest resources for elderly (Int. 13; Int. 27). However it is not
everyone who wants to be, or perhaps can be part of this social network. The broom lady for
example is not interacting with the other villagers and has a very limited social network,
rendering her more vulnerable to possible changes (Int. 15). Instead she perceives a
competition between the villagers over the available resources, and will not share her
knowledge about where she goes. Other villagers, on the other hand, are very open about
where they collect (Int. 19; Int. 25). So the villagers do stick together and help each other but
it is restricted to a certain social network.
The headwoman has also started various clubs in the village (Int. 3). One of these clubs is the
savings club, of which the majority of villagers are members. The savings club creates an
economic safety net for the villagers. They can borrow money from the club at a lower interest
rate (2%) than from the banks (Int. 1). By allowing villagers to circulate their loans from one
club to another this system increases the liquidity in the village and solves the problem of debt
mentioned by the headwoman (Int. 3). For poor villagers this is the only way to sustain their
family in times when no labour and no forest resources are available (Int. 15).
Another way the villagers deal with their relatively difficult living conditions is by efficiently
utilizing the resources available. For example villagers grow fruits and vegetables on whatever
land they have available (Photo 12) and sell products they cannot eat (Int. 10). Some of the
villagers state that if they were not able to grow food in their garden, they would not be able
to keep up their living conditions (Int. 28). Some villagers also grow Satoh and bamboo in their
gardens (Appendix V), as a supplement to forest collection (Int. 21). For some resources this
appears to be a useful strategy if the availability in the forest should decrease.

40
Another strategy we have
identified is bending the rules
in favor of the villagers’
interest. As shown earlier,
some of the villagers utilize the
resources available even
though it might not be
allowed, like the old lady with
the cassava field (Int. 14).
Other examples of bending the
rules are the fancy vest guy
who “gave himself permission” to grow a banana plantation and selling the products, the
charcoal guy who is hunting and possibly cutting trees in the forest and people buying and
selling pieces of land, even though the land title does not permit it (Int. 1; Int. 12; Int. 23).
Knowing the right people seems to be important in order to bend the rules. The fancy vest guy
did not have to hide his plantation in any way, possibly because of his friendship with a local
police officer. To what extent you can bend the rules also depends on the specific rule. The
charcoal guy was seemingly very paranoid about his activities which makes sense since cutting
trees and hunting has been mentioned as the two things that are in no way accepted by the
NP.
A way the villagers adapt to the mentioned insecurities is by diversifying their livelihoods. As
shown in chapter 3.5, no villagers solely depend on forest resources. The ones that collect
from the forest also take day to day labour jobs, resell trash found by the road, fix broken
things and so on. Many also go to other villages or even provinces to work for periods of time.
All in all this decreases the dependency on forest resources.
3.6.1 Considerations
As we discussed in chapter 3.2 the official rules and restrictions regarding the villagers are not
very clear and there could therefore be some implications saying the villagers bend the rules
as a strategy. Given the relative character of law in the area where rules are not always clear
and not always being enforced, people are most likely not always bending the rules
consciously, since the distinction between allowed and not allowed is difficult to determine.
Photo 12: This picture shows the herb garden of a family that appeared especially well kept and contained many different species.

41
4 Conclusion
In this project we investigated how the relocation of Moo 11 has changed the villager’s use of
natural resources and examined potential threats to this contribution to their livelihoods. The
relocations of Moo 11 was a complex process which was shaped by the incoherent action of
different institutions. Many of the villagers used to be farmers, but most now own only a small
parcel of land only to be used for housing. This means that some villagers find it necessary to
collect forest resources to sustain their livelihoods, thereby breaking the rules of protected
areas.
The forest can provide several resources but only some are unofficially accepted to be
collected. Economic considerations seem to be the primary reason for the choice of collected
forest resources, since those with a long season or storability are collected by most villagers.
Accordingly, different kinds of mushrooms, bamboo shoots, Satoh and grass for making
brooms are the most important forest resources. Although many people collect forest
resources, this activity only seem to have a crucial economic importance to people who are
unemployed and do seasonal labour. The villagers seem to promote an image of being more
forest dependent than they actually are. This might indicate a non-monetary value of the
forest to the villagers or be a way to justify breaking the rules of the national park and national
research forest. Several threats in relation to the lack of an official collection permit,
uncertainty of boundaries, rules about farming and the possibility of renewed displacement
are perceived by some villagers.
A changing environment with regards to drought and reforestation influences the availability
of forest resources. Some villagers complain about the fast growing, exotic trees, which are
planted in the first step of reforestation, are using a lot of water thereby decreasing water
availability limiting growth of important resources.
To reduce the potential impact of these threats the villagers developed different strategies.
They are aware of some of the changes in resource availability and help each other collect. A
strong social network helps them deal with insecurities concerning resources, because they
share knowledge about collection. Some villagers also grow some of the important resources
in their gardens, decreasing the dependency on the forest. Overall the villagers have

42
intensified their use of the forest after the relocation and they cope with the rules limiting
their resource availability, by bending them in their favor.

43
5 References
Brinkmann, S., & Kvale, S. (2009). InterView - Introduktion til et håndværk (2. udgave).
København: Hans Reitzels Forlag.
Chandra, G. (2010). Participatory Rural Appraisal. Issues and Tools for Social Science
Research in Inland Fisheries, 163, 286–302.
Decagon Devices. (2015). Plant available water. Retrieved March 29, 2017, from
https://www.decagon.com/en/support/how-do-i-determine-field-capacity/
Dinnes, D. L., Karlen, D. L., Jaynes, D. B., Kaspar, T. C., Hatfield, J. L., Colvin, T. S., &
Cambardella, C. A. (2002). Nitrogen Management Strategies to Reduce Nitrate Leaching
in Tile-Drained Midwestern Soils. Agron, 94, 153–171.
Evert, R. F., & Eichhorn, S. E. (2013). Raven Biology of Plants (8th ed.). W. H. Freeman.
Gardner, S., Sidisunthorn, P., Anusarnsunthorn, V. (2007). A Field Guide to Forest Trees of
Northern Thailand. Bangkok.
Guellete, G., Singto, S. (2015). Effects of Urban Expansion and Cultural Hierarchies on Labor
Strategies within Thailand’s Rural‐Urban Interface. Journal of Population and Social
Studies, 23, 146-167. DOI: 10.14456/jpss.2015.11
Leblond, J. P. (2010) Population Displacement and Forest Management in Thailand. ChATSEA
Working Papers. Montreal, Canada.
Leblond, J. F. (2014). Thai Forest Debates and the Unequal Appropriation of Spatial
Knowledge Tools. Conservation and Society 12, 425-436. DOI: 10.4103/0972-
4923.155588
Leturque, H., Wiggins, S. (2010) Thailand’s progress in agriculture: Transition and sustained
productivity growth. Overseas Development Institute. London, United Kingdom.

44
Moreno-Black, G., Somnasang, P. (2010) In times of plenty and times of scarcity:
Nondomesticated food in northeastern Thailand. Ecology of Food and Nutrition, 38,
563-586. DOI: 10.1080/03670244.2000.9991597
Petersen, L. (1994). Grundtræk af Jordbundslæren (4th ed.). Jordbrugsforlaget.
Phanurak, W. (2012). The Assessment of Land Use Change and Forest Carbon Sequestration
at Thap Lan National Park. PhD Thesis, Suranaree University of Technology.
Rigg, J. (1993). Forests and Farmers, Land and Livelihoods, Changing Resource Realities in
Thailand. Global Ecology and Biogeography Letters, 3, 277-289.
Shirai, Y., Rambo, A. T. (2014) Urban Demand for Wild Foods in Northeast Thailand: A survey
of edible wild species sold in the Khon Kaen municipal market. Ethnobotany Research &
Applications, 12, 113-129.
Stevenson, F. J. (1994). Humus Chemistry (2nd ed.). John Wiley and sons.
Ting, Z., Haiyun, C., Shivakoti, G. P., Cochard, R., Homcha-aim, K. (2010). Revisit to
community forest in northeast of Thailand: changes in status and utilization. Environ
Dev Sustain, 13, 385-402. DOI: 10.1007/s10668-010-9267-3
Zotarelli, B. L., Dukes, M. D., & Barreto, T. P. (2010). Interpretation of Soil Moisture Content
to Determine Soil Field Capacity and Avoid Over Irrigation in Sandy Soils Using Soil
Moisture Measurements. IFAS Extension - University of Florida, 1, 1–4.

45
Appendix I – List of Informants
Number Description Age Zone / institution
Date of interview
Officials
1 Head-woman, first interview 45 Headwoman 02/03/17
2 Head-woman, second interview
11/03/17
3 Interview with head-woman after community meeting
12/03/17
4 Head of sub-district, first interview
Head of sub-district office
06/03/17
5 Head of sub-district, second interview
09/03/17
6 Head of research centre
Head of research centre
08/03/17
7 Head of research centre, second interview
09/03/17
8 Head assistant, middle-aged male
Assistant to headwoman
04/03/17
9 Second head of research centre, spoke english
Second head of research centre
07/03/17
Zone 1
10 Lady with egg business and big garden 46 1 08/03/17
11 Charcoal guy. Poor old man in the outskirts of zone 1 who makes charcoal.
First interview
- 1 04/03/17
12 Charcoal guy, second interview - 1 07/03/17
13 Old lady with blind husband - 1 04/03/17
14 Old lady with blind husband, second interview when we found out she was taking care of cassava field in zone 1
and we wanted details on that
- 1 07/03/17
15 Lady making brooms - 1 04/03/17
16 Shop owner, owns seemingly successful shop in zone one, angry about not
having any land
51 1 03/03/17
17 RC root cutter lady, lives in big nice house in zone 1
48 1 07/03/17
18 Vicious dogs man - 1 07/03/17
19 Forest walk with guy from focus group - 1 08/03/17
20 Wife of shop-owner - 1 09/03/17
Zone 2
21 Dog lady, grows bamboo and beans and work at the RC, first interview
- 2 04/03/17
22 Dog lady, grows bamboo and beans and work at the RC, second interview
- 2 09/03/17

46
23 Street stall lady 1 50 2 06/03/17
24 Fancy vest guy, guy we met at wedding who was dressed more extravagant
than the rest, owns a banana plantation in zone two
- 2 07/03/17
25 Old grass lady, we convinced her to take us out collecting grass, was relocated
from up the hill
76 2 07/03/17
26 Vicious dogs man - 2 07/03/17
27 Old lady who can’t count - 2 08/03/17
28 Young smiling woman 29 2 08/03/17
29 Very poor guy 46 2 08/03/17
30 Young pond guy 25 2 08/03/17
31 Sister of very poor guy 35 2 08/03/17
Other zones
32 Street stall lady 2 - ? 08/03/17
33 Street stall lady 3 - ? 08/03/17
34 Zone 3 lady 40 3 08/03/17
35 “Show of hands” interview with 17 kids at the school
09/03/17
36 Community meeting
1 & 2 12/03/17
37 Savings club meeting
1 & 2 05/03/17
38 Focus Group Discussion
1 & 2 05/03/17

47
Appendix II – SSI Topics
Informants from the SSIs:
1. Headwoman 2. Headwoman’s Assistant 3. Head of sub-district 4. Research Center officials 5. Villagers of Moo 11 6. Road Shops
1. Headwoman
Our first SSI was a preliminary interview with the Headwoman of Moo 11. The focus of the interview was to touch upon different topics related to our research, such as the relocation, overview of the villagers and their livelihoods, collection of natural resources from the villagers and their dependency on them, villagers land titles. This interview gave us the opportunity to assess early on whether our research questions were relevant or not.
In addition, we had another SSI with the Headwoman, the day before we leave. Our goal was to have a comprehensive interview assessing the accuracy of our findings, and double checking those we found along the way, like how the relocation took place, if the borders are clear to them and, compensation after the relocation.
Finally, we had the opportunity to have a short SSI with the Headwoman, on our last day, after the community meeting, in regards to the different clubs that exist in Moo 11.
2. Headwoman’s Assistant
A SSI with the Headwoman’s assistant followed the next days, while having a transect walk, in zone 2. The focus of this interview was the relocation and an overview of the second zone that was part of the relocation.
3. Sub-district Head
Initially, a SSI was conducted with the head of the sub-district office, to discuss about the relocation, and border issues that occur in the area. Subsequently, we had a second SSI, as few questions arose, in regards to the expansion of the National Park and changes in the borders.
4. Research Center Officials
A total of three SSIs were conducted with officials of the RC. Two with the head of the RC, who is also an officer at the Royal Forest Department, and one with the second head of the RC. Our objectives from these interviews were to obtain information on the relocation, the history of the RC and National Park, the reforestation, collection permit, and documents indicating the rainfall and temperature patterns.….

48
5. Villagers of Moo 11
SSI were conducted with villagers of the two zones, X in zone 1 and X in zone 2. The focus of these interviews was about the relocation, and how their life has been affected by it, the use of natural resources from the forest, in what extend they rely on these resources, alternative if they lose their access to the natural resources. Furthermore, one SSI was conducted with a villager from zone 3, to get an overview of the way people from zones that did not get relocated are living.
6. Road shops
We conducted three SSI with people that have shops by the road (304). It was an easy way for us to see which natural resources people sell and the prices.

49
Appendix III – Questionnaire
1. Name:___________________________________________________________________
2. Sex: Male □ Female □
3. Age:___________
4. The number of people in household:___________________________________________
5. In which zone do you live?
_______________________________________________
6. Has anyone from the household moved away for work? Yes □ No □
7. Which activities contribute to the food on the table? (Such as, job, gardening, etc.) ________________________________________________________________________
________________________________________________________________________
8. Do you collect anything from the forest? Yes □ No □
a. If yes, what do you collect? ______________________________________________________________
_____
9. Are you a member of a club? Yes □ No □
a. If yes, which club(s)?
i. Savings club □
ii. Broom club □
iii. Other club? □_______________________________________________________________
10. Do you grow something in your household? Yes □ No □ (Such as fruits,
vegetables, herbs) 11. How much do you earn pr. Year? ______________________________
12. How much money do you earn from stuff you collect from the forest? ________________________________
Project group fills out before handing out questionnaire Household no:___________ Date:_____________ Interpreter name:____________________________________________________ Group member name:_______________________________________________

50
Appendix IV – Questionnaire Results 1
nr. Name Sex Age Ppl. In
HH Zone
Moved away
Income sources
1 Sompam F 34 5 1 (behind headman Y collect forest, labor
2 Maam F 39 2 2 n labour
3 Rot M 73 4 2 n Gardener, sells fruit on street, pension
4 Somwang F 53 2 1 y RC, mushroom bamboo
5 Bian F 36 7 no zone y labour, selling vegetables
6 Prayong F 57 1 1 y sells broms bamboo along road
7 Sompang f 55 2 1 n RC
8 somjai f 33 4 1 y RC
9 yubol f 45 3 1 y government official, rents out guesthouse
10 tongploy f 47 2 1 n restaurant
11 suda f 37 7 1 n doesn’t work
12 prathoomthip (HW) f 44 2 1 n HW, gardening
13 sauhai m 70 6 1 (temple) n labour, pension
14 suprahn f 76 3 2 y brooms, fruits, pension
15 thang low m 71 3 2 y brooms, fruits, pension, collect old stuff by road (bottles)
16 noppart m 20 4 2 y collect forest, labor
17 mantia m 40 2 3 n sells broms, bamboo
18 nikhom m 30 4 2 n unemplyed (income is from before)
19 pramool m 57 4 2 n sell things in shop and on road (groceries + fruit)
20 parichat f 61 1 2 y sell broom + fruit, children send money,
21 kaew m 52 4 1 (near HW) n labour, collect forest

51
22 toy f 50 4 2 n faming, selling,
23 duendara f 56 3 1 y sells bamboo, brooms, stuff from garden, collect stuff by road,
24 gimnaree f 41 8 4 n sells bamboo, brooms, collect stuff by road
25 sittisak m 23 4 2 y restaurant, money from fathers brother, who moved away
26 pratoonthip f 30 7 4 (not really zone) n fixing car, sells food, collect forest, collect/buy old stuff
27 chan f 76 3 2 n money from childen, pension
28 hoy f 30 2 2 n labour, collect, make brooms
Appendix IV – Questionnaire Results 2
Collect forest
Types of stuff from forest Member of club?
Which clubs Grow in garden?
Income pr. Year Income
from forest (pr. Year)
y mushroom, vegetables, bamboo, n - y 48000 36000
y mushroom, y savings y 36000 0
n - n - y 44400 0
y mushroom, bamboo n - n 60000 6000
y fruit, bamboo, mushrooms, n - y hard to say 200-300 pr time
y bamboo y savings, million club? n no idea -
y mushroom, bamboo y savings y 36000 -
n - y savings n 216000 0
n - y savings, broom n 86400 0
n - y savings n 90000 0
n - y savings n 0 (husband 120000) 0
y mushrooms y savings, broom y 96000 16800

52
n - y savings y 48000 0
y grass, mushrooms, bamboo y savings y 24000 2400
y mushrooms n - y 24000 2400
y mushrooms, beans, labour y savings y 60000 24000
n - y savings n 120000 0
n - y savings n 96000 0
y mushroom, bean y savings y 40000 10000
y grass, mushroom y savings y 130000 (100000 from children) 5000
y bean, mushrooms, bamboo y savings n 60000 30000
n - n - y 100000 0
y mushrooms y savings y 50000 10000
y bamboo y savings y 50000 0
y mushrooms y savings y 180000 5000
y mushrooms y savings y 50000 30000
n - n - y 20000 0
y mushrooms, bamboo, grass n - y 40000 10000
Appendix IV – Questionnaire Results 3
HH number Date Interviewer
s Interprete
r
24 05. Mrz A M N
158 06. Mrz E E N
208 06. Mrz E E N
3 05. Mrz E E P

53
24 05. Mrz E E P
14 05. Mrz E E P
97 05. Mrz E E P
96 05. Mrz E E P
148 05. Mrz E E P
1 05. Mrz E E P
80 05. Mrz E E P
136/1 05. Mrz E E P
92 05. Mrz A M N
12 05. Mrz A M N
12 05. Mrz A M N
148 05. Mrz A M N
191 05. Mrz A M N
17 05. Mrz A M N
80 05. Mrz A M N
70 05. Mrz A M N
197 05. Mrz A M N
don’t remember 06. Mrz E E N
147 05. Mrz A M N
19 05. Mrz A M N
37/11 05. Mrz A M N
13 05. Mrz A M N
120 06. Mrz E E N
204 06. Mrz E E N

54
Appendix V – List of Useful Species
Species name: Family: Allowed: Important:
Mushrooms ! !
Tiliacora triandra Menispermaceae
Toddalia asiatica Rutaceae
Ficus foveolata Moraceae Cinnamomum spp. Lauraceae
Croton cascarilloides Euphorbiaceae
Myriopteron entensum Apocynaceae
Bamboo shoots Poaceae ! !
Elephantopus scaber Asteraceae
Parkia speciosa Fabaceae ! !
Musa acuminata Musaceae
Baccaureae ramiflora Phyllanthaceae
Magnifera caloneura Anacardiaceae !
Careya arborea Lecythiataceae
Melientha suavis Opiliaceae
Amorphophallus Araceae
-
Lasia spinosa Araceae Diaplazium esculentum Athyriaceae !
Passiflora foetida Passifloraceae
Syzygium gratum Myrtaceae !
- !
-
-
Dracaena loureirai Asparagaceae
Thunbergia laurifolia Acanthaceae
Eurycoma longifolia Simaroubaceae
Barleria lupulina Acanthaceae
Centotheca lappacea Poaceae

55
Glycyrrhiza glabra Fabaceae
Phyllanthus emblica Phyllanthaceae Andrographis paniculata Acanthaceae
Terminalia chebula Combretaceae
Averrhoa bilimbi Oxalidaceae
Mimosa pudica Fabaceae
Nephelium lappaceum Sapindaceae ! !
Litchi sinensis Sapindaceae ! !
Sandoricum koetjape Meliaceae
Dimocarpus longan Sapindaceae
Nephelium hypoleucum Sapindaceae
Senna siamea Fabaceae
-
Saccharum spontaneum Poaceae ! !
Thysanolaena latifolia Poaceae ! !
Photo 13: The Satoh tree (Prakia speciosa) can be found in most gardens of zone 2 as well as in the native forest which is regrowing between the old fruit trees of Nhong Phue.

56
Photo 2: The conspicuous leaves and inflorescence of Satoh (Parkia speciosa) identify it as a member of the Mimosaceae. The brown balls are immature inflorescences, while the yellow ball is flowering.
Photo 3: The immature seedpods of Satoh (Parkia speciosa) are collected from April until June and sold as vegetables.
Photo 4: This image shows dead plants of the early broom grass (Saccharum spontaneum). The inflorescences are harvested from October until December.

57
Photo 5: This image shows the leaves and the pseudo-stem of the late broom grass (Thysanolaena latifolia).
Photo 6: One of the several types of bamboo, from which the shoots are harvested from July until October, is also grown in a fire protection strip between the forest and zone 2.

58
Appendix VI – Sakaerat Silvicultural Research Station
11.1. Location
Sakaerat Silvicultural Research
Station is situated on the highway
No. 304 in Udonthrab Tambol,
Wang Num Khiao District,
Nakornrachasima Province,
between 14o 25’ – 14o 33’ latitude
and 101o 48’ – 101o 58’
longtitude. The location of the
Project is, on the other words, the
east of Pu-Luang National Park
(Figure 1). The vicinity of the study
site was covered with dry
evergreen forest until the 1960s.
The forest was then encroached
by local people, who converted it
into farmland. Although the
farmland was cultivated for a
couple of decades, most of it was
subsequently abandoned and
covered with tall grasses such as
Imperata cylindrical and
Saccharum spontaneum. The
Research and Training in Re-afforestation Project (RTR Project) conducted by Japan
International Cooperation Agency (JICA) and the Royal Forest Department (RFD) was initiated
in 1982 with the planting of exotic fast-growing tree species over 2300 ha by 1994. The area
is currently covered with mature fast growing tree plantations mainly composed of Acacia
mangium and Eucalyptus camaldulensis (Figure 2).
Figure 10: Location of Sakaerat Silvicultural Research Station in Udonthrab Tambol, Wang Nam Khiao District, Nakorn Rachasima Province

59
11.2. Physiography
Most of the areas are mountain of which
the slope is not so steep, small hills and
flat land where can be slightly found in
the high mountainous area, the slope is
around 10-30% and the slope in some
places may reach to 30-45% or more than
this. In addition, the height from sea level
is ranging from 200 to 770 m; especially,
the areas at Khao Khiat are around 760
and 730 m high from the sea level
respectively. The high slope area can be
found in the southeast adjacent to
highway No. 304. For the small flat area,
it is in the northeast of the experimental
site. The small stream here is classified
into intermittent design; that is, the water flows in particular seasons and in the dry season,
the brook is dry. At the middle of the experimental site, there are 2 important streams: Huay
Nm Kem and Huay Pae. Huay Nam Kem has water flow all year.
11.3 Climate
The mean annual air temperature was 25.6 °C and the mean annual rainfall was 1395 mm
according to meteorological data collected at the administrative office of the station over the
last 10 years (1999 to 2009). Generally, it rains during the middle of April and October and it
may slightly rain in December and February. While, the cold season is during November and
March. This area has a monsoon climate with highly seasonal rainfall and a roughly 4-month-
long dry period from November to February. The maximum temperature is about 37oc in
March and the minimum temperature is 8oc in January. Additionally, the relative humidity in
the whole year is 74.35%.
Figure 11: Location of four permanent sampling plots in plantation.

60
11.4. Geology
The Project site is located on the foot slope of Pu Luang at Korat Plateau. The stone
characteristic is sandstone which is the same set as Phra Wihan formation and is also in Korat
group. Shale can be also found but in a small amount. The stones are mostly rotten sandstones
which bury in soil, the stones do not stick to the streams overlap in pieces and it generally has
splits from side to side. The soil type is mainly Korat soil type soil texture is coarse singe grain;
mostly, it is sandy clay loam, while the others are sandy loam and clay loam. Moreover, it is
composed of every soil class: class A (10-20 cm thickness), class B (20-25 cm thickness), class
C of which its thickness is uncertain, but it is usually not more than 80 cm thick. At the lower
class than this, it is the hard stone class of which the soil is unfertile, and the water can absorb
moderately or the absorption ability is very low. Generally, the soil in dry dipterocarp forest is
very shallow having sandstones emerge from the soil surface, and the soil components are
similar to the dry dipterocarp forest. Therefore, the plants do not much cover the area. In
addition, forest fire occurs in the dry season every year and always damages the covers.
According to the Department of Underground Resources, the geological characteristics in
this area can be classified into 3 groups:
1) Calcareous, purplish-brown, purplish-gray and reddish-brown and yellow-
brown sandstone
2) Thick-bedded, crossbedded, quartz, quartzitic white-brown and yellow-brown
sandstone
3) Calcareous, micareous, reddish-brown, purplish-red siltstone, greenish gray to
yellow-brown, sandstone and local conglomerate
11.5. Soil
The soil is deep loamy acrisol formed on sandstone laid down in the Triassic to Cretaceous
periods and generally contains a small amount of organic matter. RFD (1987) classified into 3
soil groups and 8 soil types as follows table 1.
Table 1 Soil classified at Sakaerat Silvicultural research station (RFD, 1987)

61
Soil group Soil type
1. Red and yellow podzolic soils 1. Dry red and yellow podzolic soil
2. Slightly dry red and yellow podzolic soil
3. Moderately moist red and yellow podzolic
soil
2. Lateritic soils 4. Lateritic soil
3. Surface gleyed red and yellow
soils
5. Strongly surface gleyed red and yellow soil
6. Weakly surface gleyed red and yellow soil
7. Strongly bleached red and yellow soil
8. Weakly bleached red and yellow soil
11.6. Vegetation
1) Dry evergreen forest
In the southwest of the area is the dense forest the top crown density covers 85% of the
area, and the density of trees is about 765 trees/ha. Due to the plump line structure of the
forest, it is divided to 4 classes:
(1) The 1st hoizon
The height is around 21-40 m. The important tree species are Hopea ferrea, Hopea odorata,
Shorea sericeiflora and Irvingia malayana.
(2) The 2nd horizon
The 2nd horizon is 15-20 m high and main tree species are Hydnocarpus ilicifolius, Memecylon
edule and Walsula aqualata.
(3) The 3rd horizon
The height is during 4-14 m and the tree species are Baccuarea sapida, Olea salicifolia and
Apodytes dimidiate.
(4) The 4th horizon

62
This class is composed of under-planted tree species and small young trees of which the
height is lower than 4 m. Ardisia species and Canthium brunnescens are the main species in
this horizon.
2) Dry dipterocarp forest
The dry dipteracarp forest covers the northeast area, which can be observed from
sandstones appearing out of the ground. The soil is mixed with laterite stone. This forest
type is the forest of which the trees’ leaves fall in the dry season and the forest fire often
occurs every year, this affects on the tree growth – the stem is stunted, crooked and has
many swellings. Due to the plump line structure, this forest can be classified into 3 horizon:
(1) The 1st horizon
The first horizon is 21-35 m high and the important species are Shorea obtuse, Shorea
siamensis, Dipterocarpus intricatus and Dipterocarpus tuberculatus.
(2) The 2nd horizon
The height is around 11-20 m. Major tree species are Quercus kerrii, Gardenia sootepensis,
Gardenia obtusifolia and Randia fomentosa.
(3) The 3rd horizon
The tree species of this horizon are Arundinaria pusilla and Imperata cylindrica.
Besides, Pterocarpus macrocarpus and Xylia xylocarpa also grow both in the dry evergreen
and dry dipterocarp forests. Furthermore, there is bamboo forest along the gorge and at the
steep slope, the tree species growing at these areas are Bambusa arundinacea,
Dendrocalamus strictus and Oxytenanthera allciliata. The density is around 25 trunks per 1
cluster of bamboos.

63
Appendix VII – Synopsis
Between Forest Conservation and Urbanization: Changing Livelihood Strategies in Ban Huai Nam
Khem, Nakhon Ratchasima Province
Asta Poulsen, Eleni Gkotsi, Maja Jeppesen, Enno Sonntag
University of Copenhagen Supervisors: Paul Austin Stacey, Myles Oelofse

64
1 Introduction
In the 1980s and 90s Thailand was one of the most rapidly growing economies in the world, but this development did not come without fundamental changes for the country’s socioeconomic and ecological foundations. Thailand’s first National and Economic and Social Development Plan (NESDP) was implemented in 1961 and mainly promoted industrialization, infrastructure and development in and around the economic centre of Bangkok (Gullette & Singto, 2015). In the rural provinces 70 % of the population was working in the agricultural sector, infrastructure was poorly developed and livelihoods mainly relied on natural resources such as forests. These natural resources were heavily overused as the rural population struggled to catch up with urban livelihoods and in order to fuel the booming economy of Bangkok. Thailand’s National Economic and Social Development Board (NESDB) acknowledged and tried to address these inequalities when the seventh National Development Plan was implemented in 1992 (Rigg, 1993; Gullette & Singto, 2015). In addition to paying great attention to environmental issues, such as deforestation, this plan included expanding urban development, infrastructure, social services, and capital availability for agricultural investments to rural regions of the country (Rigg, 1993; Gullette & Singto, 2015). As typical for developing tropical countries, Thailand experienced major Land Use and Land Cover Chances (LUCC) due to deforestation for agricultural expansion, cash crop production and commercial timber extraction, as well as urban sprawl (Phanurak, 2012). With increasing population in rural areas and growing pressure on natural resources, forest protection became necessary and was first institutionalized with the National Park Act of 1961. One last year later Khao Yai National Park in the North-eastern Isaan region was created as the country’s first national park (Rigg, 1993). Since then area under the same legal protection status has increased to cover 17 % of Thailand’s national territory at present (Phanurak, 2012). Together national parks and national forest reserves cover 63.2 % of the total land surface, although about 20 % of Thailand’s villages are situated within national forest reserves, making their protection a matter of potential social conflict. Forest conservation, limiting access to this important resources basis of many rural households, was not the only factor that impacted livelihoods. Following the NESDP of 1992, infrastructural development and urbanization of secondary economic centres in the rural provinces and strongly influenced rural livelihood strategies. Smallholders now often rely on remittance sending by household members working in the city (Gullette & Singto, 2015). At the same time divestment from agriculture as well as abandonment of rice fields are frequent (Gullette & Singto, 2015). It is within this socioeconomic, environmental and political context that we want to investigate the interrelations between rural Thai people and the forest. At the centre of our research will be the households of Ban Huai Nam Khem (Moo 11), a village at the North-western End of Thap Lan National Park (see Figure 1). The National Park covers parts of Nakhon Ratchasima, Buri Ram and Prachin Buri Provinces and was established as the country’s 40th national park in December 1981 (Phanurak, 2012). The village consists of 226 households spread out along the important Kabin Buri - Pak Thong Chai Rd (route 304) which connects the city of Chachoengsao, capital of the province with the same name, with Nakhon Ratchasima. Ban Huai Nam Khem is situated in Udom Sap sub-district, Wang Nam Khiao district of Nakhon Ratchasima Province. This area is part of the southern Isaan region (Northeastern part of Thailand) and although some economic development has taken place since the 1992 NESDP, it is still one of the most rural and poorest areas of Thailand. From the little information we have beforehand we know that the village or part of the village agreed to be relocated to its

65
current position from its previous location within Thap Lan National Park. This likely occurred between 1986 and 2005 when, according to Leblond (2014), at least 55,000 people were displaced from protected areas. The villagers now live on small parcels of land that were allocated to them by the Royal Forestry Department with the “Sor Tor Gor” title, meaning that it can only be used for housing, not for farming. It also means that the villagers are threatened by a possible second relocation if the political climate changes. In this complex situation many of the previously mentioned factors are likely to impact on the villagers’ livelihood options and decisions. We also know that at least some households in the village are somewhat dependent on non-timber forest products. Therefore we want to study how the villagers of Moo 11 have adapted their natural resource based livelihood strategies to the relocation. We will first investigate (1) how the relocation or other important historical events have affected resource availability and accessibility from the forest. This will allow us to pinpoint crucial resources and their collection sites where, through an assessment of forest type and state of succession, we hope to (2) gain insights into the potential future security of this livelihood resource basis. Another aspect that is likely to play an important role for livelihoods in the area is labour migration and remittance sending by younger household members. Hence we want to set the natural resource based livelihood strategies in relation to other important resources and income sources to find out (3) what the villagers’ capacities are to adapt their livelihoods to change. We will also be looking at the different constraints there might be for the villagers to adapt.
Research Problem: How have the villagers of Moo 11 adapted their land-based
livelihood strategies to the relocation?
Figure 12: The Map shows the area of Thap Lan National Park divided into different Land Use and Land Cover categories as identified by Phanurak (2012) for the year 2000. The black arrow indicates the location of the Ban Huai Nam Khem (Moo 11) where our research will take place.
Moo 11
*
* *

66
(1) How has the relocation affected resource availability and accessibility from the forest?
(2) What does the state of the forest indicate about the potential future security of this livelihood resource basis?
(3) What are the villagers’ capacities to adapt their livelihoods to change?
Methodology: the Livelihood Strategy Framework
In order to examine the villagers’ livelihood strategies and their capacities to adapt these to change we will use the Livelihood Strategy Framework (LSF). A part of the LSF is to determine the different assets the villagers have. Ellis (2000) categorizes assets as different sorts of capital; natural, physical, human, financial and social capital (Ellis, 2000:32-36). We focus on the natural resource based livelihoods and the natural capital, such as different natural resources available, will therefore be our main asset of scope. When examining people’s livelihood strategies it is important to not only look at the assets people have but at the mediating factors, roughly said the context, for these strategies as well. The mediating factors can be things like social relations, organisations and institutions and determine the interrelationship between the assets (Ellis, 2000:39). The mediating factors can be harder to grasp and examine than the assets, and we do not expect to disclose every single factor influencing the villager’s livelihoods within the 10 days in the field. We believe, though, that it is possible to determine a general social structure and power relations in the village and the most important factors influencing the ways in which the natural capital is gathered, controlled, distributed and sold. Ellis (2000) argues that there are many different livelihood strategies within a village and we will therefore see the household as the main unit of our analysis (ibid::31). However, we will try to look for some general tendencies in the village or perhaps within socioeconomic groups in Moo 11. By looking at the villagers’ possibility of substitution of their assets, we will try and determine their vulnerability to change (ibid:42). This will be a part of examining their capacity for adaptation along with social relations and networks that might give the villagers agency to improve their livelihoods and adapt. Agency is here understood as the ways in which people handle and manipulate constraining and opportunity giving elements. The relocation is perhaps not an issue in Moo 11 but in that case it would still be interesting to examine the livelihood strategies of people who come from a farmer tradition but now have neither land to cultivate nor proper access to the forest. We are also aware that other sorts of capital might turn out to be of greater importance than the natural capital, when we get to the field, so we are ready to alter our focus if necessary.

67
Methods This chapter will contain an introduction to the methods applied to answer the problem formulation.
Semi-structured interview
This type of interview can be used to investigate a broader spectrum of themes during an interview. There is given room for changes in the themes as a response to the interviewed. This allows the respondent to come with inputs to the themes of the interview during the conversation. In this project a range of semi-structured interviews will be set out. As things are now we would like to talk to
The chief of Moo 11: details about relocation, general overview of villagers and their livelihoods (and powers dynamics), decision-making processes in the village
Park officials: the plans for the national park and actors influencing them, plans for villages close to the park, potential problems with the forest (exploitation, reduced afforestation etc)
Government officials: plans for the national parks and area in general, plans for nearby villagers, who is included in the decision-making processes for these plans,
Villagers who.. o might have benefitted from relocation o whose living standards decreased from the relocation o use natural resources from the forest o are involved in decision-making in the village o are chosen by “random sampling”: to get overview of village resources and
everyday life.
Questionnaire
The questionnaire will be focused on getting an overview of the villagers in connection to their livelihood. This will include questions connected to the villagers’ income, education, gender, age etc. to collect quantitative data for future analysis. Approximately 50 randomly chosen households in our sample, one questionnaire for each household.
Participatory Rural Appraisal
In Participatory rural appraisal (PRA) there is a focus on local stakeholders and bottom up development (Chandra, 2010). Through the focus on participation of local stakeholders, this method can increase empowerment of locals in decision making processes (Chandra, 2010). This method will be used to collect knowledge from the villagers about their livelihood, resource use and access to resources in the village. Various tools in PRA will be used to collect data concerning livelihood and natural resources. These are:
Focus group discussion
Historical timeline
Resource mapping
Transect walk
Trend line
Pie chart
Seasonal calendar
Ranking
Participant observation

68
As a part of getting an overview of the use of resources in the village the project group will try and follow selected villagers through their daily tasks and routines. It will include participatory cooking. This is a way to identify key natural resources used in the everyday life and will help to identify to which extend the villagers use the forest. Participant observation is an ongoing method.
Land Use and Land Cover Change Assessment (LUCC)
Geographic information System (GIS) will be used to map the data collected by GPS and satellite images for land use change in the area. GIS can be used to analyse changes in the landscape (Donnelley, 2015), which can help to determine the villagers influence on the forest or the changes occurred as a result of the creation of the national park. The GPS mapping can be used in relation to the resource mapping made by the villagers, to possibly compare the available resources in the area. Furthermore GIS can be used to get an overview of the area and the way the villagers use the forest, if combined with different transect walks.
Forest Resource Assessments
Forest resource assessments (FRA) can be used to give an estimate of the condition of a forest, based on the biomass. This can give an indication of the resources available in the forest (FAO, 2016). In the field the FRA will be conducted by measuring the diameter at breast height (DBH), height and density of trees in an outlined plot (Ting et al., 2010 ). This data yields an approximate biomass for the plot, which through interpolation can be used to estimate the biomass for the surrounding forest. Botanical identification will give an estimate of the species richness and biodiversity. This will be accompanied by a visual assessment of the forest type and disturbance level (Gardner et al., 2007).
Soil-sampling
A larger range of soil analysis will be integrated in the project. This is to understand the effect the foundation of the national park has had on the forest and how the village affect the soil in the forest and surrounding areas around the village. Main focus will be on the fertility of the soil, where analysis connected to carbon sequestration will be made. Depending on how intensified the villagers usage of the forest is, more or fewer soil analyses will be done. This will amongst others involve analysis of bulk-density to investigate if the compaction of the soil is related to the villagers’ use of the forest. Furthermore Total C & N analysis and Permanganate Oxidizable Carbon analysis will be conducted to determine the C content of the soil. This will give an indication of the biological active C in soil. The procedure is sensitive to management practices, which will help to investigate if the villagers’ usage of the forest influence the soil fertility (Weil, Islam, Stine, Gruver, & Samson-liebig, 2003). By conducting a pH-analysis it will be possible to determine the mineral nutrients available to plants in the soil (FAO, 2006). The pH also influence the degradation processes of organic matter, since the microbial activity is influenced by how acidic the soil is (Berthelsen & Fenger, 2005).
Ethnobotanical survey
By collecting voucher specimens, transcribing local names and talking to different informants central to rigorous ethnobotanical research, we seek to assess the variety of plants (and possibly other resources like fungi and animals) utilized by the villagers for self-sufficiency or

69
marketing. We will try to collect and photograph as many useful plants with the villagers as possible, note the location of collection (GPS), type of surrounding vegetation, habit of plant (herb, vine, shrub, tree, etc.) and document their use and local name, as well as the name of the informant. Scientific species names will be identified from the literature. Hopefully collection can be done with at least three different people from the village who commonly involved in plant collection. The informants will be selected based on information gathered from questionnaires, semi-structured interviews and participatory cooking.

70
Appendix I: Research Schedule
Week 1 Mo 27.02. Tu 28.02. We 01.03. Th 02.03. Fr 03.03. Sa 04.03. So 05.03.
Morning
Group 1
SSI & transect walk w. chief
Questionnaires
Visit to market (day?)
- interview with retailers
- identify species
Group 2 Transect walk in
village w. villagers
Afternoon
Group 1
Group interview & historical
timeline w. chief and elders
SSI w. park official (day?) OR transect
walk w. villager
SSIs about natural resource
use (2 people)
Group 2 - walk in area
- inform translators
Questionnaires Participatory
cooking (time of day?)
Participatory cooking
(time of day?)
Evening All time to
restructure
- field notes - review of
questionnaires
- field notes - dry specimens
Week 2 Mo 06.03. Tu 07.03. We 08.03. Th 09.03. Fr. 10.03. Sa 11.03. So 12.03.
Morning
Group 1 Specimen
collection w. person 3
SSI w. park official
PRA-Session 1: ranking matrix /
trend line FRA FRA FRA
Group 2 SSIs about
natural resource use (2 people)
SSIs about natural resource
use (2 people)
SSI & Pie chart on other income
sources / substitution
Soil sampling Soil sampling Soil sampling
Afternoon
Group 1 Specimen
collection w. person 3
Prepare PRA-Session methods
PRA-Session 2: resource / seasonal calendar
Plant recognition
game
Plant recognition
game
Group 2 Participatory
cooking (time of day?)
Prepare SSI & Pie chart
SSI & Pie chart on other income
sources / substitution
SSI & Pie chart on other income
sources / substitution

71
Appendix II: Data Matrix
Problem Formulation
Research Question
Subquestion Data Method Limitations Alternative Approach
Context and overview
Questionnares time consuming
Historical timeline information blurry
Transect walk very subjective
Participatory observation
very subjective
How have the villagers of Moo 11 adapted their land-
based livelihood strategies to the
relocation?
How has the relocation
affected resource availability and
accessibility from the forest?
Which natural resources do the villagers use now
(subsistance / market) compard to
before the relocation?
Natural resource use by
households
Semi-structured Interviews
Villagers not willing to talk about the
resources they use, or they don't use
any
Follow daily routines and
identify resources used during the
day
Participatory cooking
No wild species used
Ask about other plants they use for
cooking, or perhaps medical
treatments.
Specimen collection / GPS
mapping
Difficulties collecting speciments
Transect walk to get overview of
some speciments
Participant observation -
follow daily tasks
They don't use the forest in the amount
or way expected
Change approach to RQ and possibly
look at how the village is
influenced by the forest in other
ways
Evening All - field notes
- dry specimens - field notes
- talk about PRA results
- field notes

72
Visit market (transect walk)
maybe only possible on certain
days
Conduct more transect walks, use different people for
FGD to get different
persepctives
PRA-Session: Most crucial
natural resources for the villagers
Ranking matrix Somewhat time
consuming
Only do ranking or post-it
categorisation
Trend line Somewhat time
consuming
Not go much in depth. But just use
it to get a broad overview
Resource mapping (by
villagers)
Somewhat time consuming
Not go much in depth. But just use
it to get a broad overview
How does the dependency on
important natural resources vary over
the year?
PRA-Session: Seasonal
variation of natural
resource use
Seasonal calendar
Somewhat time consuming
Not go much in depth. But just use
it to get a broad overview
What does the state of the forest indicate about the
potential future security of this
livelihood resource basis?
What is the status of used forest areas?
Data on biomass and
species richness
FRA Timeconsuming Focus on smaller
or fewer plots
What do soil parameters indicate about forest status?
soil profiles & parameters
Soil analysis on SOC, bulk
density, soil texture, pH
Timeconsuming
Only look at SOC (Soil organic
carbon) in forest close to village and further into forest
How has the land cover changed?
Satellite imagery of
LUCC (resettlement to
now)
LUCC mapping Access to satellite
data showing change over time
Use GPS to map changes based on villagers memory (may be biased)

73
GPS mapping of collection
area GPS-mapping
Undefined boundaries
Use GPS to map available changes based on villagers memory (may be
biased)
What are the villagers’
capacities to adapt their
natural resource based livelihoods
to change?
What are the most relevant forms of
capital cf. LSF
Other important resources (income & different
capitals) in relation to
natural resources
Semi-structured interviews
Timeconsuming reduce amount of
questionnaires
Pie charts Timeconsuming
Use smaller amount of
interviews to gather information about the natural
resources
Is it possible to substitute crucial
natural resources?
scarse crucial resources and possible other
resources
Semi-structured interviews
villagers knowledge about alternative
resources
Gives indication of the amount of
alternatives they think are available
What does the young generation
know about natural resource use and
what are their aspirations?
test specific knowledge
relevant for use of natural
resources & ask about apsirations
Small questionnaire, or game about plant
recognition
They don't have any knowledge about the use of natural
resources
Gives indication of the amount of
knowledge that is given to the
children about the use of forest
What are the mediating factors for
the livelihood resources (context
of livelihoods) ANALYTICAL QUESTION
-
No specific method - the
whole project is a part of disclosing
the context
- -

74
Appendix III: Participatory Rural Appraisal Tool
1.1.1 Focus group discussion
Focus group discussion (FGD) is used to facilitate an open talk about key topics. This type of tool can also be used to identify various types of group dynamics (Chandra, 2010). Two FGD’s with app. 5 people in each - one group does the resource mapping and one the trend line. In the FGDs focused on the crucial resources in the village there will be made a post-it categorisation of the important resources in the community. The groups are randomly chosen (if we don’t see any problem with mixing the genders). If there is a problem with inequality between genders, then there will be two FGD’s for each of the topics. One with the females and one with the males, conducted at the same time.
1.1.2 Historical timeline
In order to get an overview of the history of the village and the relocation we will on the first or second day sit down with some villagers and make them plot important events concerning the village into the timeline. We can ask the chief for some reference points (like a huge storm or other important events) that we can plot in before to make it easier for the villagers to locate the different events in time.
1.1.3 Trend line
A trend line can be used to investigate long term changes in a community, based on the villagers own memory of the relocation (Chandra, 2010). This can give an overview of the different development trends in the village and how the villagers experience the outcome of the relocation. This can be done through semi-structured interviews or FGD. Through the FGD a piece of paper will be spread out in front of the participants. The task is for them to outline a timeline with some specific events relating to the resettlement. This is amongst others changes in population, farmland, education, cropping patterns, land use, etc. depending on the important variables for the relocation. These key factors should also be identified by the participants, however facilitator should have some key subjects to possibly open the discussion. Furthermore the discussion should also be focused on the main causes of changes (Chandra, 2010).
1.1.4 Resource mapping
Resource mapping can be used to identify valuable resources in the community and the spatial distribution of these. Furthermore this tool can be used to investigate the villagers own knowledge about the resources available to them in the surrounding areas (Chandra, 2010). This mapping will be conducted in the same way as the trend line, with focus on the location of natural resources.
1.1.5 Transect walk
This type of tool is a walk around an area of interest, where villagers and project group members talk about observed things (Chandra, 2010). This tool can help to identify problems connected to livelihood and resources. A wide range of transect walk will be used in the project. This is to get an overview of the area and the use of natural resources. Transect walks will amongst others include visits to the market, a walk around the village, the nearby areas and the forest. Interviews can be started off by doing a transect walk around the area to create a relaxed atmosphere and

75
puts the interviewed in the position as an expert in the development in their community. Through the transect walks it is important to meet people, ask questions, listen, discuss and identify different types of technologies, land zones, and opportunities for change (Chandra, 2010).
1.1.6 Pie chart
Pie chart is used to present in a straightforward way obtained data, of items or categories that have been compared, by a group or individuals (Narayanasamy, 2009). The pie chart will be used to visualize time allocation to different livelihood activities. In this way, we will be able to see the importance of each of these various resources. After the SSI about other sources of income, the interviewees will draw a pie chart, where each piece of the pie will indicate the time they spent in this source.
1.1.7 Seasonal calendar
Seasonal calendar is a PRA tool that can be used to allocate through a diagram different activities or items over the year (Narayanasamy, 2009). This tool of PRA will enable us to assess the villager’s dependency on the different natural resources they use. A line with the months will be draw in a sheet of paper and villagers will place in each month which natural resource or resources they obtain. The information regards the natural resources that the villagers use will be gathered from the triangulation of the SSI with villagers, participatory cooking, participant observation, specimen collection and transect walk in the market.
1.1.8 Ranking
Ranking is used to assess how groups or individuals value a list of different items (Chandra, 2010). The different natural resources that are used by the villagers, and have been identified by previous methods like in seasonal calendar, will be placed in order in a sheet paper, and then ranked by them, based on which one they think as more and less important. Hence, a clear view of the natural resources that are crucial to the villagers will be attained.

76
References
Berthelsen, M., & Fenger, J. (2005). Naturens Kemi: processer og påvirkning. Gyldendals forlag.
Brinkmann, S., & Kvale, S. (2009). InterView - Introduktion til et håndværk (2. udgave). København: Hans Reitzels Forlag.
Chambers, R. (1994). The Origins and Practice of Participatory Appraisal *. World Development, 22(7), 953–969.
Chandra, G. (2010). Participatory Rural Appraisal. Issues and Tools for Social Science Research in Inland Fisheries, 163, 286–302.
Donnelly, F. (2015). Introduction to GIS Using Open Source Software. New York.
Ellis, F. (2000). Rural Livelihoods and Diversity in Developing Countries. New York.
FAO. (2016). Global Forest Resources Assessment 2015. Rome.
FAO. (2006). Guidelines for soil description. Rome.
FAO. (2016). Global Forest Resources Assessment 2015. Rome.
Gardner, S., Sidisunthorn, P., Anusarnsunthorn, V. (2007). A Field Guide to Forest Trees of Northern Thailand. Bangkok.
Guellete, G., Singto, S. (2015). Effects of Urban Expansion and Cultural Hierarchies on Labor Strategies within Thailand’s Rural‐Urban Interface. Journal of Population and Social Studies, 23, 146-167. DOI: 10.14456/jpss.2015.11
Leblond, J. F. (2014). Thai Forest Debates and the Unequal Appropriation of Spatial Knowledge Tools. Conservation and Society 12, 425-436. DOI: 10.4103/0972-4923.155588
Narayanasamy, N. (2009). Participatory Rural Appraisal: Principles, Methods and Application. SAGE Publications. New Delhi.
Phanurak, W. (2012). The Assessment of Land Use Change and Forest Carbon Sequestration at Thap Lan National Park. PhD Thesis, Suranaree University of Technology.
Rigg, J. (1993). Forests and Farmers, Land and Livelihoods, Changing Resource Realities in Thailand. Global Ecology and Biogeography Letters, 3, 277-289.
Ting, Z., Haiyun, C., Shivakoti, G. P., Cochard, R., Homcha-aim, K. (2010). Revisit to community forest in northeast of Thailand: changes in status and utilization. Environ Dev Sustain, 13, 385-402. DOI: 10.1007/s10668-010-9267-3
Weil, R. R., Islam, K. R., Stine, M. A., Gruver, J. B., & Samson-liebig, S. E. (2003). Estimating active carbon for soil quality assessment : A simplified method for laboratory and field use. American Journal of Alternative Agriculture, 18(1), 3–17.