reflections on water resources in a changing · pdf filereflections on water resources in a...
TRANSCRIPT

Robert M. HirschU.S. Geological Survey10 September, 2016
Reflections on Water Resources in a Changing World

Quantifying the resource
John Wesley Powell (1834 – 1902)
Harvard Water Program, 1962
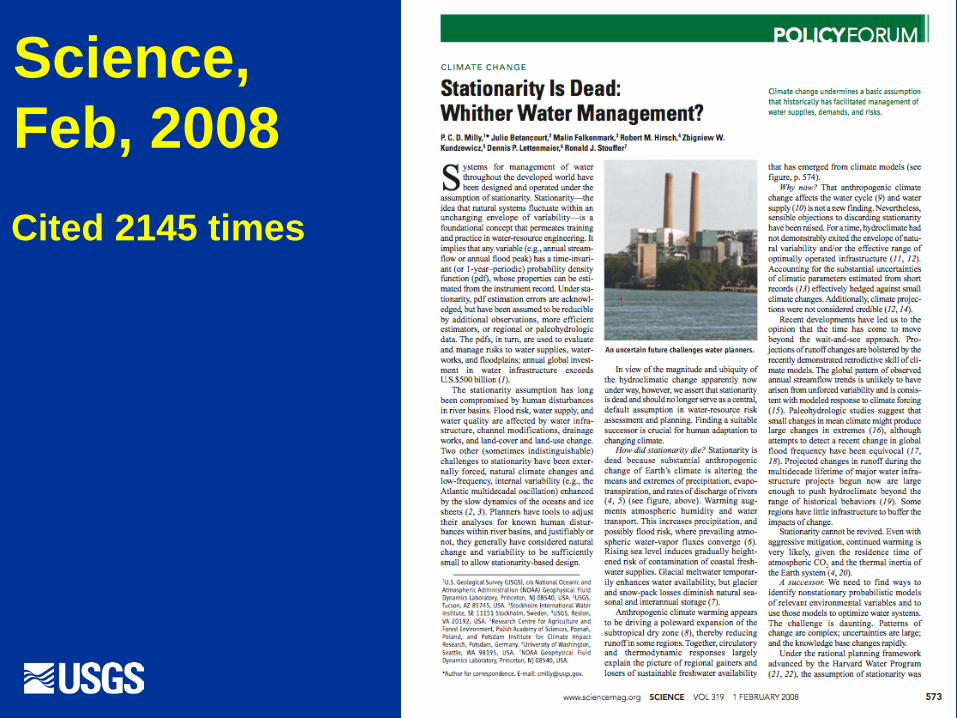
Science, Feb, 2008Cited 2145 times

The challenge is how to build a bridge from the observed past to an uncertain future?
Why should we do trend studies?
• To provide the basis for design and operations decisions
• To evaluate deterministic trend models
• To evaluate progress & identify emerging issues

“Data without models are chaos,But models without data are fantasy”Nesbit, et al., Science, 31 January 2014, p.493-495.
The study of change needs BOTH statistical inference AND process-based modeling.
There is room for diverse approaches to tease out the meaningful signals from the noisy data.

• Can climate models produce patterns like this?
• Do streamflowstatistics show trends that are consistent with this?
• What are the implications for flood hazards?
Trend in daily precipitation volume for the 1% daily frequency, between 1958 and 2012. That’s the event that is exceeded about 3 days per year.(reported in National Climate Assessment).

Little Androscoggin River, near South Paris, Maine190 km2 watershed

Can the models create patterns like this?
How to describe it?


Everyone tells me “Hydrologic variability has been increasing” - so what’s your metric? Mine is the 21-year moving standard deviation of the log daily discharge.
What’s your definition of variability?Can we document that it is increasing?

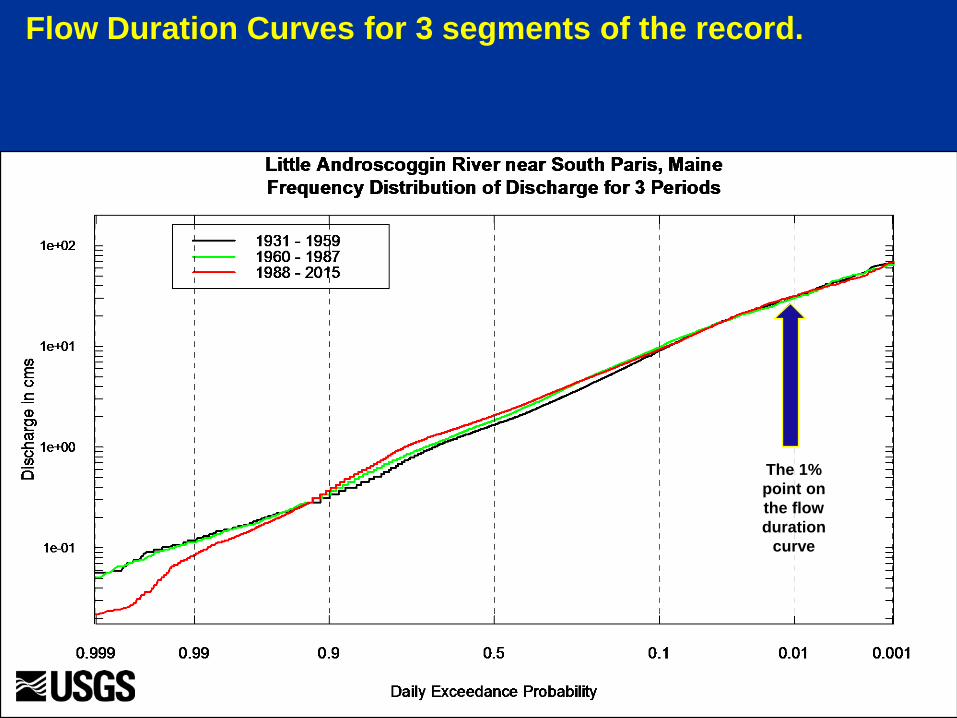
Flow Duration Curves for 3 segments of the record.
The 1% point on the flow duration
curve
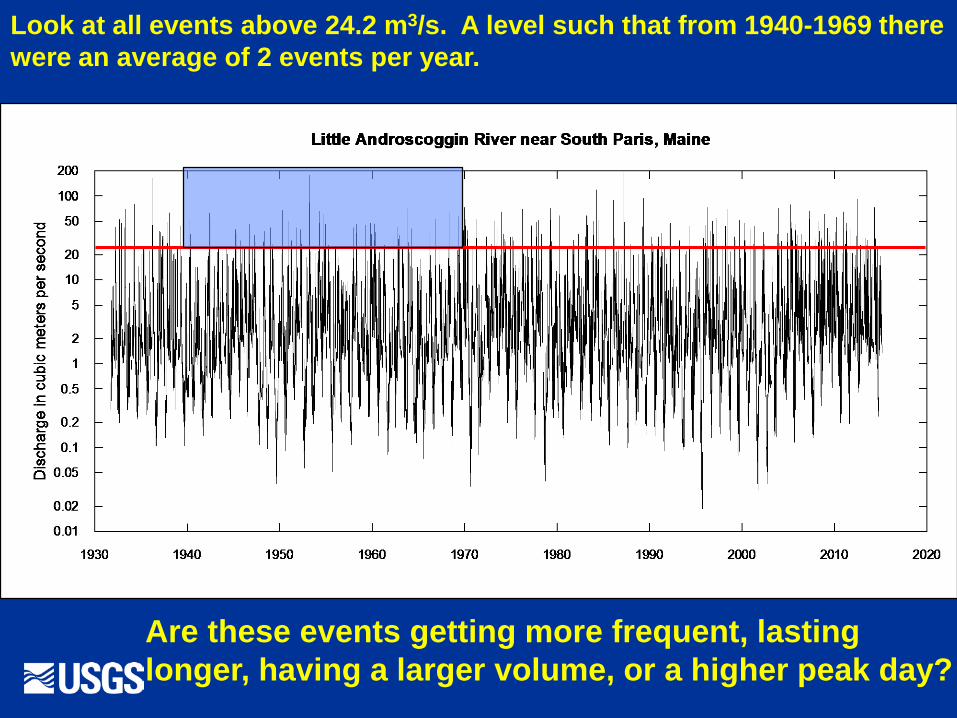
Look at all events above 24.2 m3/s. A level such that from 1940-1969 there were an average of 2 events per year.
Are these events getting more frequent, lasting longer, having a larger volume, or a higher peak day?


Using the Mann-Kendall test for trend: the two-sided p-value is 0.005. Frequency has gone from an average of 2 per year in the base period to an average of 3.3 per year since 1990.
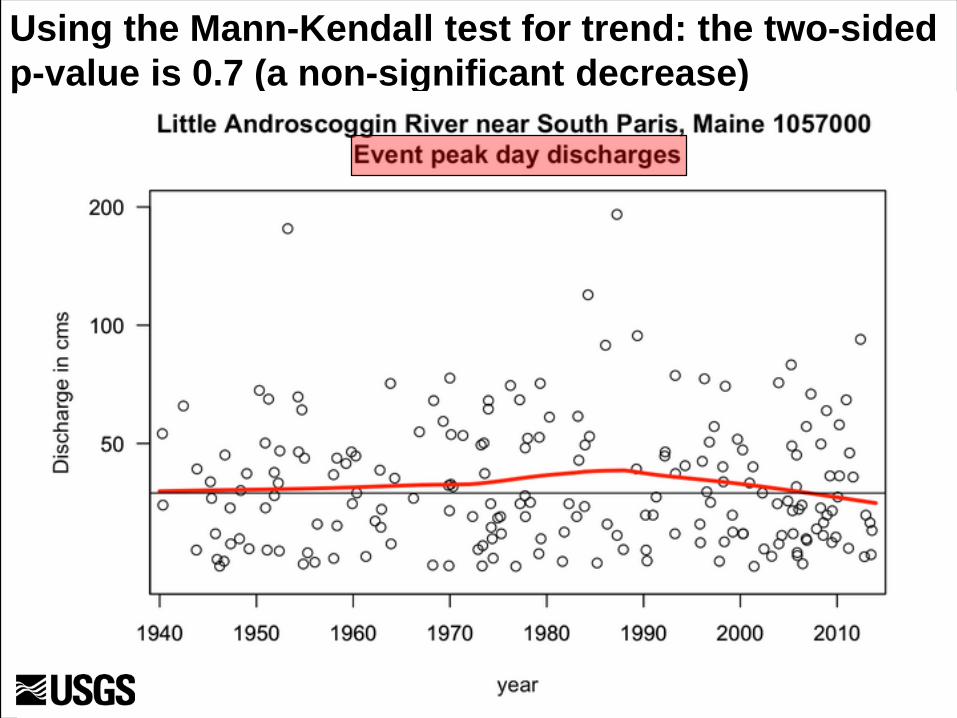
Using the Mann-Kendall test for trend: the two-sided p-value is 0.7 (a non-significant decrease)

Using the Mann-Kendall test for trend: the two-sided p-value is 0.6 (a non-significant decrease)

using the Mann-Kendall test for trend: the two-sided p-value is 0.5 (a non-significant decrease)

Three watersheds in New England
Little Androscoggin RiverAmmonoosuc River
Bunnell Brook

Using the Mann-Kendall test for trend: the two-sided p-value is 0.5.Frequency has gone from an average of 2 per year in the base period to an average of 2.2 per year since 1990.
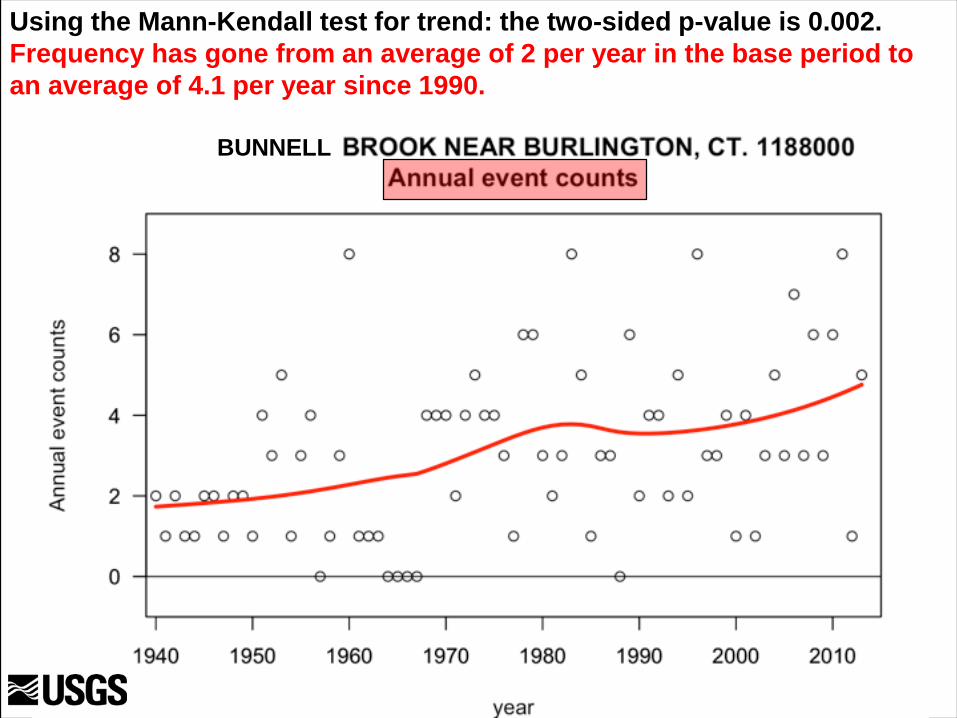
Using the Mann-Kendall test for trend: the two-sided p-value is 0.002.Frequency has gone from an average of 2 per year in the base period to an average of 4.1 per year since 1990.
BUNNELL

Diversity of flood behaviors:Tau values of trends
Frequency Duration Volume Peak Day
Little Androscoggin +0.22** -0.03 -0.02 -0.02Ammonoosuc +0.05 -0.05 -0.05 -0.05Bunnell Brook +0.25** -0.03 +0.097* +0.14**
Can atmospheric and hydrologic models result in similar outcomes?Can we explain the differences among watersheds?
Changing Streamflow• Do we have up-to date characterizations of
streamflow for design and management purposes (low flow, high flow, seasonal,…)?
• Are we using the data to test deterministic models of change (using model hindcasts)?
• Are we using the data to inform us of widespread changes and their possible causes?
• Are we operating observation networks that will help us characterize change into the future?
Now we will shift gears
Moving from • changes in streamflow• to changes in surface water quality

Chesapeake Bay Nontidal Monitoring Network
• 117 stations• About 20 samples per year
(calendar and event based) for N, P, and SS
• Daily discharge at all sites• Looking for trends in load
Data analysis issues• The data can be highly variable• Highly related to streamflow and season• Highly skewed• Sometimes censored
• Assessements of progress can be easily obscured by the random, but persistent, pattern of wet and dry years (“The thrill of victory, the agony of defeat”)

The thrill of victory
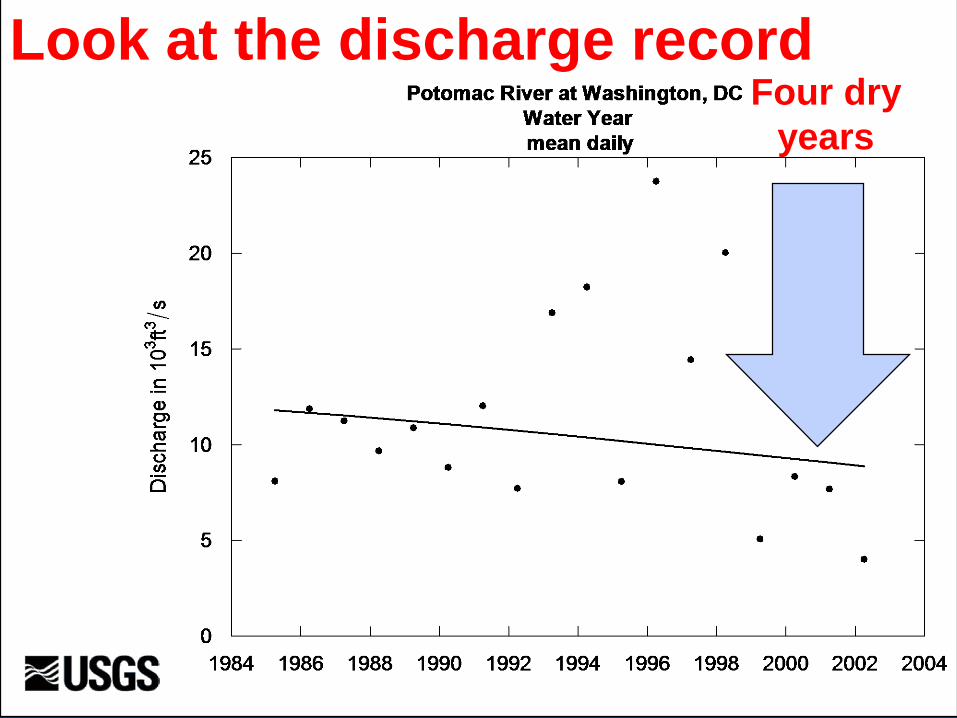
Look at the discharge recordFour dry
years
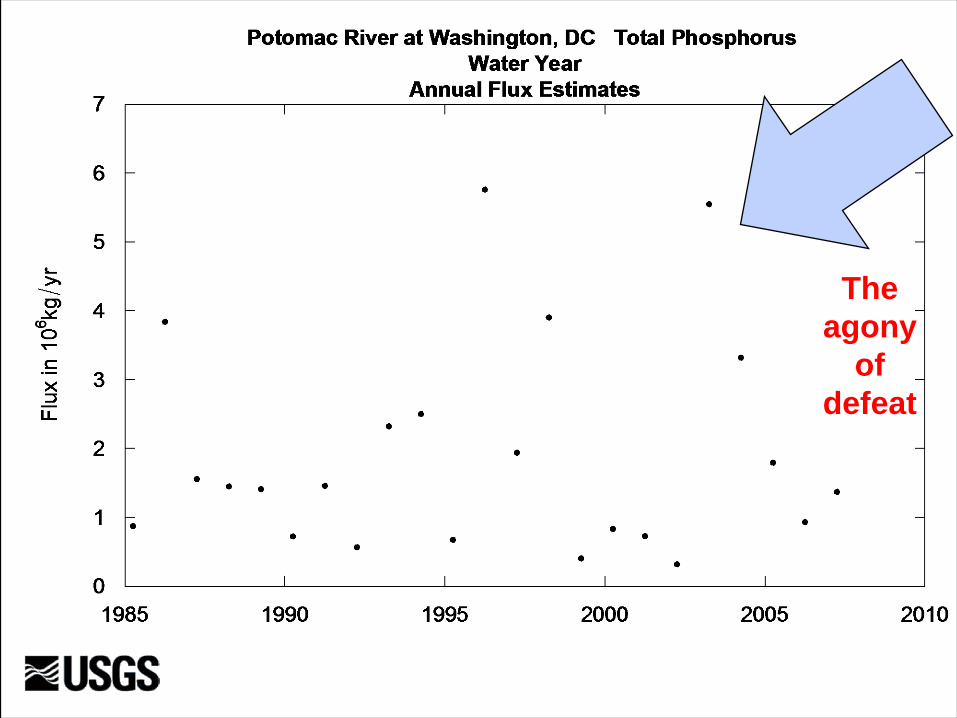
The agony
of defeat
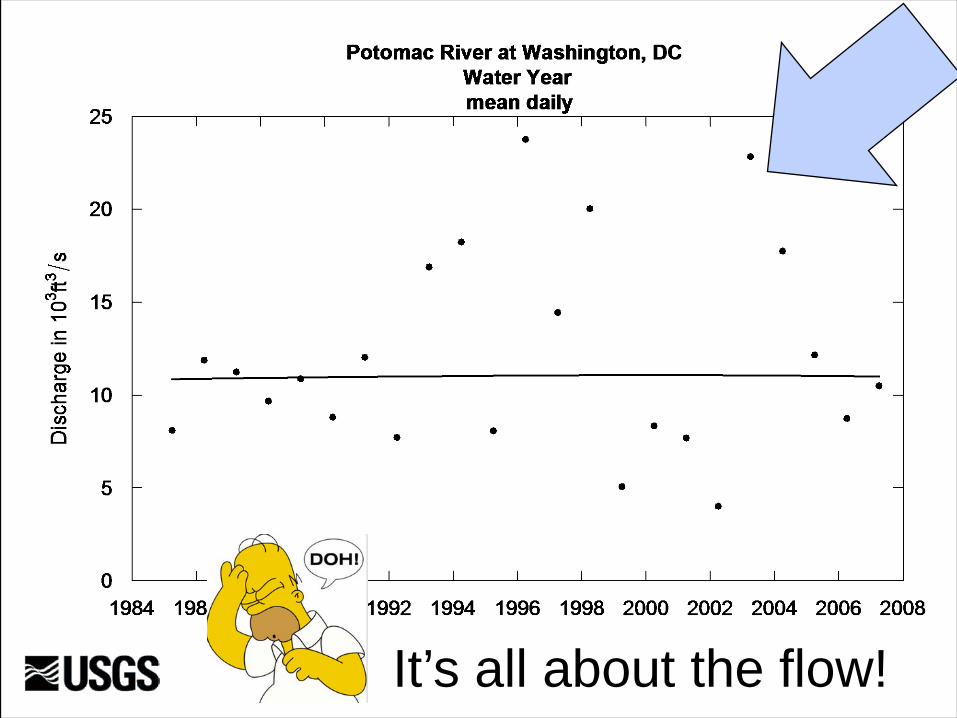
It’s all about the flow!

What’s my point here?• This history of loadings is very useful to
the ecologist trying to understand the drivers of the receiving water body
• But, it is not useful for assessing progress because it is overwhelmed by random year-to-year variation in streamflow.
• We are smarter than Homer! We can deal with the influence of flow.

Analysis method• Use Weighted Regressions on Time,
Discharge and Season (WRTDS)• WRTDS bootstrap test for uncertainty
analysis

Choptank River, 293 km2 watershed
WRTDS Example

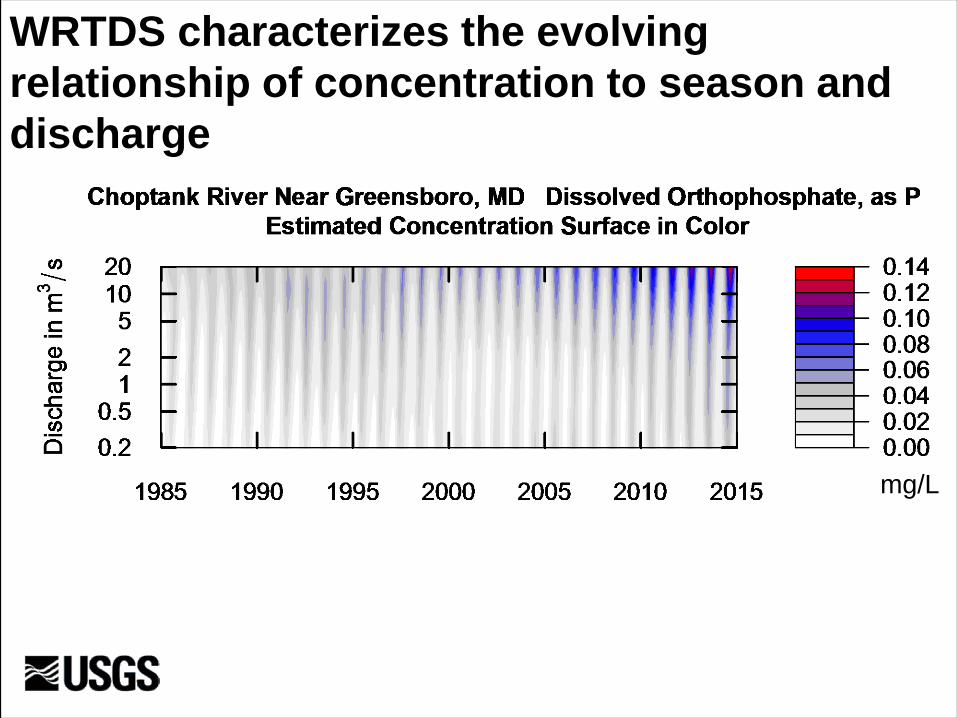
WRTDS characterizes the evolving relationship of concentration to season and discharge
mg/L

• Provides a detailed description of change.
• But managers want answers to 2 simple questions:
• Is it getting better or worse?
• What is the rate of change?
• Integrate this surface over the seasonal frequency distribution of discharge to get “Flow-Normalized Annual Flux”.

Change from 2005 to 20143800 kg/yr to 5700 kg/yr

Measures of uncertainty
Best estimate:a 54% increase

Chesapeake Bay TMDL story
• The official model for the TMDL showed Orthophosphorus declining. This WRTDS analysis has helped show how flawed that is.
• This empirical result is a wake-up call about an emerging problem in the region

Another story: Chloride trends for theHockanum River near East Hartford, CT

What do the data tell us?
Nutrient, organic carbon, and chloride concentrations and loads in selected Long Island Sound tributaries—Four decades of change following the passage of the Federal Clean Water Act, by John Mullaney
USGS Scientific Investigations Report 2015-5189https://pubs.er.usgs.gov/publication/sir20155189
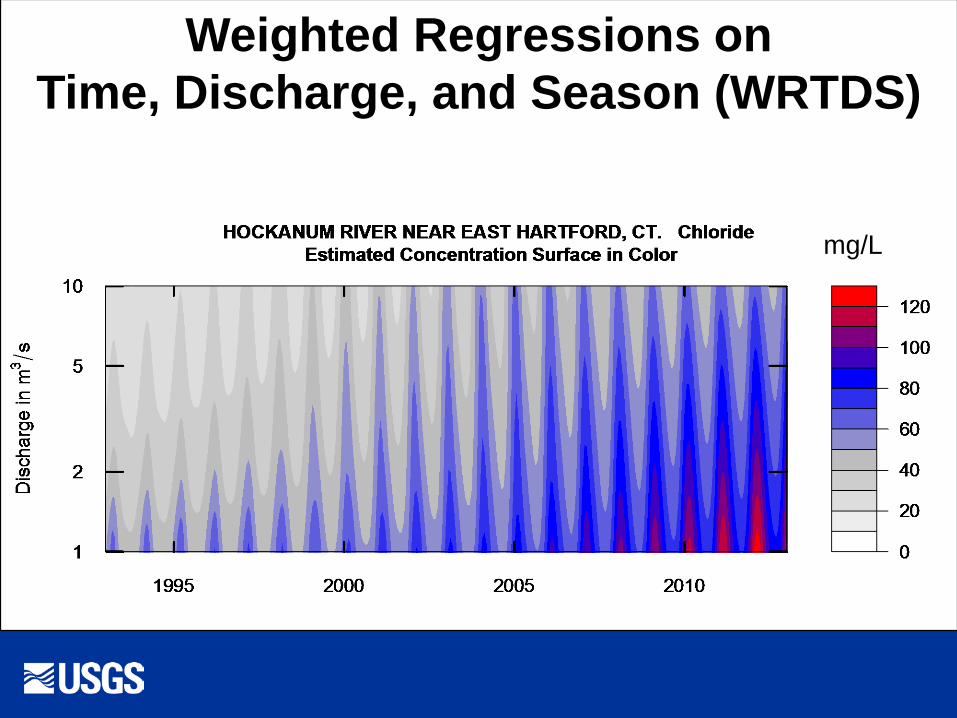
Weighted Regressions on Time, Discharge, and Season (WRTDS)
mg/L

Note: this time we are tracking concentration
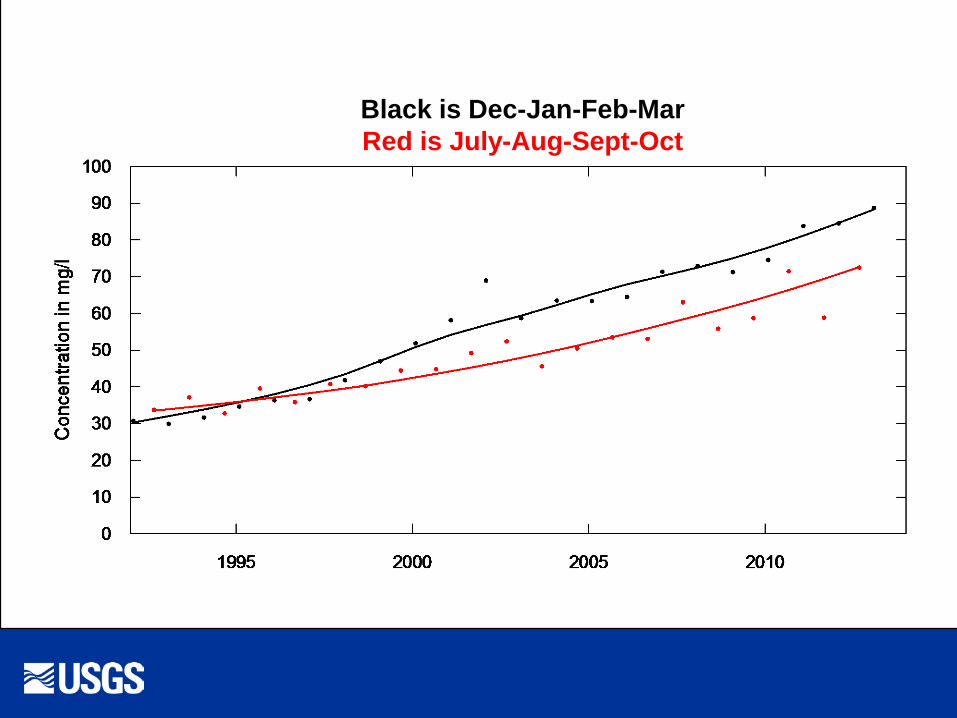
Black is Dec-Jan-Feb-MarRed is July-Aug-Sept-Oct

Why all this complexity?Different products for different
purposes• Concentration versus flux• Actual history versus flow-
normalized history• Seasonal versus annual trends

An aside about softwareMost of the analysis and visuals in this talk were produced with the USGS open source R-software packages:• dataRetrieval
• EGRET (Exploration and Graphics for RivErTrends)
• EGRETci (confidence intervals)
All available from CRAN
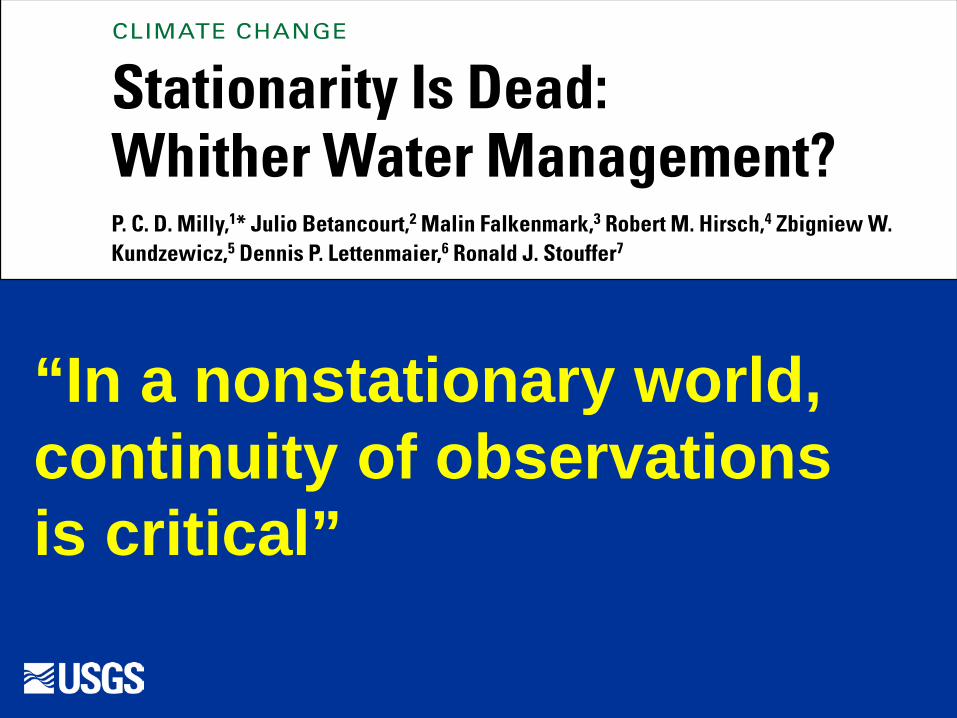
“In a nonstationary world, continuity of observations is critical”
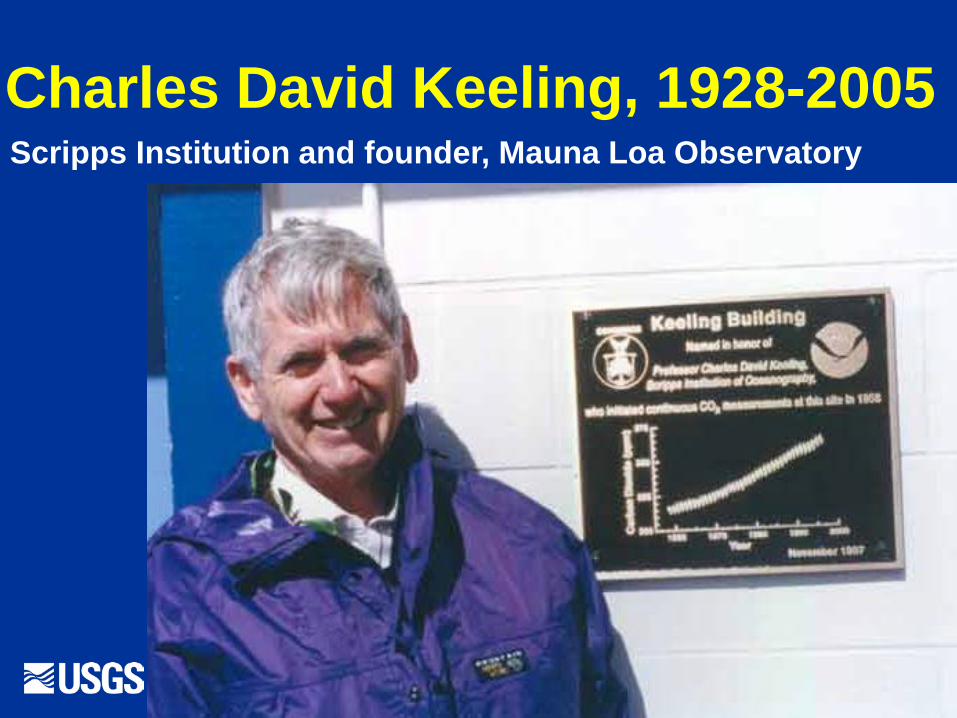
Charles David Keeling, 1928-2005Scripps Institution and founder, Mauna Loa Observatory

Mauna Loa Observatory


Temperature trends for Amherst, MA
From poster presentation by Arcusa, Bradley, and Rawlins, U. of MA, Amherst http://blogs.umass.edu/csrcblogs/files/2012/04/sarcusa_poster.pdf

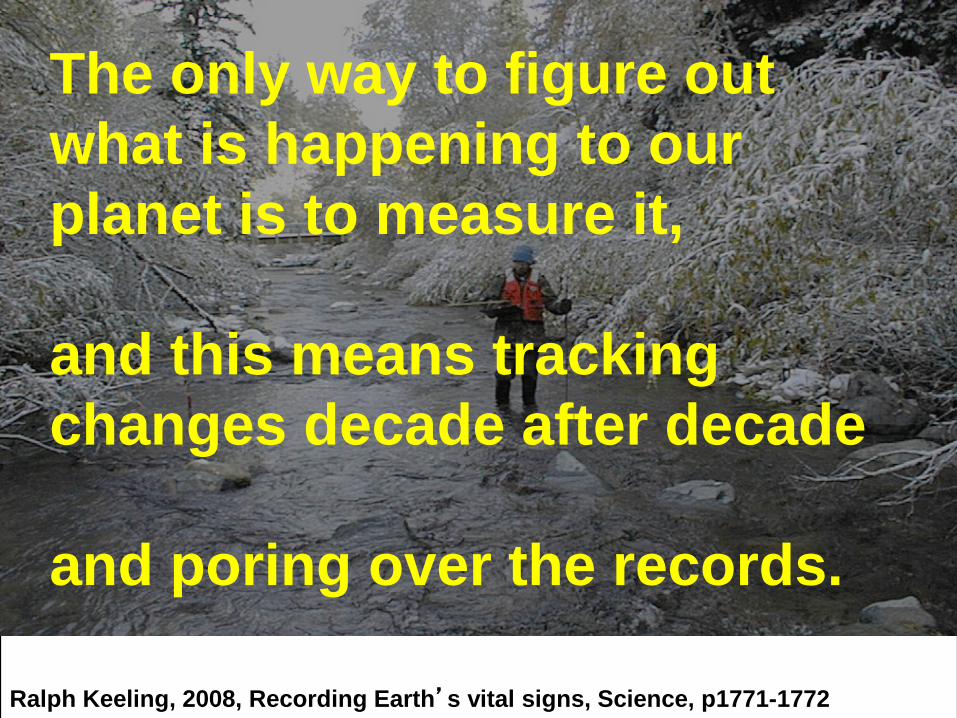
The only way to figure out what is happening to our planet is to measure it,
and this means tracking changes decade after decade
and poring over the records.
Ralph Keeling, 2008, Recording Earth’s vital signs, Science, p1771-1772

How to build the bridge
Collect the data over decades, be persistent
Pore over the data for signals, describe them
Use the data to test the models
Use decision frameworks that recognize deep uncertainty

How to build the bridge
Avoid arrogance and avoid paralysis
Build resilient plans and operations – the future may be well outside our envelope of experience
Use diverse portfolios and be adaptive (which demands observations and repeated analysis)