reflections on the application of 13c-mrs to research on brain metabolism
TRANSCRIPT

NMR IN BIOMEDICINENMR Biomed. 2003;16:303–312Published online in Wiley InterScience (www.interscience.wiley.com). DOI:10.1002/nbm.844
Review Article
Reflections on the application of 13C-MRS to researchon brain metabolism
Peter Morris and Herman Bachelard*
MR Centre, School of Physics and Astronomy, University of Nottingham, Nottingham NG7 2RD, UK
Received 21 July 2003; Revised 20 August 2003; Accepted 21 August 2003
ABSTRACT: The power of 13C-MRS lies in its unique chemical specificity, enabling detection and quantification of metabolic
intermediates which would not be so readily monitored using conventional radiochemical techniques. Examples from animal
studies, by examination of tissue extracts from the whole brain, brain slices and cultured cells, include observation of
intermediates such as citrate and triose phosphates which have yielded novel information on neuronal/glial relationships. The
use of 13C-labelled acetate as a specific precursor for glial metabolism provided evidence in support of the view that some
of the GABA produced in the brain is derived from glial glutamine. Such studies have also provided direct evidence on the
contribution of anaplerotic pathways to intermediary metabolism. Analogous studies are now being performed on the human
brain, where 13C-acetate is used to quantitate the overall contribution of glial cells to intermediary metabolism, and use of 13C-
glucose enables direct calculation of rates of flux through the TCA (FTCA) and of the glutamate–glutamine cycle (FCYC), leading
to the conclusion that the rate of glial recycling of glutamate accounts for some 50% of FTCA. The rate of 0.74mmol min�1 g�1
for FTCA is compatible with PET rates of CMRglc of 0.3–0.4mmol min�1 g�1 (since each glucose molecule yields two
molecules of pyruvate entering the TCA). Our brain activation studies showed a 60% increase in FTCA, which is very similar to
the increases in CBF and in CMRglc observed in PET activation studies. Copyright # 2003 John Wiley & Sons, Ltd.
KEYWORDS: 13C-MRS; neuronal/glial relationships; human brain activation
INTRODUCTION
Naturally abundant 13C was first demonstrated to occur in1939 and separated by thermal diffusion. 13CO2 was thenenriched a few-fold and applied to studies on intermedi-ary metabolism in bacteria using mass spectrometry.1–3
However it was not possible to produce highly enrichedmaterials by the separation techniques then available, so13C gave way to the radioactive 11C being produced in thecyclotron. 13C was subsequently produced in larger yieldby bombardment of 12C with deuterons and protons in thecyclotron.4
Well before Fourier transform techniques became avail-able in 1966, Lauterbur5 produced spectra of naturallyabundant 13C in over 100 small organic molecules, givingchemical shifts in ppm relative to CH3
13COOH. With theadvent of FT and more highly enriched precursors, meta-
bolic studies were then performed using 13C-MRS in yeastand red blood cells,6–8 which was rapidly followed byextensive in vitro metabolic studies in bacteria, mammaliancells and mitochondria.9 In vivo 13C-MRS was performedin 1981 on non-cerebral mammalian systems by Shulman’sgroup,10 and analogous studies on rat and rabbit brain werepublished subsequently by them in 1985.11,12 At about thistime studies on actively metabolising in vitro preparationsfrom the brain were beginning.13 Owing to its inherentrelative insensitivity, the resolution of 13C-MR spectrain vivo or in actively metabolizing brain slices in vitro isseverely limited, so investigators turned to the use of de-proteinized extracts of brain slices,13 of the whole brain,14,15
and of cultured cells.16 Studies using combinations of 13C-labelled acetate with 13C-labelled glucose to study neuro-nal/glial compartmentation began in 1987,17 and thisapproach has received much attention since,14,18–20 to theextent that it is now being performed on human brain.21,22
METHODS
Animal studies
Tissue slices (0.35 mm thick) from the guinea pig cere-bral cortex were superfused, and neutralized perchloricacid extracts were prepared for analysis. MR spectra were
Copyright # 2003 John Wiley & Sons, Ltd. NMR Biomed. 2003;16:303–312
*Correspondence to: H. Bachelard, MR Centre, School of Physics andAstronomy, University of Nottingham, Nottingham NG7 2RD, UK.E-mail: [email protected]
Abbreviations used: BOLD, blood oxygen level dependent; CBF,cerebral blood flow; CMRO2, cerebral metabolic rate for oxygen;CMRglc, cerebral metabolic rate for glucose; FCYC, rates of fluxthrough the glutamate–glutamine cycle; FTCA, rates of flux throughthe TCA; FT, Fourier transform; Glyc. 3-P, glycerol 3-phosphate;Depo, depolarised; MRS, magnetic resonance spectroscopy; PC,pyruvate carboxylase; PDH, pyruvate dehydrogenase; PET, positronemission tomography; TCA, tricarboxylic acid cycle.

obtained using either a Bruker MX 400 or an AMX-500Bruker spectrometer operating at 100.62 or 125.76 MHzfor 13C, respectively. Percentage 13C-enrichments of allmultiplets were corrected for natural abundance.18
Human studies
13C-MRS measurements on the human brain were per-formed using a whole body 3 T MR system, equippedwith 13C (32 MHz) and 1H (128 MHz) radiofrequencychannels as described previously.23
RESULTS AND DISCUSSION
The unique contribution of 13C-MRS to our knowledge ofintermediary metabolism in cerebral systems was illu-strated in early studies on perturbed metabolic states. Inpioneering studies on the use of 13C-labelled acetate(metabolized only by glial cells) as precursor, a reso-nance attributable to citrate was observed in the spectra.This resonance was confirmed as citrate from the changein its chemical shift when Mg2þ was removed usingEDTA.18 Depolarization using high concentrations ofKþ resulted in large increases in the labelling of citrate,thus providing the first indication that citrate might beproduced predominately in glial cells.24 This was rapidlyconfirmed from studies which demonstrated that citrate isproduced and released from cultured glia.16
The occurrence of a resonance in the 13C-spectra ofseverely hypoxic brain tissue was tentatively identified asglycerol 3-phosphate from its chemical shift, and this wasconfirmed by its presence in 31P-spectra of the sameextracts.25 Chemical analyses for NADþ, NADH, lactateand glycerol 3-phosphate (Table 1) led to the conclusionssummarized in Fig. 1: under conditions of mild hypoxiathe build-up of NADH is regulated by the increasedproduction of lactate from pyruvate, but in severehypoxia the capacity of the lactate dehydrogenasebecomes limiting, so the increased NADH is oxidizedto form glycerol 3-P and the accumulating pyruvateis diverted to form alanine. It could be argued thereforethat, given sufficient improvement in signal–noise inhuman MR experiments in the future, glycerol 3-P andalanine may be better indicators of severe hypoxia thanlactate.
Contribution of the anaplerotic pathway
Evidence for the participation of the anaplerotic pathwaywas obtained from the incomplete labelling of glutamateobserved by many investigators. The pathways of meta-bolism from 1-13C glucose18 show that label will beincorporated into the C-4 of glutamate in the first roundof the TCA cycle, and that positions C-2 and C-3 will alsobe labelled in succeeding rounds. Whereas labelling ofthe C-3 of lactate can reach approximately 50%,24,25 theresults from numerous studies on brain extracts, culturedcells and in vivo, demonstrate that labelling of the C-4groups of glutamate and glutamine (and of the analogousC-2 of GABA) is well below 50% even after many hoursof incorporation, and that the labelling of the C-2 and C-3positions of glutamate and glutamine never reaches thatof the C-4 (Figs 2 and 3), indicating ‘dilution’ of the 13Cwith unlabelled precursors after entry of pyruvate to theTCA cycle.16, 28–30 The incomplete labelling of theglutamate was confirmed by gas chromatography/massspectrometry showing that the results could not beattributed to the presence of part of it in an MR-invisiblepool.29
Whereas the identity of an unlabelled precursor has notbeen confirmed, the evidence to date suggests that it mayarise from unlabelled oxaloacetate or aspartate, resultingfrom fixation of unlabelled CO2. Some approach toaddressing this possibility is based on direct studies onthe anaplerotic pathway, which involves carboxylation ofpyruvate or of phosphoenolpyruvate to form oxaloace-tate. The pyruvate carboxylase activity (PC), thought tobe the main route in the brain and occurring exclusivelyin glia,31 can be assessed from the use of [2-13C] glucose,which labels the C2 and C3 positions of glutamate andglutamine. In contrast, metabolism via the main oxidativeroute (pyruvate deydrogenase, PDH) will label the C1and C5 positions (Fig. 4).18 The PC/PDH ratio cantherefore be calculated from the labelling ratios,(C2þC3)/(C1þC5). Almost identical results are ob-tained from the C3/C5 ratio.32,33
The results showed that the PC/PDH ratios in corticalslices were 5.6, 13.5 and 10% for glutamate, glutamineand GABA, respectively, also indicating that glutamineand some of the GABA are derived essentially from theglial glutamate pool (discussed further below). The PC/PDH ratios after depolarisation were slightly lower for
Table 1. Effects of hypoxia on intermediary metabolites
Conditiona NADH NADþ NADH/NADþ Glyc.3-P %13C in Glyc. 3Pb Lac Ala
Control 0.043� 0.003 0.301� 0.017 0.14 0.03� 0.02 U.D. 1.5� 0.2 0.16� 0.01Mild hypoxia 0.055� 0.011 0.336� 0.069 0.16 0.08� 0.03 U.D. 2.8� 0.9* 0.20� 0.02Severe hypoxia 0.089� 0.013** 0.315� 0.012 0.30** 0.76� 0.21** 16.1� 2.8** 2.9� 0.7* 0.51� 0.02**
a Control conditions: O2/CO2; mild hypoxia: air/CO2; severe hypoxia: N2/CO2. Values are mmol/100 mg protein, except forb, which is the percentage13C-enrichment; number of experiments, four to–10.Significantly different: *from control values; ** also from mild hypoxia.Data from Badar-Goffer et al.,24 Ben-Yoseph et al.,25 Garofalo et al.26 and Ben-Yoseph.27
304 P. MORRIS AND H. BACHELARD
Copyright # 2003 John Wiley & Sons, Ltd. NMR Biomed. 2003;16:303–312

glutamate and GABA (4.5 and 7.2%), respectively, andsimilar for glutamine (14.2%), suggesting that the stimu-lation of glucose metabolism caused by depolarisation inglia was not due to increased activity via the anapleroticpathway. This approach is dependent on obtaining goodsignal–noise, especially in C1 and C5 with their long T1
relaxation times, and is therefore more difficult to applyin vivo.
Glial vs neuronal metabolism
The results discussed above give some idea of theparticipation of the anaplerotic pathway via pyruvatecarboxylase, but provide little assessment of the propor-tion of glucose metabolism attributable to glia. In thenormal brain there is very little acetate available andthe glial cells will be utilizing glucose, either directly viathe TCA or indirectly as lactate produced from theneurones. In human studies use of 13C-acetate has con-firmed that some 15–20% of glutamine is derived fromglial use of acetate,21,22 but in these in vivo studies it canbe argued that glucose will also be being utilized in thepresence of the infused acetate (as is also the case in the
in vitro superfusion studies using acetate as sole labelledprecursor).
An alternative approach has been based on isotopomeranalysis34 of ‘triple-labelled precursors’, i.e. [1-13C]glucose plus [1,2-13C] acetate.35,36 Analysis of the 3,4,5and 4,5 multiplets of C4 reflects label from [1,2-13C]acetate whereas other multiplets of C4 (3, 4 and 4) reflectthat from [1-13C] glucose. Thus acetate:glucose ratios forglutamate and glutamine are calculated from [(3, 4,5)þ (4,5)]/[(3, 4)þ (4)] of the multiplets of the C4resonances. The multiplets of C2-GABA can be analysedsimilarly, i.e. ([1, 2, 3]þ [[1,2])/([2, 3]þ [2]). Themethod has the advantage that steady states can beused, with relatively high signal–noise since the reso-nances are all –CH2 groups of short T1 values, so goodresolution of the multiplets is feasible. The results fromour studies on superfused cerebral slices (Table 2) in-dicated that almost 40% of the glutamate and GABAlabelling was derived from acetate, whereas significantlymore of the glutamine was labelled from acetate, as mightbe expected since glutamine synthesis occurs in glialcells.36 The time course of changes in the ratios showedthat these reached a maximum at around 90 min and wereunchanged for up to 3 h.
Figure 1. Labelling of glycerol 3-P from 1-13C glucose and the effects ofhypoxia on the cytoplasmic redox state
13C-MRS AND RESEARCH ON BRAIN METABOLITES 305
Copyright # 2003 John Wiley & Sons, Ltd. NMR Biomed. 2003;16:303–312
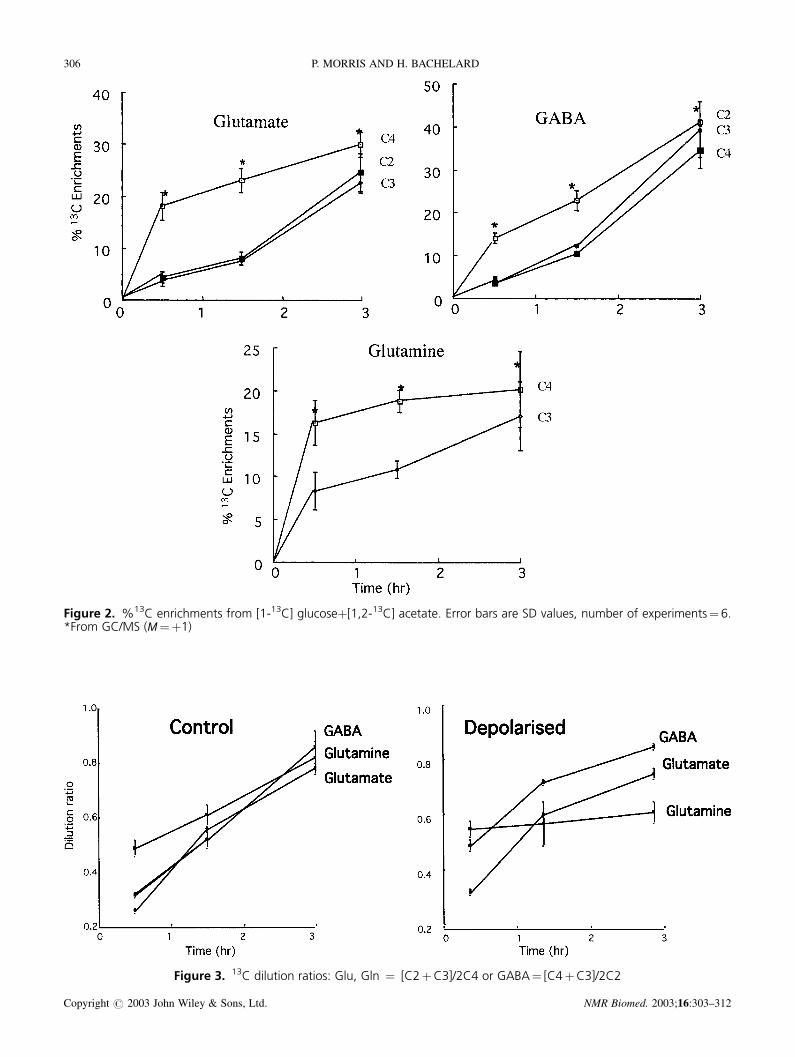
Figure 2. %13C enrichments from [1-13C] glucoseþ[1,2-13C] acetate. Error bars are SD values, number of experiments¼6.*From GC/MS (M¼þ1)
Figure 3. 13C dilution ratios: Glu, Gln ¼ [C2þC3]/2C4 or GABA¼ [C4þC3]/2C2
306 P. MORRIS AND H. BACHELARD
Copyright # 2003 John Wiley & Sons, Ltd. NMR Biomed. 2003;16:303–312

The labelling of glutamine will be in part deriveddirectly from the glutamate produced from acetate inthe glial cells, and partly due to conversion from theglutamate produced in the neurones, which is thentransferred to the glia where glutamine production oc-curs. Depolarization caused little change in the acetate:glucose ratio of glutamate, with considerable decreases inthose of GABA and glutamine, which is in line withprevious suggestions that depolarization increases meta-bolic rates of glucose mainly in glial cells.24
Glial glutamine and the formation of GABA
The change in labelling of GABA and glutamine ondepolarisation (from the acetate:glucose ratios discussedabove) adds to the growing evidence that part of theGABA pool is derived from glial glutamine. This wasfirst suggested from the studies of Fonnum’s group,37 andis further implied by its labelling via the anapleroticpathway (where it was closer to that of glutamine thanof glutamate, described above). More direct confirmationhas emerged from studies on the effects of fluoro-acetateon mouse brain in vivo.38 The ‘triple-label’ approachdescribed above was used, i.e. [1-13C] glucose plus[1,2-13C] acetate, compared with unlabelled glucoseplus [1,2-13C] acetate.
The specificity of the toxic effects of fluoroacetate onglial metabolism was confirmed from the increasedlabelling of citrate from [1,2-13C] acetate, but the label-ling of the C-4 of glutamine demonstrated that the glialcells were still capable of performing the glutamate/glutamine cycle. The most interesting results came
Figure 4. Pathways for metabolism via pyruvate carboxylase (PC) vs pyruvate dehydrogenase (PDH)
Table 2. Acetate/glucose ratios from isotopomer ana-lyses after incubation with 5mM [1-13C] glucoseþ5mM
[1,2-13C] acetate
Conditions C-4 Glu C-4 Gln C-2 GABA
Control 0.38 (23)� 0.08 1.14 (6)� 0.12 0.37 (16)� 0.09Depo 0.33 (23)� 0.09 0.46 (19)� 0.10* 0.16 (16)� 0.06*
For glutamate or glutamine: ([3,4,5]þ [4,5])/([3,4-]þ [4]); for GABA:([1,2,3]þ [[1,2])/([2,3]þ [2]).Values are mean (n)� SD after superfusion for 90 min.* p< 0.05 vs control.
13C-MRS AND RESEARCH ON BRAIN METABOLITES 307
Copyright # 2003 John Wiley & Sons, Ltd. NMR Biomed. 2003;16:303–312

from the labelling of the [1,2-13C] isotopomer of GABA(which can only be derived from [1,2-13C] acetate): thiswas completely abolished in the presence of the toxin,thus providing clear evidence that part of the GABA musthave been derived from the glial glutamine pool.
Studies on metabolic rates in the human brain
The studies on animal brain tissues described aboveprovided a basis for applications of 13C MRS to thehuman brain. This was first achieved in 1991,39 at 1.5 Tfollowing [1-13C]glucose administration and, subse-quently, Gruetter et al.40 achieved a time resolution of4 min, enabling them to follow the incorporation of 13Clabel from [1-13C]glucose into glutamate, glutamine andaspartate. These results were later analysed by Masonet al.42 to derive estimates for the rates of the TCA cycle(FTCA), glucose utilization, �-oxoglutarate/glutamate ex-change and glutamine synthesis.
There have been relatively few 13C measurements ofthe resting TCA cycle rate in the human brain, but there isgood agreement between them, with a mean value ofabout 0.74mmol min�1 g�1 (Table 3). There is also rea-sonable agreement with the few measurements by FDG-PET of the cerebral metabolic rate for glucose, CMRglc,of the order of 0.3 to 0.4mmol min�1 g�1:46,47 if glucoseis the sole substrate and is consumed aerobically, thisshould be about half the TCA cycle rate (each glucosemolecule generates two acetyl units). This agreementsuggests that under resting conditions, cerebral metabo-lism is essentially aerobic.
Activation results in significant changes in regionalcerebral blood flow (CBF) and CMRglc. A widely quotedPET study has reported increases in CBF of 50% and inCMRglc of 51% in the human primary visual cortex.47
However, both in that study, and in an earlier one of thesomatosensory cortex,48 the increase in the cerebralmetabolic rate for oxygen (CMRO2) was much less(below 5%). This has led to the idea of an oxidativeuncoupling during activation. If glucose is consumedanaerobically, then lactate production should increase,and there is some evidence for this from 1H-MRS studiesof the visual cortex (see, for example, Prichard et al.49).However, in an organ well equipped for oxidative
metabolism, uncoupling is likely to be a transitory effectbefore oxygen delivery can increase, such as that thoughtto be responsible for the ‘deoxy-dip’ in the initial bloodoxygen level dependent (BOLD) response in functionalMRI.50 An alternative possibility is that the excessglucose is stored as glycogen, although again it seemsstrange that the brain would store energy reserves at atime of increased energy demand (discussed below).
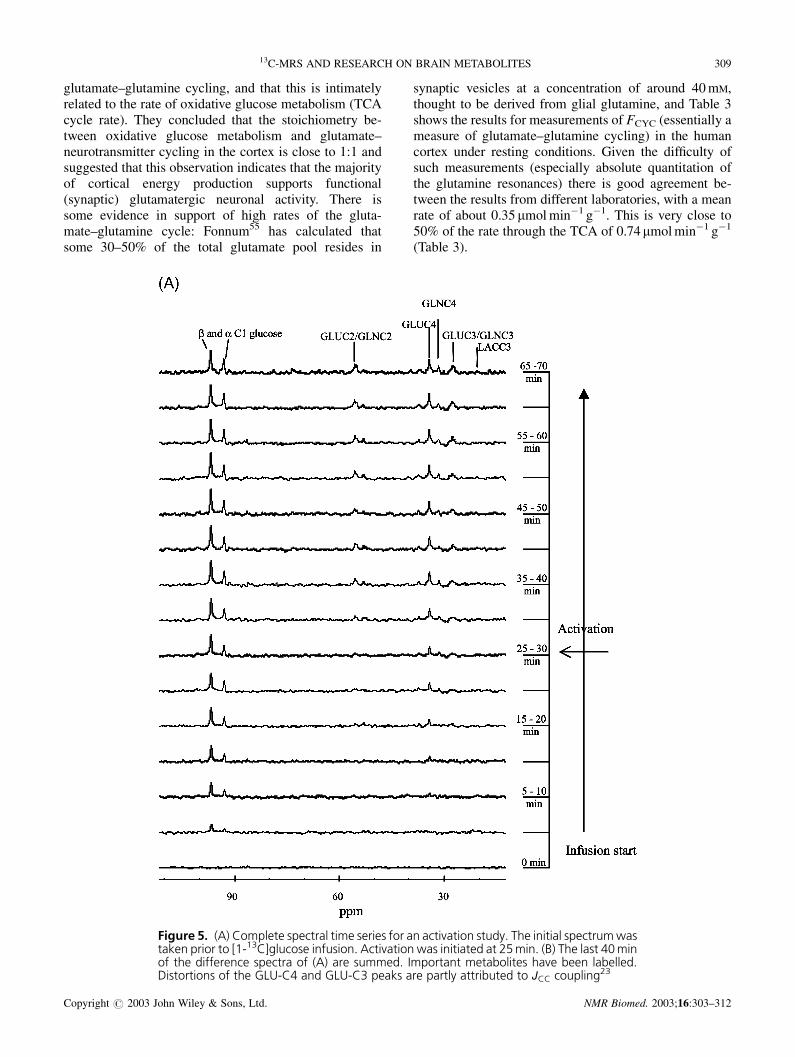
Chen et al.51 have reported a 1H–{13C} indirect detec-tion study of the changes in TCA cycle rate in the humanvisual cortex on visual stimulation. A problem with suchexperiments is the known inter-subject variability of TCAcycle rate, which Chen et al. avoided by stimulating onehalf of the visual field, using the other half as a simulta-neous control. This is an elegant solution, but thereremains the possibility of ‘cross talk’ between visualfields, and this could in part account for the modestdifference they report in time courses for the active andcontrol regions of the primary visual cortex (V1). Wehave taken a more straightforward approach, using direct13C-MRS to excite the entire visual field. The visualstimulus commenced approximately 25 min into thestudy to enable the basal rate to be determined in thesame experiment (Fig. 5). Analysis of the MRS time-courses in two volunteers revealed increases in FTCA
from 0.60� 0.10 to 0.94� 0.03mmol min�1 g�1 (56%)and from 0.34� 0.14 to 0.56� 0.07mmol min�1 g�1
(65%).23 These are similar to the increases in CMRglcreported in the PET studies, but strongly suggest, incontrast to these studies, that cerebral glucose is meta-bolized oxidatively, even during intense visual stimula-tion. This is supported by the large increase in CMRO2
seen in anaesthetized rats on forepaw stimulation.52
It is supported also by the 13C spectrum shown inFig. 5(B), generated from a 40 min period of visualactivation, where virtually no label can be detected inthe C3 lactate resonance. This suggests that the increasein the aerobic rate of metabolism is consistent with theincrease in CMRglc. Neither under basal conditions norduring strong activation did label accumulate to anysignificant extent in lactate. This calls into question itsrole in substrate shuttling between glia and neurones,unless, as has been suggested, its production by glia isvery closely coupled to its consumption by neurones.(Note however that this situation may well be verydifferent in patient groups such as stroke victims in whichblood supply and hence oxygen delivery is compro-mised.) There is evidence for some metabolism of glu-cose to glycogen even under activation conditions, seen,for example, in the small glycogen-C1 peak just down-field of the � C1-glucose resonance in Fig. 5(B). Gruet-ter’s group53 have also detected a very slow turnover ofglycogen in the resting human brain. However, theseresults and ours do not significantly affect the conclusionthat cerebral glucose metabolism is essentially oxidative.
Sibson et al.54 have reported that in rats 80–90% ofthe glutamine synthase flux can be attributed to
Table 3. Literature results for metabolic rates: lmolmin.�1 g�1�SD (n)
FTCA FCYC Reference
0.5 (1) 410.73� 0.19 (5) 0.47� 0.26 (4) 420.77� 0.07 (6) 0.32� 0.05 (6) 43
0.4� 0.1 (4) 440.75� 0.08 (3) 0.25� 0.08 (3) 23
0.32� 0.07 (8) 210.70� 0.20 (5) 45
308 P. MORRIS AND H. BACHELARD
Copyright # 2003 John Wiley & Sons, Ltd. NMR Biomed. 2003;16:303–312
glutamate–glutamine cycling, and that this is intimatelyrelated to the rate of oxidative glucose metabolism (TCAcycle rate). They concluded that the stoichiometry be-tween oxidative glucose metabolism and glutamate–neurotransmitter cycling in the cortex is close to 1:1 andsuggested that this observation indicates that the majorityof cortical energy production supports functional(synaptic) glutamatergic neuronal activity. There issome evidence in support of high rates of the gluta-mate–glutamine cycle: Fonnum55 has calculated thatsome 30–50% of the total glutamate pool resides in
synaptic vesicles at a concentration of around 40 mM,thought to be derived from glial glutamine, and Table 3shows the results for measurements of FCYC (essentially ameasure of glutamate–glutamine cycling) in the humancortex under resting conditions. Given the difficulty ofsuch measurements (especially absolute quantitation ofthe glutamine resonances) there is good agreement be-tween the results from different laboratories, with a meanrate of about 0.35mmol min�1 g�1. This is very close to50% of the rate through the TCA of 0.74mmol min�1 g�1
(Table 3).
Figure 5. (A) Complete spectral time series for an activation study. The initial spectrumwastaken prior to [1-13C]glucose infusion. Activation was initiated at 25min. (B) The last 40minof the difference spectra of (A) are summed. Important metabolites have been labelled.Distortions of the GLU-C4 and GLU-C3 peaks are partly attributed to JCC coupling23
13C-MRS AND RESEARCH ON BRAIN METABOLITES 309
Copyright # 2003 John Wiley & Sons, Ltd. NMR Biomed. 2003;16:303–312

Much of the energy required for glutamate neurotrans-mission is to support action potentials and postsynapticeffects;56 it seems likely that these will not be constantbut will vary according to local conditions of activation.These considerations can lead to the conclusion that,while the activity of the glutamate–glutamine cycle isperhaps higher than had been previously thought (i.e.about half that of the TCA), it would seem less likely thatthe glutamate–glutamine cycle, from which neurotrans-mitter glutamate is recycled, is stoichiometricallycoupled to glucose consumption on a 1:1 basis, as hasbeen suggested.54,57 However, it remains possible that theflux through this pathway, FCYC, could still provide aquantitative measure of brain activity, at least to theextent that it is mediated by excitatory activity, ratherthan release of inhibitory processes.
The above discussion relates essentially to glutamate-mediated excitatory neurotransmission. Labelling from[1-13C] glucose can also be seen in GABA, the principalinhibitory neurotransmitter, and there is increasing inter-est in this labelling pathway, some of which is derivedfrom glial metabolism via glutamine, discussed above.Although inhibitory neurotransmitter activity is believedto be energetically less costly than excitatory activity,there is as yet no established quantitative link betweenGABA labelling and inhibitory activity. The relevantGABA C-2 resonance lies at 35.4 ppm, very close tothe glutamate C-4 at 34.7 ppm; the current resolvingpower available for human MRS studies does not allowclear resolution or quantification of the GABA C-2 whichcan sometimes be detected as a shoulder on the Glu C-4resonance. However it is likely that technical improve-ments in the future will enable 13C MRS to furnishquantitative estimates of such inhibitory activity.
Acknowledgements
We would like to acknowledge all of our colleagues, pastand present, at the Magnetic Resonance Centre andelsewhere at the University of Nottingham who havecontributed to the work reviewed in this paper. We wouldalso like to acknowledge the support of the MedicalResearch Council and the Wellcome Trust, who werethe principal sponsors of this work.
REFERENCES
1. Nier AO, Gulbranson EA. Variations in the relative abundance ofthe carbon isotopes. J. Am. Chem. Soc. 1939; 61: 697–698.
2. Nier AO. The concentration of carbon 13 by thermal diffusion.Phys. Rev. 1940; 57: 30.
3. Wood HG, Werkman CH, Hemingway A, Nier AO. Heavy carbonas a tracer in bacterial fixation of carbon dioxide. J. Biol. Chem.1940; 135: 789–790.
4. Bachelard HS. Landmarks in the application of 13C-Magneticresonance spectroscopy to studies of neuronal/glial relationships.Dev. Neurosci. 1998; 20: 277–288.
5. Lauterbur PC. 13C nuclear magnetic resonance spectra. J. Chem.Phys. 1957; 26: 217–218.
6. Becker ED, Farrar TC. Fourier Transform Spectroscopy. Science1972; 178: 361–368.
7. Eakin RT, Morgan LO, Cregg CT, Matwiyoff NA. Carbon-13nuclear magnetic resonance spectroscopy of living cells and theirmetabolism of a specifically labeled13C substrate. FEBS Lett.1972; 28: 259–264.
8. Matwiyoff NA, Needham TE. Carbon-13 NMR spectra of redblood cell suspensions. Biochem. Biophys. Res. Commun. 1972;49: 1158–1164.
9. Shulman RG, Brown TR, Ugurbil K, Ogawa S, Cohen SM, denHollander JA. Cellular applications of 31P and 13C nuclearmagnetic resonance. Science 1979; 205: 160–166.
10. Alger JR, Sillerud LO, Behar KL, Gillies RG, Shulman RG,Gordon RE, Shaw D, Hanley PE. In vivo carbon-13 nuclearmagnetic resonance studies of mammals. Science 1981; 214:660–662.
Figure 5. Continued
310 P. MORRIS AND H. BACHELARD
Copyright # 2003 John Wiley & Sons, Ltd. NMR Biomed. 2003;16:303–312

11. Behar KL, Petroff OAC, Prichard JW, Alger JR, Shulman RG.Detection of metabolites in rabbit brain by 13C NMR spectroscopyfollowing administration of [1-13C]glucose. J. Magn. Reson. Med.1985; 3: 911–920.
12. Rothman DL, Behar KL, Hetherington HP, den Hollander JA,Bendall MR, Petroff OA, Shulman RG. 1H-observe/13C-decouplespectroscopic measurements of lactate and glutamate in the ratbrain in vivo. Proc. Natl Acad. Sci. USA 1985; 82: 1633–1637.
13. Morris PG, Bachelard HS, Cox DWG, Cooper JC. 13C nuclearmagnetic resonance studies of glucose metabolism in guinea-pigbrain slices. Biochem. Soc. Trans. 1986; 14: 1720–1721.
14. Cerdan S, Kunnecke B, Seelig J. Cerebral metabolism of[1,2-13C2] acetate as detected by in vivo and in vitro 13C NMR.J. Biol. Chem. 1990; 265: 12916–12926.
15. Shank RP, Leo GC, Zielke HR. Cerebral metabolic compartmen-tation as revealed by nuclear magnetic resonance analysis of[1-13C]D-glucose metabolism. J. Neurochem. 1993; 61: 315–323.
16. Sonnewald U, Westergaard N, Krane J, Unsgard G, Petersen SB,Schousboe A. First direct demonstration of preferential release ofcitrate from astrocytes using [13C] NMR spectroscopy of culturedneurons and astrocytes. Neurosci. Lett. 1991; 128: 235–239.
17. Morris PG, Bachelard HS, Badar-Goffer RS. 13C-NMR study ofcerebral acetate metabolism: evidence for compartmentation.Abstracts from the 11th SMRM, New York, 1987; 526.
18. Badar-Goffer RS, Bachelard HS, Morris PG. Cerebral metabolismof acetate and glucose studied by 13C-NMR spectroscopy: atechnique for investigating metabolic compartmentation in thebrain. Biochem. J. 1990; 266: 133–139.
19. Edmond J, Clark J (eds). Symposium: functional aspects of energymetabolism in neural tissue. Dev. Neurosci. 1993; 15: 149–380.
20. Edmond J, Clark J (eds). Symposium: brain energy metabolism—molecules to man. Dev. Neurosci. 1996; 18: 329–554.
21. Lebon V, Petersen KF, Cline GW, Shen J, Mason GF, Dufour S,Behar KL, Shulman GI, Rothman DL. Astroglial contribution tobrain energy metabolism in humans revealed by 13C nuclearmagnetic resonance spectroscopy: elucidation of the dominantpathway for neurotransmitter glutamate repletion and measure-ment of astrocytic oxidative metabolism. J. Neurosci. 2002; 22:1523–1531.
22. Bluml S, Moreno-Tores A, Ross BD. Assessment of cerebralacetate oxidation and glial metabolism in human brain by 13C-MRS. NMR Biomed. 2002; 15: 1–5.
23. Chhina N, Kuestermann E, Halliday J, Macdonald IA, BachelardHS, Morris PG. Measurement of human tricarboxylic acid cyclerates during visual activation by 13C magnetic resonance spectro-scopy. J. Neurosci. Res. 2001; 66: 737–746.
24. Badar-Goffer RS, Ben-Yoseph O, Bachelard HS, Morris PG.Neuronal–glial metabolism under depolarizing conditions: a13C-NMR study. Biochem. J. 1992; 282: 225–230.
25. Ben-Yoseph O, Badar-Goffer RS, Morris PG, Bachelard HS.Glycerol 3-phosphate and lactate as indicators of the cerebralcytoplasmic redox state in severe and mild hypoxia respectively: a13C- and 31P-NMR study. Biochem. J. 1993; 291: 915–919.
26. Garofalo O, Cox DWG, Bachelard HS. Brain levels of NADH andNADþ under hypoxic and hypoglycaemic conditions in vitro. J.Neurochem. 1988; 51: 172–176.
27. Ben-Yoseph O. Multinuclear magnetic resonance spectroscopystudies of perturbed cerebral metabolism in vitro. PhD Thesis,University of Nottingham, 1991.
28. Fitzpatrick SM, Hetherington HP, Behar KL, Shulman RG. Theflux from glucose to glutamate in the rat brain in vivo asdetermined by 1H-observed, 13C-edited NMR spectroscopy. J.Cereb. Blood Flow Metab. 1990; 10: 170–179.
29. Badar-Goffer RS, McLean MA, Bachelard HS, Morris PG.Investigations into the incomplete labelling from 13C-glucose ofamino acids in the brain: a 13C-NMR study. Abstracts of the 11thSMRM Meeting, Berlin, 1992; 2107.
30. Shank RP, Leo GC, Zielke HR. Cerebral metabolic compartmen-tation as revealed by nuclear magnetic resonance analysis of[1-13C]D-glucose metabolism. J. Neurochem. 1993; 61: 315–323.
31. Shank RP, Bennett GS, Freytag SO, Campbell GL. Pyruvatecarboxylase: astrocytic-specific enzyme implicated in replenish-ment of amino acid transmitter pools. Brain Res. 1985; 329:364–367.
32. McLean MA, Badar-Goffer RS, Bachelard HS, Morris PG.Determination of pyruvate carboxylase flux in guinea-pig cerebral
cortical slices using 13C-MRS. Abstracts of the 12th SMRMMeeting, New York, 1993; 1516.
33. Taylor A, McLean M, Morris P, Bachelard H. Approaches tostudies on neuronal/glial relationships by 13C-MRS analysis. Dev.Neurosci. 1996; 18: 434–442.
34. Badar-Goffer RS, Bachelard HS. Metabolic studies using 13C-NMR spectroscopy. Essays Biochem. 1991; 26: 105–119.
35. Brand A, Liebfritz D. Metabolic markers in glial cells fordifferentiation of brain tissue. Abstracts of the 11th SMRM Meet-ing SMRM, Berlin, 1992; 649.
36. McLean MA, Badar-Goffer RS, Bachelard HS, Morris PG.Simultaneous measurement of neuronal and glial metabolismvia 13C-MRS isotopomer analysis. Abstracts of the 12th SMRMMeeting, New York, 1993; 511.
37. Paulsen RE, Odden E, Fonnum F. Importance of glutamine for �-aminobutyric acid synthesis in rat neostratum in vivo. J. Neuro-chem. 1988; 51: 1294–1299.
38. Hassel B, Bachelard H, Fonnum F, Jones P, Sonnewald U.Trafficking of amino acids between neurons and glia in vivo.Effects of inhibition of glial metabolism by fluoroacetate. J.Cereb. Blood Flow Metab. 1997; 17: 1230–1238.
39. Beckmann N, Turkalji I, Seelig J, Keller U. 13C NMR for theassessment of human brain glucose metabolism in vivo. Biochem-istry 1991; 30: 6362–6366.
40. Gruetter R, Novotny EJ, Boulware SD, Mason GF, Rothman DL,Shulman GI, Prichard JW, Shulman RG. Localised 13C NMRspectroscopy in the human brain of amino acid labelling from D-[1-13C]glucose. J. Neurochem. 1994; 63: 1377–1385.
41. Rothman DL, Novotny EJ, Shulman GI, Howseman AM, PetroffOAC, Mason G, Nixon T, Hanstock CC, Prichard JW, ShulmanRG. 1H-[13C] NMR measurements of [4-13C]glutamate turnoverin human brain. Proc. Natl Acad. Sci. USA 1992; 89: 9603–9606.
42. Mason GF, Gruetter R, Rothman DL, Behar KL, Shulman RG,Novotny EJ. Simultaneous determination of the rates of the TCAcycle, glucose utilisation, �-ketoglutarate/glutamate exchange,and glutamine synthesis in human brain by NMR. J. Cereb. BloodFlow Metab. 1995; 15: 12–25.
43. Shen J, Petersen KF, Behar KL, Brown P, Nixon TW, Mason GF,Petroff OAC, Shulman GI, Shulman RG, Rothman DL. Determi-nation of the rate of the glutamate/glutamine cycle in the humanbrain by in vivo 13C NMR. Proc. Natl Acad. Sci. USA 1999; 96:8235–8240.
44. Gruetter R, Seaquist ER, Kim S, Ugurbil K. Localized in vivo 13CNMR of glutamate metabolism in the human brain: initial resultsat 4 Tesla. Dev. Neurosci. 1998; 20: 380–388.
45. Halliday J. In vivo 13C MRS studies of carbohydrate metabolism.PhD Thesis, University of Nottingham, 2003.
46. Fox P, Raichle ME, Mintun MA, Dence D. Nonoxidative glucoseconsumption during focal physiologic neural activity. Science1998; 241: 462–464.
47. Reivich M, Alavi A, Wolf AP, Fowler JS, Russell J, Arnett HJ,MacGregor RR, Shive CY, Atkins H, Anand A, Dann R, Green-berg JH. Glucose metabolic-rate kinetic-model parameter deter-mination in humans—the lumped constants and rate constants for[F-18] fluorodeoxyglucose and [C-11] deoxyglucose. J. Cerebr.Blood Flow Metab. 1985; 5: 179–192.
48. Fox PT, Raichle ME. Focal physiological uncoupling of cerebralblood flow and oxidative metabolism during somatosensory sti-mulation in human subjects. Proc. Natl Acad. Sci. USA 1986; 83:1140–1144.
49. Prichard J, Rothman D, Novotny E, Petroff O, Kuwubara T,Avison M, Howseman A, Hanstock C, Shulman RG. Lactaterise detected by 1H NMR in human visual cortex during physio-logic stimulation. Proc. Natl Acad. Sci. USA 1991; 88: 5829–5831.
50. Menon RS, Ogawa S, Hu X, Strupp P, Anderson P, Ugurbil K.BOLD based functional MRI at 4 Tesla includes a capillary bedcontribution: echo-planar imaging correlates with previous opticalimaging using intrinsic signals. Magn. Reson. Med. 1995; 33:453–459.
51. Chen W, Xiao-Hong Z, Gruetter R, Seaquist ER, Adriany G,Ugurbil K. Study of tricarboxylic acid cycle flux changes inhuman visual cortex during hemifield visual stimulation using1H-{13C} MRS and fMRI. Magn. Reson. Med. 2001; 45: 349–355.
52. Hyder F, Chase JR, Behar KL, Mason GF, Siddeek M, RothmanDL, Shulman RG. Increased tricarboxylic acid cycle flux in rat
13C-MRS AND RESEARCH ON BRAIN METABOLITES 311
Copyright # 2003 John Wiley & Sons, Ltd. NMR Biomed. 2003;16:303–312
brain during forepaw stimulation. Proc. Natl Acad. Sci. USA 1996;93: 7612–7617.
53. Oza G, Henry P-G, Seaquist ER, Gruetter R. Direct, noninvasivemeasurement of brain glycogen metabolism in humans. Neuro-chem. Int. 2003; 43: 323–329.
54. Sibson NR, Dhankhar A, Mason GF, Rothman D, Behar KL,Shulman RG. Stoichiometric coupling of brain glucose metabo-lism and glutamatergic neuronal activity. Proc. Natl Acad. Sci.USA 1998; 95: 316–321.
55. Fonnum F. Neurochemical Studies on Glutamate-mediated Neu-rotransmission. Fidia Foundation Research Symposium Series V,Meldrum B, Moroni S, Symon RP, Woods JH (eds). Raven Press,New York. 1990; 15–25.
56. Attwell D, Iadecola C. The neural basis of functional brainimaging signals. Trends Neurosci. 2002; 25: 621–625.
57. Magistretti PJ, Pellerin L, Rothman DL, Shulman RG. Energy ondemand. Science 1999; 283: 496–497.
312 P. MORRIS AND H. BACHELARD
Copyright # 2003 John Wiley & Sons, Ltd. NMR Biomed. 2003;16:303–312