refining the wholesale pricing structure, products
TRANSCRIPT

Document Type: EA-Administrative Record Index Field: Final Environmental Document Project Name: 2015 Rate Change EA Project Number: 2015-27
REFINING THE WHOLESALE PRICING STRUCTURE, PRODUCTS, INCENTIVES AND
ADJUSTMENTS FOR PROVIDING ELECTRICITY TO TVA CUSTOMERS
FINAL ENVIRONMENTAL ASSESSMENT
PREPARED BY:
TENNESSEE VALLEY AUTHORITY Knoxville, Tennessee
JULY 2015
For additional information, contact: Charles P. Nicholson, PhD Tennessee Valley Authority
400 West Summit Hill Drive WT-11D Knoxville, TN 37902-1499
Phone: 865-632-3582 E-mail: [email protected]

Page intentionally blank

Contents
Environmental Assessment i
TABLE OF CONTENTS
1.0 PURPOSE OF AND NEED FOR ACTION ...................................................................................... 1
1.1. The Proposed Decision and Need ......................................................................................... 1 1.2. Background ............................................................................................................................ 2 1.3. Other Pertinent Environmental Reviews or Documentation ................................................... 5 1.4. The Scoping Process ............................................................................................................. 6 1.5. Necessary Permits or Licenses .............................................................................................. 6
2.0 ALTERNATIVES INCLUDING THE PROPOSED ACTION ............................................................ 7
2.1. The No Action Alternative ....................................................................................................... 7 2.2. The Proposed Action Alternative .......................................................................................... 11 2.3. Comparison of Alternatives .................................................................................................. 15 2.4. The Preferred Alternative ..................................................................................................... 15
3.0 AFFECTED ENVIRONMENT and ENVIRONMENTAL CONSEQUENCES ................................ 17
3.1. Framework for Environmental Impact Analyses - The Electric Power Industry, Need and Supply, and Sources of Impacts ............................................................................................ 17
3.2. Socioeconomics ................................................................................................................... 19 3.3. Energy Production and Use .................................................................................................. 20 3.4. Air Resources ....................................................................................................................... 21 3.5 Water Resources ................................................................................................................. 22 3.6 Land Use .............................................................................................................................. 24 3.7 Solid and Hazardous Waste Generation .............................................................................. 24 3.8 Summary of TVA Commitments and Proposed Mitigation Measures .................................. 26
4.0 LIST OF PREPARERS AND REVIEWERS………………………………….………………………..27
5.0 LITERATURE CITED .................................................................................................................... 29

2015 Rate Change
LIST OF APPENDICES
Appendix A – Wholesale Power Rates and Charges for Standard Service Customers ..................... 31
Appendix B – Wholesale Power Rates and Charges for Non-Standard Service Large Industrial and Commercial Customers ......................................................................... 32
Appendix C – Cost of Service as Basis for Refining Rates for Standard Service and Non-Standard Service Customers ....................................................................................... 36
LIST OF TABLES
Table 2-1. Current number of customers, their average on-peak interruptible megawatts and
value to customers participating in load curtailment programs .................................... 9
LIST OF FIGURES
Figure 1-1. Map of the Seven-State TVA Power Service Area and Distributors ................................ 4
Figure 3-1. General Framework for Environmental Impact Analysis of Rate Change Impacts ...... 18
ii Environmental Assessment

Chapter 1
Environmental Assessment 1
CHAPTER 1
PURPOSE OF AND NEED FOR ACTION
1.1. The Proposed Decision and Need The competitive and technological nature of the electric utility industry continues to evolve and impact the traditional electric utility business model through distributed generation, energy efficiency, technological advances, shifts in customer behavior and regulatory requirements. This complex interplay of factors creates a need for self-funded electric utilities such as TVA to make adjustments in their pricing structures, as well as generation and transmission assets. Identifying and appropriately apportioning costs of providing electrical service is an important factor in flexibly addressing this ongoing need. These costs vary hour by hour as well as by customer class, customer usage profile, type and location of load served. TVA is proposing to:
1) Refine the structure of its wholesale electric power rates, programs, pricing products, credits and billing adjustments to incentivize cost-saving behaviors to keep rates as low as feasible;
2) Maintain alignment with the cost of service (COS) to distributors and directly-served customers;
3) Improve competitiveness of industrial rates;
4) Align with least-cost planning; and
5) Simplify and create greater consistency in the suite of response and other power products offered by TVA.
The actions under consideration generally encompass changes to two areas: 1) general Pricing Structures and Rates for electricity; and 2) specific Products, Credits and Adjustments. Pricing Structures and Rates are proposed for two broad groups: 1) wholesale Standard Service (consisting of residential, commercial and small retail industrial customers served by distributors); and 2) those for large (generally over 5000 kW demand) Manufacturing and Commercial customers, which include individually-metered customers served by distributors under Non-standard Service provisions, and customers directly served by TVA. TVA’s Products, Credits and Adjustments further differentiate customers’ needs that are not addressed under the general rate structures. The changes proposed to the portfolio of products (Sections 2.2.2 through 2.2.5) under the Proposed Action Alternative were designed to be consistent with the proposed rate structures (Section 2.2.1).
1.2. Background
1.2.1. TVA’s Role in the Power Supply Region and Current Relationship to Customers
TVA is a self-financed, wholly owned corporate agency and instrumentality of the United States. TVA is a public power entity, has no shareholders and receives no appropriations (i.e., tax dollars).

2015 Rate Change
2 Environmental Assessment
Under the TVA Act of 1933, as amended, Congress tasked TVA with advancing the social and economic welfare of the residents of the Tennessee Valley region. TVA serves a region that consists of parts of seven southeastern states (Figure 1-1). One of the most important ways that TVA fulfills its congressional mandate is by providing reliable, affordable electric power to its Municipal and Cooperative customers, consisting of 155 distributors (also known as local power companies). These distributors take delivery of electricity generated and transmitted by TVA and perform the local distribution function for their approximately 9.7 million retail consumers of electricity. TVA also sells power to approximately 50 directly served retail customers with large or unusual power requirements. TVA’s wholesale rates for distributors recover its generation and transmission costs, while distributor retail rates recover their wholesale power cost from TVA plus their own system costs of local distribution and delivery to end users. TVA’s success is measured by its effectiveness in meeting the public needs, rather than in creating financial wealth for private shareholders. TVA’s ability to serve its customers at competitive wholesale power prices is critical to the success of TVA in accomplishing its mission of fostering a strong regional economy and a good quality of life.
In 2011, TVA changed its pricing structures to send better price signals and more accurately reflect changes in power supply costs over time. This involved replacing the ‘End Use Wholesale’ rate that included prices fixed across the year with the choice of wholesale demand and energy rates that included seasonal or time of use price differentials. In addition, the wholesale demand and energy rates implemented in 2011 restored the price incentive for distributors to undertake load management activities, such as voltage control, at the local level. The October 2015 rate change proposals would further enhance pricing structures with respect to sending pricing signals. TVA will continue to take incremental steps in the future to improve the pricing structure when and as appropriate. 1.2.2. TVA Rate Setting Authority, Policies, and Procedures
The TVA Act delegates to the TVA Board of Directors sole responsibility for establishing the rates charged to distributors and other customers for electric power supplied by TVA, as well as broad authority over distributor resale rates and conditions of service. As such, TVA not only provides electrical power to the distributors, but acts in a congressionally mandated regulatory retail rate-setting role for them. The TVA Board of Directors exercises its rate responsibility within the framework of, and for carrying out, the underlying policies and requirements of the TVA Act including those in Sections 10, 11, and 15(d) of the Act.
Section 10 of the TVA Act authorizes the TVA Board of Directors “to include in any contract for the sale of power such terms and conditions, including resale rate schedules, and to provide for such rules and regulations as in its judgment may be necessary or desirable for carrying out the purposes of this Act.”
Under Section 11 of the TVA Act, power projects are to “be considered primarily as for the benefit of the people” of the region as a whole, particularly the “domestic and rural” consumers to whom the power can economically be made available. As part of the bond financing amendment to the TVA Act in 1959, Congress directed TVA to: charge rates that produce gross revenues sufficient to provide funds for operation, maintenance, and administration; provide payments to states and counties in lieu of taxes; provide debt service on bonds; provide payments to the United States Treasury for repayment of past government appropriations plus an additional return; provide additional margin for investment in power system assets; and for other purposes connected with TVA’s power business [TVA Act, Section 15(d)].

Chapter 1
Environmental Assessment 3
While the TVA Board of Directors exercises the responsibility to establish rates, which in its judgment will best implement the various policies and requirements of the TVA Act, procedures governing adjustments and changes in rates have been developed jointly and agreed to by the distributors and TVA. These procedures are set forth in a section entitled “Adjustment and Change of Wholesale Rate and Resale Rates” in the Schedule of Terms and Conditions that is a part of the power contract with each distributor. This section provides that the wholesale rate and resale rates in the power contract are subject to adjustment and change from time to time “in order to assure TVA's ability to continue to supply the power requirements of [the distributor] and TVA's other customers on a financially sound basis with due regard for the primary objectives of the TVA Act, including the objective that power shall be sold at rates as low as feasible, and to assure [distributor]'s ability to continue to operate on a financially sound basis.” It further provides that “wholesale power rates and charges shall be sufficient to produce revenue from TVA's wholesale power customers, which, together with revenue from its other power customers, will assure TVA's ability each fiscal year to:
Meet the requirements of the TVA Act . . . and
Meet all tests and comply with the provisions of TVA's bond resolutions . . . in such a manner as to assure its ability to continue to finance and operate its power program at the lowest feasible cost.”
TVA’s current wholesale rate structure and associated programs must from time to time be altered to reflect cost of service and remain competitive within the market as well as to encourage distributors to manage their peak demands for electricity. Under TVA’s contracts with distributors, there are different processes for making “rate adjustments” and making “rate changes.” A “rate adjustment” is the process by which TVA increases or decreases rates to match revenue needs. Following the rate review procedures set forth in the wholesale power contracts, the TVA Board of Directors can adjust the demand and energy charges in the wholesale and resale rate schedules as necessary to assure adequate revenues to TVA and to provide adequate compensating revenues to the distributors. A “demand charge” is the fee based on the peak amount of electricity (in kilowatts or megawatts) used during a billing cycle. An “energy charge” is the fee for electric service based on electricity consumed by kilowatt-hour (kWh). Rate adjustments are implemented by an across-the-board adjustment percentage to all applicable rate schedule charges, and tend to have reasonably comparable impacts across all customer classes. A “rate change” is a process by which TVA changes the structure of the rates as opposed to the overall level of rates. Rate changes generally are designed to be “revenue neutral” to TVA at the system level, i.e., the changed rates applied to the same billing data are intended
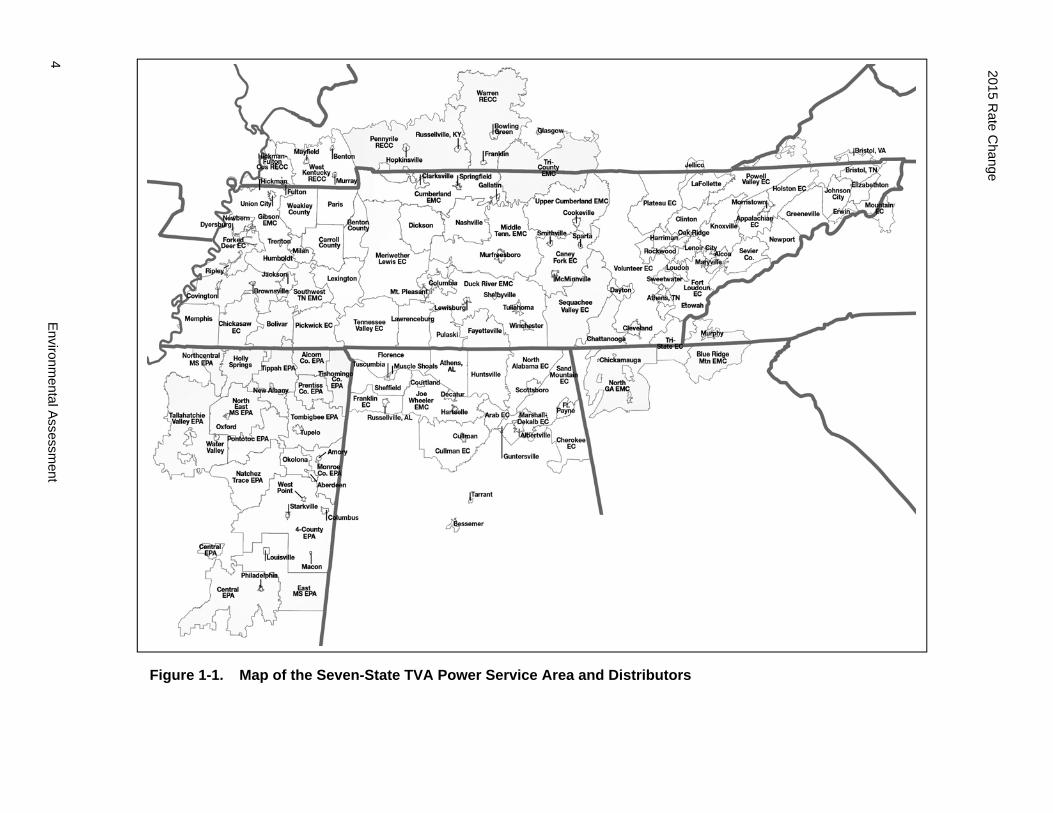
Figure 1-1. Map of the Seven-State TVA Power Service Area and Distributors
2015 Rate C
hange
4 E
nvironmentalA
ssessment

Chapter 1
Environmental Assessment 5
to result in the same overall system level revenue being collected by TVA, although revenues paid by individual customers or customer classes may change. Under the TVA distributor contracts, either TVA or a distributor may request that the parties meet and endeavor to reach agreement upon changes to the contract’s Schedule of Rate and Charges. If the parties cannot reach agreement on the changes within 180 days, TVA may thereafter, upon 30 days’ notice, place into effect such changes as TVA determines will enable it to carry out the objectives of the TVA Act and meet the requirements and tests of TVA’s bond resolutions. While rate adjustments tend to have similar impacts across customer classes, rate changes can involve changes in cost allocation and rate structure that can raise power bills for some customers and lower them for others, with an overall revenue neutral impact to TVA.
1.3. Other Pertinent Environmental Reviews or Documentation This EA tiers from TVA’s 2011 Environmental Impact Statement (EIS) for TVA’s Integrated Resource Plan (TVA 2011), in which TVA identified and selected a long-range strategy to enable TVA to meet the additional needs of its customers for electricity for the subsequent 20 years. It also tiers from TVA’s Integrated Resource Plan 2015 Final Supplemental Environmental Impact Statement (TVA 2015) which describes the TVA power system and the anticipated impacts of its future operation. The information utilized for the assessment of effects from the presently-proposed rate change reflects and encompasses the most current data and information available to TVA.
Other pertinent National Environmental Policy Act (NEPA) documents include: Elimination of End-use Wholesale Rate Structure and Introduction of Time-Of-Use Pricing of Electricity at the Wholesale Level - Final Environmental Assessment. (TVA 2010) Public Utility Regulatory Policies Act (PURPA) Standards - Environmental Assessment (TVA 2007) Modification of Rate Structure for Pricing of Wholesale Electricity to Distributors Within the TVA Power Service Area - Final Environmental Assessment (TVA 2003)
Alternative Electric Power Rate Structures - Final Environmental Impact Statement (TVA 1980)
Policies Relating to Electric Power Rates Final Environmental Impact Statement, Volumes 1 and 2 (TVA 1976)
Each of the reviews discussed aspects of TVA’s fundamental rate structure and customer classes and its historical relationship with the electricity sellers (the distributors) and consumers of the Tennessee Valley region. The most recent of the EAs (TVA 2010) introduced and assessed the environmental effects of the current time-of-use rate structure.

2015 Rate Change
Environmental Assessment
6
Both the 1976 and 1980 EISs and the EAs concluded that the timing and magnitude of resulting impacts on the physical environment (the air, water, land, and other primary natural resources) were somewhat speculative, primarily because rate change (and rate adjustment) effects on the physical environment depend on numerous decisions to be made by persons and entities outside TVA’s control. Despite these uncertainties, the EISs and the EAs concluded that in all likelihood any resulting physical environmental impacts would be insignificant. These documents are public records and available on the TVA public website at www.tva.gov under archived “Environmental Reviews” or from TVA by written request or e-mail to [email protected].
1.4. The Scoping Process By letters to all distributors dated January 30, 2015, TVA initiated the rate change process. This notification was made in accordance with the rate change provisions of the existing TVA power contracts. The January 30 notification initiated a process for meeting with distributors and endeavoring to reach agreement on the rate change proposal, as well as discuss related products, incentives and adjustments. TVA has now met with distributors and directly-served customers numerous times to discuss a number of proposed changes to the current wholesale rate structure and alterations to associated TVA programs. These meetings, including presentations, discussions, and listening sessions, have aided in the scoping of issues and alternatives considered for this EA and provide important public input to the process.
Additionally, these current changes were considered in light of the Time-Based Metering and Communication standard adopted by the TVA Board in 2007 as part of its consideration of the PURPA Standards set forth in the Public Utility Regulatory Policies Act of 1978 as amended by the Energy Policy Act of 2005 et seq. The TVA Board considered these standards in accordance with PURPA and the objectives and requirements of the Tennessee Valley Authority Act of 1933 and after review of the official record developed from the public’s input on the standards.
1.5. Necessary Permits or Licenses There are no federal permits or licenses required for TVA to undertake this action.
Environmental Assessment
Chapter 2
7
CHAPTER 2
ALTERNATIVES INCLUDING THE PROPOSED ACTION
This section describes the No Action Alternative and the Proposed Action Alternative. These alternatives reflect the outcome of discussions with distributors and directly served customers over the preceding months.
2.1. The No Action Alternative
2.1.1 Pricing Structures and Rates
Wholesale
The wholesale rate schedule applicable to distributors currently involves two components, the first for Standard Service and the second for Non-Standard Service. Non-Standard Service includes power delivered to large commercial and manufacturing customers with power demands over 5,000 kW (and approximately 150 customers with contract demands between 1,000 kW and 5,000 kW that are served under a time of use structure). This power usage is removed from the distributors’ total demand and energy and billed separately at the Non-Standard Service wholesale rates. This is designed specifically to recover generation and transmission costs for these loads. Standard Service includes the rest of the distributor’s power usage, which includes sales to residential customers and smaller commercial and manufacturing customers.
Wholesale Standard Service
Currently, distributors have a choice of a Nearly Flat Time of Use (NFTOU), a Time of Use (TOU), or Seasonal Demand and Energy (SDE) rate structure. The two TOU rate structures share the same seasonal periods and on-peak/off-peak hours. One TOU rate structure has pricing differentials which are greater than the other. Of the 155 distributors, 148 are on the TOU structure with greater pricing differentials, 2 are on the NFTOU structure, and 5 are on the SDE structure. In 2010, TVA changed to a wholesale structure which included the NFTOU and a demand and energy structure. In 2012, TVA offered these options for pricing structures to distributors. The TOU structure uses pricing signals to encourage and compensate customers for shifting loads (demand for electricity) from high cost periods (on-peak) to lower cost periods (off-peak). For distributors that opted for the SDE structure, pricing signals vary by season, but they do not have the intra-day (on-peak–off-peak) differentials in price of the TOU structure. Seasons for both the No Action and the Proposed Action Alternatives are defined as follows: Summer months are June, July, August and September; Winter months are December, January, February and March; and Transition months are April, May, October and November.
Wholesale Non-Standard Service
For distributors that serve large customers in the Non-Standard Service group, the applicable wholesale rate depends on the rate election of the retail customers. For these retail customers, there is a choice between time of use or seasonal demand and energy structures. The wholesale rate schedule includes corresponding time of use and seasonal

Environmental Assessment
2015 Rate Change
8
demand and energy rates that are billed to the distributor for wholesale changes consistent with the retail structure being applied.
Retail
Retail rates are applied to the final end user of power, differing from a wholesale customer such as a distributor. In the Tennessee Valley, the vast majority of retail customers are customers of Municipal and Cooperative distributors of TVA power.
Retail rates for distributor served residential and small commercial (below 50 kW demand), currently have a structure where both demand and energy wholesale cost is recovered through an all-energy (kWh) billed retail rate structure with seasonal differentials reflecting the seasonality in wholesale rates. Medium-sized commercial and manufacturing customers (1,000-5,000 kW demand) have demand and energy rate structures, also with seasonal differentials. Rate components to recover distributor’s local distribution costs are included in retail rate components for all customer classes, and all rate classes also include a fixed dollar per month customer charge to recover metering and billing costs that do not vary with the amount of power used. There are optional time of use rates available to many of these retail customer classes, although they currently see very limited use. The retail classes described in this paragraph are priced at wholesale through the Standard Service portion of TVA’s wholesale rate.
For large commercial and industrial (demand over 5,000 kW) customers who are served by distributors, wholesale charges are assessed under the Non-Standard Service section of the wholesale rate schedule. The default retail rate structure for these customers is a time of use structure, but most of these customers have currently opted for a season demand and energy optional offering. TVA directly served customers have the same retail rate structure options available to them, and most of them have also opted for the SDE option. The actual retail rates for distributor and directly served large commercial and manufacturing customers are very similar, with only minor differences attributable to differences in the amount of distribution cost recovery built into the retail rates.
For the No Action Alternative both distributors and retail customers could remain on their existing rate structures. TVA would continue its current rate options (default Time of Use structures and optional Seasonal Demand and Energy pricing structures). These rate structures are described in detail (as the proposed action alternative) in TVA’s 2010 EA for introducing the TOU structure. Retail customers in the Valley, including TVA directly served customers, would also continue with their current retail rate structures.
2.1.2 Response Products
To assist in meeting high or extreme peak demand for power, TVA has the ability to curtail (reduce) load (demand for power) for limited periods of time through contractual arrangements with particular businesses to “interrupt” their power supply under agreed upon conditions. Under the No Action Alternative TVA would also continue with its current suite of response products and programs. TVA’s current response products include those termed: 5 Minute Response (5 MR); 60 Minute Response (60 MR); Reserve Preservation (RP); Demand Response Auctions (DRA); Instantaneous Response; and Energy Buyback. These response products provide customers with an opportunity to receive a monthly credit priced consistent with the terms of the product in exchange for curtailing their load upon request by TVA (e.g., if a customer can eliminate their agreed upon load in either five

Environmental Assessment
Chapter 2
9
minutes (5 MR) or 60 minute (60 MR) periods). Reserve Preservation provides participating commercial and industrial customers with credits on their power bills in exchange for giving TVA the right to suspend the availability of power with a 30-minute notice during times of peak system demand as well as in response to power pricing signals in the market. Instantaneous Response provides qualifying customers with non-conforming load credits to provide ancillary services to the TVA system for regulation balancing purposes. Energy Buyback allows qualifying “fixed price” load customers to receive credits by allowing TVA to buy back energy through customer curtailment or generation supplied to the gird. TVA’s load response products are designed to provide benefits to the TVA system, while lowering customers’ power costs. This situation occurs infrequently, but the arrangement allows TVA to avoid building additional peaking capacity to meet that load. There are currently 99 customers in these programs and a potential of 1,228 MW of on-peak load curtailment available through the programs (Table 2-1).
Table 2-1. Current number of customers, their average on-peak interruptible megawatts and value to customers participating in response products
Reserve Preservation
5 Minute Response
60 Minute Response
Total
No. Customers 16 72 11 99
Average On‐peak Interruptible (MW)
657 538 34 1228*
Current Credits (millions) $40.5 $34.2 $1.2 $75.9
* Difference between 1228 and that the individual elements of the row total to 1229 is due to rounding error.
2.1.3 Operational Flexibility Products
TVA also currently has agreements with individual customers for Operational Flexibility Products. These products provide customers with options and flexibility in how they utilize power for start–up, testing, and maintaining firm standby and interruptible standby power. Start-up and testing power allows customers to start up and test a new operation, expand, or restart an existing facility while maintaining their long-term power supply options. The standby power and interruptible power agreements allow qualifying small power producers and co-generators to elect to purchase standby service for scheduled maintenance and emergency outages in the event that internal generation is unavailable.
2.1.4 Program Incentives and Adjustments
Certain types of billing incentives (credits) are given to promote particular customer behaviors with respect to use of electricity, assisting distributors with special needs, or meeting requirements of the TVA Act. Program incentives apply to customers who meet the eligibility requirements associated with the specific credit. These credits currently include the following, all of which would be retained under the No Action Alternative. The Small Manufacturing Credit (SMC) provides credits on monthly demand and energy charges to qualifying manufacturing customers, making rates more competitive and helping retain manufacturing load in the Tennessee Valley. In 2013, the TVA Board approved the Valley Commitment Program (VCP), an interim measure implemented to attract, retain and expand jobs across the Valley, while TVA worked with customers and other stakeholders to improve the Valley’s industrial competitiveness. The VCP provides credits to qualifying customers who make a two-year operational commitment to the Valley region. The hydro allocation adjustment is a mechanism adopted by the TVA Board to
Environmental Assessment
2015 Rate Change
10
implement Section 11 of the TVA Act. This adjustment passes the benefit of low cost hydroelectric power to residential consumers in the Valley. The administration of the hydro allocation is managed by a series of hydro debits and credits which would continue to be administered according to Adjustment 2 of the wholesale rate schedule(s), as well as the debits and credits in the directly served customer rates. The Low Density Credit provides credits to distributors with exceptionally low density of customers and electrical load. The Low Density Credit would continue to be administered according to the current terms and conditions approved by the TVA Board in September 2002.
2.1.5 Fuel Cost Adjustment
In order to provide affordable, reliable electricity, TVA generates power from several sources, including nuclear power plants, coal-fired power plant and natural gas plants (TVA 2015). To operate these plants, TVA must buy large amounts of fuel – uranium, coal and natural gas. TVA also buys some electricity from other suppliers. Fuel and purchased power costs are TVA’s largest single expense, and they are subject to change. They rise and fall with the weather, with global supply and demand, and other factors.
In the past, most of TVA’s fuel costs were included in the base rate or main part of electric bills. Since October 1, 2006, the Adjustment Addendum to the Schedule of Rates and Charges has included a Fuel Cost Adjustment (FCA) formula to recover fuel costs using an average cost basis. This calculation is described in general terms at the following link on TVA’s public website http://tva.com/fuelcost/index.htm. All consumers’ bills contain fuel charges for the fuel used to generate electricity and all customers (of all sizes and loads) pay the same fuel rate regardless of when they use energy. These charges specifically cover only fuel costs; they provide no additional funding for TVA or the distributor. Since April 2011, all of TVA’s fuel costs have been recovered through the Total Monthly Fuel Cost. Under the No Action Alternative TVA would continue to calculate the FCA on an “average cost” basis for all customers.
2.1.6 Environmental Adjustment
In 2003, the TVA Board approved a ten year Environmental Adjustment which was introduced in response to an increase in costs to comply with the Clean Air Act. The 2003 adder was incorporated into the Adjustment Addendum to increase retail and wholesale revenues by a specified amount. In 2010, the TVA Board modified the Environmental Adjustment consistent with the wholesale rate redesign (movement away from end-use wholesale rates). Flat Environmental Adjustment rates were designed at the wholesale level while retail environmental rates were designed to collect the same retail environmental adjustment revenues as would be billed at the wholesale level. The rates were re-designed to be revenue neutral, collecting the same amount of revenue through the Environmental Adjustment.
In 2013, the TVA Board extended the Environmental Adjustments for an additional five years, subject to future Rate Adjustment or Rate Change. If after five years, the Environmental Adjustments is not incorporated into wholesale base rates, the Environmental Adjustment will continue to extend from year to year.
2.2. The Proposed Action Alternative

Environmental Assessment
Chapter 2
11
Throughout the development of the action alternative, TVA has worked through a collaborative stepwise process with customers consisting of examining cost of service, rate structure, products & programs and competitive balance. TVA’s distributors or local power companies are public entities. They and TVA’s direct served customers represent important public stakeholders and have provided important input as this process has continued. Potential changes under the proposed October 2015 rate change result from reallocation of costs among customer classes in the rate design process, revisions to rate structures, changes to rate structure options available, and revisions to credit programs.
2.2.1 Pricing Structures and Rates
Wholesale
See discussion under Section 2.1.1 Pricing Structure and Rates – Wholesale
Wholesale Standard Service
Under the proposed alternative, TVA has offered distributors a time of use and a seasonal demand and energy rate design option. Most distributors (146) chose the time of use rate, while the remainder (9) knowingly have defaulted to the time of use structure; therefore, the time of use structure would be the only available wholesale standard service option. In the time of use option, there were some structural changes including stronger pricing signals to control demand during on-peak periods, narrowing the on-peak window from 8 hours to 6 hours, introducing an on-peak window during the spring and fall transition months, and creating on-peak and maximum demand charges. The objective of the proposed revisions is to support a gradual transition to a wholesale structure that includes coincident peak billing of demand at the time of TVA’s system peak and a time of use energy structure.
While the structural changes to SDE are similar to TOU, the energy rates would be the same across on-peak and off-peak (that is, customers would pay the same for using energy during peak or off-peak periods). Pricing for both SDE and TOU would be adjusted to maintain the appropriate revenue collection for the Standard Service Customer Class. Based on these distributor TOU elections, TVA would eliminate the wholesale SDE option. The revenue allocation impact for Standard Service customers would be approximately a 0.2% increase ($26 million annually) at the retail level. See rates in Table A1 of Appendix A, which are indicative of those TVA staff will propose to the TVA Board in August 2015. This impact includes the effects of the General Manufacturing Credit for 1,001–5,000 kW manufacturing customers supplied with this group, which sees a $22 million increase in the credit value compared to the Small Manufacturing Credit it replaces.
Wholesale Nonstandard Service
Large (greater than 5,000 kW) commercial and manufacturing customers would continue to have a TOU rate structure with an optional SDE rate structure available through September 30, 2017. Nonstandard wholesale rates of corresponding structure would be provided for wholesale billing related to these customers. Rate structure revisions for these groups are generally similar to those for the standard service wholesale rates, although revisions to cost allocations to large manufacturing and commercial customers and revisions to fuel cost adjustment result in a projected net revenue reduction for this category.

Environmental Assessment
2015 Rate Change
12
Retail
The proposed rate change does not include major changes to retail rate structures for groups covered by Standard Service wholesale purchases. Rates for residential and small and medium commercial industrials are projected to increase overall on average by 0.4% as a result of cost reallocation. Small manufacturing customers see an offsetting impact from the proposed increased General Manufacturing Credit which leaves this group with an estimated average rate reduction of 3.6%
As mentioned above, similar to the Standard Service wholesale elections, TVA has developed a Time of Use and a Seasonal Demand and Energy rate design for large customers (distributor served and directly served by TVA). The Large Industrial and Commercial customers (Non-Standard Service) would be on a Time of Use rate structure similar to the Standard Service TOU structure. This rate is available to Classes B, C and D customers, defined by level of peak demand for megawatts (MW) of electricity as B >5 MW–15MW, C >15MW– 5MW and D > 25MW. In addition, there is a similar structure available to customers with contract demands between 1 MW and 5 MW, however this rate is only available to customers where a distributor has requested a time of use structure be added to their Schedule of Rates and Charges. There are currently 257 Class B customers, 32 Class C customers and 22 Class D customers. There are approximately 150 customers on the optional time of use schedule for the A class.
The Manufacturing Rate Schedule A (MSA) provides small manufacturing customers (those requiring 1–5 MW and falling within certain Standard Industrial Code Classifications of the North American Industry Classification System) with the ability to reduce their effective energy rates by reducing the wholesale power bill of local power companies. Customers on MSA would remain under current terms. The Off-Peak Pricing overlay and the Valley Commitment Program benefits have been built into the Time of Use rate structure for these customers.
The proposed TOU rates for Non-Standard Service customers are listed in Tables B1 through B8 of Appendix B. The basis of need for development of rates and redesign of the product portfolio to maintain a competitive balance between how well TVA rates perform against Cost of Service, as well as that of other power providers, is presented in Appendix C. To improve competitiveness the manufacturing service B, C, and D class customers would see an approximate 2% reduction ($32 million reduction in revenue allocation) to their rates. To move the large commercial class closer to the Cost of Service, they will see an approximate 3% ($10 million reduction in revenue allocation) reduction to their rates.
In addition to the TOU structure, large industrial and commercial customers would have an option to elect a transitional Seasonal Demand & Energy rate (currently the default rate for customers on SDE). This rate would allow customers additional time to transition to the single TOU structure in the future. Providing this option would not shift any revenue between customer classes and ensures no revenue erosion. The Seasonal Demand and Energy rate structure provides customers with the flexibility to shift production into off-peak periods and not dramatically impact their standard operations. The Off-peak Overlay as currently defined, would also remain as an option for those customers subscribing to the Seasonal Demand & Energy option. The proposed transitional SD&E rates are listed in Tables B9 through B14 of Appendix B.

Environmental Assessment
Chapter 2
13
The Large Commercial and Manufacturing Time of Use rate structures would have a minor revenue reduction that was re-allocated to the Standard Service distributor wholesale rates. These reductions would be done in recognition of cost of service and to improve competitiveness of industrial rates. These changes have been designed to be overall revenue-neutral (i.e., minimal change to total revenue to TVA or total costs to all consumers). As noted above, however, addressing the competitive balance issue identified in TVA’s Cost of Service and Competitive Balance studies does result in a shift of some costs between customers of the different rate structures. The change is primarily a decrease in costs for manufacturing and large and commercial customers; and a minor increase in cost to Standard Service residential and small commercial and industrial customers. Those benefits or costs are spread across all customers participating in the respective rate structures.
2.2.2 Response Products
TVA would be transitioning out of its currently available 5 Minute Response (5 MR), 60 Minute Response (60 MR), Reserve Preservation (RP), and Demand Response Auctions (DRA). Beginning October 1, 2015 a new product, Interruptible Power, would be made available to new and existing customers. Interruptible Power would combine the features of the existing products and would simplify the product portfolio, while still providing optionality for customers within the product. The valuation is being modified slightly to be consistent with how other supply side options are currently valued, such as a combustion turbine. In addition, a notice would be issued following the release of the credit value to provide contract termination notice for 5 MR, 60 MR, RP, and DRA. The Instantaneous Response and Energy Buyback products would remain as a part of the Response Products and under current contract provisions. It is anticipated that the present total level of participation by number of customers, load curtailed in megawatts and credit value in dollars would remain approximately the same.
2.2.3 Operational Flexibility Products
Under the Proposed Action Alternative, the Operational Flexibility Products would continue to provide customers with options and flexibility in how they utilize power. Beginning October 1, 2015, Start-Up & Testing Power (STP), Firm Standby Power (SP) and Interruptible Standby Power (ISP) provisions would be revised. TVA would modify the products to align with pricing strategy discussions. In an effort to minimize customer impact, TVA would take several interim steps in updating the pricing product structures. Anticipated changes in the Start-Up and Testing power product would include revised guidelines for approving term extensions for smaller manufacturing customers who need more time to reach full operational status. Revisions to the Standby Power and Interruptible Standby Power products would include a pricing increase in FY16 and a full product re-design and new price structure is expected follow within the next two years. A new monthly reservation charge and on-peak demand charges would be included. SP and ISP customers would be notified of the interim price decrease in August 2015; new prices would appear on their November 2015 bill. It is anticipated that customer demand for participation in these products has the potential to increase with expansion of distributed generation.
2.2.4 Program Incentives and Adjustments
As noted for the No Action Alternative, Program Incentives and Adjustments pertain to customers who meet the eligibility requirements associated with the specific credit. Beginning October 1, 2015, the Small Manufacturing Credit would be renamed the General

Environmental Assessment
2015 Rate Change
14
Manufacturing Credit. The benefits of the Valley Commitment Program would be rolled into the TOU rate structure for Large (> 5,000 kW demand) Manufacturing Customers (including those customers on the optional time of use rate for customers over 1,000 kW–5,000 kW). The Valley Commitment Program credit would be combined with the Small Manufacturing Credit and an estimated $22 million in additional credit funding to create the General Manufacturing Credit for 1,001–5,000 kW manufacturing customers that are part of the Standard Service loads beginning on October 1, 2015. The hydro debits and credits would continue to be administered according to Adjustment 2 of the wholesale rate schedule(s). The Low Density Credit would continue to be administered according to the current terms and conditions approved by the TVA Board in September 2002. Except for increased benefits to small manufacturing customers under the revised General Manufacturing Credit, overall participation levels, benefits and costs associated with changes in these programs are anticipated to be neutral, basically indiscernible, from current effects of these programs.
2.2.5 Fuel Cost Adjustment
Since October 1, 2006, the Adjustment Addendum to the Schedule of Rates and Charges has included a Fuel Cost Adjustment (FCA) formula to recover fuel costs using an average cost basis; all customers pay the same fuel rate regardless of when they use energy. TVA has been working with customers to modify the formula to more accurately assign fuel costs to the customers creating those costs.
In contrast to the current method, the proposed FCA formula allocates fuel costs to two groups of customers: (1) large customers, defined as (a) TVA direct service customers with contract demands greater than 1,000 kW and (b) large customers as defined in the wholesale power rate schedules, and (2) small customers, defined as (a) Standard Service customers in the wholesale power rate schedules and (b) all other customers with contract demands less than or equal to 1,000 kW. The proposed FCA formula uses a resource cost allocation (RCA) methodology to allocate total fuel costs in proportion to the average hourly load of large customers and small customers, weighted by the dispatch cost of TVA’s Top 100 MW of incremental cost, in each hour. Under the Proposed Action Alternative any deferred account balances associated with the currently used average cost methodology would be liquidated in a manner consistent with how the balances were incurred and would be closed out in March 2016.
TVA would continue to forecast the core fuel cost but adjust upward the fuel to be paid by standard service customers and adjust downward the fuel to be paid by non-standard customers. The adjustments are referred to as seasonal amounts and vary by standard service and non-standard service customers by season (summer, winter, transition). After the conclusion of the billing period, TVA would perform the resource cost allocation to assign the actual fuel costs based on each customer group’s aggregate load in each hour and the TVA Top 100 MW dispatch cost. This RCA approach more closely aligns the fuel costs paid by these two customer groups with how the fuel costs were actually created. The purpose of using the seasonal amounts is to more accurately align what customers initially pay within their forecasted fuel cost to the expectations after having performed the RCA analysis. Differences between what the customer paid (core plus seasonal amounts) and the costs that they created (RCA allocation) would continue to be captured within customer group specific deferred accounts which would be administered as they are today.

Environmental Assessment
Chapter 2
15
The financial impact of adopting the new RCA allocation is approximately an additional 0.3% for Standard Service customers and a 3% reduction in fuel costs for Non-Standard customers. TVA determined the initial seasonal amounts by applying the RCA methodology to data from fiscal years 2012 and 2013. TVA proposes to recalculate the seasonal amounts annually to reflect more recent historical fuel cost data, projected changes in fuel costs, or both. If the recalculated seasonal amounts increase or decrease by more than 10%, TVA would provide at least 60 days’ notice to distributors before changing the billing for the FCA. The same RCA methodology and formula would be applied to actual monthly fuel cost data to calculate deferred account amounts, for large and small customers, and used to true-up FCA charges.
2.2.6 Environmental Adjustment
Consistent with the wholesale rate change, TVA is redesigning the Environmental Adjustment adders to align with the changes to the rate design (e.g., Maximum demand, On-peak demand, on-peak energy and off-peak energy). The adjustments would be designed to collect the same amount of total revenue and revenue from each customer class as is currently collected.
2.3. Comparison of Alternatives Following is a summary of the proposed rate changes:
Movement (by selection or default) of wholesale Standard Service customers to a Time of Use pricing structure including stronger pricing signals, narrowing of on-peak hours from 8 to 6 hours, introduction of on-peak periods during spring and fall transition months and creation of on-peak and maximum demand changes.
Introduction of new optional Time of Use and Seasonal Demand and Energy rate structures for Non Standard Service customers (large commercial and manufacturing).
Cost of Service reallocation and improvement of industrial rate competitiveness resulting in a small increase in cost to Standard Service customers and a small decrease in cost to Nonstandard Service customers.
Transitioning out of the 5MR, 60MR and Reserve Preservation products and their replacement with a new product termed Interruptible Power.
Revisions to guidelines for Start Up and Testing power and pricing updates for the Standby Power and Interruptible Standby Power products
Combination of Valley Commitment Program and Small Manufacturing Credit renaming it as the “General Manufacturing Credit” with additional funding.
Reallocation of the fuel cost adjustment in proportion to average hourly load of customers, weighted by TVA’s top 100 MW dispatch costs in each hour.
Redesign of Environmental Adjustment adders to align with the changes to the rate design (e.g., Maximum demand, On-peak demand, on-peak energy and off-peak energy).
Because of the limited magnitude of the direct and cumulative effect of the alternative rate structures, TVA expects that any induced indirect environmental impacts would be small, essentially indiscernible, for either the No Action or the proposed Action Alternative. The

Environmental Assessment
2015 Rate Change
16
comprehensive environmental regulatory programs that exist throughout all of the Valley states would further ensure that any resulting environmental impacts are minor for either alternative. The potential for derivative secondary impacts to resources such as cultural resources, floodplains, biological resources, endangered species, or wetlands would accordingly be highly unlikely or none. Because expected socioeconomic and environmental impacts are so small, TVA has not identified any mitigation measures necessary to offset or reduce the level of impacts for either alternative.
2.4. The Preferred Alternative TVA’s preferred alternative is the Proposed Action Alternative.

Chapter 3
Environmental Assessment
17
CHAPTER 3
AFFECTED ENVIRONMENT and ENVIRONMENTAL CONSEQUENCES
3.1. Framework for Environmental Impact Analyses - The Electric Power Industry, Need and Supply, and Sources of Impacts
This section briefly explains how environmental impacts are associated with TVA rate restructuring. The power service area of the Tennessee Valley Authority will continue to need electricity. TVA expects that it will provide all or a substantial portion of that energy in the future. As evaluated and discussed in TVA’s 2015 Integrated Resource Plan EIS, TVA expects to provide this energy by generating it from its own facilities or by buying it from specific energy generators (e.g., independent power producers) or from the general power market.
The potential for environmental impacts (for instance to air quality, water quality or land use) directly depends upon: (1) the related decisions made by the users of electricity in the region in response to rate structuring, products, services, and pricing (i.e., the market response in terms of energy demand and use) and (2) how TVA provides the energy and meets demand in response to those decisions.
The first source of potential impacts (Figure 3-1) results from the direct and indirect responses by the retail customer market of end users of electricity. Different pricing structures for electricity may, all other factors held constant, induce behavior that leads to creating, maintaining, or eliminating jobs. This occurs through customers decisions to: construct new plants and open new businesses; expand existing plants and businesses (through either additional or longer shifts or physical expansion of facilities), or to close or reduce the output of existing plants and businesses. However, it is not reasonable to assume that all of the other factors that affect such behavior (these business decisions) would or can be held constant. Things affecting business and the economy change constantly. As TVA supplies wholesale power to distributors, there is also the additional layer of decision-making by distributors that add uncertainty. Thus, predicting behavioral changes involves substantial speculation.
The second source of potential impacts (Figure 3-1) occurs if, in response to restructuring of power rates, directly-served customers or distributor’s customers (residential, commercial and industrial) increase or decrease their energy use to the point that: (1) new generation facilities must be constructed or existing facilities operated more; (2) existing generation facilities are shut down or operated less; or (3) the mix of energy resources changes. With increases or decreases in energy demand, more or less transmission capability (such as more miles of transmission line) may also be needed.
For the suite of alternative rate structures for pricing of electricity proposed by TVA in consultation with power distributors of the region, the potentially affected resources include socioeconomics, energy use, air quality, water quality, land use, and production of solid and hazardous waste. The potential for derivative effects to resources such as cultural resources, floodplains, biological resources, endangered species, or wetlands would be dependent upon the level of effects to these six primary areas.

2015 Rate Change
Environmental Assessment
18
Figure 3-1. General Framework for Consideration of Issues and Environmental Impact Analyses of Effects from Rate Changes

Chapter 3
Environmental Assessment
19
3.2 Socioeconomics 3.2.1 Affected Environment The socioeconomic conditions and trends of the TVA region are discussed in detail in TVA (2015) from which this EA tiers. TVA supplies electricity to a population of approximately 9.7 million people (Bureau of Census 2014a) across 178 counties in portions of seven states. Between 2000 and 2013 the region experienced a 16 percent growth in population, a rate higher than the 13.4 percent experienced across the United States as a whole. In 2013 the TVA region had an economy of almost $400 billion in gross product and a total personal income of about $365 billion, about 2.5 percent of the national total (Bureau of Economic Analysis 2014). While income levels have increased relative to the nation over the last several decades, average income is $37,464, about 84 percent of the national average. As a whole, the TVA region is more rural and the economy depends more on manufacturing than does the nation as a whole. Manufacturing employment comprises about 11 percent of regional employment and about 10 percent of regional personal income. Minority and Low Income Populations – As of 2013, the minority population of the region is estimated to be about 2.4 million; 24.5 percent of the region’s total population of 9.7 million (Bureau of Census 2014b). This is well below the national average minority population share of 37.4 percent. Minority populations are most concentrated in metropolitan areas of the western half of the region and in rural counties of Mississippi and western Tennessee. As of 2013, the estimated poverty level for counties in the TVA region is 18.5 percent, higher than the national poverty level of 15.8 percent (Bureau of Census 2014c). Counties with the higher poverty levels are generally outside the metropolitan areas and most concentrated in Mississippi. 3.2.2 Environmental Consequences No Action Alternative – Under this alternative there would be no change in the way TVA currently determines and applies electricity pricing. Therefore there would be no incremental effects on energy use or derivative socioeconomic impacts. Proposed Action Alternative - The new rate structure is designed to be revenue neutral based on historical billing data for TVA fiscal years 2012–2014. While rates for some customer classes are expected to increase slightly, e.g. residential and small commercial customers by about 0.4%, others will decline, including a 3.6% decrease for small manufacturing, a 1.7% decrease for large manufacturing, and a 2.8% decrease for large commercial. While there may be some change in customer usage levels, there is a high degree of uncertainty as to whether this will happen, what time frame would be involved, and how large the impact would be. The higher rates to residential and small commercial consumers could dampen energy sales by encouraging adoption of energy efficient technologies that would limit energy usage at all hours, including the hour of the peak. Any price-driven behavioral response from consumers resulting from the 0.4 percent increase in average rates is likely to be small, however. Large industrial customers are the most price-sensitive among customers and they may accordingly increase energy consumption somewhat through minor expansions, additional shifts, or decisions to site within the TVA Power Service Area in response to reduced power prices. The revised rates are not expected to have significant net impacts to TVA power supply requirements. Recent analysis by TVA suggests that the potential net impact on TVA energy requirements would be somewhere between 0 and -137 Gwh (a decrease). Other factors affecting TVA power supply requirements such as weather conditions and the level of economic activity are expected to have much larger impacts on TVA energy production.

2015 Rate Change
Environmental Assessment
20
Because of the degree of uncertainty regarding customer response and the expected minor magnitude of any such response, TVA is not altering its demand or energy requirements forecast as a result of proposed rate structure changes.
Minority and Low Income Populations Residential, and small commercial customers (Standard Service customers of distributors) would experience about a 0.4% increase in average rates. The costs are expected to affect customers of each distributor in a minor and uniform fashion. For each distributor, households and businesses within a customer class would be expected to be impacted uniformly within that class. Although percentages of minorities and low-income persons vary among distributors, their service areas are large enough that none would have a disproportionately large share of minority or low-income customers. Since these classes would apply throughout the distributor’s service area, there would be no disproportionate negative impacts to minority or low-income populations.
3.3 Energy Production and Use
3.3.1 Affected Environment TVA is the largest public power supplier in the United States. Dependable generating capacity on the TVA system is about 37,200 megawatts (MW). TVA generates most of this electricity with 3 nuclear plants, 10 coal-fired plants, 9 combustion turbine plants, 3 combined cycle plants, 29 hydroelectric dams, 2 diesel generator plants, a pumped storage plant, a windfarm, a methane-gas cofiring facility and several small photovoltaic facilities (TVA 2015). A portion of delivered power is provided through long-term power purchase agreements.
Consumers of TVA-generated electricity consist of a mix of residential, commercial, and industrial customers in the power service area. Recent (2009–2014) energy sales totaled between 133,000 and 161,000 gigawatt-hours (GWh) annually. The sales included those to the 155 distributors serving residential, commercial, and industrial customers; 52 directly-served large industrial customers and 7 federal installations.
The most recent TVA data and current outlook (TVA 2015) indicate that both peak demand and energy demand in the TVA Power Service Area will grow at relatively steady rates, averaging 1.1 and 1.0 percent per year, respectively. These more recent predictions indicate a slightly slower rate for peak demand than was predicted in TVA (2011) and a comparable prediction for growth in energy demand. In both TVA (2011) and the TVA (2015), bounding scenarios for power planning were analyzed with both greater and lesser growth rates. 3.3.2 Environmental Consequences No Action Alternative - Under this alternative, there would be no change in the way TVA currently determines and applies pricing for electricity or the related products, credits and adjustments. Therefore, there would be no incremental effects on energy use or derivative socioeconomic impacts Proposed Action Alternative – As mentioned previously, TVA analysis has estimated potential energy impacts on system energy requirements from rate structure changes to be no more than 137 GWh, or about a 0.1% decrease in TVA requirements. The resulting change in energy use is well within the boundaries for energy use in planning scenarios analyzed in TVA (2011) and TVA (2015). This level of change in use of energy was bounded by those analyses, would be minor and the only likely result is a slight reduction in TVA purchases of energy from other sources or a minor reduction in total energy production from TVA generating facilities.

Chapter 3
Environmental Assessment
21
There are some differences in revenue collection by component under proposed rates. The new rate structure is expected to result in a $172 million reduction in demand charges from large commercial and industrial customers (> 5 MW of demand) however this reduction is offset by increased energy charges for the first kWh of energy used (first 200 hours of on-peak demand) with each unit of on-peak demand used. These changes result in stronger incentives for these customers to control their demand during on-peak periods. Most retail customers, however, would not likely face demand charges, and so would continue to have no price structure incentive to reduce consumption at peak hours versus other hours. Although the changes to the distributors’ Standard Service structure are not as substantive, distributors are further encouraged to reduce their demand during on-peak hours by changes to the wholesale rate such as the creation of and on-peak demand charge and the narrowing of the on-peak period from 8 hours to 6 hours, which should make control technologies and voltage control more effective. TVA staff does believe that proposed demand charge levels and other changes in rate structure better reflect the cost of peaking capacity and so send better price signals for load management and encourage more economically efficient choices in the level of load management investment by customers. Any changes in peak demand due to implementation of the Proposed Action are expected to support efficient operation of the power system. The exact magnitude of these changes is difficult to estimate, but is expected to be within the normal historical operating range of TVA facilities; to have been easily bounded by analyses in TVA’s IRPs; and would not result in adjustments to forecasted peak demand in the TVA system at this time. TVA expects to continue experiencing normal growth in peak load due to general growth in the Valley population and economy. To the extent the rate change does impact future system peak loads, any changes would be addressed by adjustments to generation by peaking units, most likely combustion or combined cycle turbines, or off system purchases of electricity. 3.4 Air Resources 3.4.1 Affected Environment Most people consider air quality an important environmental resource. Poor air quality can affect our health, ecosystem health, forest and crop productivity, economic development and our enjoyment of scenic views. Air quality within the TVA region has steadily improved over the last 35 years and TVA has been steadily reducing the emissions from its system during much of this period. Through its passage of the Clean Air Act (CAA), Congress has mandated the protection and enhancement of our nation’s air quality resources. National ambient air quality standards (NAAQS) for the following criteria pollutants have been set to protect the public health and welfare:
Sulfur dioxide (SO2) Ozone (O3) Nitrogen oxides (NOx) Particulate matter whose particles are <10 micrometers Particulate matter whose particles are < 2.5 micrometers (PM2.5) Carbon monoxide Lead

2015 Rate Change
Environmental Assessment
22
Areas not meeting the standards are called “nonattainment” areas. TVA (2015) identifies nonattainment areas based upon the most recent information. Electric generating facilities emit to some degree each of those pollutants. Hazardous Air Pollutants (HAPs) are toxic air pollutants, which are known or suspected to cause cancer or other serious health effects or adverse environmental conditions. The CAA identifies 187 pollutants as HAPs. Most HAPs are emitted by human activity, including motor vehicles, factories, refineries and power plants. Mercury is the HAP compound most associated with the burning of coal and power plant emissions. Other important issues concerning power plant emissions are acid deposition related to SO2 and NOx emissions, and visibility impairment, related in the TVA region mostly to ammonium sulfate particles formed from SO2 emissions from coal-fired power plants. The most sensitive areas in the region are high elevation, forested areas such as the Great Smoky Mountains National Park. The nature of these pollutants, their effects and relationships to power production and industry are discussed more fully in TVA (2015). The particular environmental attributes including emissions for the TVA generation fleet and totals for individual types of generating units (including natural gas-fired combustion turbines and combined cycle turbines), are presented in Tables 7-1 and 7-2 of TVA (2015). 3.4.2 Environmental Consequences No Action Alternative – Under the No Action Alternative there would be no incremental effect from a rate change on air pollutant emissions and air quality of the region. As identified above and in TVA (2011), current trends in air quality would continue. Proposed Action Alternative - As discussed in the socioeconomic and energy use sections, potential economic and energy use changes for the Proposed Action Alternative are expected to be small or indiscernible. For the Proposed Action Alternative, the current conditions and trends in air quality for the region, as discussed above and in TVA (2011) are generally expected to continue. Natural gas-fired combustion turbines are the single most likely type of fossil fuel generation whose dispatch might be affected by minor perturbations associated with customer’s response to rate change (via change in energy use and peak demand). To the extent that any change in peak demand or reduction in total energy used were to occur, for TVA the result may be a minor decrease in use of peaking units, most likely combustion or combined cycle turbines, to address the slight changes in peak demand. Any minor changes to air emissions, including release of greenhouse gases, associated with the potential for change in peak demand, and possible reduction in total energy use, would be so small as to be indiscernible; have been easily bounded by analyses in TVA’s IRPs; and would not require construction or retirement of any additional units or facilities. 3.5 Water Resources 3.5.1 Affected Environment The quality of the region’s water (surface water and groundwater) is critical to protection of human health and aquatic life. These water resources provide habitat for aquatic life, recreational opportunities, domestic and industrial water supplies, and other benefits. Wastewater discharges from cities or industries and runoff from nonpoint source activities such as construction, agriculture, mining, and air deposition can potentially degrade water quality. Surface Water - The scope of this EA covers the TVA power service area (Figure 1-1), which includes the entire Tennessee River basin and portions of the Cumberland River, lower Ohio River, lower Mississippi River, and Green River basins. Fresh water abounds in this area and
Chapter 3
Environmental Assessment
23
generally supports most beneficial uses, including fish and aquatic life, public and industrial water supply, recreation, irrigation, and navigation. As discussed in the TVA (2011) and TVA (2015) EISs, water quality in the TVA region is generally good. Sources of Pollution - Pollution involves a change in water quality that adversely affects a beneficial use such as swimming or aquatic life. Every two years, states are required to submit a 303(d) report to USEPA. The report identifies the “impaired” lakes and streams that are not complying with water quality criteria and, consequently, are not suitable for their designated use. Thus, the state 303(d) reports provide a comprehensive and recent summary of water quality in each state.
Causes of degraded water quality include:
Wastewater discharges from municipal sewage treatment systems, industrial facilities, concentrated animal feeding operations and other sources
Runoff discharge from agriculture, forest management activities, urban uses and mine lands, which transport sediment and other pollutants into streams and reservoirs Runoff from commercial and industrial facilities and some construction sites is regulated through state NPDES stormwater permitting programs. The other sources not regulated through the NPDES program are referred to as “nonpoint source” runoff
Cooling systems such as electrical generating plants and other industrial facilities which withdraw water from streams or reservoirs, use it to cool facility operations, and then discharge the heated water into streams and reservoirs. Impacts result from temperature changes, the trapping of organisms against intake screens or sucking them through the facility cooling system. These water intakes and discharges are controlled through state-issued NPDES permits
Air pollution in the form of airborne pollutants such as mercury being spread through rainfall and deposition.
Additional regulatory protections for water quality and the mechanisms of how power generation can affect water quality and aquatic life are discussed in detail in the TVA (2011) and TVA (2015) EISs. Groundwater - Groundwater refers to water located beneath the surface in rock formations known as aquifers. Eight major aquifers occur in the TVA region. Approximately half of the region has limited groundwater availability because of natural geo-hydrological conditions. More than 64 percent of the region’s residents rely totally, or in part, on groundwater for drinking water. More than 1.7 million residents (22 percent) in the region maintain individual household groundwater systems, usually a well. All areas in the Tennessee Valley region can generally supply enough water for at least domestic needs. For the most part, the groundwater quality is adequate to support existing water supply uses even though some minimal treatment, such as filtration and chlorination, is sometimes required. Generating facilities involving combined-cycle combustion turbines often make use of groundwater for either cooling or reinjection of heated water. 3.5.2 Environmental Consequences No Action Alternative – Under this alternative there would be no rate-related, incremental changes associated with operation of TVA generating facilities and consequently no addition or lessening of operational effects as identified in TVA (2011) and updated in TVA (2015).

2015 Rate Change
Environmental Assessment
24
Proposed Action Alternative - Due to a potential small reduction in energy use and possible minor change (decrease) in peaking generation, the dispatch of existing combustion turbines or combined cycle units could be affected in a minor way. Whether or not the units were operated slightly less or slightly more, the amount of change would be minor and well within the bounds of operations considered in the TVA (2011) and updated in TVA (2015) EISs. The minor affects to any groundwater resources utilized by such facilities would be also indiscernible. 3.6 Land Use 3.6.1 Affected Environment TVA provides wholesale power to portions of a seven state region of 80,000 square miles. Major land uses in the TVA region include forestry, agriculture and urban/suburban/industrial development. Regional development is described in detail in TVA (2015). Of the non-federal land in the TVA region about 12 percent is considered developed and 88 percent as rural. TVA’s existing power plant reservations have a total area of about 24,500 acres. That total area does not include that for multi-purpose hydroelectric facilities. The actual disturbed acreage of these non-hydroelectric facilities is about 17,500 acres. Existing non-TVA generation facilities from which TVA purchases power under power purchase agreements utilize an area of approximately 2,400 acres. 3.6.2 Environmental Consequences No Action Alternative – Under the No Action Alternative customers would continue to factor the current TVA rate structure into their decisions about siting of facilities and use of electricity. Since TVA would take no actions that might induce substantive increases in use of energy, there would be no need for additional generation facilities related to this rate change. Regional land use, trends and development in the TVA region would continue as identified in TVA (2011) and subsequently updated in TVA (2015). Proposed Action Alternative - Although one of the objectives of the proposed action is to make industrial rates more competitive and thus more attractive for industrial development, the degree of potential change is, as identified earlier (Section 3.1), a largely speculative undertaking as to the response and how much, when or where development might occur. Industrial power rates are just one factor among many that influence decisions about siting or size and operation of industrial facilities. Due to the minor nature of the proposed rate adjustments the likely result is only a minor influence. Considering the size and extent of the TVA region and the availability of appropriate land for siting such development, regional effects would be minor. Additionally, since the result of the proposed action would be a possible minor reduction in total energy use by consumers and possible minor potential for change (decrease) in peak generation that is readily addressable by existing units operating within the range of operations considered in TVA (2011); no additional TVA generation facilities would result; nor any new or expanded facilities or areas consequently needed for fuel extraction, or handling, storage and disposal of solid, hazardous or nuclear waste.
3.7 Solid and Hazardous Waste Generation 3.7.1 Affected Environment Residential, Commercial and Industrial Wastes - Residential and commercial wastes are usually generated in many, diffusely located areas and handled at municipal solid waste

Chapter 3
Environmental Assessment
25
landfills. Most municipalities and counties currently engage in long-range planning processes to ensure that adequate capacity is provided for solid wastes generated within their jurisdictions. Solid waste reduction and recycling is an important emphasis in most of these plans. For example, in the state of Tennessee, in 2013 Tennessee businesses, industries, citizens and others disposed of 11,534,344 tons of solid waste, which equated to 0.94 tons per capita. Of this amount 6,127,487 tons went to Class 1 landfills and 5,406,857 tons were recycled, reused or diverted to other facilities. Using 1995 as the base year, per capita waste reduction and diversion rate for 2013 was 29.0 percent, compared with 22.6 percent in 2000 (TDEC 2014).
Tennessee, as well as other states in the Valley, has also implemented a program for collection and safe storage and disposal of household hazardous waste (HHW). Ninety-two counties in Tennessee have participated in the mobile collection service since it began in 1993. The program collects and properly disposes of paint, flammable liquids, corrosives, oxidizers, batteries, and pesticides. An average event yielded 23,540 pounds of HHW.
The picture for industrial solid and hazardous waste generation and handling is similar. Current legislative and regulatory programs encourage and/or mandate the reduction, recycling, and proper disposal of industrial solid and hazardous wastes. The states within the TVA power service area have state-administered, Resource Conservation and Recovery Act (RCRA) equivalent programs, which emphasize waste reduction, recycling, and proper handling and disposal of solid and hazardous wastes. Industries benefit both financially and from a public relations standpoint by engaging in waste reduction and recycling opportunities in the same way that TVA benefits from its coal combustion residue (by-product (CCR) marketing and utilization efforts. It is, therefore, likely that industrial solid and hazardous waste generation and disposal will continue to decline in the future.
TVA-Generated Wastes - Types of wastes typically produced by construction activities whether by TVA or others include, vegetation, demolition debris, oily debris, packing materials, scrap lumber and domestic wastes or garbage. Non-hazardous wastes typically produced by common operation of TVA facilities include sludge and demineralizers from water treatment plant operations, personal protective equipment, oils and lubricants, spent resins, desiccants, batteries and domestic waste. Between 2010 and 2013, TVA facilities produced approximately 21,000 tons of solid waste per year. TVA facilities include large, small, and conditionally exempt generators of hazardous waste. Hazardous non-radiological wastes typically produced by common TVA facility operations include paint and paint solvents, paint thinners, discarded out-of-date chemicals, parts washer liquids, sand blast grit, chemical waste from cleaning operations and broken fluorescent bulbs. Routine operations between 2010 and 2013 annually created about 35,537 kilograms of hazardous waste annually and 39,710 kilograms of TSCA and universal wastes. TVA’s hazardous wastes and those requiring special handling (TSCA and universal waste) are generally shipped to Waste Management’s Emelle, AL facility for disposal. TVA reduction programs for hazardous waste, based upon source reduction, have been in place on the TVA system for some time. Coal combustion solid wastes or residues (also known as CCRs) include fly ash, bottom ash, boiler slag, char spent bed material and residue form flue gas desulfurization (FGD) operation. In the past, USEPA has determined that CCRs are not hazardous and in April 2015 decided to continue to regulate them as nonhazardous, solid waste. In 2103 TVA produced approximately 4.32 million tons of CCRs of which 1.2 million tons were utilized or marketed. Annually CCR production fluctuates due to a variety of factors including primarily:

2015 Rate Change
Environmental Assessment
26
plant planned and forced maintenance outages, load swings, plant dispatch (the process by which plants are directed to increase or decrease power generation based on the cost of production at each plant—generally the larger, more efficient units run more and the smaller, less efficient units run less), and variation in fuel supplies (BTU, sulfur, and ash content of the fuels burned). Additionally, recent decisions to retire coal-fired generation reduce the amount of CCRs disposed of at its plants. The amount of CCRs that are disposed also is reduced through marketing and utilization of these by-products in a number of commercial applications including use of fly ash in concrete products, bottom ash as aggregate in cement block manufacturing, boiler slag for roofing granules and industrial abrasives, and scrubber gypsum in gypsum wallboard and cement manufacturing. 3.7.2 Environmental Consequences No Action Alternative – Current trends in waste production and reduction as identified in the example for Tennessee above and in TVA (2011) would continue for TVA in the region. Proposed Action Alternative – Although one of the objectives of the proposed action is to make industrial rates more competitive and thus more attractive for industrial development, the degree of potential change is, as identified earlier (Section 3.1), a largely speculative undertaking as to the response and how much, when or where development might occur. Industrial power rates are just one factor among many that influence decisions about siting or size and operation of industrial facilities. Due to the minor nature of the proposed rate adjustments the likely result is only a minor increase in industrial activity in the TVA Power Service area and therefore, the amount of waste generated in the region. Operation of hydroplants or combustion turbines and combined-cycle facilities, are the types of generation most potentially affected by TOU changes in peak demand and energy use associated with rate change. Neither the hydroplants nor operation of combustion turbine or combined-cycle plants contribute to CCR wastes. Since the result of the proposed action would be a minor reduction in total energy use by consumers, and any minor peaking change would most likely predominantly affect operation of existing combustion turbines, any minor change to amounts of TVA wastes generated would be insignificant and well within that for the range of operations considered in TVA (2011) and TVA (2015). 3.8 Summary of TVA Commitments and Proposed Mitigation Measures Due to the minor and insignificant impacts identified for the Proposed Action Alternative, there are no TVA commitments or proposed mitigation measures identified for implementation of this action.

Chapter 4
Environmental Assessment
27
CHAPTER 4
LIST OF PREPARERS AND REVIEWERS
Joseph Cade Position: Project Manager, Demand Side Pricing & Strategy Education: B.A., Mathematics and Economics, MBA, Finance Experience: 34 Years in Electricity Pricing Design and Analysis Involvement: Document Review and Technical Support Katie A. Downs Position: Strategic Pricing Plan Program Manager, Demand Side Pricing &
Strategy Education: Associate of Science, B.S. Business Administration, Marketing,
Entrepreneurship Experience: 5 Years in Electric Utility Industry Involvement: Document Review
Kelsey E. Giddens Position: Pricing Specialist, Demand Side Pricing & Strategy Education: B.S. Business General Management, English Writing Experience: 2 Years in Electric Utility Industry Involvement: Document Review Michael R. Hynes Position: Director, Rate Design & Administration Education: B.S. Math, B.A. Economics, MBA Experience: 31 Years Electric Utility Experience, Concentration in Rate
Design & Pricing Involvement: Historical Content and Technical Support Charles E. Massey Position: Director, Demand Side Pricing & Strategy Education: Experience: 34 Years in Electric Industry Ranging from Pricing, Demand
Response, Customer Delivery, Transmission, Resource Management, and Generation
Involvement: Document Preparation, Review and Technical Support Charles P. Nicholson, Ph.D. Position: NEPA Specialist IV Education: Ph.D., Ecology and Evolutionary Biology; M.S., Wildlife
Management; B.S., Wildlife and Fisheries Science Experience: 20 Years in NEPA Compliance, 17 years in Wildlife and Endangered
Species Management Involvement: NEPA Compliance and EA Preparation

2015 Rate Change
Environmental Assessment
28
Wesley R. Nimon Position: Senior Specialist, Enterprise Forecasting Education: Phd., Economics Experience: 15 Years of Economic and Statistical Models Y Involvement: Economic and Load Forecasting, Economic Impact Analysis J. Thomas Waddell Position: Senior Manager, Air Permits, Compliance, and Monitoring Education: B.S. Chemical Engineering Experience: 29 Years in Air Permitting and Compliance, Regulatory Development and Air Pollution Research Involvement: Air Quality Bruce L. Yeager Position: NEPA Support Contractor Education: M.S., Zoology; B.S., Zoology
Experience: 38 Years in Environmental Compliance for NEPA; Project Management; & Environmental Policy
Involvement: Document Management

Environmental Assessment
Chapter 5
29
CHAPTER 5
LITERATURE CITED Bureau of Census 2014a. Annual estimates of the resident population for counties: April
1, 2010 to July 1, 2013. Available at http://.census.gov/popest/data/counties/totals/2013/CO-EST2013-01.html.
_____. 2014b. State and County Quickfacts. Bureau of Census. U.S. Department of
Commerce. Available at: http://quickfacts.census.gov/qfd/index.html. _____. 2014c. Small area income and poverty estimates. Bureau of Census. U.S.
Department of Commerce. Available at http://www.census.gov/did/www/saipe/data/statecounty/data/2013.html.
Bureau of Economic Analysis. 2014. Local are personal income, 2013. Bureau of
Economic Analysis. U.S. Department of Commerce. Available at http://www.bea.gov/newsreleases/regional/lapi/lapi_newsreleases.htm.
Tennessee Department of Environment. 2014. Annual Report to the Governor and
General Assembly on the Solid Waste Management Act of 1991. Fiscal Year 2013-2014.
Tennessee Valley Authority. 2011. Environmental Impact Statement for TVA’s Integrated
Resource Plan. Available at: http://www.tva.com/environment/reports/irp/archive/index.htm.
_____. 2015. Integrated Resource Plan Final Supplemental Environmental Impact
Statement. Available at: http://www.tva.com/environment/reports/irp/index.htm.

Page intentionally blank
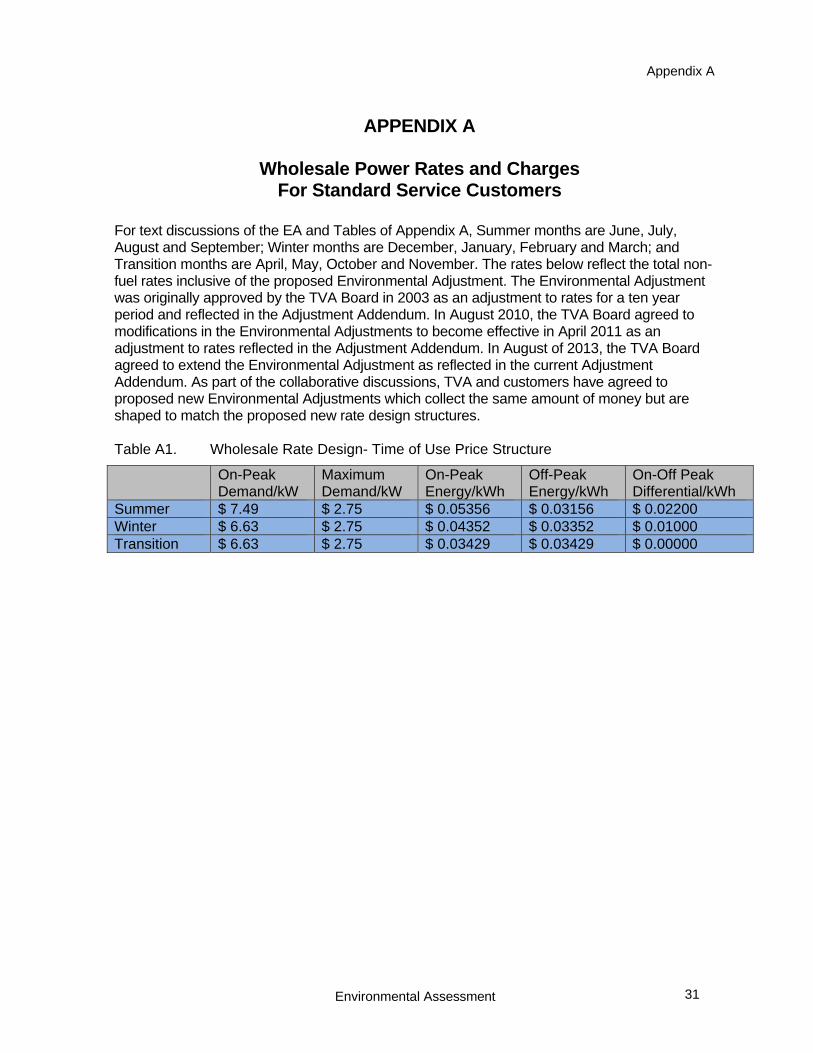
Environmental Assessment
Appendix A
31
APPENDIX A
Wholesale Power Rates and Charges For Standard Service Customers
For text discussions of the EA and Tables of Appendix A, Summer months are June, July, August and September; Winter months are December, January, February and March; and Transition months are April, May, October and November. The rates below reflect the total non-fuel rates inclusive of the proposed Environmental Adjustment. The Environmental Adjustment was originally approved by the TVA Board in 2003 as an adjustment to rates for a ten year period and reflected in the Adjustment Addendum. In August 2010, the TVA Board agreed to modifications in the Environmental Adjustments to become effective in April 2011 as an adjustment to rates reflected in the Adjustment Addendum. In August of 2013, the TVA Board agreed to extend the Environmental Adjustment as reflected in the current Adjustment Addendum. As part of the collaborative discussions, TVA and customers have agreed to proposed new Environmental Adjustments which collect the same amount of money but are shaped to match the proposed new rate design structures. Table A1. Wholesale Rate Design- Time of Use Price Structure
On-Peak Demand/kW
Maximum Demand/kW
On-Peak Energy/kWh
Off-Peak Energy/kWh
On-Off Peak Differential/kWh
Summer $ 7.49 $ 2.75 $ 0.05356 $ 0.03156 $ 0.02200 Winter $ 6.63 $ 2.75 $ 0.04352 $ 0.03352 $ 0.01000 Transition $ 6.63 $ 2.75 $ 0.03429 $ 0.03429 $ 0.00000

2015 Rate Change
32 Environmental Assessment
APPENDIX B
Wholesale Power Rates and Charges for Non-Standard Service Large Industrial and Commercial Customers
For text discussions of the EA and Tables of Appendix B, Summer months are June, July, August and September; Winter months are December, January, February and March; and Transition months are April, May, October and November. The rates for large customers served by distributors and those that are served directly by TVA are intended to be the same, except that distributors can request higher delivery adders and are subject to approval by TVA. The rates below are for TVA’s direct serve customers and serve as the basis for distributor default rates. The rates below reflect the total non-fuel rates inclusive of the proposed Environmental Adjustment. The Environmental Adjustment was originally approved by the TVA Board in 2003 as an adjustment to rates for a ten year period and reflected in the Adjustment Addendum. In August 2010, the TVA Board agreed to modifications in the Environmental Adjustments to become effective in April 2011 as an adjustment to rates reflected in the Adjustment Addendum. In August of 2013, the TVA Board agreed to extend the Environmental Adjustment as reflected in the current Adjustment Addendum. As part of the collaborative discussions, TVA and customers have agreed to proposed new Environmental Adjustments which collect the same amount of money but are shaped to match the proposed new rate design structures.
Time of Use Rate Structure
Manufacturing Classes Table B1 Time Differentiated Manufacturing Service A Class (TDMSA)
Table B2 Time Differentiated Manufacturing Service B Class (MSB)
Table B3 Time Differentiated Manufacturing Service C Class (MSC)
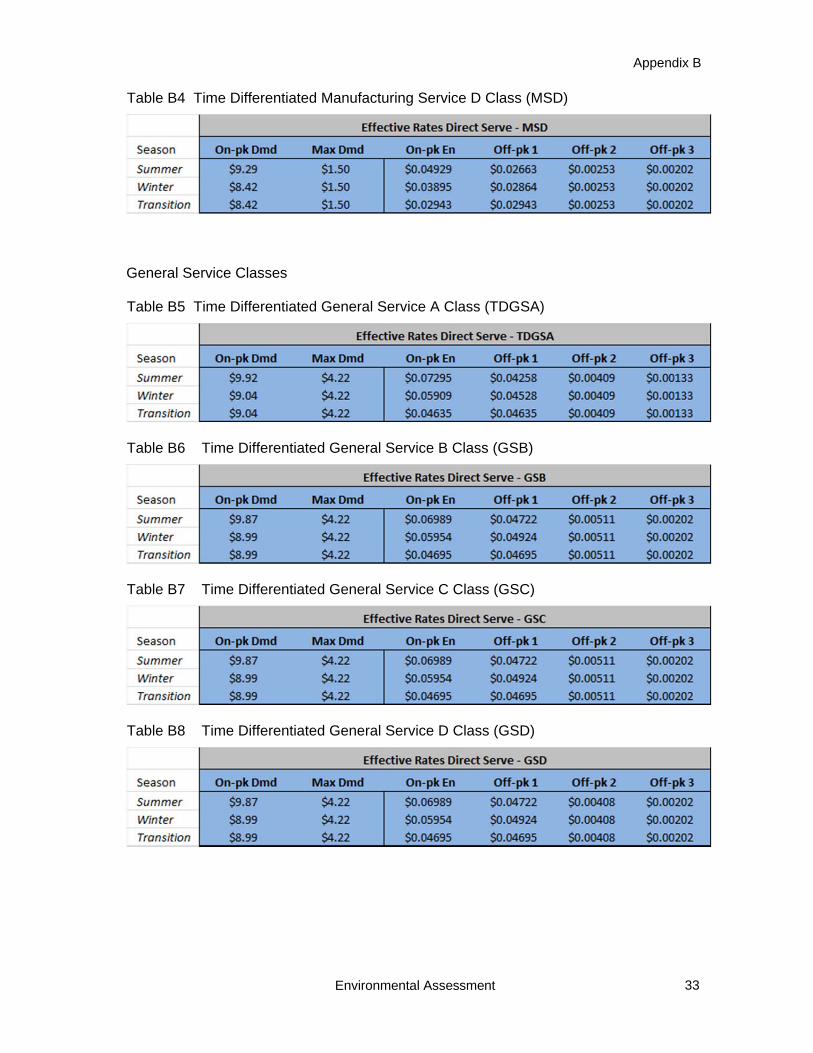
Appendix B
Environmental Assessment
33
Table B4 Time Differentiated Manufacturing Service D Class (MSD)
General Service Classes Table B5 Time Differentiated General Service A Class (TDGSA)
Table B6 Time Differentiated General Service B Class (GSB)
Table B7 Time Differentiated General Service C Class (GSC)
Table B8 Time Differentiated General Service D Class (GSD)

2015 Rate Change
34 Environmental Assessment
Seasonal Demand & Energy Structure
Manufacturing Classes Table B9 Seasonal Manufacturing Service B Class (SMSB)
Table B10 Seasonal Manufacturing Service C Class (SMSC)
Table B11 Seasonal Manufacturing Service D Class (SMSD)
General Service Classes Table B12 Seasonal General Service B Class (SGSB)
Table B13 Seasonal General Service C Class (SGSC)

Appendix B
Environmental Assessment
35
Table B14 Seasonal General Service D Class (SGSD)


2015 Rate Change
36 Environmental Assessment
APPENDIX C COST OF SERVICE AS BASIS FOR REFINING RATES FOR
STANDARD SERVICE AND NON-STANDARD SERVICE CUSTOMERS
TVA’s 2013 Cost of Service study has provided a guide to aligning customer classes closely to the actual cost to serve them. The study was representative of a multi-perspective approach between TVA, the Tennessee Valley Public Power Association (TVPPA) and the Tennessee Valley Industrial Committee (TVIC). The three perspectives of estimating the cost to provide electric service to customer classes produced remarkably similar results. All three methodologies indicate approximately the same revenue to cost ratios for all three rate classes (distributor standard service, Large Manufacturing Service, and Large General Service). Furthermore, all three perspectives also concur that the aggregated Large General Service class has rates which currently generate revenues in excess of their allocated costs.
Addressing such a disparity and to maintain a competitive balance between how well our rates perform against Cost of Service, as well as that of other power providers, has been a consideration in the development of the proposed rates and redesign of the product portfolio.