refining perspective – crude availability, investments in ... obrien argus... · residuum...
TRANSCRIPT
0 Baker & O’Brien, Inc. All rights reserved.
35th Argus Fuel Oil and Feedstock Summit Miami, Florida
October 26, 2015
Mark A. Heersema
Refining Perspective – Crude Availability, Investments in Residuum Processing and Impact on Residual Fuel Oil
1
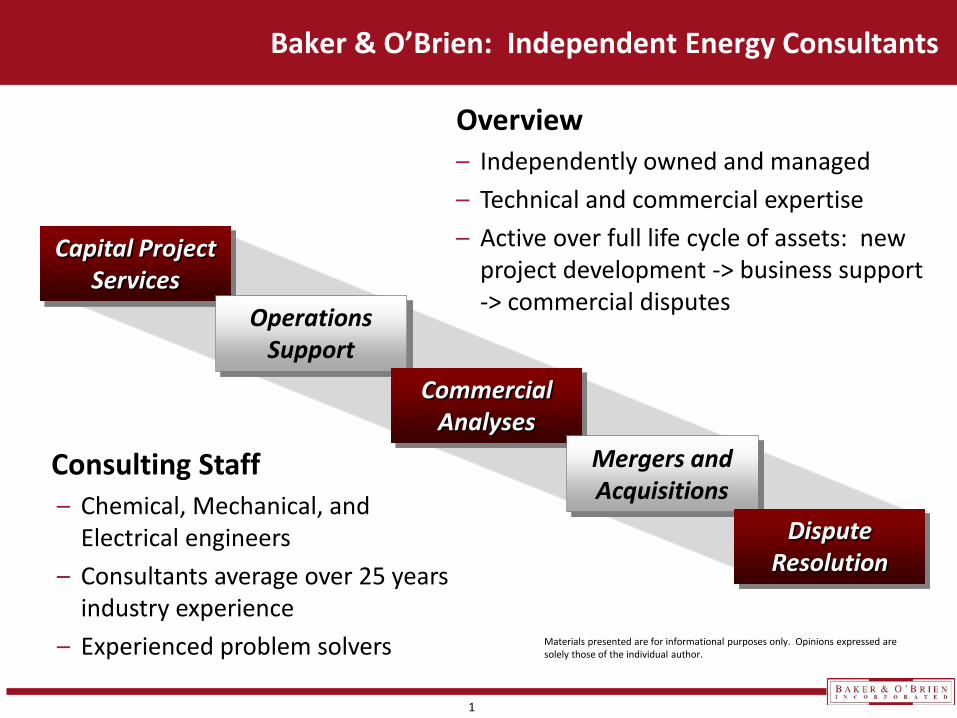
Baker & O’Brien: Independent Energy Consultants
Capital Project Services
Operations Support
Commercial Analyses
Mergers and Acquisitions
Dispute Resolution
Overview – Independently owned and managed – Technical and commercial expertise – Active over full life cycle of assets: new
project development -> business support -> commercial disputes
Consulting Staff – Chemical, Mechanical, and
Electrical engineers – Consultants average over 25 years
industry experience – Experienced problem solvers Materials presented are for informational purposes only. Opinions expressed are
solely those of the individual author.
2
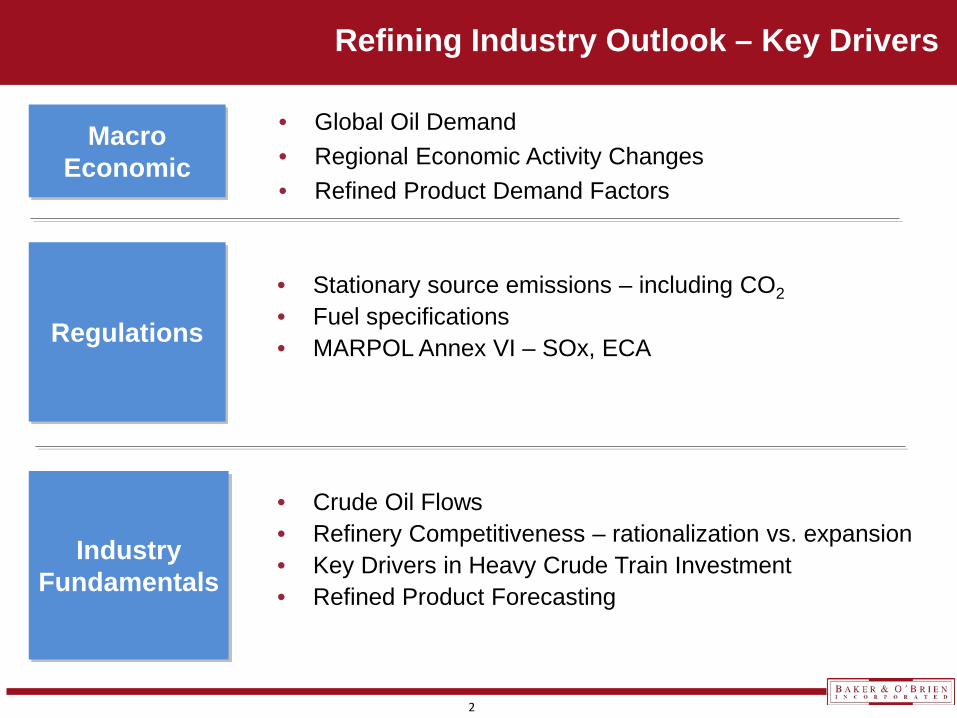
Refining Industry Outlook – Key Drivers
• Global Oil Demand • Regional Economic Activity Changes • Refined Product Demand Factors
Macro Economic
Regulations
Industry Fundamentals
• Crude Oil Flows • Refinery Competitiveness – rationalization vs. expansion • Key Drivers in Heavy Crude Train Investment • Refined Product Forecasting
• Stationary source emissions – including CO2 • Fuel specifications • MARPOL Annex VI – SOx, ECA
3
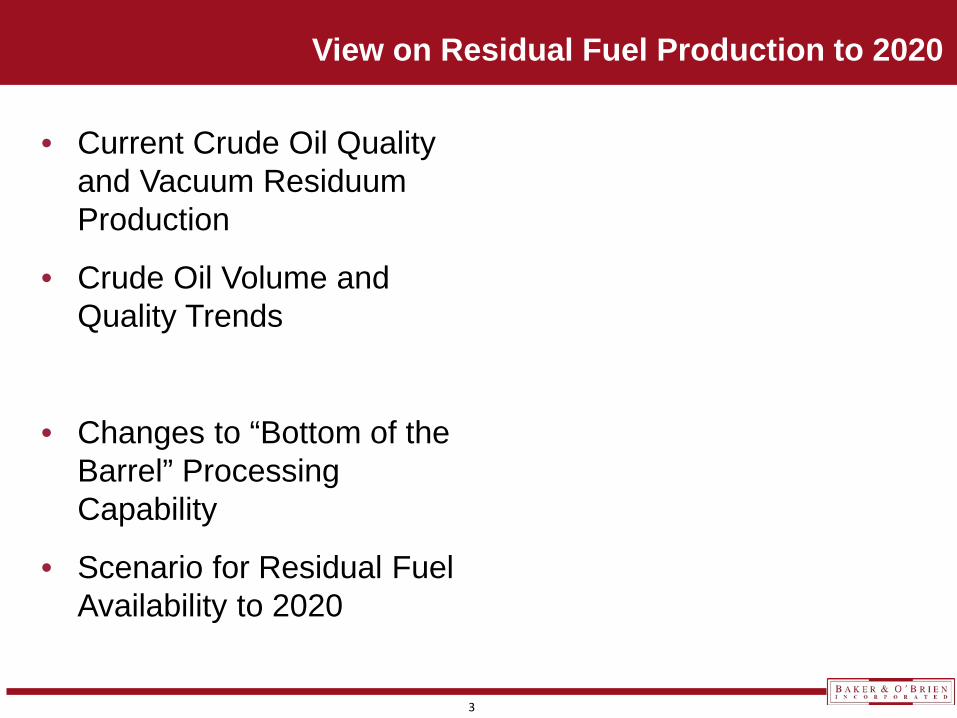
• Current Crude Oil Quality and Vacuum Residuum Production
• Crude Oil Volume and Quality Trends
• Changes to “Bottom of the Barrel” Processing Capability
• Scenario for Residual Fuel Availability to 2020
View on Residual Fuel Production to 2020
4
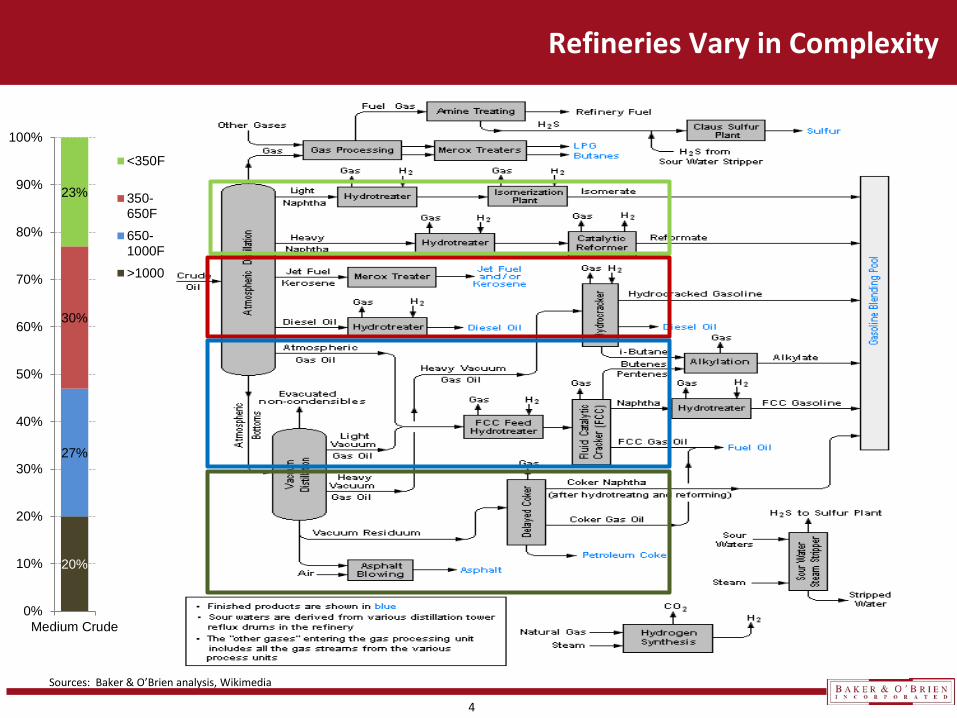
Refineries Vary in Complexity
20%
27%
30%
23%
0%
10%
20%
30%
40%
50%
60%
70%
80%
90%
100%
Medium Crude
<350F
350-650F
650-1000F
>1000F
Sources: Baker & O’Brien analysis, Wikimedia
5
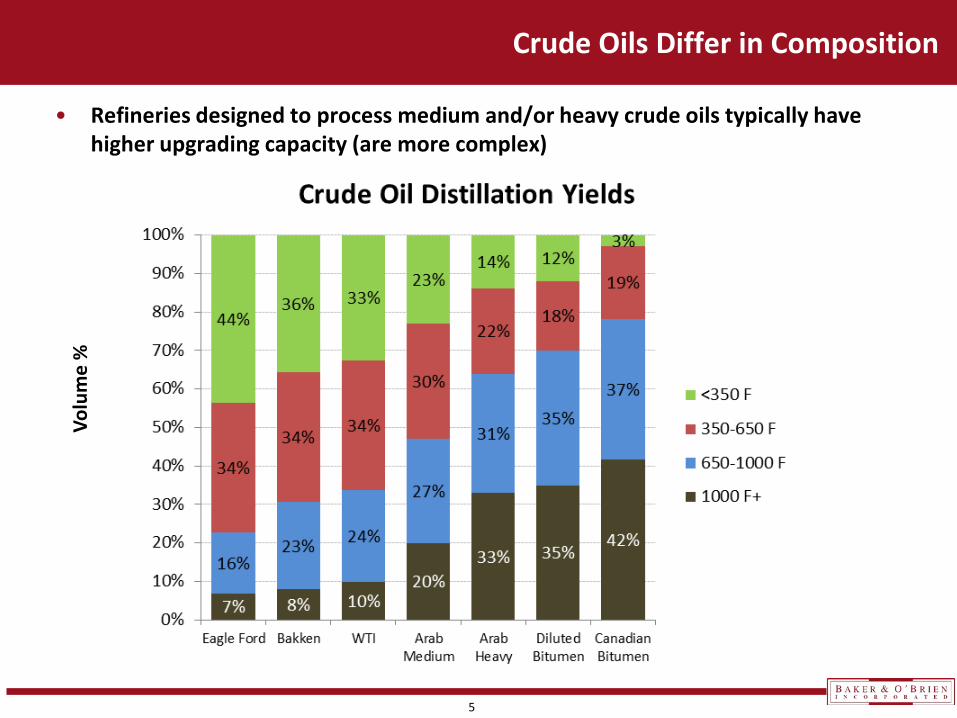
Crude Oils Differ in Composition
• Refineries designed to process medium and/or heavy crude oils typically have higher upgrading capacity (are more complex)
Volu
me
%

6
(2,000) (1,000) - 1,000 2,000 3,000 4,000
United StatesIraq
CanadaRussia
All other gainers (10)Kazakhstan
ChinaBrazil
Saudi ArabiaUnited Arab Emirates
ColombiaAzerbaijan
AngolaKuwaitYemen
SyriaMexico
United KingdomIran
NorwayLibya
All other decliners (17)
Shift in Crude Oil Production Over Last 10 Years, 000 B/D
Major Shifts in Crude Oil Production: Last 10 Years
• Net production increase: 4.2 MMB/D • Volumes lost to civil wars, sanctions
and natural field declines (North Sea and Mexico factor large) were replaced primarily with U.S. shale, Iraq, Canada and Russia
Sources: Baker & O’Brien analysis, EIA, Oil & Gas Journal, BP Statistics, Canadian Association of Petroleum Producers

7
Crude Oil Production Will Find A Market
Crude By Rail
Source: EIA
Source: EIA
0200400600800
1000
Jan-10 Jan-11 Jan-12 Jan-13 Jan-14 Jan-15
U.S
. Cru
de R
ail
Mov
emen
ts M
B/D
0%
2%
4%
6%
8%
10%
2010 2011 2012 2013 2014
Cru
de D
eliv
ered
By
Rai
l, %
of
Cru
de In
put
Year

8
0.0
0.5
1.0
1.5
2.0
2.5
North America South & CentralAmerica
Europe & Eurasia Middle East Africa Asia Pacific World
Prod
uced
Sul
fur,
wt%
Crude Sulfur Evolution
2005 2010 2014
Significant “Sweetening” of Crude Slate in North America; Relatively Static Global Sulfur Levels
• Western hemisphere trending to lower sulfur levels
• Europe and Mideast trending higher • Relatively flat on global basis
Sources: Baker & O’Brien analysis, EIA, Oil & Gas Journal, BP Statistics, Canadian Association of Petroleum Producers
9
20
22
24
26
28
30
32
34
36
North America South & CentralAmerica
Europe & Eurasia Middle East Africa Asia Pacific World
Prod
uced
Cru
de A
PI
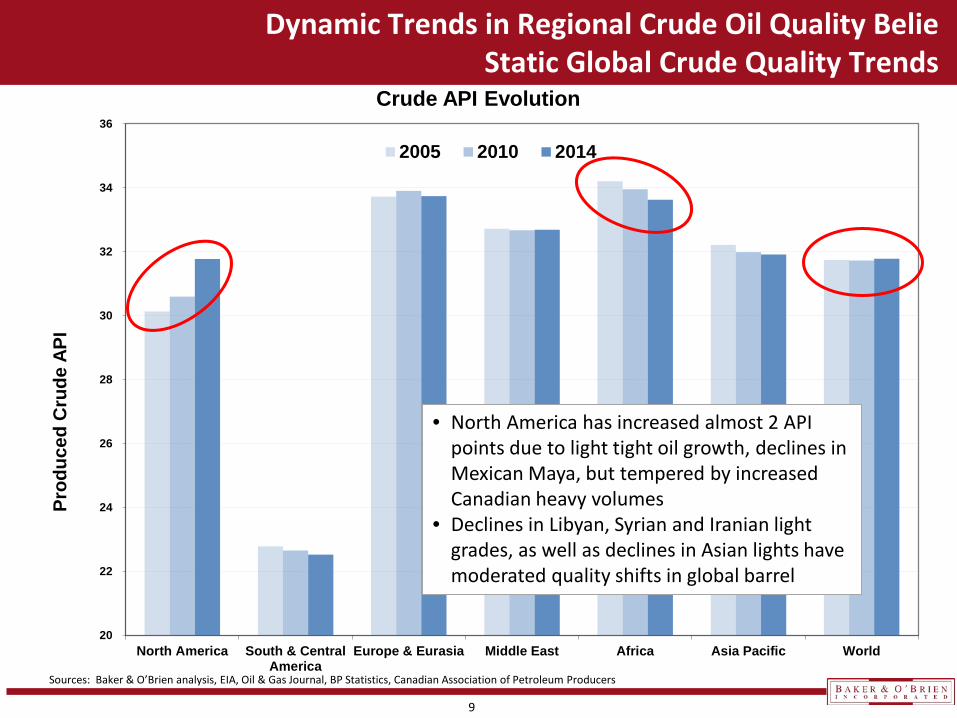
Crude API Evolution
2005 2010 2014
Dynamic Trends in Regional Crude Oil Quality Belie Static Global Crude Quality Trends
• North America has increased almost 2 API points due to light tight oil growth, declines in Mexican Maya, but tempered by increased Canadian heavy volumes
• Declines in Libyan, Syrian and Iranian light grades, as well as declines in Asian lights have moderated quality shifts in global barrel
Sources: Baker & O’Brien analysis, EIA, Oil & Gas Journal, BP Statistics, Canadian Association of Petroleum Producers

10
-
10,000
20,000
30,000
40,000
50,000
60,000
70,000
80,000
2005 2006 2007 2008 2009 2010 2011 2012 2013 2014
MB
/D
Crude Oil Production by Quality Classification
Light SweetLight SourHeavy SweetHeavy Sour
Shifting Suppliers and Impact on Crude Oil Quality Trends: Grade Shifts Are Subtle, Not Easily Discernible
Sources: Baker & O’Brien analysis, EIA, Oil & Gas Journal, BP Statistics, Canadian Association of Petroleum Producers

11
0
2,000
4,000
6,000
8,000
10,000
12,000
14,000
North America South & CentralAmerica
Europe & Eurasia Middle East Africa Asia Pacific World
Vac
Res
id Y
ield
from
Cru
de O
Il, 0
00 B
/D
Vacuum Residuum from Crude Oil (1050F+)
2005 2010 2014
Vacuum Residuum Production Has Been Increasing In Line With Total Production
• Western hemisphere trending slightly higher (higher total production, Canadian heavy, Colombia, Brazil), despite declining Mexican Maya
• Increases globally: • 120 MB/D 2005 to 2010 • 450 MB/D 2010 to 2014
Sources: Baker & O’Brien analysis, EIA, Oil & Gas Journal, BP Statistics, Canadian Association of Petroleum Producers
12
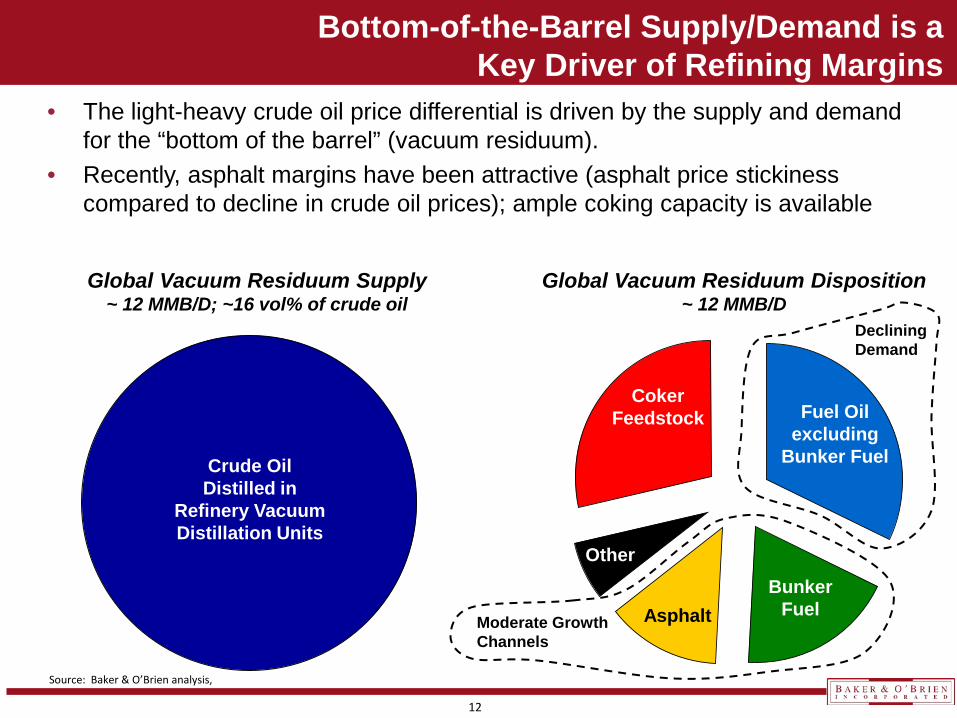
Bottom-of-the-Barrel Supply/Demand is a Key Driver of Refining Margins
• The light-heavy crude oil price differential is driven by the supply and demand for the “bottom of the barrel” (vacuum residuum).
• Recently, asphalt margins have been attractive (asphalt price stickiness compared to decline in crude oil prices); ample coking capacity is available
Fuel Oil excluding
Bunker Fuel
Bunker Fuel Asphalt
Coker Feedstock
Other
Global Vacuum Residuum Supply ~ 12 MMB/D; ~16 vol% of crude oil
Global Vacuum Residuum Disposition ~ 12 MMB/D
Crude Oil Distilled in
Refinery Vacuum Distillation Units
Moderate Growth Channels
Declining Demand
Source: Baker & O’Brien analysis,

13
• Key factors that will drive global oil balance and price – Global demand growth (China, U.S.) – OPEC resolution and actions – Shale oil production response – Return of Iranian and Libyan barrels
Crude Oil Availability Over Next Five Years: What’s Going to Happen?
Scenario A – Lower Oil Prices Linger Some combination of the following occur: • OPEC continues to defend market
share and pump oil • Stronger but moderate global demand
growth • Iranian and Libyan barrels return to
market
Scenario B – Oil Price Rebounds Faster Some combination of the following occur: • OPEC reaches consensus to support
price at some level • Chinese economy recovers • U.S. gasoline demand remains healthy • Iranian production slow to rebound • Libya remains in turmoil
Indicative net crude oil production growth required over next 5 years:
3-5 MMB/D (from 2015)

14
• Both cases assume lifting of Iran sanctions and production gains from Libya and Iraq • Under the low price scenario, the call on OPEC is fairly large by 2020, which implies price
strengthening with or without OPEC’s support • Scenario B does not require much additional production from OPEC, considering volume
gains from Iran, Iraq and Syria
Supply Scenarios 2020: Incremental Global Crude Oil Supply of 4 MMB/D
Scenario A – Sustained Low Prices
(2,000) (1,000) - 1,000 2,000 3,000 4,000 5,000 6,000
OPEC
Canada
All other gainers
China
United States
All other decliners
Possible Shift in Crude Oil Production - Scenario A (Low Price), 000 B/D
Scenario B – Price Rebound
(2,000) (1,000) - 1,000 2,000 3,000 4,000 5,000 6,000
OPEC
United States
Canada
All other gainers
China
Brazil
All other decliners
Possible Shift in Crude Oil Production - Scenario B (High Price), 000 B/D
Note: OPEC includes all OPEC member countries and reflects anticipated lifting of Iran sanctions, growth in Iraq, and production rebound from Libya
15
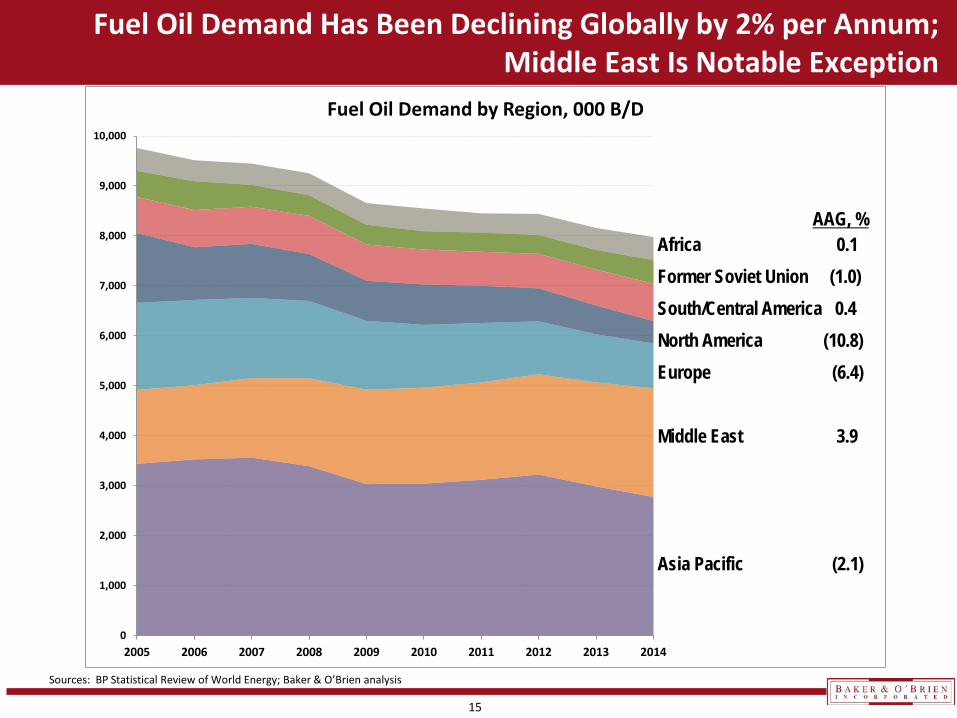
Fuel Oil Demand Has Been Declining Globally by 2% per Annum; Middle East Is Notable Exception
0
1,000
2,000
3,000
4,000
5,000
6,000
7,000
8,000
9,000
10,000
2005 2006 2007 2008 2009 2010 2011 2012 2013 2014
Fuel Oil Demand by Region, 000 B/D
Africa
Former Soviet Union
S. & Cent. America
North America
Europe
Middle East
Asia Pacific
AAG, % Africa 0.1 Former Soviet Union (1.0) South/Central America 0.4 North America (10.8) Europe (6.4) Middle East 3.9 Asia Pacific (2.1)
Sources: BP Statistical Review of World Energy; Baker & O’Brien analysis

16
Most New Export-Oriented Refineries Aiming for Full Conversion
0%
10%
20%
30%
40%
50%
60%
70%
USGC Average NWE Average New Middle East Refinery
Perc
ent o
f Cru
de C
harg
e
Conversion/Upgrading Units - USGC vs. NW Europe and Middle East
FCC
Hydrocracking
Coking
17
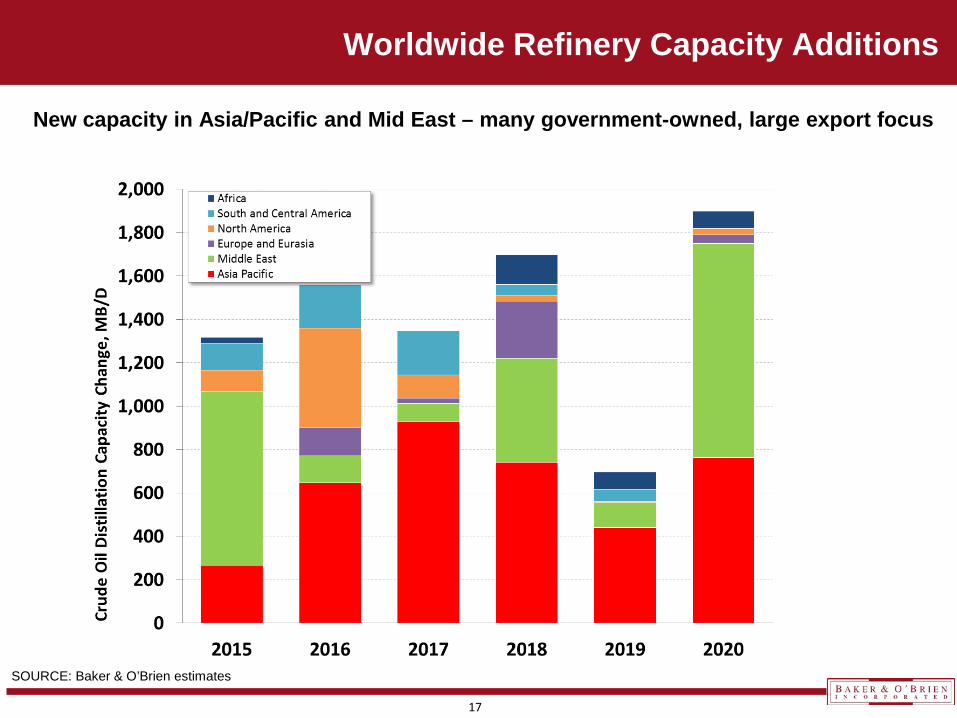
Worldwide Refinery Capacity Additions
New capacity in Asia/Pacific and Mid East – many government-owned, large export focus
SOURCE: Baker & O’Brien estimates

18
• Delayed cokers are very capital intensive, typically $3+ billion • Investment motivations vary based on owner type, location
Coker Investment Decisions
• Vertically-integrated to monetize poor-quality grades with limited markets
• Vertically-integrated and export-oriented to capture maximum value and grow industrial job base
• Long-view strategic / regulatory pressure / shrinking fuel oil markets / economics (capture light/heavy spreads)
Types of Owner • WRB, CNRL, BP, ConocoPhillips;
PDVSA – several coker JVs; PEMEX JVs going back decades
• Saudi Aramco, UAE, PDVSA
• Exxon/Antwerp; TOTAL/Port Arthur; Marathon/Garyville: Motiva/Port Arthur; Reliance/Jamnagar
Examples

19
2015 Will Cap Off a Large Wave of Coker Investments and Set Stage For Second Wave
Aruba & Hovensa Refinery Closures
Announced Capacity Additions

20
Coker Capacity Availability is Expected to Outstrip Residuum Supply Availability
SOURCE: Baker & O’Brien Analysis;
Changes in “Coker” Capacity vs. Incremental Vacuum Residuum Availability (Capacity includes a portion of new RFCC capacity and handicaps announced
coker capacity)
MB/D

21
Scenario for Residual Fuel Oil Product Supply Changes 2015 to 2020
• Incremental North America residuum is consumed by new and existing cokers • Middle East shows slight growth • Europe/Eurasia adding cokers (XOM/Antwerp, Lukoil/Perm) • Asia/Pacific adding significant full-conversion refining capacity
Note: All charts on same absolute scale to highlight regional differences
North America Europe/Eurasia
Central & South America
Africa
Asia/Pacific Middle East

22
• Static Global Crude Quality
• Net Refining Capacity Gain
• Overall Refinery Complexity Increasing
• New, world-scale high-complexity refineries replacing smaller, lower-complexity refineries
• Residue Production Will Increase
• Increase in crude production and refinery inputs will overcome any shift to lighter crude
• Incremental residue processing unit throughput (new units and increased utilization of existing) likely to exceed additional residue production
• RFO Demand Drop May Exceed Incremental Residue Conversion
• Would keep light-heavy spreads narrow
Summary and Conclusions

23
Baker & O’Brien – Independent Energy Consultants
www.bakerobrien.com
Dallas Headquarters
12001 N. Central Expressway Suite 1200
Dallas, TX 75243 Phone: 1-214-368-7626
Fax: 1-214-368-0190
Houston Office
1333 West Loop South Suite 1350
Houston, TX 77027 Phone: 1-832-358-1453
Fax: 1-832-358-1498
London Office
146 Fleet Street Suite 2
London EC4A 2BU Phone: 44-20-7373-0925