references n lemaire et al: pricing term insurance in the presence of a family history of breast or...
TRANSCRIPT

References
Lemaire et al: Pricing Term Insurance in the Presence of a Family History of Breast or Ovarian Cancer. North American Act. J., 2000, 75-87
Subramanian et al: Estimating Adverse Selection Costs From Genetic Testing for Breast and Ovarian Cancer: The Case of Life Insurance. J. of Risk and Insurance, 1999, 66, 531-550

Adverse Selection from Genetic Testing for BRCA in a Term Life Insurance Market. Inelastic and Elastic Demands
Jean LemaireThe Wharton School
Krupa SubramanianTemple University

Genetic Tests and their Implications in Insurance
Jean Lemaire
Wharton School
Krupa Subramanian
Temple University
Genetic Testing in the News
Humane Genome Project Clinton Executive Order DNA testing on death row UAE require testing prior to marriage Greek Orthodox Church requires testing Pre-marital counseling in Sardinia Alzheimer-free embryos Fear of job and insurance discrimination in public

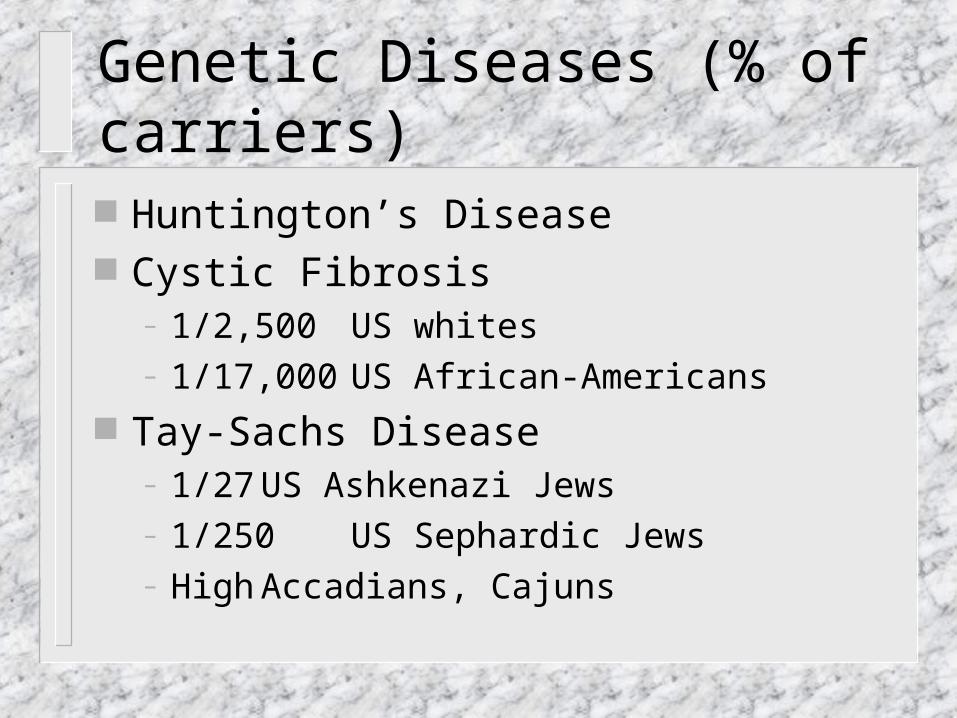
Genetic Diseases (% of carriers)
Huntington’s Disease Cystic Fibrosis
– 1/2,500 US whites– 1/17,000 US African-Americans
Tay-Sachs Disease– 1/27 US Ashkenazi Jews– 1/250 US Sephardic Jews– High Accadians, Cajuns

Sickle-Cell Anemia– 1/4 Central Africa
BRCA– 1/43 US Ashkenazi Jews– 1/833 US whites– High Iceland, Thailand
Six-fingered Drawfism– High Amish, Pennsylvania

Genes impact other diseases
Alzheimer’s Disease Diabetes Manic Depression Schizophrenia Multiple Sclerosis Rheumatoid Arthritis Thalassemia Haemophilia and over 1,100 others Over 800 tests offered

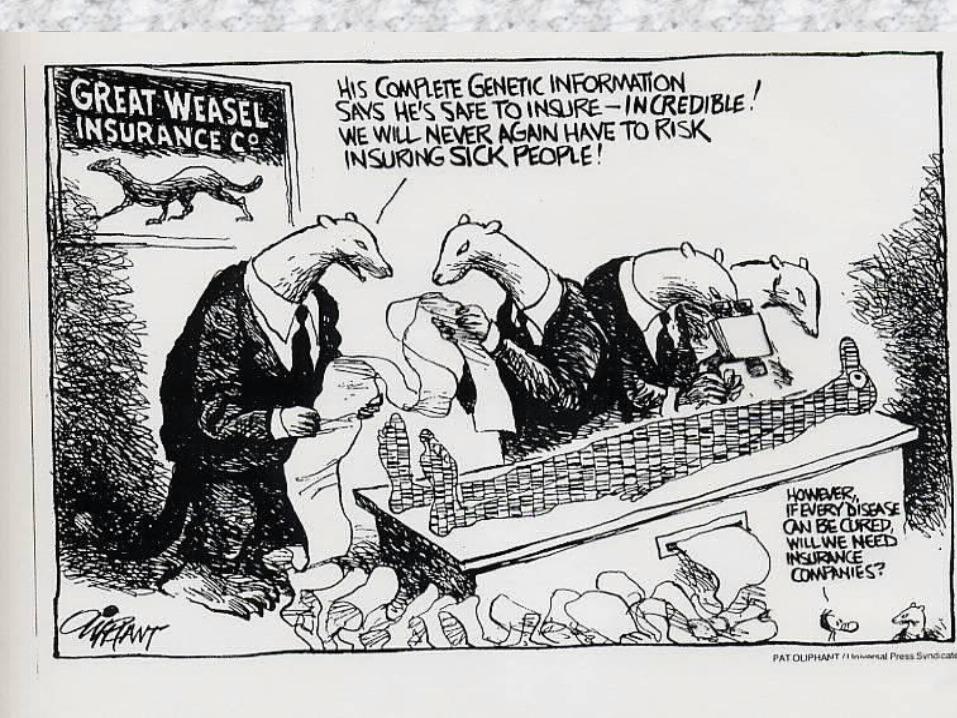
Genetic Testing Issues
Privacy concerns Voluntary testing Job and insurance discrimination Regulation addressing genetic testing Adverse selection in insurance markets

Existing Legislation
1. Laissez-faire (Australia, Canada, Japan, Ireland, Portugal, Spain)
2. Disclosure Duty (Germany, New Zealand)
3. Consent Law (Netherlands, Switzerland) Strict Prohibition (Austria, Belgium,
Denmark, France, Italy, Norway)
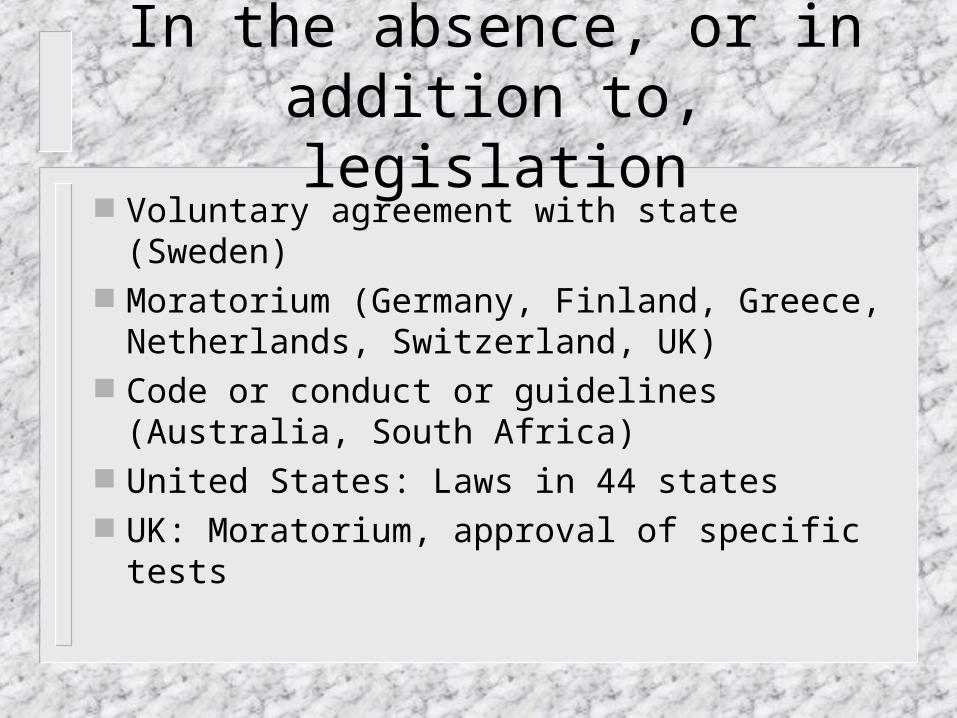
In the absence, or in addition to, legislation
Voluntary agreement with state (Sweden) Moratorium (Germany, Finland, Greece,
Netherlands, Switzerland, UK) Code or conduct or guidelines (Australia,
South Africa) United States: Laws in 44 states UK: Moratorium, approval of specific tests
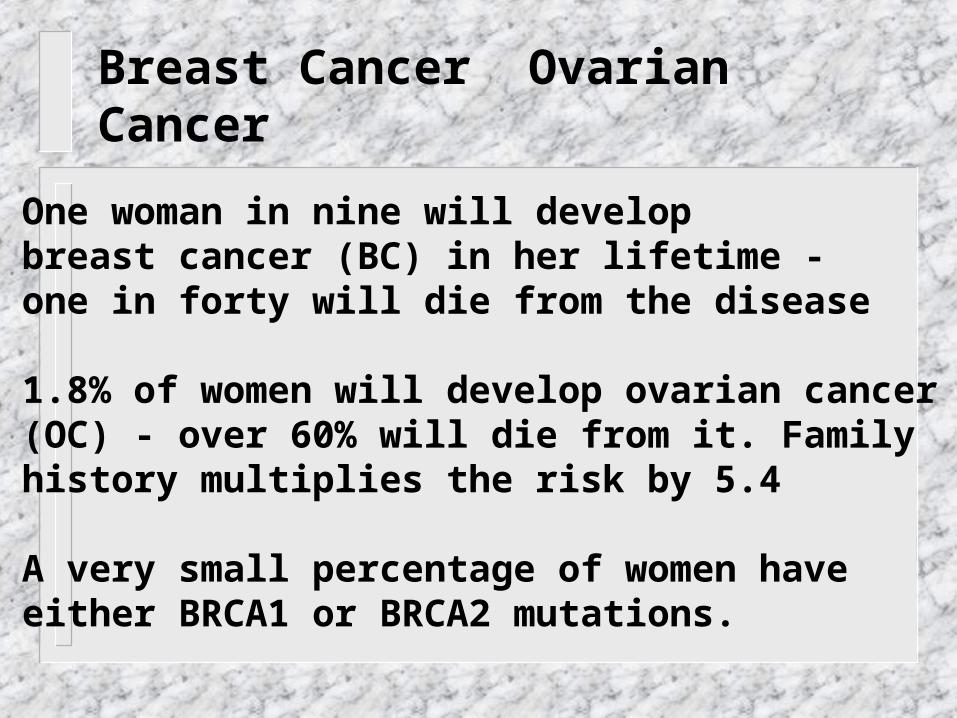
Breast Cancer Ovarian Cancer
One woman in nine will develop breast cancer (BC) in her lifetime - one in forty will die from the disease
1.8% of women will develop ovarian cancer (OC) - over 60% will die from it. Family history multiplies the risk by 5.4
A very small percentage of women have either BRCA1 or BRCA2 mutations.
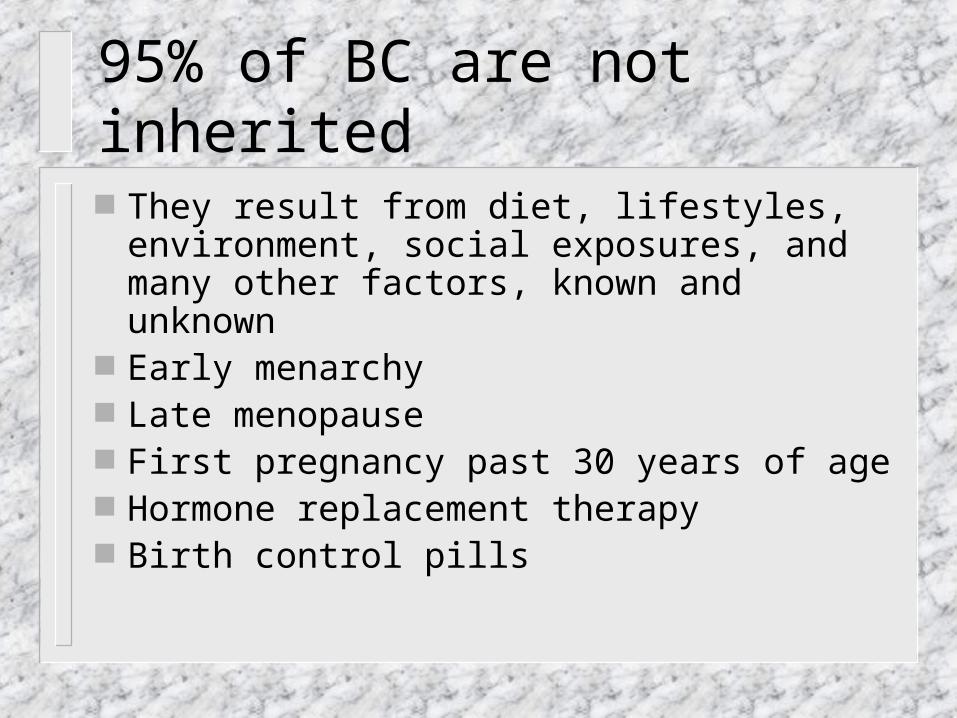
95% of BC are not inherited
They result from diet, lifestyles, environment, social exposures, and many other factors, known and unknown
Early menarchy Late menopause First pregnancy past 30 years of age Hormone replacement therapy Birth control pills

Tests for the BRCA mutation
About 5% of BC and OC are the results of a gene mutation (BRCA 1 or BRCA 2)
Since late 1997, commercial tests are available to detect the gene mutation
Full-length screening of BRCA: $2,400 Test of four mutations in BRCA1: $295
(“Ashkenazi test”)

Breast Cancer Ovarian Cancer
Lifetime Cancer Risks for BRCA1/2:
- breast (female): 56-85%- breast (male): 6%- ovarian: 10-60%- prostate, colon, pancreas cancers
Without the mutation, the age at onset is Normal(68, 225).
With the mutation, the age at onset is Normal(55, 225).

Estimates from Claus et al
Cumulative Probability of developing BC for a woman who has one First-Degree relative affected with BC, by age of onset of the affected relative
Age ofwoman age of onset in affected relative
20-29 30-39 40-49 50-59 60-69 70-7929 .007 .005 .003 .002 .002 .00139 .025 .017 .012 .008 .006 .00549 .062 .044 .032 .023 .018 .01559 .116 .086 .064 .049 .040 .03569 .171 .130 .101 .082 .070 .06279 .211 .165 .132 .110 .096 .088

Double Decrement Model for BC
Alive, without BC
Alive, with BC
Death, affected with
BC
Death, from causes other
than BC

Double Decrement Model for BC
1k
0j
BC
kx
BC
1jx1jk
)2(
jx
)(
xj
BC
xk)j(q)j(pqpq

Double Decrement Model for OC
1k
0jOC
2/1kx2/1)3(kx
)(xk
OCkx
OC2/1jx2/1jk
)3(jx
)(xj
OCxk
)k(qqp
)j(q)j(pqpq
BC Survival Probabilities
Exponential Decay, with 3.6% annual death probability
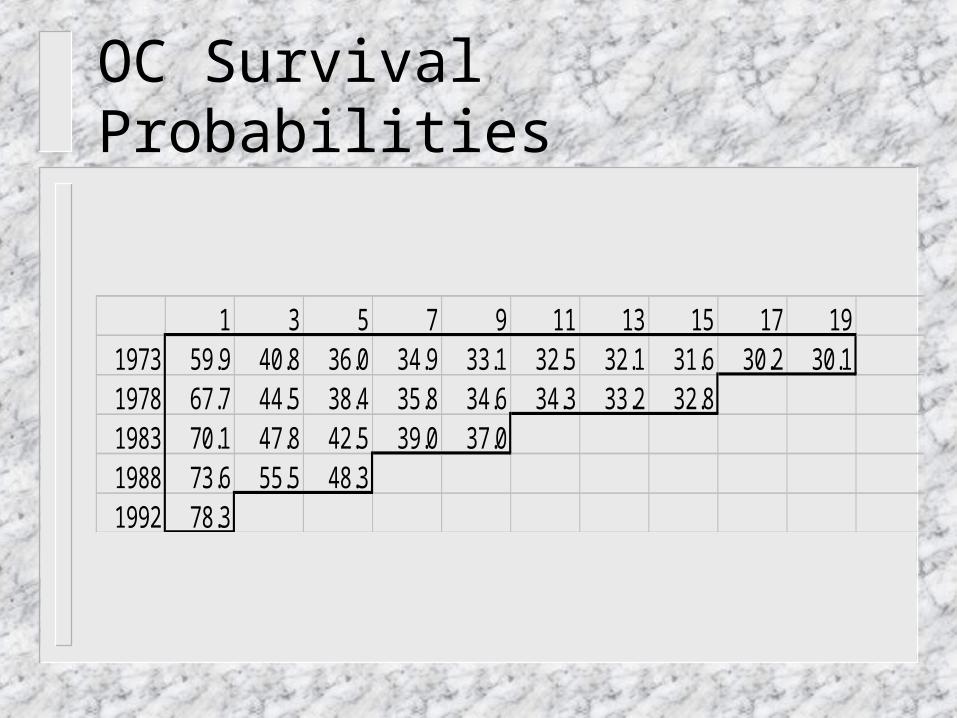
OC Survival Probabilities
1 3 5 7 9 11 13 15 17 191973 59.9 40.8 36.0 34.9 33.1 32.5 32.1 31.6 30.2 30.11978 67.7 44.5 38.4 35.8 34.6 34.3 33.2 32.81983 70.1 47.8 42.5 39.0 37.01988 73.6 55.5 48.31992 78.3

The Separation Method
Cij = pi Ii+j-1
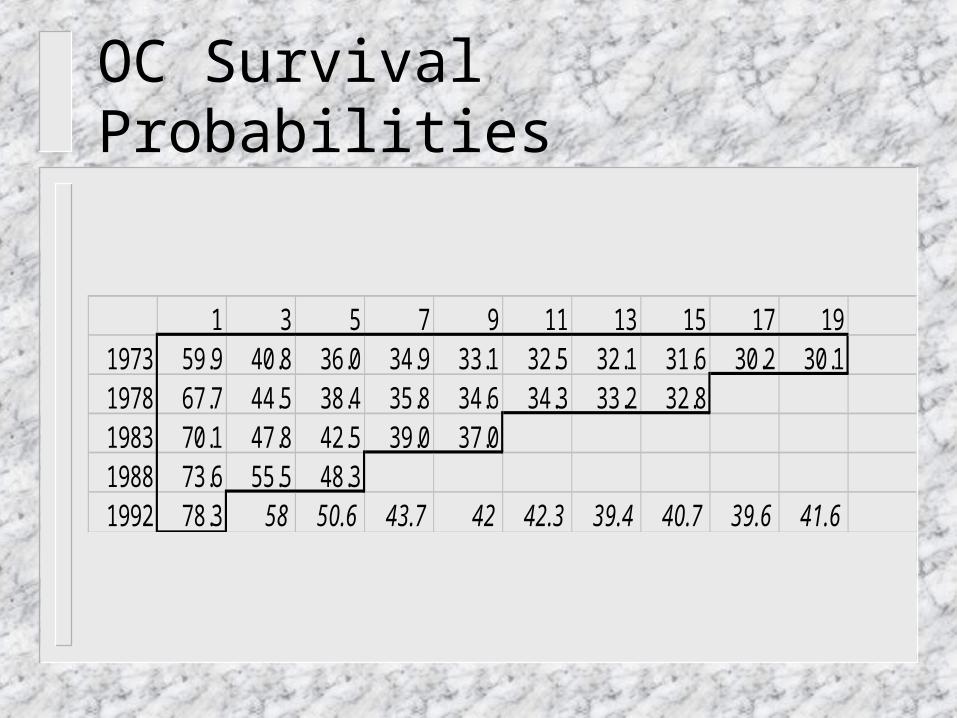
OC Survival Probabilities
1 3 5 7 9 11 13 15 17 191973 59.9 40.8 36.0 34.9 33.1 32.5 32.1 31.6 30.2 30.11978 67.7 44.5 38.4 35.8 34.6 34.3 33.2 32.81983 70.1 47.8 42.5 39.0 37.01988 73.6 55.5 48.31992 78.3 58 50.6 43.7 42 42.3 39.4 40.7 39.6 41.6

Mortality Ratios for 30 year old woman, according to family history
AGE 1 FDR-BC 1 SDR-BC 2 FDR-BC 1 FDR-OC
BRCA
31 1.0000 1.0000 1.0000 1.0302 1.029833 1.0345 1.0161 1.1051 1.1946 1.354335 1.0999 1.0465 1.3034 1.4011 1.861537 1.1822 1.0848 1.5518 1.5958 2.432339 1.2627 1.1225 1.7927 1.7350 2.932241 1.3385 1.1580 2.0159 1.7070 3.235143 1.3004 1.1391 1.9045 1.5812 2.930045 1.2976 1.1358 1.8999 1.6926 3.013347 1.3026 1.1362 1.9167 1.8143 3.136749 1.3174 1.1414 1.9586 1.9083 3.2691

Mortality Ratios for Common Conditions and Diseases
DISEASE MEASUREMENT -RATIOSystolic bloodpressure 158-167 (men) 2.06Systolic bloodpressure 178-187 (women) 2.78Diabetes mellitus Men 2.50Build 40% overweight (women) 1.62Build 60% overweight (men) 2.60Epilepsy All types 2.78Alcoholism 5 drinks a day 3.00Smoking Average (men) 1.70Smoking 40 cigarettes/day (men) 2.00HIV 35-year-old male 50.00
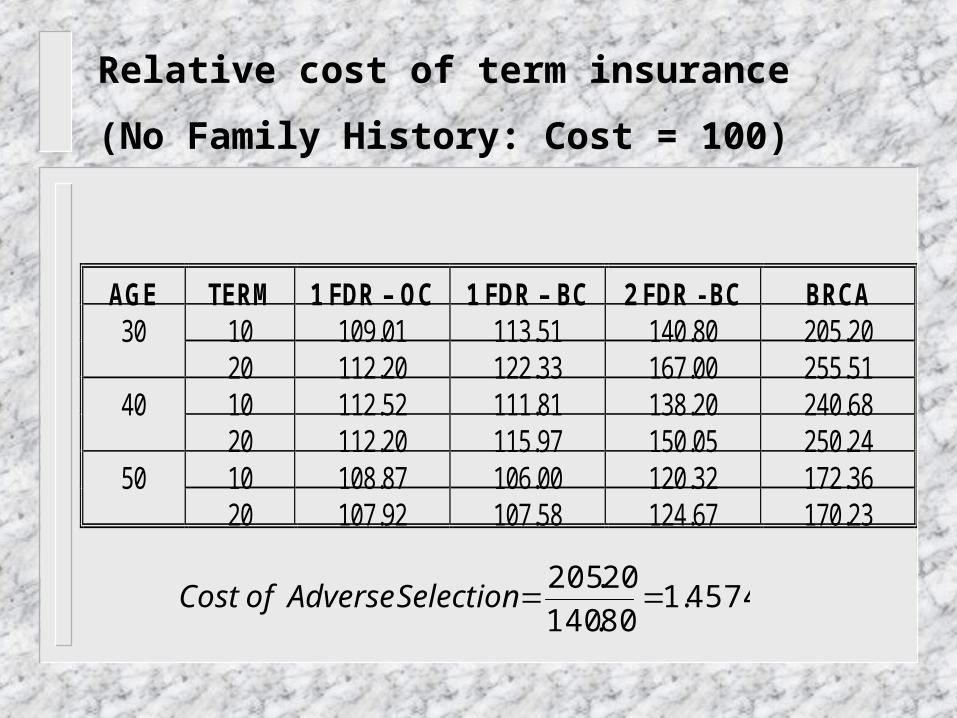
Relative cost of term insurance
(No Family History: Cost = 100)
AGE TERM 1 FDR – OC 1 FDR – BC 2 FDR - BC BRCA10 109.01 113.51 140.80 205.203020 112.20 122.33 167.00 255.5110 112.52 111.81 138.20 240.684020 112.20 115.97 150.05 250.2410 108.87 106.00 120.32 172.365020 107.92 107.58 124.67 170.23
4574.180.140
20.205SelectionAdverseofCost

Adverse Selection Markov Model
•First model: Inelastic Demand
•Discrete-state, continuous-time Markov Model

Not TestedNot Insured
Not TestedInsured
Test NegativeNever Buy or Lapses
DEAD
Test NegativeSame Insurance
Test NegativeBuy Less
Test PositiveSame Insurance
Test PositiveBuy Less
Test NegativeBuy Insurance
412 6
Test NegativeBuy More
Test PositiveBuy More
7 10
11
9
2
Test PositiveBuy Insurance
5
14
Lapse
8
Test PositiveNever Buy or Lapses
13
1
3
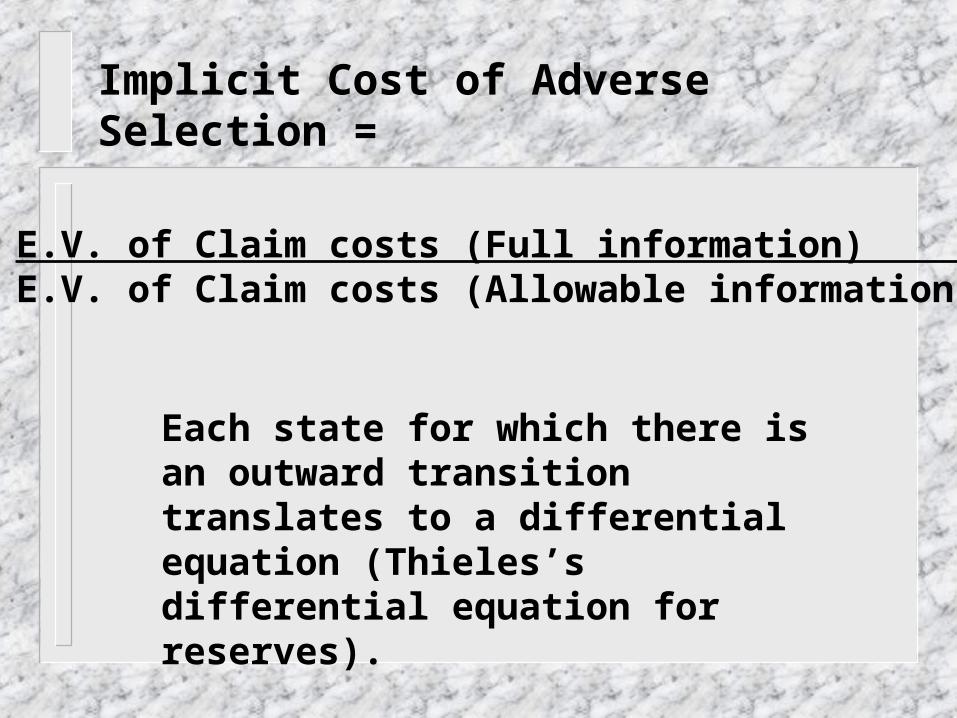
Implicit Cost of Adverse Selection =
E.V. of Claim costs (Full information) E.V. of Claim costs (Allowable information)
Each state for which there is an outward transition translates to a differential equation (Thieles’s differential equation for reserves).

jk
t
j)1(
tjk
k)1(
t
jk
t
j)1(
tt
j)1(
t)VVb(VV
dt
d
where
Vtj( )1 Benefit reserve for State j at time t
Vtk()1 Benefit reserve for State k at time t
t Force of interest at time tbtjk Payments due upon transitions from state j
btjk to state k.tjk Intensity of transition from state j to state k
tjk at time t.
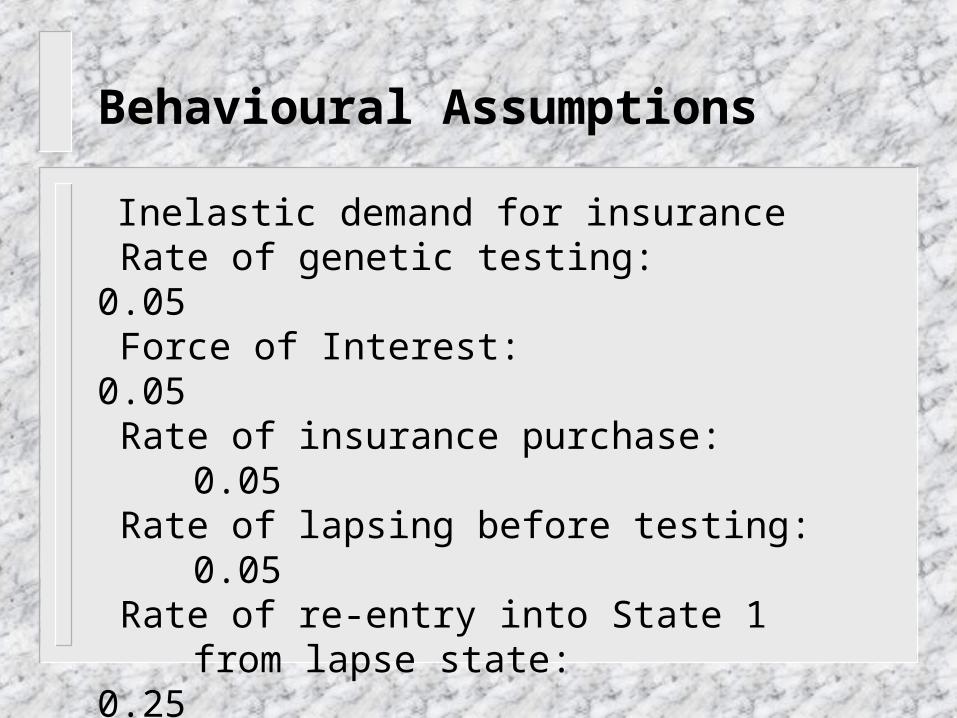
Behavioural Assumptions
Inelastic demand for insurance Rate of genetic testing: 0.05 Force of Interest: 0.05 Rate of insurance purchase: 0.05 Rate of lapsing before testing: 0.05 Rate of re-entry into State 1
from lapse state: 0.25

Behavioural Assumptions
If insured and test positive:
P(more insurance) = 0.27P(same insurance) = 0.70
P(less insurance) = 0.02P(lapse policy) = 0.01
If insured and test negative:
P(more insurance) = 0.01P(same insurance) = 0.75P(less insurance) = 0.17
P(lapse policy) = 0.07
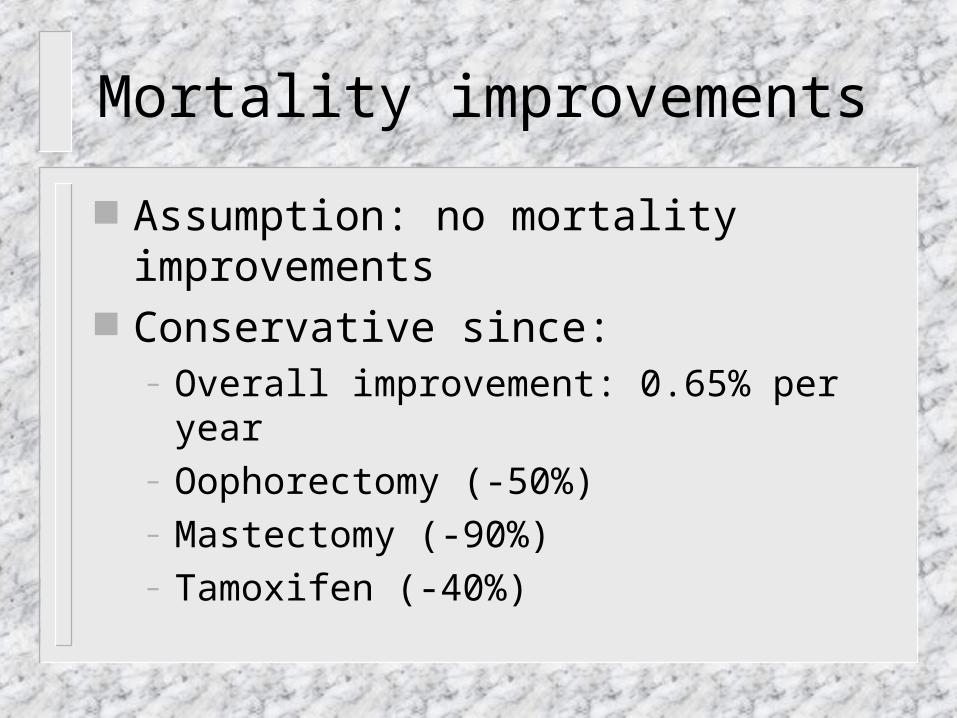
Mortality improvements
Assumption: no mortality improvements Conservative since:
– Overall improvement: 0.65% per year– Oophorectomy (-50%)– Mastectomy (-90%)– Tamoxifen (-40%)
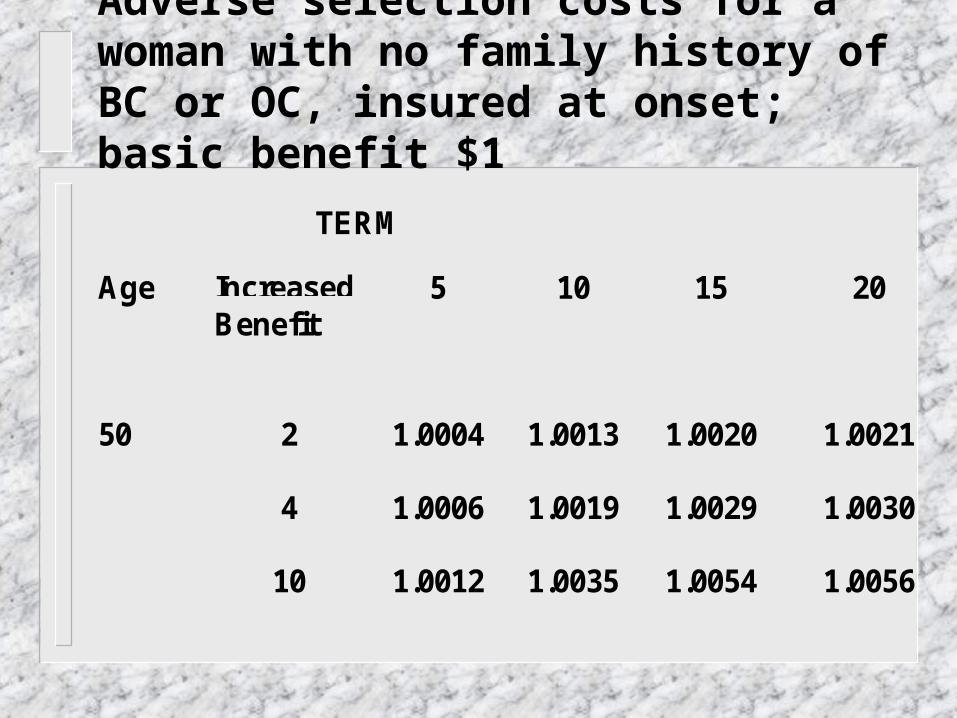
TERM
Age IncreasedBenefit
5 10 15 20
50 2 1.0004 1.0013 1.0020 1.0021
4 1.0006 1.0019 1.0029 1.0030
10 1.0012 1.0035 1.0054 1.0056
Adverse selection costs for a woman with no family history of BC or OC, insured at onset; basic benefit $1
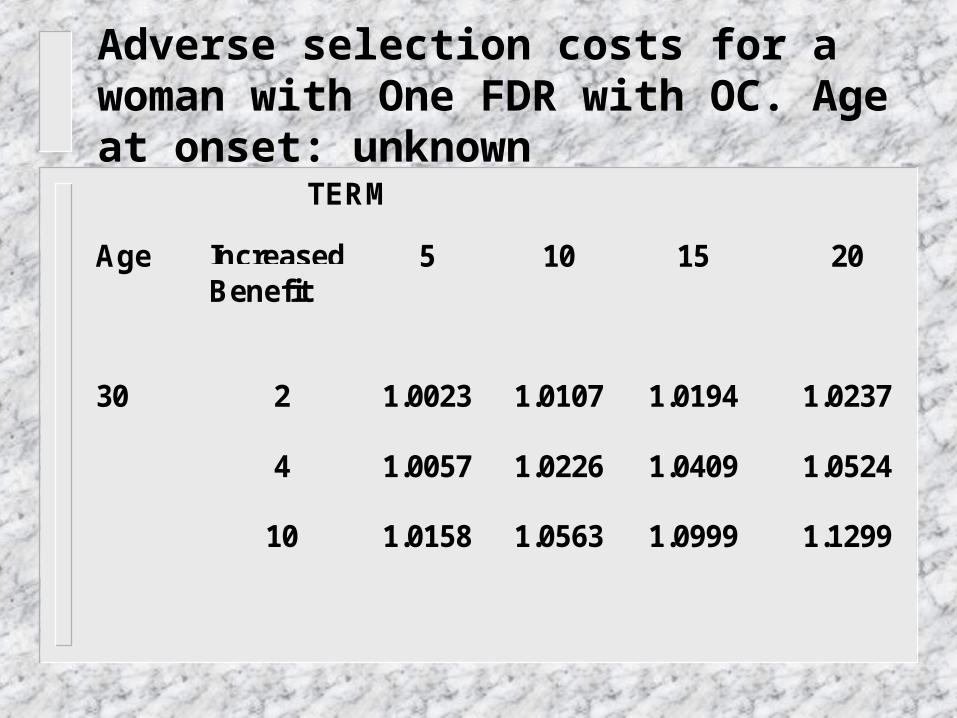
Adverse selection costs for a woman with One FDR with OC. Age at onset: unknown
TERM
Age IncreasedBenefit
5 10 15 20
30 2 1.0023 1.0107 1.0194 1.0237
4 1.0057 1.0226 1.0409 1.0524
10 1.0158 1.0563 1.0999 1.1299

Adverse selection costs for a woman with one FDR with BC, age at Onset: 20-29.
TERM
Age IncreasedBenefit
5 10 15 20
30 2 1.0065 1.0177 1.0294 1.0386
4 1.0126 1.0369 1.0626 1.0825
10 1.0300 1.0893 1.1495 1.1935

TERM
Age IncreasedBenefit
5 10 15 20
40 2 1.0144 1.0380 1.0544 1.0523
4 1.0233 1.0632 1.0925 1.0928
10 1.0489 1.1322 1.1924 1.1949

TERM
Age IncreasedBenefit
5 10 15 20
50 2 1.0079 1.0197 1.0271 1.0250
4 1.0128 1.0331 1.0468 1.0449
10 1.0269 1.0698 1.0985 1.0952

Adverse selection costs for a woman with two FDR with BC, Age at Onset: 20-29
TERM
Age IncreasedBenefit
5 10 15 20
30 2 1.0089 1.0168 1.0237 1.0294
4 1.0186 1.0421 1.0631 1.0787
10 1.0445 1.1034 1.1510 1.1819

Sensitivity Analysis: 40-year old Woman, 2 FDR with BC
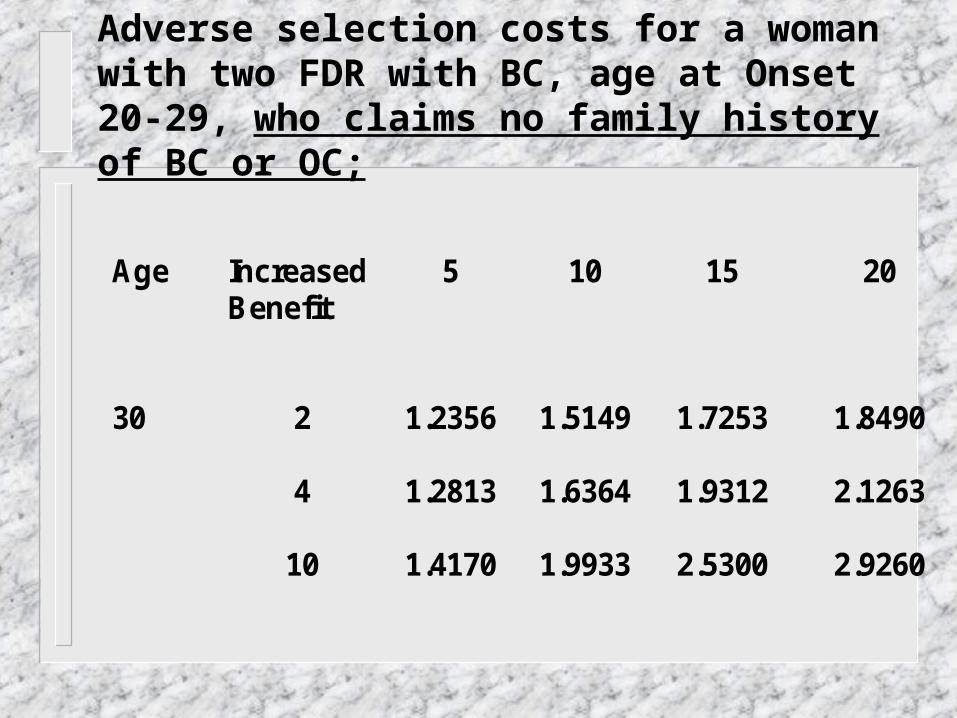
Adverse selection costs for a woman with two FDR with BC, age at Onset 20-29, who claims no family history of BC or OC;
Age Increased Benefit
5 10 15 20
30 2 1.2356 1.5149 1.7253 1.8490
4 1.2813 1.6364 1.9312 2.1263
10 1.4170 1.9933 2.5300 2.9260
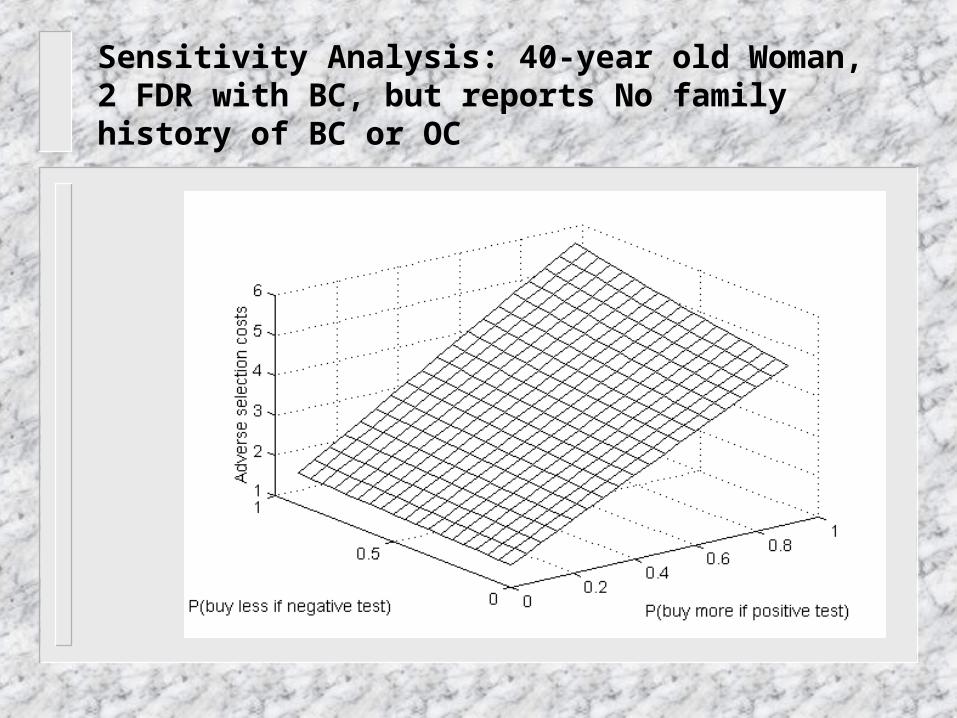
Sensitivity Analysis: 40-year old Woman, 2 FDR with BC, but reports No family history of BC or OC
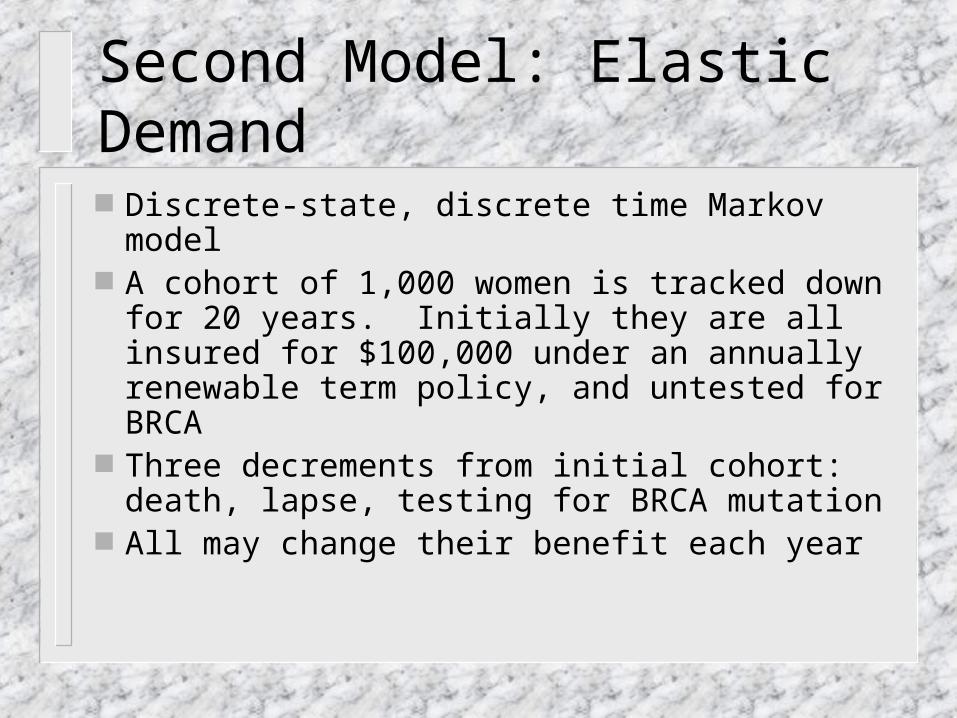
Second Model: Elastic Demand
Discrete-state, discrete time Markov model A cohort of 1,000 women is tracked down
for 20 years. Initially they are all insured for $100,000 under an annually renewable term policy, and untested for BRCA
Three decrements from initial cohort: death, lapse, testing for BRCA mutation
All may change their benefit each year

Adverse selection results from
Differentiated lapsing rates: women testing positive will exhibit a lower lapsing rate
Differentiated benefits: women testing positive are more likely to increase their benefits
Different reactions to price increases: women testing positive are more likely to accept a price increase

The insurance company
Will increase premiums as a result of adverse selection
Myopic reaction of insurer is assumed: each year, it calculates past losses, and attempts to recoup them by increasing premiums
The same % premium increase is applied to each rating cell
Twelve rating cells: Ages 30, 40, 50. 1 FDR-BC, 2 FDR-BC, 1 FDR OC, No family history

The insurer never fully recovers losses, as it is always one step behind: it does not anticipate the fact that customers constantly change insurance purchasing behaviour as a result of pricing decisions
Other pricing strategies are possible: the insurer could anticipate future mortality trends in portfolio

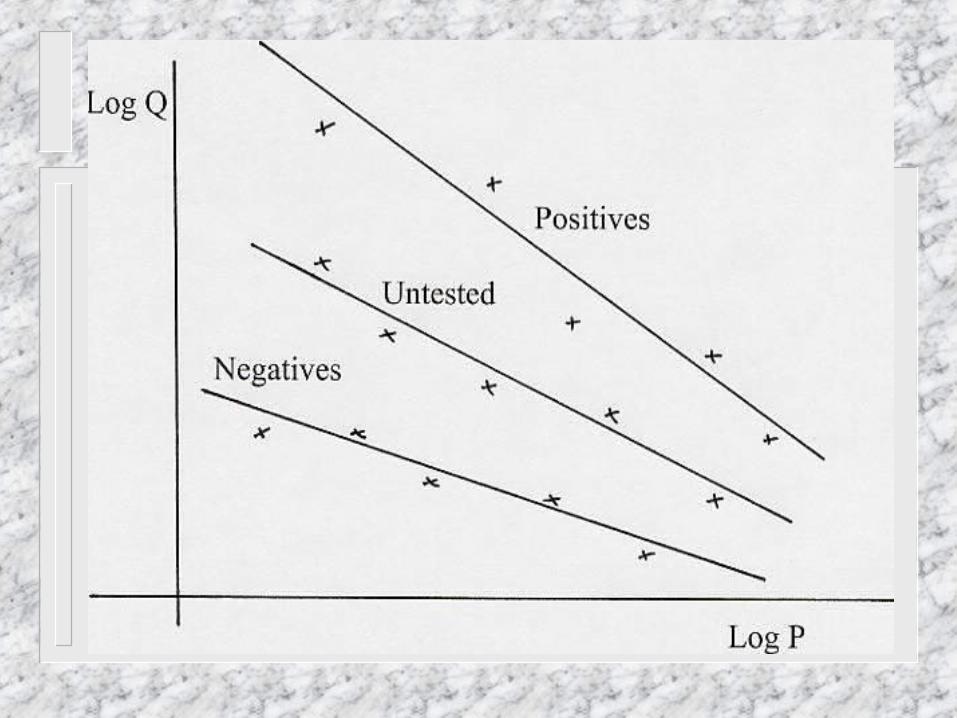
Elastic Demand
Marshall’s Law of Demand: PλQ = Cst λ is the constant elasticity of demand with
respect to price: λ = - (dQ/Q) / (dP/P) We expect “price elasticity” parameters
such that λpositives < λuntested < λnegatives

Elasticity Estimate Robust estimate of elasticity: 0.6579. Age, gender, education, marital status,
income, do not affect elasticity in a significant way.
Health status has little effect on elasticity Modified benefits are calculated based on
price increases due to adverse selection only (not on regular increases due to mortality)
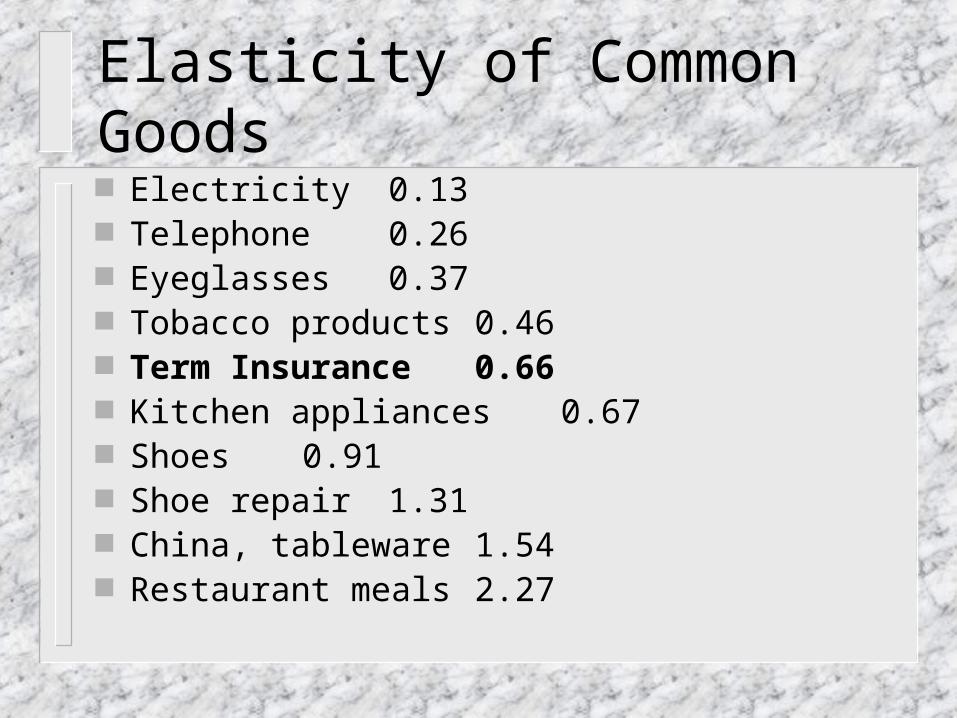
Elasticity of Common Goods Electricity 0.13 Telephone 0.26 Eyeglasses 0.37 Tobacco products 0.46 Term Insurance 0.66 Kitchen appliances 0.67 Shoes 0.91 Shoe repair 1.31 China, tableware 1.54 Restaurant meals 2.27

Other Inputs in Model* Lapse rates: averaging 9% for untested, 2%
for positives, 9.5% for negatives* Annual testing rate: 5%* Annual interest rate: 5%* P(death) for all cases* P(test positive) =
– 0.40 (2 FDR BC)– 0.15 (1 FDR BC)– 0.08 (1 FDR OC)– 0.005 (No Family History)

0
0.2
0.4
0.6
0.8
1
1.2
1.4
Year
% I
ncr
ease
Annual Increases – 2 FDR BC 30
0
2
4
6
8
10
12
14
16
18
20
Year
% I
ncr
ease
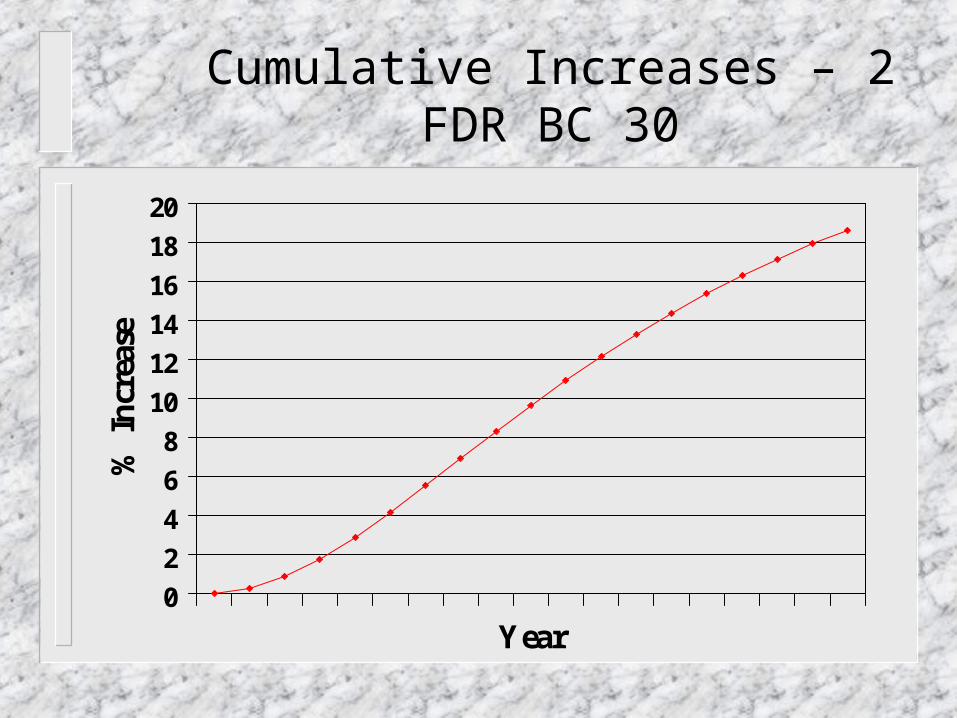
Cumulative Increases – 2 FDR BC 30

Conclusions
Role of actuary:
In the presence of irreconcilable differences, in an emotional situation, inject figures in the debate to create a more rational discussion
Conclusions
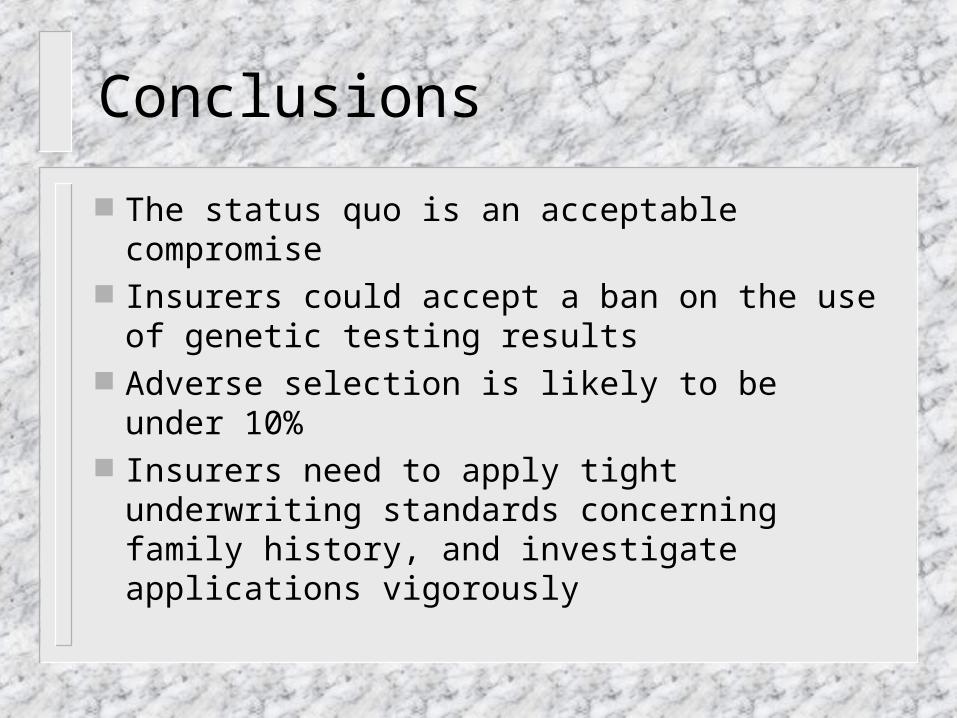
The status quo is an acceptable compromise Insurers could accept a ban on the use of
genetic testing results Adverse selection is likely to be under 10% Insurers need to apply tight underwriting
standards concerning family history, and investigate applications vigorously

Conclusions
Consumers can accept family history The vast majority of applicants (no FH, 1
FDR-BC, 1 SDR) will be accepted at standard rates
A few applicants (1 FDR-OC, 2 FDR) will be accepted with a surcharge
Women testing positive will be accepted
Conclusions
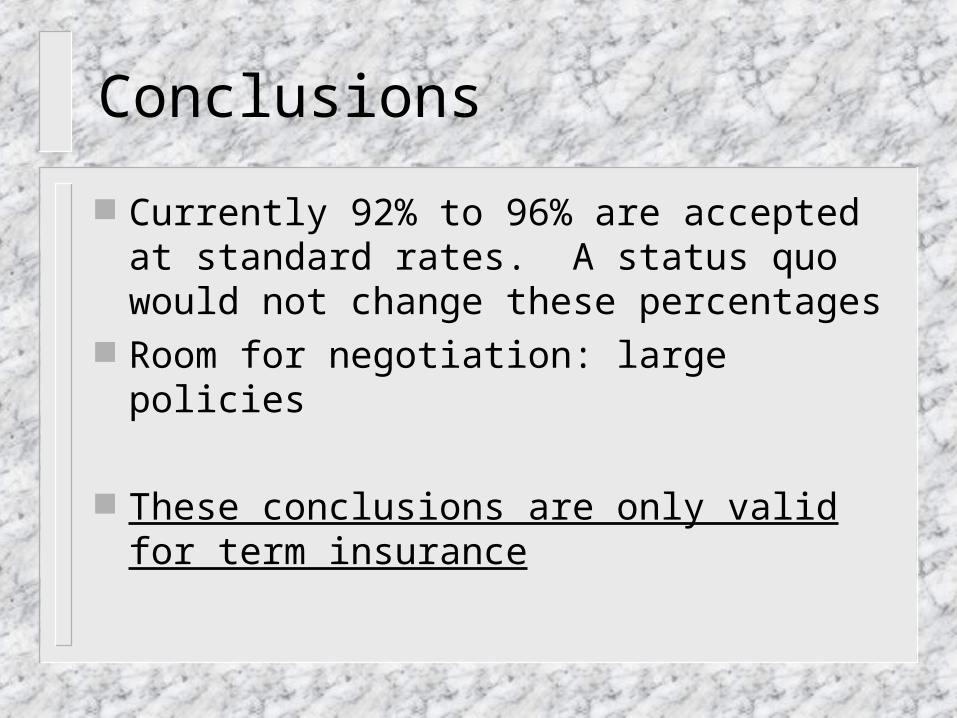
Currently 92% to 96% are accepted at standard rates. A status quo would not change these percentages
Room for negotiation: large policies
These conclusions are only valid for term insurance