reference into part iii of this annual report
TRANSCRIPT

Table of Contents
UNITED STATESSECURITIES AND EXCHANGE COMMISSION
WASHINGTON, D.C. 20549
FORM 10-K☒ ANNUAL REPORT PURSUANT TO SECTION 13 OR 15 (d) OF THE SECURITIES EXCHANGE ACT OF 1934
For the fiscal year ended January 3, 2021OR
☐ TRANSITION REPORT PURSUANT TO SECTION 13 OR 15 (d) OF THE SECURITIES EXCHANGE ACT OF1934
For the transition period from _____________ to ________
Commission File Number: 001-35373
FIESTA RESTAURANT GROUP, INC.(Exact name of Registrant as specified in its charter)
Delaware 90-0712224(State or other jurisdiction of incorporation or organization)
(I.R.S. Employer Identification No.)
14800 Landmark Boulevard, Suite 500 75254Dallas TX (Zip Code)
(Address of principal executive office)
Registrant's telephone number, including area code: (972) 702-9300Securities registered pursuant to Section 12(b) of the Act:
Title of each class: Trading Symbol Name on each exchange on which registered:Common Stock, par value $.01 per share FRGI NASDAQ Global Select Market
Securities registered pursuant to Section 12(g) of the Act: NoneIndicate by check mark if the registrant is a well-known seasoned issuer, as defined in Rule 405 of the Securities Act. Yes ☐ No ☒Indicate by check mark if the registrant is not required to file reports pursuant to Section 13 or 15(d) of the Act. Yes ☐ No ☒Indicate by check mark whether the registrant (1) has filed all reports required to be filed by Section 13 or 15(d) of the Securities Exchange Act of 1934
during the preceding 12 months (or for such shorter period that the registrant was required to file such reports), and (2) has been subject to such filing requirementsfor the past 90 days. Yes ☒ No ☐
Indicate by check mark whether the registrant has submitted electronically every Interactive Data File required to be submitted pursuant to Rule 405 ofRegulation S-T (§ 232.405 of this chapter) during the preceding 12 months (or for such shorter period that the registrant was required to submit suchfiles). Yes ☒ No ☐ Indicate by check mark whether the registrant is a large accelerated filer, an accelerated filer, a non-accelerated filer, a smaller reporting company, or anemerging growth company. See the definitions of "large accelerated filer", "accelerated filer", "smaller reporting company" and "emerging growth company" inRule 12b-2 of the Exchange Act.
Large Accelerated Filer ☐ Accelerated Filer ☒
Non-accelerated Filer ☐ Smaller reporting company ☒
Emerging growth company ☐
If an emerging growth company, indicate by check mark if the registrant has elected not to use the extended transition period for complying with any new orrevised financial accounting standards provided pursuant to Section 13(a) of the Exchange Act. ☐
Indicate by check mark whether the registrant has filed a report on and attestation to its management’s assessment of the effectiveness of its internal controlover financial reporting under Section 404(b) of the Sarbanes-Oxley Act (15 U.S.C. 7262(b)) by the registered public accounting firm that prepared or issued itsaudit report. ☒
Indicate by check mark whether the registrant is a shell company (as defined in Rule 12b-2 of the Exchange Act). Yes ☐ No ☒The aggregate market value of the voting and non-voting common stock held by non-affiliates as of June 28, 2020, of Fiesta Restaurant Group, Inc. was
$104,660,040.As of February 26, 2021, Fiesta Restaurant Group, Inc. had 26,283,998 shares of its common stock, $.01 par value, outstanding.
DOCUMENTS INCORPORATED BY REFERENCEPortions of the registrant's definitive Proxy Statement for Fiesta Restaurant Group, Inc.'s 2021 Annual Meeting of Stockholders, which is expected to be filedpursuant to Regulation 14A no later than 120 days after the conclusion of Fiesta Restaurant Group, Inc.'s fiscal year ended January 3, 2021, are incorporated by

reference into Part III of this annual report.
Table of Contents
FIESTA RESTAURANT GROUP, INC.FORM 10-K
YEAR ENDED JANUARY 3, 2021
PagePART IItem 1 Business 4Item 1A Risk Factors 16Item 1B Unresolved Staff Comments 27Item 2 Properties 28Item 3 Legal Proceedings 28Item 4 Mine Safety Disclosures 28
PART IIItem 5 Market for Registrant's Common Equity, Related Stockholder Matters and Issuer Purchases of Equity
Securities 29Item 6 Selected Financial Data 31Item 7 Management's Discussion and Analysis of Financial Condition and Results of Operations 38Item 7A Quantitative and Qualitative Disclosures about Market Risk 59Item 8 Financial Statements and Supplementary Data 59Item 9 Changes In and Disagreements with Accountants on Accounting and Financial Disclosure 59Item 9A Controls and Procedures 59Item 9B Other Information 62
PART IIIItem 10 Directors, Executive Officers and Corporate Governance 63Item 11 Executive Compensation 63Item 12
Security Ownership of Certain Beneficial Owners and Management and Related Stockholder Matters 63Item 13 Certain Relationships and Related Transactions, and Director Independence 63Item 14 Principal Accountant Fees and Services 63
PART IVItem 15 Exhibits and Financial Statement Schedules 64Item 16 Form 10-K Summary 61
1
Table of Contents
PART I
Presentation of InformationThroughout this Annual Report on Form 10-K, we refer to Fiesta Restaurant Group, Inc. as "Fiesta Restaurant Group" or "Fiesta" and, together with its
consolidated subsidiaries, as "we," "our" and "us" unless otherwise indicated or the context otherwise requires. Any reference to restaurants refers to company-owned restaurants unless otherwise indicated.
We own, operate and franchise two fast-casual restaurant brands, Pollo Tropical® and Taco Cabana®, through our wholly-owned subsidiaries PolloOperations, Inc. and its subsidiaries, and Pollo Franchise, Inc., (collectively "Pollo Tropical") and Taco Cabana, Inc. and its subsidiaries (collectively "TacoCabana"). Our common stock is traded on The NASDAQ Global Select Market under the symbol "FRGI".
We use a 52- or 53-week fiscal year ending on the Sunday closest to December 31. The fiscal years ended January 1, 2017, December 31, 2017, December 30,2018 and December 29, 2019 each contained 52 weeks. The fiscal year ended January 3, 2021 contained 53 weeks. The next fiscal year to contain 53 weeks will bethe fiscal year ending January 3, 2027.
Use of Non-GAAP Financial MeasuresConsolidated Adjusted EBITDA and margin and Restaurant-level Adjusted EBITDA and margin are non-GAAP financial measures. We use these non-GAAP
financial measures in addition to net income and income from operations to assess our performance, and we believe it is important for investors to be able toevaluate us using the same measures used by management. We believe these measures are important indicators of our operational strength and the performance ofour business and they provide a view of operations absent non-cash activity and items that are not related to the ongoing operation of our restaurants or affectcomparability period over period.
These non-GAAP financial measures as calculated by us are not necessarily comparable to similarly titled measures reported by other companies and shouldnot be considered as an alternative to net income (loss), earnings (loss) per share, cash flows from operating activities or other financial information determinedunder GAAP.
The primary measure of segment profit or loss used by the chief operating decision maker to assess performance and allocate resources is Adjusted EBITDA,which is defined as earnings attributable to the applicable operating segments before interest expense, income taxes, depreciation and amortization, impairment andother lease charges, goodwill impairment, closed restaurant rent expense, net of sublease income, stock-based compensation expense, other expense (income), net,and certain significant items for each segment that management believes are related to strategic changes and/or are not related to the ongoing operation of ourrestaurants as set forth in the reconciliation table in Item 6, "Selected Financial Data." Adjusted EBITDA for each of our segments includes an allocation of generaland administrative expenses associated with administrative support for executive management, information systems and certain finance, legal, supply chain, humanresources, construction and other administrative functions. See Note 11 to the Consolidated Financial Statements included in this Annual Report on Form 10-K.Consolidated Adjusted EBITDA margin and Adjusted EBITDA margin are derived by dividing Consolidated Adjusted EBITDA and Adjusted EBITDA by totalrevenues and segment revenues, respectively.
Restaurant-level Adjusted EBITDA is defined as Adjusted EBITDA excluding franchise royalty revenues and fees, pre-opening costs and general andadministrative expenses (including corporate-level general and administrative expenses). Restaurant-level Adjusted EBITDA margin is derived by dividingRestaurant-level Adjusted EBITDA by restaurant sales.
Management believes that such financial measures, when viewed with our results of operations calculated in accordance with GAAP and our reconciliation ofnet income (loss) to Consolidated Adjusted EBITDA and Restaurant-level Adjusted EBITDA (i) provide useful information about our operating performance andperiod-over-period changes, (ii) provide additional information that is useful for evaluating the operating performance of our business and (iii) permit investors togain an understanding of the factors and trends affecting our ongoing earnings, from which capital investments are made and debt is serviced. However, suchmeasures are not measures of financial performance or liquidity under GAAP and, accordingly, should not be considered as alternatives to net income or cash flowfrom operating activities as indicators of operating performance or liquidity. Also, these measures may not be comparable to similarly titled captions of othercompanies.
2
Table of Contents
All such financial measures have important limitations as analytical tools. These limitations include the following:
• such financial information does not reflect our capital expenditures, future requirements for capital expenditures or contractual commitments to purchasecapital equipment;
• such financial information does not reflect interest expense or the cash requirements necessary to service payments on our debt;• although depreciation and amortization are non-cash charges, the assets that we currently depreciate and amortize will likely have to be replaced in the
future, and such financial information does not reflect the cash required to fund such replacements; and• such financial information does not reflect the effect of earnings or charges resulting from matters that our management does not consider to be indicative
of our ongoing operations. However, some of these charges and gains (such as impairment and other lease charges, closed restaurant rent expense, net ofsublease income, other income and expense and stock-based compensation expense) have recurred and may recur.
See Item 6, "Selected Financial Data" for a quantitative reconciliation from net income (loss), which we believe is the most directly comparable GAAP financialperformance measure to Consolidated Adjusted EBITDA and Restaurant-level Adjusted EBITDA.
Forward-Looking StatementsMatters discussed in this report and in our public disclosures, whether written or oral, relating to future events or our future performance, including any
discussion, expressed or implied, regarding our anticipated growth, operating results, future earnings per share, plans, objectives, the impact of our other businessinitiatives, the impact of our initiatives designed to strengthen our liquidity and cash position, including those related to working capital efficiency initiatives andsales of real property and the impact of the COVID-19 pandemic and our initiatives designed to respond to the COVID-19 pandemic on future sales, margins,earnings and liquidity, contain forward-looking statements within the meaning of Section 27A of the Securities Act of 1933, as amended, and Section 21E of theSecurities Exchange Act of 1934, as amended, (the "Exchange Act"). These statements are often identified by the words "believe," "positioned," "estimate,""project," "plan," "goal," "target," "assumption," "continue," "intend," "expect," "future," "anticipate," and other similar expressions, whether in the negative or theaffirmative, that are not statements of historical fact. These forward-looking statements are not guarantees of future performance and involve certain risks,uncertainties, and assumptions that are difficult to predict, and you should not place undue reliance on our forward-looking statements. Our actual results and thetiming of certain events could differ materially from those anticipated in these forward-looking statements as a result of certain factors, including, but not limitedto, those set forth under "Risk Factors" and elsewhere in this report and in our other public filings with the United States Securities and Exchange Commission("SEC"). All forward-looking statements and the internal projections and beliefs upon which we base our expectations included in this report or other periodicreports represent our estimates as of the date made and should not be relied upon as representing our estimates as of any subsequent date. While we may elect toupdate forward-looking statements at some point in the future, we expressly disclaim any obligation to update any forward-looking statements, whether as a resultof new information, future events, or otherwise.
3

Table of Contents
ITEM 1. BUSINESS
Overview
Our Company
We own, operate and franchise two restaurant brands, Pollo Tropical and Taco Cabana , which have over 30 and 40 years, respectively, of operating historyand loyal customer bases. Our Pollo Tropical restaurants feature fire-grilled and crispy citrus marinated chicken and other freshly prepared menu items, while ourTaco Cabana restaurants specialize in Mexican-inspired food with most items made fresh. We believe that both brands offer distinct and unique flavors with broadappeal at a compelling value, which differentiates them in the competitive fast-casual and quick-service restaurant segments. Nearly all of our restaurants offer theconvenience of drive-thru windows.
For the fiscal year ended January 3, 2021, average annual sales per restaurant was approximately $2.2 million for our Pollo Tropical restaurants andapproximately $1.6 million for our Taco Cabana restaurants. As of January 3, 2021, we owned and operated 138 Pollo Tropical restaurants in Florida and 143 TacoCabana restaurants in Texas for a total of 281 restaurants. We franchise our Pollo Tropical restaurants primarily in international markets, and as of January 3, 2021,had 23 franchised Pollo Tropical restaurants outside the United States. In addition, as of January 3, 2021, we had five domestic non-traditional Pollo Tropicallicensed locations on college campuses and one location in a hospital in Florida. As of January 3, 2021, we had six Taco Cabana franchised restaurants in NewMexico. For the fiscal year ended January 3, 2021, we generated consolidated revenues of $554.8 million, and comparable restaurant sales decreased 14.7% and14.4% for Pollo Tropical and Taco Cabana, respectively. Comparable restaurant sales for the fiscal year ended January 3, 2021, exclude the 53 week and arereported on a 52-week basis.
COVID-19
The novel coronavirus (COVID-19) pandemic affected and is continuing to affect the restaurant industry and the economy. In response to COVID-19 and incompliance with governmental restrictions, we closed the dining room seating areas in all Pollo Tropical and Taco Cabana restaurants, limiting service to take-out,drive-thru, and delivery operations beginning in mid-March 2020. We also temporarily closed three Pollo Tropical locations due to the impact of the restrictions onsales, one of which was reopened during the second quarter of 2020 and two of which were subsequently permanently closed in August 2020. We began openingcertain dining rooms at 50% capacity with the easing of municipality restrictions during the second quarter of 2020; however, we temporarily closed all diningrooms on July 12, 2020, in response to increased COVID-19 infection rates in both Texas and Florida. We began re-opening certain dining rooms and patios withlimited capacity and hours at both brands and the state of Florida removed restaurant capacity restrictions at the end of September 2020. We opened approximately25 dining rooms with limited hours and capacity at both brands and opened approximately 75 patios at Taco Cabana in the fourth quarter of 2020. We areevaluating opening additional dining rooms with limited hours at Pollo Tropical and Taco Cabana.
Comparable restaurant sales at both Pollo Tropical and Taco Cabana restaurants declined in 2020 compared to the prior year as a result of the pandemic.However, both brands experienced sequential comparable restaurant sales improvement in the third and fourth quarters of 2020 compared to comparable restaurantsales in the second quarter of 2020. We believe our significant mix of dine-in sales prior to the pandemic had a negative impact on comparable restaurant sales.Our dine-in and take-out sales from orders placed at the counter as a percentage of total sales for Pollo Tropical decreased to 28.0% of total sales in 2020 comparedto 49.0% of total sales in 2019 and for Taco Cabana decreased to 17.0% of total sales in 2020 compared to 41.4% of total sales in 2019. Our sales shifted to ahigher percentage of drive-thru and delivery sales in 2020. Our drive-thru and delivery sales as a percentage of total sales for Pollo Tropical increased to 61.1% and7.3% of total sales, respectively, in 2020 compared to 46.8% and 1.8% of total sales, respectively, in 2019 and for Taco Cabana increased to 75.2% and 4.6% oftotal sales, respectively, in 2020 compared to 55.1% and 1.2% of total sales, respectively, in 2019. Through our investments in online and mobile ordering, andpartnerships with multiple delivery service providers, we were well positioned for the shift in sales channels.
The COVID-19 pandemic has not had a significant negative disruptive impact on our supply chain or access to labor, although there can be no assurance thatthere will not be a significant impact on our supply chain or access to labor in the future. We continue to actively monitor our food suppliers to determine how theyare managing their operations to mitigate supply flow and food safety risks. To ensure we mitigate potential supply availability risk, we have built additionalinventory backstock levels when appropriate and we have also identified alternative supply sources in key product categories including but not limited to proteinsand sanitation and safety supplies.
We incurred additional costs related to the COVID-19 pandemic totaling an estimated $4.3 million during the year ended January 3, 2021 including additionallabor costs such as COVID-19 special incentive pay, quarantine pay and overtime to cover
® ®
rd
4

Table of Contents
for employees in quarantine, as well as COVID-19 testing costs and additional operating expenses for safety related supplies including masks, cleaning suppliesand sanitizer. Although we discontinued COVID-19 special incentive pay after the second quarter of 2020, we expect many of the other COVID-19 related costs tocontinue during the pandemic.
Our Brands
Our restaurants operate in the fast-casual and quick-service restaurant segments and feature fresh-made cooking, drive-thru service and catering.
Pollo Tropical. Our Pollo Tropical restaurants feature fresh chicken marinated in a proprietary blend of tropical fruit juices and spices, crispy or fire-grilled, boneless and bone-in. Other favorite menu items include Mojo Roast Pork and TropiChops (a create your own bowl of fire-grilled or crispy chickenbreast, roast pork or grilled vegetables served over white, brown or yellow rice, red or black beans, or mac and cheese, and topped with vegetables includingtomatoes, kernel corn, peppers and sautéed onions), sandwiches, wraps and salads. Side dishes include rice, beans, french fries, and balsamic tomatoes. Themenu's emphasis is on freshness and quality. We also offer a wide selection of sauces, cilantro, onions and other items which allow our guests to furthercustomize their orders. Dessert offerings include key lime pie, cuatro leches cake, flan, cheesecake, as well as limited-time seasonal items, and beveragesinclude fountain soft drinks, flavored brewed teas, and other bottled drinks. Most menu items are prepared daily in each of our restaurants, which feature opendisplay cooking on large, open-flame grills. We offer both individual and family meal-sized portions which enable us to provide a home meal replacement forour guests and catering for parties and corporate events. We began selling alcoholic beverages including wine and beer at most Pollo Tropical locations in2020 to increase off-premise sales.
Our Pollo Tropical restaurant dining areas are designed to create an inviting, festive and tropical atmosphere. We also provide our guests the option oftake-out, including the ability to order online in advance, and nearly all of our restaurants provide the convenience of drive-thru windows. Delivery isavailable through third-party partnerships at all Pollo Tropical locations. Our Pollo Tropical restaurants are generally open for lunch, dinner, and late nightseven days a week. As of January 3, 2021, substantially all of our Pollo Tropical restaurants were freestanding buildings. Our typical freestanding PolloTropical restaurant ranges from 2,800 to 3,700 square feet and provides interior seating for approximately 70 to 90 guests. During the year ended January 3,2021, the majority of our sales were through drive-thru windows, take-out, or delivery. For the year ended January 3, 2021, the average sales transaction at ourPollo Tropical restaurants was $12.83, with sales at dinner and lunch representing 50.3% and 49.7%, respectively. For the year ended January 3, 2021, ourPollo Tropical brand generated total revenues of $315.4 million and Adjusted EBITDA of $36.5 million.
Pollo Tropical opened its first restaurant in 1988 in Miami, Florida. As of January 3, 2021, we owned and operated a total of 138 Pollo Tropicalrestaurants, all located in Florida.
We are franchising and licensing our Pollo Tropical restaurants internationally and in non-traditional domestic locations. As of January 3, 2021, we had23 franchised Pollo Tropical restaurants located in Puerto Rico, Panama, Guyana, Ecuador, and the Bahamas, and five non-traditional licensed locations oncollege campuses and one located in a hospital in Florida. We have agreements for the continued development of franchised Pollo Tropical restaurants incertain of our existing franchised markets.
Taco Cabana. Our Taco Cabana restaurants serve fresh, Mexican-inspired food that feature loaded tacos, steak and chicken fajitas, quesadillas, flautas,enchiladas, burritos, and customizable Cabana Bowls . We also offer freshly made flour tortillas, shareable appetizers and our popular breakfast tacos anddozen taco boxes. Our self-service salsa bar includes a wide selection of freshly made salsas, sauces, sliced jalapeños, chopped cilantro, chopped onions andother items which allow our guests to further customize their orders. We temporarily closed our salsa bars during the COVID-19 pandemic. We also offerdesserts such as sopapillas and New Churros, as well as beverages including fountain soft drinks, our signature frozen margaritas, and bottled beer—allavailable to-go as well. Most menu items are freshly-prepared at each restaurant daily.
Taco Cabana restaurants feature open display cooking that enables guests to observe fajitas cooking on an open grill, a tortilla machine pressing andgrilling fresh flour tortillas and the fresh preparation of other menu items. Our Taco Cabana restaurants feature interior dining areas as well as semi-enclosedand outdoor patio areas, which provide a vibrant decor and relaxing atmosphere. Many locations also had live entertainment at select times prior to theCOVID-19 pandemic. We offer both individual and family meal-sized portions, which enable us to provide a home meal replacement for our guests andcatering for parties and corporate events. Additionally, we provide our guests the option to order online in advance, as well as the convenience of drive-thruwindows. Delivery is available through third-party partnerships at all locations. Our typical freestanding Taco Cabana restaurants average approximately 3,500square feet (exclusive of the exterior dining area) and provide seating for approximately 80 guests, with additional outside patio seating for approximately 50guests.
®
®
5
Table of Contents
As of January 3, 2021, substantially all of our Taco Cabana restaurants were freestanding buildings. During the year ended January 3, 2021, the majority ofour sales were through drive-thru windows, take-out, or delivery.
Taco Cabana pioneered the Mexican patio cafe concept with its first restaurant in San Antonio, Texas, in 1978. As of January 3, 2021, we owned andoperated 143 Taco Cabana restaurants, all located in Texas. As of January 3, 2021, we also had six Taco Cabana franchised restaurants located in NewMexico. Hours of operation vary by location, and some restaurants operated 24 hours a day prior to the COVID-19 pandemic. For the year ended January 3,2021, sales at dinner, lunch and breakfast represented 28.7%, 23.2% and 23.3%, respectively, and the average sales transaction at our Taco Cabana restaurantswas $11.74. For the year ended January 3, 2021, our Taco Cabana brand generated total revenues of $239.4 million and Adjusted EBITDA of $8.5 million.
Our Competitive Strengths
We believe our competitive strengths include the following key attributes:
Well Positioned and Differentiated in the Fast-Casual and Quick-Service Segments. As of January 3, 2021, we owned, operated and franchised 316 fast-casual restaurants under our Pollo Tropical and Taco Cabana brands which have over 30 and 40 years, respectively, of operating history. Although the COVID-19pandemic had a negative impact on our average unit sales per restaurant, at $2.2 million and $1.6 million, respectively, for 2020, we believe Pollo Tropical andTaco Cabana have compelling average annual sales per restaurant within the fast-casual and quick-service segments, and we experienced sequential improvementin average unit sales in the third and fourth quarters of 2020 compared to the second quarter of 2020. We believe our brands are well positioned in the industry dueto our high quality, freshly-prepared food, value and differentiation of flavor profiles.
Two Leading, Differentiated Brands Serving Freshly Prepared, High Quality Foods with Broad Appeal and a Compelling Value Proposition. Our PolloTropical and Taco Cabana brands are differentiated from other dining options and offer distinct flavor profiles and healthy menu choices at affordable prices thatwe believe have broad consumer appeal, provide guests with a compelling value proposition, attract a diverse customer base and drive guest frequency and loyalty.Pollo Tropical and Taco Cabana are committed to serving freshly-prepared food using quality ingredients that are made-to-order and customized for each guest.Both of our brands offer a wide range of menu offerings and home meal replacement options in generous portion sizes and at affordable price points which appealto a broad customer base. Our open display kitchen format allows guests to view and experience our food being freshly-prepared and cooked to order. We continueto refine our menus, including some seasonal offerings at our Pollo Tropical and Taco Cabana restaurants, in order to provide variety to our guests, addresschanges in consumer preferences, and maintain a speed of service that appeals to our customers. We also selectively use promotions and limited time offers whichare intended to reinforce our value proposition and to introduce new products. Additionally, we offer our guests the convenience of drive-thru service, onlineordering, curbside pickup, and delivery through third-party delivery services in order to provide a viable option for home meal replacement and family meals. In2020, Taco Cabana and Pollo Tropical began selling alcohol through the drive-thru and to-go.
Compelling Business Model. We enjoy significant brand recognition due to high market penetration of our restaurants in our core markets which providesoperating, marketing and distribution efficiencies and convenience for our guests. Both of our brands have strong brand affinity in our core markets as evidencedby fast-casual and quick-service segment-leading average annual sales volumes, as noted above. Pollo Tropical produces above average restaurant-level operatingmargins. Taco Cabana restaurant-level operating margins improved in 2020 and, with sales stabilization and growth and effective cost management, we anticipateTaco Cabana will produce higher restaurant-level operating margins in the future.
Growth Strategies
Our long-term strategy is focused on profitably building our base business, growing new distribution channels, including catering, delivery, licensed andfranchised locations, and development of new restaurants.
Our strategies for growth primarily include:
Increase Comparable Restaurant Sales. We experienced a decrease in comparable restaurant sales in 2020, which we believe was attributable to the impactof the COVID-19 pandemic. We believe our significant mix of dine-in sales prior to the pandemic had a negative impact on comparable restaurant sales. We alsoexperienced a decrease in comparable restaurant sales in 2019 which we believe was attributable to a decline in comparable restaurant transactions due in part tochallenging market and industry conditions, discounted pricing and, for Pollo Tropical, the negative impact of Hurricane Dorian, partially offset by menu priceincreases and the introduction of higher priced shareables in 2019. We simplified the Taco Cabana menu in the fourth quarter of 2019 to improve execution. Themenu simplification efforts included removal of certain menu items and limited other items to certain dayparts. While the menu simplification improved guestsatisfaction and reduced order cycle
6
Table of Contents
times, the reduced menu resulted in a greater than anticipated transaction decline. We selectively re-introduced select items to the menu in 2020 to increase saleswhile maintaining the operational improvements provided by the menu simplification. We are focused on increasing comparable restaurant sales in the future byattracting new customers and increasing guest frequency through the following strategies:
• Focus on consistency of operations and food quality: We believe high quality food and hospitality, a comfortable ambience, and reasonable prices resultin an enjoyable guest experience, which drives loyalty and guest frequency. We have improved systems, processes and equipment, implemented tightermanagement spans of control and enhanced our field leadership teams, and we continue to focus on improving systems and processes to ensureconsistency of operations at both brands. In addition, supply chain and food preparation processes have been implemented at both brands to ensure highquality, freshness and consistency of our food, which we believe are critical components to the continued success of our brands.
• New product innovation: Across both brands, our menus are centered on freshly prepared, quality food offerings that we believe have both broad appealand provide everyday value. Pollo Tropical and Taco Cabana each have separate teams of product research and development professionals that enables usto continually refine our menu offerings and develop new products, several of which are validated by consumer research. Maintaining a strong productpipeline is critical to keeping our offerings compelling, and we intend to introduce innovative new menu items and enhancements to existing menufavorites throughout the year to drive further guest traffic, maximize guest frequency, and increase average check.
• Focus on effective advertising to highlight our everyday value proposition: Pollo Tropical and Taco Cabana utilize an integrated, multi-level marketingapproach that includes periodic system-wide promotions, outdoor marketing including billboards, in-restaurant promotions, local trade area marketing,social media, digital and web-based marketing and other strategies, including the use of radio and television advertising and limited-time offer menu itemand value promotions. In addition, we introduced new email and app-based loyalty programs at Pollo Tropical (My Pollo™) and Taco Cabana (My TC™)in 2018 to further connect with our guests to build affinity and frequency. In 2020, we introduced new state-of-the-art mobile apps for both Pollo Tropicaland Taco Cabana. As a percentage of Pollo Tropical restaurant sales, Pollo Tropical's advertising expenditures were 2.7% in 2020, 3.4% in 2019 and 3.5%in 2018. As a percentage of Taco Cabana restaurant sales, Taco Cabana's advertising expenditures were 2.7% in 2020, 3.6% in 2019 and 3.4% in 2018.
• Grow our off-premise sales with focus on digital platform: The inclusion of portable menu items, such as wraps, sandwiches, bowls and salads, as well asfamily meals, and an increased focus on catering and delivery will continue to be a key focus for both brands as we look to capture more off-premise mealoccasions which we believe may be significant. Off-premise meal consumption increased significantly during the COVID-19 pandemic and we believethat off-premise sales may continue to be significant following the pandemic. In 2018, we invested in catering resources utilizing dedicated leadership andenhanced digital capabilities, enhanced online ordering, and smart phone apps. In late 2018, we began deploying our portable point-of-sale tablets whichaccept payment to improve speed of service and throughput in our drive-thru lanes. In 2019, we invested in our catering business by adding dedicatedcatering sales managers and catering online ordering capabilities, we partnered with a third-party delivery partner to provide delivery services, and wecreated Rapid Pickup for online orders at Pollo Tropical. In 2020, we created Rapid Pickup for online orders at Taco Cabana and expanded our third-partydelivery partnerships to include delivery through multiple delivery service providers for both brands. We engaged a third party to improve our mobileapps and enhance our digital connections and interactions to grow our digital business and create experiences that minimize friction within our digitalplatforms including creating state-of-the-art mobile apps. We also implemented curbside pickup functionality as an option with online ordering and beganimproving connectivity at our restaurants, upgrading portable tablets and enabling touchless payments. We plan to continue to invest to improve ourdigital platform and to improve the speed and ease of use for off-premise sales channels including an enhanced drive-thru experience, geofencingtechnology for curbside orders and infrastructure changes to improve the speed of order cycle time for drive-thru and delivery orders.
• Continue our reimage program: We believe ensuring a high-quality restaurant environment that complements our quality focus on food and hospitalitywill further drive incremental sales and profitability. We continue to implement restaurant enhancement initiatives to ensure safe, consistent andappealing experiences at our Pollo Tropical and Taco Cabana restaurants. We are continuing the process of redefining the Pollo Topical brand essence.We have completed the qualitative research and are in the process of completing the quantitative phase of our research. The results of this research willallow us to develop a brand positioning and will provide a clear brand strategy for both existing and new markets.
7

Table of Contents
Non-Traditional License and International Franchise Development. We are updating our Pollo Tropical franchise disclosure documents each year to supportpotential franchise growth in the future. We are currently primarily focused on growing non-traditional domestic licensed locations on university campuses andnon-traditional licensed locations in airports and highway rest stops, while modestly growing international locations with quality operators.
Improve Profitability and Optimize Our Infrastructure. We believe that our large restaurant base, skilled management team, operating systems, technologyinitiatives and training and development programs support our strategy of enhancing operating efficiencies while prudently growing our restaurant base. Wecontinue to focus on maximizing cost efficiencies, including, among other things, implementing profit enhancement initiatives focused on food and labor costs,leveraging our purchasing power and enhancing our supply chain to optimize costs while delivering a high-quality guest experience with consistency. Ourrestaurant-level profitability at Pollo Tropical is very competitive within the restaurant industry segments in which we compete. Taco Cabana's restaurant-levelmargins improved in 2020. We believe Taco Cabana will become more competitive within the restaurant industry segments in which we compete over timethrough growing comparable restaurant sales and traffic, other margin improvement initiatives, simplifying our operating platform and improved execution.
Develop New Restaurants. We believe that we have opportunities to develop additional Pollo Tropical and Taco Cabana restaurants in Florida and Texas,respectively, as well as potential future expansion opportunities in other regions of the United States that match our site selection criteria. We paused our newrestaurant development plans in 2020 as a result of the COVID-19 pandemic. However, we intend to resume new restaurant development in the future. Thedevelopment of new restaurants will incorporate what we have learned during the COVID-19 pandemic and our reimaging market research, both qualitative andquantitative. During 2021, we plan to continue the process of brand positioning and operating model refinements for Pollo Tropical that we believe will enablefuture geographic expansion through both company-owned and franchised locations. Our primary focus for Taco Cabana in 2021 will be on improving existingunit average unit sales and continuing to improve margins.
We target opening freestanding restaurants in order to provide drive-thru service which is an important convenience and sales component for our brands. Thelocation of our restaurants is a critical component of each restaurant's success. We evaluate potential new sites on many criteria including accessibility, visibility,costs, surrounding traffic patterns, competition and demographic characteristics. Our senior management team determines the acceptability of all new sites basedupon site visits, analyses prepared by our real estate, financial and operations professionals, and third-party proprietary location research and analysis. Historically,this process has typically resulted in entering into a long-term lease for the land followed by construction of the building or the conversion of an existing buildingusing cash generated from our operations or with borrowings under our senior credit facility.
The following table includes the historical initial interior cost (including equipment, seating, signage and other interior costs) of a typical new or convertedfreestanding restaurant, as well as the historical exterior cost (including building and site improvements).
Pollo Tropical Taco CabanaInterior costs and signage $0.6 million to $0.9 million $0.4 million to $0.6 millionExterior costs $1.2 million to $1.6 million $0.5 million to $1.4 million
The cost of building and equipping new restaurants can vary significantly and depends on a number of factors, including the local economic conditions,geographic considerations, the size of the restaurant, the characteristics of a particular site, and whether we are constructing a new building or converting anexisting building. Accordingly, the cost of opening new restaurants in the future may differ substantially from the historical cost of restaurants previously opened.
Competition
The restaurant industry is highly competitive with respect to price, service, location and food quality. In each of our markets, our restaurants compete withmany national and regional quick service, fast casual, and in some cases casual dining restaurant chains, as well as locally owned restaurants. We also competewith delivered meal solutions, convenience stores, grocery stores and other restaurant retailers.
We believe that:
• product quality and taste;• brand differentiation and recognition;• convenience of location;
8

Table of Contents
• speed of service;• menu variety;• value perception;• ambience;• cleanliness; and• hospitality
are among the important competitive factors in the fast-casual and quick-service restaurant segments and that our two concepts effectively compete against thosecategories. Pollo Tropical's competitors include national and regional chicken-based concepts, as well as other concepts. Taco Cabana's competitors include otherMexican-inspired concepts as well as other concepts.
Restaurant Operating Data
Selected restaurant operating data for our two restaurant concepts is as follows:
Year Ended January 3, 2021 December 29, 2019 December 30, 2018Pollo Tropical:Average annual sales per company-owned restaurant (in thousands) $ 2,220 $ 2,576 $ 2,521 Average sales transaction $ 12.83 $ 11.71 $ 11.63 Sales channel sales percentages:Drive-thru sales as a percentage of total sales 61.1 % 46.8 % 47.6 %Dine-in & counter take-out sales as a percentage of total sales 28.0 % 49.0 % 50.7 %Delivery sales as a percentage of total sales 7.3 % 1.8 % 0.1 %Online sales as a percentage of total sales 2.7 % 1.5 % 0.9 %Catering sales as a percentage of total sales 0.9 % 0.9 % 0.7 %Day-part sales percentages:
Lunch 49.7 % 47.4 % 47.1 %Dinner and late night 50.3 % 52.6 % 52.9 %
Taco Cabana:Average annual sales per company-owned restaurant (in thousands) $ 1,605 $ 1,812 $ 1,846 Average sales transaction $ 11.74 $ 10.70 $ 10.47 Sales channel sales percentages:Drive-thru sales as a percentage of total sales 75.2 % 55.1 % 55.7 %Dine-in & counter take-out sales as a percentage of total sales 17.0 % 41.4 % 42.8 %Delivery sales as a percentage of total sales 4.6 % 1.2 % — %Online sales as a percentage of total sales 2.5 % 1.8 % 1.2 %Catering sales as a percentage of total sales 0.7 % 0.5 % 0.3 %Day-part sales percentages:
Breakfast 23.3 % 23.6 % 23.4 %Lunch 23.2 % 22.3 % 22.3 %Dinner 28.7 % 24.9 % 24.9 %Late night (9pm to midnight) 7.7 % 11.6 % 11.8 %Afternoon (2pm to 5pm) 16.2 % 13.4 % 13.1 %Overnight (midnight to 6am) 0.9 % 4.2 % 4.5 %
(1) Average annual sales for company-owned restaurants are derived by dividing restaurant sales for such year for the applicable segment by the average numberof company-owned restaurants for the applicable segment for such year. For comparative purposes, the calculation of average annual sales per company-owned restaurant is based on a 52-week fiscal year. Restaurant sales data for the extra week in the fiscal year ended January 3, 2021 have been excluded forpurposes of calculating average annual sales per company-owned restaurant.
(1)
(1)
9
Table of Contents
Seasonality
Our business is marginally seasonal due to regional weather conditions. Sales from our restaurants located in South Florida are generally higher during thewinter months than during the summer months, while sales from our restaurants located in Texas, Central Florida, and North Florida are generally higher duringthe summer months than the winter months. In addition, we have outdoor seating at many of our restaurants and the effects of adverse weather may impact the useof these areas and may negatively impact our restaurant sales.
Operations
Management Information Systems
Our management information systems provide us the ability to efficiently and effectively manage our restaurants and to ensure consistent application ofoperating controls at our restaurants.
In all corporate-owned restaurants, we use computerized management information systems, which we believe are scalable to support potential future growthplans. We use touch-screen point-of-sale (POS) systems, both fixed and mobile, designed specifically for the restaurant industry that facilitate accuracy and speedof order taking, are user-friendly, require limited cashier training, improve speed-of-service through the use of conversational order-taking techniques, and provideappropriate audit trails. We use credit card processing devices which utilize industry-leading Point to Point Encryption that protect our customer's credit card data.The POS systems are integrated with above-store enterprise applications that are designed to facilitate financial and management control of our restaurantoperations. All products sold and related prices at our restaurants are programmed into the system from our central support office.
We provide in-store access to enterprise systems that assist in labor scheduling and food cost management, allow online ordering from distributors, and reducemanagers' administrative time. Critical information from such systems is available in near real-time to our restaurant managers, who are expected to react quicklyto trends or situations in their restaurant. Our district managers also receive near real-time information from all restaurants under their control and have access tokey operating data on a remote basis. Management personnel at all levels, from the restaurant manager through senior management, utilize key restaurantperformance indicators to manage our business.
These enterprise systems provide daily tracking and reporting of traffic counts, menu item sales, labor and food data including costs, and other key operatinginformation for each restaurant. These systems also provide the ability to monitor labor utilization and sales trends on a real-time basis at each restaurant andprovide analyses, reporting and tools to enable all levels of management to review a wide-range of financial, product mix and operational data.
We use an integrated digital ordering system that is integrated with our POS system at each restaurant. Individual, group or catering orders placed on ourwebsite or that of our third-party delivery partners, mobile app or through our call center are transmitted electronically to the restaurants to provide a seamlessordering, payment and pickup or delivery experience for our guests.
In 2020, we moved from legacy white-label smartphone apps for each brand to customized, proprietary apps developed in partnership with a leading third-party app developer. We also developed and deployed a curbside delivery program in order to help alleviate congestion at the drive-thru with dining rooms largelyclosed. In order to maintain security, compliance, and maximum performance, we rolled out new Point of Sale servers and introduced a Chromebook for managersto perform office productivity functions. We enhanced our Business Intelligence platform to create significantly more sophisticated market basket affinity analysis.
We expect to continue making substantial investments in technology that we believe will drive sales and traffic, as well as improve margins. In 2021, weintend to focus technology investments on consumer digital interactions and loyalty, best-in-class mobile POS and digital menu boards in the drive-thru channel,and maximizing performance and range of our in-store technologies dedicated to off-premise sales.
10

Table of Contents
Community Social Impact
We are committed to being a deeply responsible company in the communities where we do business. Our focus is on serving high quality food to our guestsand contributing positively to the communities where our restaurants are located. This is integral to our business strategy. Our initiatives include:
• Our chicken is free of hormones and trans-fats and our shrimp is Best Aquaculture certified;• Our chicken is sourced from suppliers dedicated to uphold responsible animal welfare practices;• We continue to pursue finding more earth-friendly serving and packaging materials for our products including bags that are made from recycled material,
are 100% recyclable and reusable and are Rainforest Alliance certified, paper drink cups that are Sustainable Forest Initiative certified and aluminum thatcontains postindustrial re-processed and post-consumer material;
• Military veterans are actively recruited to work at our restaurants;• We have military appreciation days and we provide discounts to military and first responders;• We assist, through our non-profit Fiesta Family Foundation, many of our employees who have personally suffered losses or other hardships; and• During the COVID pandemic in 2020, Pollo Tropical and Taco Cabana provided approximately 113,000 and 58,000 free meals to school-aged children,
respectively, and approximately 22,000 and 13,000 free meals to first responders and healthcare professionals, respectively. Pollo Tropical also donatedapproximately $60 thousand in food donations to Miami Rescue Mission. Additionally, Taco Cabana provided approximately 6,000 meals to hospitals,non-profit organizations and homeless shelters and provided a $6 thousand turkey donation to the San Antonio Food Bank.
• In 2020, we provided monetary and food donations or volunteered to the following organizations: Fire and Police departments, hospitals and COVIDtesting and vaccination sites throughout Florida and Texas, Big Brother Helping Hand, Boys and Girls Clubs of Austin and San Antonio, Boysville, ChildCrisis Center of El Paso, Children's Shelter of San Antonio, Farm Workers Association, Kidz Nation, La Posada Shelter, Love our Youth Orlando, MiamiRescue Mission, Our Calling, Ronald McDonald House, Salvation Army, SOS Kids - Coconut Creek, St. Jude's Shelter, Star of Hope, United Way,YMCA, and Zebra Coalition.
• In 2019, we provided monetary and food donations or volunteered to the following organizations: 88 Blessings, American Red Cross, Baytown YouthFair and Livestock Association, Boys and Girls Club of America, The Children's Hospital of San Antonio, Dallas Fire and Police Departments, FundaciónAmigos Carlos Jimenez, Holocaust Museum Houston, Houston Children's Charity, Houston Fire and Police Departments, Houston SAAFE House, JuniorLeague of Miami, Meals on Wheels, Methodist Hospital and Healthcare San Antonio, Miami Lighthouse for the Blind, Miami Rescue Mission, NationalKidney Foundation, Operation Stocking Stuffer, Parkland Buddy Sport, SAMMinistries, San Antonio Food Bank, Susan G. Komen, Voices for Children,and World Central Kitchen.
• In 2018, we provided monetary and food donations or volunteered to the following organizations: Susan G. Komen, Boys and Girls Club of America,Salvation Army, Sandra DeLucca Development Center, Juvenile Diabetes Research Foundation, Children's Hospitals of Texas, Houston Food Bank,Austin Central Texas Food Bank, El Pasoans Fighting for Hunger Food Bank, San Antonio Food Bank, San Antonio Haven for Hope and Madison onMarsh Nursing Home; we provided hundreds of hot meals to local police, FBI, first responders and local residents in need after the Parkland, Floridashooting tragedy; hundreds of hot meals were provided to first responders, victims, elderly residents and others in Texas and in Florida in the aftermath ofthe Hurricanes.
As a result of these initiatives, we believe we deliver benefits to our stakeholders, including employees, business partners, customers, suppliers, stockholders,community members, and others.
Suppliers and Distributors
For our Pollo Tropical and Taco Cabana restaurants, we have negotiated directly with local and national suppliers for the purchase of food and beverageproducts and supplies to ensure consistent quality and freshness and to obtain competitive prices. Supply contracts are negotiated on an annual basis in some casesto obtain favorable pricing and ensure consistent supply flow. Food and supplies for both brands are ordered from approved suppliers and are shipped to therestaurants via distributors. Both brands are responsible for monitoring quality control, for the supervision of these suppliers and for conducting inspections toobserve preparations and ensure the quality of products purchased.
For both our Pollo Tropical and Taco Cabana restaurants, we have service agreements with our primary distributors of food and paper products. PerformanceFood Group, Inc., is our primary distributor of food and beverage products and supplies for both our Pollo Tropical and Taco Cabana restaurants under adistribution services agreement that expires on July 27, 2024. We
11

Table of Contents
also currently rely on five suppliers for chicken for our Pollo Tropical and Taco Cabana restaurants under agreements that expire on December 31, 2021.
Quality Assurance
Pollo Tropical and Taco Cabana are committed to obtaining quality ingredients and creating freshly-prepared food in a safe manner. In addition to operating inaccordance with quality assurance and health standards mandated by federal, state and local governmental laws and regulations regarding minimum cooking timesand temperatures, maximum time standards for holding prepared food, food handling guidelines and cleanliness, among other things, we have also developed ourown internal quality control standards. We require our suppliers to adhere to our high quality control standards, and we regularly inspect their products andproduction and distribution facilities to ensure that they conform to those standards. In addition, we have implemented certain procedures to ensure that we servesafe, quality meals to our guests. As an example, we utilize the nationally-recognized ServSafe program to train our kitchen staff and managers on proper foodhandling and preparation techniques. In addition, we have hired a third party that conducts unscheduled food safety inspections of our restaurants, and restaurantmanagers conduct internal inspections for taste, quality, cleanliness and food safety on a regular basis. These third-party inspections are one of the metrics used inour restaurant-level incentive bonus programs.
In addition to food safety, our operational focus at each of our two concepts is closely monitored to achieve a high level of guest satisfaction via speed ofservice, order accuracy and quality of service. Our senior management and restaurant management staffs are principally responsible for ensuring compliance withour operating policies. We have uniform operating standards and specifications relating to the quality, preparation and selection of menu items, maintenance andcleanliness of the restaurants and employee conduct. In order to maintain compliance with these operating standards and specifications, we distribute to ourrestaurant operations management team detailed reports measuring compliance with various guest service standards and objectives, including feedback obtaineddirectly from our guests. The guest feedback is monitored by an independent agency and by us and consists of evaluations of speed of service, quality of service,quality of our menu items and other operational objectives including the cleanliness of our restaurants. We also have in-house guest service representatives thatmanage guest feedback and inquiries.
Trademarks
We believe that our trademarks, service marks, trade dress, logos and other proprietary intellectual property are important to our success. We have registeredthe principal Pollo Tropical and Taco Cabana logos and designs with the U.S. Patent and Trademark Office on the Principal Register as a service mark for ourrestaurant services. We also have secured or have applied for state and federal registrations for several other advertising or promotional marks, including variationsof the Pollo Tropical and Taco Cabana principal marks as well as those related to our core menu offerings. In connection with our current and potentialinternational franchising activities, we have applied for or been granted registrations in foreign countries of the Pollo Tropical and Taco Cabana principal marksand several other marks.
Other than the Pollo Tropical and Taco Cabana trademarks and the logo and trademark of Fiesta Restaurant Group (including Internet domain names andaddresses) and proprietary rights relating to certain of our core menu offerings, we have no proprietary intellectual property.
Continued Commitment to Strong Governance
We declassified our board of directors so that beginning at our 2019 Annual Meeting of Stockholders, our entire board of directors stands for re-election for aone-year term. Additionally, in 2018, our board of directors adopted a mandatory maximum age of 75 for any director nominee.
Government Regulation
Various federal, state and local laws affect our business, including various health, sanitation, fire and safety standards. Restaurants to be constructed orreimaged are subject to state and local building code and zoning requirements. In connection with the development and reimaging of our restaurants, we may incurcosts to meet certain federal, state and local regulations, including regulations promulgated under the Americans with Disabilities Act.
We are subject to the federal Fair Labor Standards Act and various other federal and state laws governing employment matters. While we pay, on average,rates that are above the federal minimum wage, and where applicable, state minimum wage, increases in those minimum wages have in the past increased wagerates at our restaurants and in the future will affect our labor costs. We are also subject to provisions of the comprehensive federal health care reform law. Weanticipate that a combination of labor management, cost reduction initiatives, technology and menu price increases can materially offset the potential increasedcosts associated with future regulations.
12
Table of Contents
Taco Cabana and Pollo Tropical are subject to alcoholic beverage control regulations that require state, county or municipal licenses or permits to sellalcoholic beverages at each restaurant location that sells alcoholic beverages. Typically, licenses must be renewed every one to two years and may be revoked orsuspended for cause at any time. Licensing entities, authorized with law enforcement authority, may issue violations and conduct audits and investigations of therestaurant's records and procedures. Alcoholic beverage control regulations relate to numerous aspects of the daily operations of our restaurants includingminimum age for consumption, certification requirements for employees, hours of operation, advertising, wholesale purchasing, inventory control and handling,storage and dispensing of alcoholic beverages. These regulations also prescribe certain required banking and accounting practices related to alcohol sales andpurchasing. Our restaurants are subject to state "dram-shop" laws. Dram-shop laws provide a person injured by an intoxicated person the right to recover damagesfrom an establishment that wrongfully served alcoholic beverages to the intoxicated or minor patron. We have specific insurance that covers claims arising underdram-shop laws. However, we cannot ensure that this insurance will be adequate to cover any claims that may be instituted against us.
Human Capital Management
As of January 3, 2021, we employed approximately 8,020 persons, of which approximately 170 were corporate and administrative personnel andapproximately 7,850 were restaurant operations and other supervisory personnel. None of our employees are covered by collective bargaining agreements and weconsider that overall relations with our employees are favorable.
Culture, Values & Diversity, Equity & Inclusion
At Fiesta, we are in the business of inclusive hospitality. We strive to create diverse, respectful spaces where innovation can thrive, where being courageous isrewarded, and where treating each other like family is a core value.
These qualities have supported over 30 and 40 years of successful operations for our Pollo Tropical and Taco Cabana brands, respectively. We believe that theinvestments we are making in our employees, our restaurants, and our communities will contribute to our continued success in the restaurant business.
As of January 3, 2021, approximately 63% of our U.S.-based employee population identified as female and approximately 89% of our U.S based employeepopulation is comprised of racial and ethnic minorities. In addition, approximately 29% of our executive officers are female and approximately 57% are racial andethnic minorities. Furthermore, approximately 60% of the restaurant field management of our restaurant brands identified as female and more than approximately81% of this group is comprised of racial and ethnic minorities.
As a truly diverse organization, we foster a culture of inclusion that helps to remove some of the barriers to workplace entry and professional development thatdiverse groups might face. We provide opportunities for career progression through the training and development investments we make. Many of our fieldmanagers started as hourly team members and have had the opportunity to move up and become managers and supervisors at the corporate level. We believe indeveloping and promoting from within and in 2020 promoted over 400 employees to management or leadership roles.
We are committed to enhancing equality in ongoing career advancement for women and minorities through targeted education and development programs.Relevant initiatives include:
• Ongoing assessment and management of our talent pipeline to support the career progression of high-potential women and minorities;• Well defined Career Path Programs for hourly employees to advance to management;• Cultural and Compliance training for all our employees;• Creating a Women's Forum.
Total Rewards
We believe rewarding our employees for their hard work and commitment starts with pay. We pay, on average, rates that are above the federal minimumwage. In addition to their fixed salary, restaurant and district managers are compensated with an incentive bonus, based upon the performance of the restaurantsunder their supervision. We understand the importance of offering our employees benefits for all aspects of their lives. Through our benefits program we hope toprovide our employees with the stability they need to succeed not only in their careers, but in their personal lives as well. Benefits offered to all corporateemployees, who work more than 24 hours per week include paid time-off programs including holiday; personal; vacation; family leave; and volunteer time andretirement savings plan with company match. Additionally, all employees are
13
Table of Contents
eligible for assistance, through our non-profit Fiesta Family Foundation, which provides assistance to our employees who have personally suffered losses or otherhardships.
Training and Development
We maintain a comprehensive training and development program for all our restaurant employees and provide both classroom and in-restaurant training forour salaried and hourly team members. Technology enhancements, expansion of leadership development curriculum and newly designed e-learning coursescomplement the recent introduction of a new Learning Management System platform to focus our team members on system-wide operating procedures by position,food preparation methods and guest service standards.
We have developed a comprehensive management training program, complemented by active coaching and dedicated field training manager supervision forall new managers. During the new manager onboarding process, we customize an intensive, self-paced ongoing development program designed to prepare eachemployee for the next level of management. The onboarding period also includes robust classroom training with an emphasis on skill and competency building.
Our Response to COVID-19
The health and well-being of our employees and guests has always been and continues to be our top priority. To ensure the health and well-being of all of ouremployees during the COVID-19 pandemic, we also provided the following incremental COVID-19 benefits:
• Introduced paid time off for associates required to quarantine or who faced illness due to COVID-19;• Sponsored employer paid COVID-19 testing for employees;• Embarked on communication plan to ensure that associates are aware of our Employee Assistance Program coverage with a focus on mental health
support for employees and their families;• Increased all hourly base wages during the second quarter of 2020 when we were most impacted by the global pandemic;• Provided a special bonus in the second quarter of 2020 for our salaried restaurant managers;• Provided employees with additional two hours of paid time off for each COVID-19 vaccine shot (total of 4 hours);• Initiated a program for providing employees with the necessary tools and resources to educate themselves about the benefits of the COVID-19 vaccine to
enable employees to make the best decision for themselves;• Instituted protocols on wearing masks and gloves, conducting employee screenings and temperature checks, and implementing enhanced cleaning
measures;• Implemented work from home for each of our support centers; and• Installed tempered glass shields at the counters.
Management Structure
We conduct substantially all of our operations, training, marketing, real estate, facilities and culinary research and development support functions from ourPollo Tropical division headquarters in Miami, Florida, and our Taco Cabana division headquarters in San Antonio, Texas. The management structure of PolloTropical consists of one Senior Vice President of Operations who is supported by four Regional Directors and 17 District Managers. The management structure ofTaco Cabana consists of one Senior Vice President of Operations who is supported by four Regional Directors and 17 District Managers. The Pollo Tropical andTaco Cabana management structure is supported by a number of divisional and corporate executives with responsibility for operations, marketing, guestengagement, product development, purchasing, human resources, training, real estate and finance. For each of our brands, a district manager is responsible for thedirect oversight of the day-to-day operations of an average of approximately eight restaurants and a regional director is responsible for an average of approximately35 restaurants. Typically, district managers have previously served as restaurant managers at one of our restaurants or held an equivalent position to districtmanager at a competing restaurant concept. District managers and restaurant managers are compensated with a fixed salary plus an incentive bonus based upon theperformance of the restaurants under their supervision. Typically, our restaurants are staffed with hourly employees who are supervised by a salaried restaurant orgeneral manager and one to three salaried assistant managers and one to eight hourly shift leaders.
Our executive management functions are primarily conducted from our offices in Dallas, Texas, and Miami, Florida. Our management team is led by RichardStockinger, who serves as our President and Chief Executive Officer, Dirk Montgomery who serves as our Senior Vice President, Chief Financial Officer andTreasurer, Louis DiPietro who serves as our Senior Vice President, Chief Legal and People Officer and Corporate Secretary, Hope Diaz who serves as our SeniorVice President and Chief Marketing Officer, Patricia Lopez Calleja who serves as our Senior Vice President and Chief Experience Officer, Eladio
14

Table of Contents
"Willie" Romeo who serves as our Senior Vice President of Restaurant Operations for Pollo Tropical, and Ulyses Camacho who serves as our Senior VicePresident of Operations for Taco Cabana.
Availability of Information
We file annual, quarterly and current reports and other information with the SEC. The SEC maintains an Internet site that contains reports, proxy andinformation statements and other information regarding issuers that file electronically with the SEC. The address of that site is http://www.sec.gov.
We make available free of charge through our internet website (www.frgi.com) our annual report on Form 10-K, quarterly reports on Form 10-Q, currentreports on Form 8-K and amendments to those reports filed or furnished pursuant to Section 13(a) or 15(d) of the Exchange Act as soon as reasonably practicableafter electronically filing such material with the SEC. The references to our website address and the SEC's website address are textual references only, meaningthat they do not constitute incorporation by reference of the information contained on those websites and should not be considered part of this document. Inaddition, at our website you may also obtain, free of charge, copies of our corporate governance materials, including the charters for the committees of our board ofdirectors and copies of various corporate policies including our Code of Business Ethics and Conduct, Code of Ethics for Executives and our "Whistle Blower"policy.
15

Table of Contents
ITEM 1A. RISK FACTORS
You should carefully consider the risks described below, as well as other information and data included in this Annual Report on Form 10-K. The risks anduncertainties described below are those that we have identified as material, but are not the only risks and uncertainties we face. Our business is also subject togeneral risks and uncertainties that affect many other companies, including overall economic and industry conditions. Additional risks and uncertainties notcurrently known to us or that we currently believe are not material also may impair our business, consolidated financial condition and results of operations.
Risks Related to Our Business
The novel coronavirus (COVID-19) pandemic has adversely affected, and could continue to adversely affect, our operations and results of operations.
As a result of the novel coronavirus (COVID-19) pandemic, customer traffic has been, and could continue to be, negatively impacted at our restaurants andhas made, and could continue to make, it more difficult to staff our restaurants and, in more severe cases, cause a temporary inability to obtain supplies, increasecommodity costs or cause full and partial closures of our affected restaurants, sometimes for prolonged periods of time. We temporarily shifted to a "to-go" onlyoperating model at many of our Pollo Tropical and Taco Cabana restaurants in Florida and Texas, suspending sit-down dining and serving our guests through take-out, drive-thru and delivery. We also implemented closures, modified hours or reductions in on-site staff, resulting in canceled shifts for some of our employees.COVID-19 has also adversely affected our ability to implement our growth plans, including delays in construction of new restaurants. These changes and anyadditional changes have, and may continue to, materially adversely affect our business or results of operations, liquidity or financial condition. While we havebegun to open selected dining rooms where we believe it is prudent to do so, there can be no assurance that conditions will permit us to open dining rooms in all ofour restaurants or that we will not be required to close our restaurants again in the future if the COVID-19 pandemic worsens.
In addition, our operations have been, and could continue to be, disrupted by employees who are unable or unwilling to work, whether because of illness,quarantine, fear of contracting COVID-19 or caring for family members due to a COVID-19 illness. Restaurant closures, menu changes or modified hours ofoperation due to staffing shortages could materially adversely affect our business or results of operations, liquidity or financial condition. To protect the health andsafety of our employees and guests, we provide face coverings for all restaurant employees, provided temporary wage increases during the initial onset of thepandemic, provide paid emergency leave for COVID-related concerns, paid discretionary bonuses to restaurant managers, purchased additional sanitation suppliesand personal protective materials, as well as tamper evident packaging seals for all digital orders and implemented improvements to our restaurants, such astempered glass shields at the counter. These measures have increased our operating costs and adversely affected our liquidity.
We cannot predict how long the COVID-19 pandemic will last or if it will reoccur even after the vaccines are widely administered, when governmentrestrictions and mandates will be imposed or lifted, or how quickly, if at all, guests will return to their pre-COVID-19 purchasing behaviors, so we cannot predicthow long our results of operations and financial performance will be adversely impacted.
The market in which we compete is highly competitive, and we may not be able to compete effectively.
The restaurant industry is highly competitive. In each of our markets, our restaurants compete with a large number of national and regional restaurant chains,as well as locally owned restaurants, offering low- and medium-priced fare. We also compete with delivered meal solutions, convenience stores, grocery stores andother restaurant retailers, including "ghost" or dark kitchens, where meals are prepared at separate premises rather than at a restaurant. Competition from fooddelivery services has also increased in recent years, particularly during COVID-19.
Pollo Tropical's competitors include national and regional chicken-based concepts as well as other types of quick-service and fast-casual restaurants. Our TacoCabana restaurants compete with Mexican concepts, including those in the quick-service, fast-casual and casual dining segments. Many of our competitors orpotential competitors have greater financial and other resources than we do, which may allow them to react to changes in pricing, marketing, and trends in therestaurant industry more quickly or effectively than we can. Additionally, to remain competitive, we have increasingly offered selected food items and combinationmeals at discounted prices. These pricing and other marketing strategies have had, and in the future may have, a negative impact on our sales and earnings. If ourmarketing efforts are unsuccessful, or if our restaurants are unable to compete effectively, our operations and financial performance could be adversely impacted.
16

Table of Contents
Factors applicable to the quick-service and fast-casual restaurant segments may adversely affect our results of operations, which may cause a decrease inearnings and revenues.
The quick-service and fast-casual restaurant segments are highly competitive and can be materially adversely affected by many factors, including:
• changes in local, regional or national economic conditions;• changes in demographic trends;• changes in consumer tastes;• changes in traffic patterns;• increases in fuel prices and utility costs;• consumer concerns about health, diet and nutrition;• instances of food-borne or localized illnesses or other food safety issues;• increases in the number of, and particular locations of, competing restaurants;• changes in discretionary consumer spending;• inflation;• availability of key commodities such as beef, chicken, eggs and produce;• increases in the cost of key commodities, such as beef, chicken, eggs and produce as well as the cost of paper goods and packaging;• the availability of hourly-paid employees and experienced restaurant managers including a decrease in the labor supply due to changes in immigration
policy such as barriers for entry into, working in, or remaining in the United States;• increased labor costs, including higher wages, unemployment insurance, unionization of restaurant employees and overtime requirements;• increases in the cost of providing healthcare and related benefits to employees, including the impact of the Affordable Care Act;• costs related to remaining competitive and current with regard to new technologies in our restaurants such as loyalty programs, gift cards, online ordering
and credit card security; and• regional weather conditions including hurricanes, windstorms and flooding, and other natural disasters.
Our continued growth depends on our ability to open and operate new restaurants profitably, which in turn depends on our continued access to capital, andnewly developed restaurants may not perform as we expect and there can be no assurance that our growth and development plans will be achieved.
While we have decreased the number of new restaurants which we plan to open in the near term, our continued growth still depends on our ability to developadditional Pollo Tropical and Taco Cabana restaurants. Development involves substantial risks, including the following:
• developed restaurants that do not achieve desired revenue or cash flow levels or other operating and performance targets once opened;• the inability to recruit and retain managers and other employees necessary to staff each new restaurant;• incurring substantial unrecoverable costs in the event a development project is abandoned prior to completion or a new restaurant is closed due to poor
financial performance;• changes in general economic and business conditions;• the inability to fund development;• increasing development costs or development costs that exceed budgeted amounts;• delays in completion of construction;• the inability to obtain all necessary zoning and construction permits;• the inability to identify, or the unavailability of, suitable sites on acceptable leasing or purchase terms; and• changes in governmental rules and regulations or enforcement thereof.
Our long-term development plans will require additional management, operational and financial resources. For example, we will be required to recruitmanagers and other personnel for each new restaurant. We cannot ensure that we will be able to manage our expanding operations effectively and our failure to doso could adversely affect our results of operations.
In addition, to maintain our competitive positioning and improve our sales and overall performance, we continue to look at ways to improve our existingrestaurants through remodels, upgrades and regular maintenance. If the costs associated with these activities are higher than projected, restaurants are closed forperiods longer than anticipated or such remodels do not perform as forecasted, we may not realize an acceptable return on investment, which could have a negativeeffect on our results of operations.
17
Table of Contents
In addition, our ability to open new restaurants and to grow, as well as our ability to meet other anticipated capital needs, may depend on our continued accessto external financing, including borrowing under our senior secured revolving credit facility, which we refer to as the "senior credit facility." There can be noassurance that we will have access to the capital we need at acceptable terms or at all, which could materially adversely affect our business. In addition, our need tomanage our indebtedness levels to ensure continued compliance with financial leverage ratio covenants under our new senior credit facility may reduce our abilityto develop new restaurants.
Customer preferences and traffic could be adversely impacted by health concerns about certain food products, reports of food-borne illnesses or food safetyissues, any of which could result in a decrease in demand for our products.
Customer preferences and traffic could be adversely impacted by health concerns or negative publicity about the consumption of particular food products,which could cause a decline in demand for those products and adversely impact our sales.
Instances or reports, whether verified or not, of food-safety issues, such as food-borne illnesses, food tampering, food contamination or mislabeling, eitherduring growing, manufacturing, packaging, storing or preparation, have in the past severely injured the reputations of companies in the food processing, groceryand quick-service and fast-casual restaurant sectors and could affect us as well. Any report linking us to food-borne illnesses or food tampering, contamination,mislabeling or other food-safety issues could damage our brand value and severely hurt sales of our food products and possibly lead to product liability claims,litigation (including class actions) or damages.
These problems, other food-borne illnesses (such as norovirus or hepatitis A), and injuries caused by the presence of foreign material could require us totemporarily close our restaurants. The occurrence of food-borne illnesses or food safety issues could also adversely affect the price and availability of affectedingredients, resulting in higher costs and a decrease in customer traffic to our restaurants. Furthermore, any instances of food contamination, whether or not at ourrestaurants, could subject us or our suppliers to a food recall pursuant to the United States Food and Drug Administration's recently enacted Food SafetyModernization Act.
Changes in consumer tastes may reduce the frequency of their visits to our restaurants which could negatively impact our business.
We obtain a significant portion of our revenues from the sale of foods that are characterized as tropical- and Mexican-inspired and if consumer preferences forthese types of foods change, it could have a material adverse effect on our operating results. Additionally, numerous companies in the industry have introducedproducts positioned to capitalize on the growing consumer preference for food products that are, or are perceived to be, promoting good health, nutritious, fresh,local, clean and all-natural, free from artificial ingredients, minimally processed, low in calories and low in fat content. Our inability to continue to respond tocustomer demand or changes in customer taste and preferences could require us to change our pricing, marketing, or promotional strategies, which could materiallyand adversely affect our consolidated financial results or the brand identity that we have created.
An increase in food costs could adversely affect our operating results.
Our profitability and operating margins are dependent in part on our ability to anticipate and react to changes in food costs. Changes in the cost or availabilityof certain food products could affect our ability to offer a broad menu and maintain competitive prices and could materially adversely affect our profitability andreputation. The type, variety, quality and cost of produce, beef, poultry, cheese and other commodities can be subject to change and to factors beyond our control,including weather, governmental regulation, availability and seasonality, each of which may affect our food costs or cause a disruption in our supply. Although weutilize purchasing contracts to lock in the prices for a material portion of the food commodities used in our restaurants, some of the commodities used in ouroperations cannot be locked in for periods longer than one month. We do not use financial instruments to hedge our risk against market fluctuations in the price ofcommodities at this time. We may not be able to anticipate and react to changing food costs through our purchasing practices and menu price adjustments in thefuture, and failure to do so could negatively impact our revenues and results of operations.
We could also be adversely affected by price increases specific to ingredients we have chosen due to their specific quality profile or related criteria, themarkets for which are generally smaller and more concentrated than the markets for other commodity food products.
18
Table of Contents
If a significant disruption in service or supply by any of our suppliers or distributors were to occur, it could create disruptions in the operations of ourrestaurants, which could have a material adverse effect on our business.
Our restaurants depend on frequent deliveries of ingredients and other products. For both our Pollo Tropical and Taco Cabana restaurants, we have serviceagreements with our primary distributors of food and paper products. Performance Food Group, Inc., is our primary distributor of food and beverage products andsupplies for both our Pollo Tropical and Taco Cabana restaurants under a distribution services agreement that expires on July 27, 2024. We also currently rely onfive suppliers for chicken for our Pollo Tropical and Taco Cabana restaurants under agreements that expire on December 31, 2021. There are many factors whichcould cause shortages or interruptions in the supply of our ingredients and products, including adverse weather, unanticipated demand, labor or distributionproblems, food safety issues by our suppliers or distributors, cost, and the financial health of our suppliers. If we cannot replace or engage distributors or supplierswho meet our specifications in a short period of time, this could increase our expenses and cause shortages of food and other items at our restaurants, which couldcause a restaurant to remove items from its menu. If such actions were to occur, customers could change their dining habits and affected restaurants couldexperience significant reductions in sales during the shortage or thereafter.
A substantial portion of our senior management team is new, which may pose challenges, and our success may depend on the continued service andavailability of key personnel.
Dirk Montgomery and Hope Diaz joined us as Chief Financial Officer and Chief Marketing Officer, respectively, in September 2019, and we added a newChief Information Officer, John Doyle in December 2019, and Louis DiPietro, our Chief Legal and People Officer, in December 2018. This followed the hiring ofour current Chief Executive Officer, Richard Stockinger, in March 2017. These officers have hired, and are expected in the future to hire, a number of new directreports, and as a result, our senior management team is relatively new and may face challenges working together as a unit, aligning on strategic priorities andobjectives, or integrating their new teams with one another. Failure to meet these challenges successfully may adversely impact our operations, business results orlong-term growth prospects.
If there is a lack of sufficient labor or labor costs increase, our operating results may be adversely affected.
Labor is a primary component in the cost of operating our restaurants. If we face labor shortages or increased labor costs, because of increased competition foremployees, a decrease in the labor supply to us or our key suppliers due to changes in immigration policy including barriers to immigrants entering, working in, orremaining in the United States, higher employee-turnover rates, unionization of restaurant workers, or changes in federal, state, or local laws, including thoserelated to prevailing wages or in other employee benefits costs (including costs associated with health insurance coverage or workers' compensation insurance),this could have a material adverse effect on our operating results.
If a significant portion of our employees were to become union organized, our labor costs could increase. Potential changes in labor laws could increase thelikelihood of some or all of our employees being subjected to greater organized labor influence and could have an adverse effect on our business and financialresults by imposing requirements that could potentially increase our costs.
The success of our marketing programs and the impact of those of our competitors could have a material adverse effect on our results of operations andfinancial condition.
If our competitors increase spending on advertising and promotions, or our advertising and other marketing programs do not result in increased net sales or ifthe costs of advertising, media, or marketing increase greater than expected, or are less effective than our competitors, our profitability could be materiallyadversely affected.
Our inability or failure to recognize, respond to and effectively manage the accelerated impact of social media could have a material adverse impact on ourbusiness.
There has been a marked increase in the use of social media platforms and similar devices which allow individuals access to a broad audience of consumersand others. Many social media platforms immediately publish the content their subscribers and participants post, often without filters or checks on accuracy of thecontent posted. Information posted on such platforms at any time may be adverse to our interests or may be inaccurate, each of which may harm our performance,prospects, or business. The harm may be immediate without affording us an opportunity for redress or correction. The dissemination of information online couldharm our business, prospects, financial condition, and results of operations, regardless of the information's accuracy.
Many of our competitors are expanding their use of social media and new social media platforms are rapidly being developed, potentially making moretraditional social media platforms obsolete. As a result, we need to continuously innovate and develop our social media strategies in order to maintain broad appealwith guests and brand relevance. As part of our
19

Table of Contents
marketing efforts, going forward we expect to increasingly rely on social media platforms and search engine marketing to attract and retain guests. We will alsoincrease our investment in other digital marketing initiatives that allow us to reach our guests across multiple digital channels and build their awareness of,engagement with, and loyalty to our brands. These initiatives may not be successful, resulting in expenses incurred without the benefit of higher revenues,increased employee engagement or brand recognition. In addition, a variety of risks are associated with the use of social media, including the improper disclosureof proprietary information, negative comments about us, exposure of personally identifiable information, fraud, or out-of-date information. The inappropriate useof social media vehicles by our guests or employees could increase our costs, lead to litigation or result in negative publicity that could damage our reputation.
Cybersecurity breaches or other privacy or data security incidents that expose confidential guest, personal employee and other material, confidentialinformation that is stored in our systems in connection with our electronic processing of credit and debit card transactions or security breaches of confidentialemployee information that is stored in our systems or by third parties on our behalf may adversely affect our business.
We rely heavily on information technology systems across our operations, including point-of-sale processing in our restaurants, gift and loyalty cards, onlinebusiness, and various other processes and transactions. Our ability to effectively manage our business and coordinate the preparation and sale of our productsdepends significantly on the reliability and capacity of these systems. We expect to expand our utilization of technology throughout our business and the failure ofthese systems to operate effectively, problems with transitioning to upgraded or replacement systems, or a breach in security of these systems could cause reducedefficiency of our operations, and significant capital investments could be required to remediate the problem which could adversely affect our business. Anyintentional attack or an unintentional event that results in unauthorized access to systems to disrupt operations, corrupt data or steal or expose confidentialinformation or intellectual property that compromises the information of our guests or employees could result in widespread negative publicity, damage to ourreputation, a loss of guests, disruption of our business and legal liabilities. As our reliance on technology has grown, the scope and severity of risks posed to oursystems from cyber threats has increased. In addition, as more business activities have shifted online and more people are working remotely, including as a resultof COVID-19, we have experienced an increase in cybersecurity threats and attempts to breach our security networks. The techniques and sophistication used toconduct cyber-attacks and breaches of information technology systems, as well as the sources and targets of these attacks, change frequently and are often notrecognized until attacks are launched or have been in place for a period of time. We continuously monitor and develop our information technology networks andinfrastructure to prevent, detect, address and mitigate the risk of unauthorized access, misuse, malware and other events that could have a security impact; howeverthere can be no assurance that these measures will be effective.
A significant amount of our restaurant sales are by credit or debit cards. Other restaurants and retailers have experienced security breaches in which credit anddebit card information of their guests has been stolen. We may in the future become subject to lawsuits or other proceedings for purportedly fraudulent transactionsarising out of the actual or alleged theft of our guests' credit or debit card information. Any such claim or proceeding, or any adverse publicity resulting from theseallegations, may have a material adverse effect on us and our restaurants.
From time to time we have been, and likely will continue to be, the target of cyber and other security threats. We may in the future become subject to otherlegal proceedings or governmental investigations for purportedly fraudulent transactions arising out of the actual or alleged theft of our consumers' credit or debitcard information or if consumer or employee information is obtained by unauthorized persons or used inappropriately. Any such claim or proceeding, or anyadverse publicity resulting from such an event, may have a material adverse effect on our business and we may incur significant remediation costs.
Such breaches also could result in a violation of applicable privacy and other laws, and subject us to private consumer, business partner, or securities litigationand governmental investigations and proceedings, any of which could result in our exposure to material civil or criminal liability. For example, many jurisdictionshave adopted regulations which require companies to meet certain requirements regarding the handling of personal data and provide a private right of action fordata breaches. These laws also typically require companies that process information on customers to make new disclosures to consumers about their datacollection, use and sharing practices, allow consumers to opt out of certain data sharing with third parties and the right for consumers to request deletion ofpersonal information. If we become subject to such laws in the markets in which we operate and we fail, or are perceived to have failed, to properly respond tosecurity breaches of our or third party's information technology systems or fail to properly respond to consumer requests under such laws, we could experiencereputational damage, adverse publicity, loss of consumer confidence, reduced sales and profits, complications in executing our growth initiatives and regulatoryand legal risk, including criminal penalties or civil liabilities.
20
Table of Contents
Compliance with current and future applicable privacy, cybersecurity and related laws can be costly and time-consuming. We make significant investments intechnology, third-party services and internal personnel to develop and implement systems and processes that are designed to anticipate cyber-attacks and to preventor minimize breaches of our information technology systems or data loss, but these security measures cannot provide assurance that we will be successful inpreventing such breaches or data loss. In addition, media or other reports of existing or perceived security vulnerabilities in our systems or those of our third-partybusiness partners or service providers can also adversely impact our brand and reputation and materially impact our business, even if no breach has been attemptedor has occurred.
Our digital business, which we expect to grow as a percentage of sales, is subject to risks.
In 2020, we saw an increase in the number of digital orders, which includes delivery and customer pickup. The growth in digital orders is, in part, attributableto more guests dining at home due to COVID-19, our expanded partnerships with multiple third-party delivery services and our investments in our overall digitalstrategies. Depending on which ordering platform a digital order is placed—our platform or the platform of a third-party delivery service—the delivery fee wecollect from the guest may be less than the actual delivery cost, which has a negative impact on our profitability. While we have implemented a menu priceincrease to partially offset higher delivery costs, this higher menu prices may cause some guests to shift their purchases to other restaurants offered on the platform.As our digital business grows, we are increasingly reliant on third-party delivery companies, which maintain control over data regarding guests that use theirplatform and over the customer experience. If a third-party delivery company driver fails to make timely deliveries or fails to deliver the complete order, our guestsmay attribute the bad customer experience to our brands and could stop ordering from us. The ordering and payment platforms used by these third-parties, or ourmobile app or online ordering system, could be interrupted by technological failures, user errors, cyber-attacks or other factors, which could adversely impact salesthrough these channels and negatively impact our overall sales and reputation. The third-party delivery business is intensely competitive, with a number of playerscompeting for market share, online traffic capital, and delivery drivers. If the third-party delivery companies we utilize cease or curtail operations, increase theirfees, or give greater priority or promotions on their platforms to our competitors, our delivery business and our sales may be negatively impacted. The deliverybusiness has been consolidating and may continue to consolidate, and fewer third-party delivery companies may give them more leverage in negotiating the termsand pricing of contracts, which could negatively impact our profits from delivery orders.
Our business is regional, and we therefore face risks related to reliance on certain markets as well as risks for other unforeseen events.
As of January 3, 2021, all of our Company-owned Pollo Tropical restaurants were located in Florida and all of our Company-owned Taco Cabana restaurantswere located in Texas. Furthermore, 68% of our Company-owned Pollo Tropical restaurants were located in three counties in Florida which represents a significantamount of the brand's sales and Restaurant-level Adjusted EBITDA. Therefore, events and conditions specific to these regions, including economic conditions,state and local government regulations, weather conditions or other conditions affecting Florida and Texas, and the tourism industry in Florida, may have amaterial impact on the success of our restaurants in those locations.
Adverse weather conditions have impacted, and could in the future impact, guest traffic at our restaurants, cause the temporary underutilization of outdoorpatio seating and, in more severe cases such as hurricanes, tornadoes or other natural disasters, cause temporary closures, sometimes for prolonged periods, whichwould negatively impact our restaurant sales. Changes in weather could result in construction delays, interruptions to the availability of utilities, and shortages orinterruptions in the supply of food items and other supplies, which could increase our costs and could adversely impact our business. Some climatologists predictthat the long-term effects of climate change and global warming may result in more severe, volatile weather or extended droughts, which could increase thefrequency and duration of weather impacts on our operations.
Economic downturns may adversely impact consumer spending patterns.
Our business is dependent to a significant extent on national, regional and local economic conditions, particularly those that affect our guests that frequentlypatronize our restaurants. In particular, where our business is subject to factors which could reduce our guests' disposable income (such as by job losses, creditconstraints and higher housing, tax, utility, gas, consumer credit or other costs) or where the perceived wealth of guests has decreased (because of circumstancessuch as lower residential real estate values, lower investment values, increased foreclosure rates, increased tax rates, social unrest, or other economic disruptionsand governmental, political and budget concerns), our restaurants have in the past experienced, and may in the future experience, lower sales and guest traffic asguests choose lower-cost alternatives or choose alternatives to dining out. The resulting decrease in our guest traffic or average sales per transaction has had anadverse effect in the past, and could in the future have a material adverse effect, on our business. In addition, a new presidential and legislative administrationrecently took office and it is unknown what impact any changes made by this administration or policies implemented will have on the economy or restaurantspending.
21
Table of Contents
Our expansion into new markets may present increased risks due to a lack of market awareness of our brands.
We have encountered and may continue to encounter difficulties developing restaurants outside of our more mature core markets. For example, we closed allPollo Tropical restaurants in Texas, Tennessee and Georgia over the last three years. We may be unable to find attractive locations or successfully market ourproducts as we attempt to expand beyond our existing markets, as the competitive circumstances and consumer characteristics in these new areas may differsubstantially from those in areas in which we currently operate. It may be more challenging for us to attract guests to our restaurants in areas where there is alimited or a lack of market awareness of the Pollo Tropical or Taco Cabana brand. Restaurants opened in new markets where we have not reached media efficiencymay open at lower sales volumes than restaurants opened in more mature markets, and may have lower restaurant-level operating margins than more maturemarkets. Sales at restaurants opened in new markets that are not yet media efficient have taken and may continue to take longer to reach average restaurant salesvolumes, if at all, thereby adversely affecting our operating results, including the recognition of future impairment charges. Opening new restaurants in areas inwhich potential guests may not be familiar with our restaurants may include costs related to the opening and marketing of those restaurants that are substantiallygreater than those incurred by our restaurants in other areas. Even though we may incur substantial additional costs with respect to these new restaurants, they mayattract fewer guests than our more established restaurants in existing markets. We may also not open a sufficient number of restaurants in new markets toadequately leverage distribution, supervision and marketing costs. As a result of the foregoing, we cannot ensure that we will be able to operate our new restaurantssuccessfully or profitably outside our existing markets.
Changes in accounting standards or the recognition of impairment or other charges may adversely affect our future results of operations.
New accounting standards or changes in financial reporting requirements, accounting principles or practices, including with respect to our critical accountingestimates, could adversely affect our future results. We may also be affected by the nature and timing of decisions about underperforming markets or assets,including decisions that result in impairment or other charges that reduce our earnings. In assessing the recoverability of our long-lived assets, we consider changesin economic conditions and make assumptions regarding estimated future cash flows and other factors. These estimates are highly subjective and can besignificantly impacted by many factors such as global and local business and economic conditions, operating costs, inflation, competition, and consumer anddemographic trends. If our estimates or underlying assumptions change in the future, we may be required to record impairment charges. If we experience any suchchanges, they could have a significant adverse effect on our reported results for the affected periods.
Government regulation could adversely affect our financial condition and results of operations.
In connection with the operation of our business, we are subject to extensive federal, state, local, and foreign laws and regulations that are complex and varyfrom location to location, including those related to:
• franchise relationships;• building construction and zoning requirements;• nutritional content labeling and disclosure requirements;• management and protection of the personal data of our employees and customers; and• environmental matters.
Our restaurants are licensed and subject to regulation under federal, state, local and foreign laws, including business, health, fire, sales of alcohol and safetycodes. For example, we are subject to the U.S. Americans with Disabilities Act, or ADA, and similar state laws that give civil rights protections to individuals withdisabilities in the context of employment, public accommodations and other areas.
In addition, new government initiatives or changes to existing laws, such as the adoption and implementation of national, state, or local government proposalsrelating to increases in minimum wage rates, may increase our costs of doing business and adversely affect our results of operations.
Our failure to comply with various applicable federal and state employment and labor laws and regulations could have a material, adverse impact on ourbusiness.
Various federal and state labor laws govern the relationship with our employees and affect operating costs. These laws include employee classification asexempt/non-exempt for overtime and other purposes, minimum wage requirements, unemployment tax rates, workers' compensation rates, immigration status andother wage and benefit requirements. In addition, states in which we operate are considering or have already adopted new immigration laws or enforcementprograms, and the U.S. Congress and Department of Homeland Security from time to time consider and may implement changes to federal immigration laws,regulations or enforcement programs as well. Some of these changes may increase our obligations for
22

Table of Contents
compliance and oversight, which could subject us to additional costs and make our hiring process more cumbersome, or reduce the availability of potentialemployees. Although we require all workers to provide us with government-specified documentation evidencing their employment eligibility, some of ouremployees may, without our knowledge, be unauthorized workers. We currently participate in the E-Verify program, an Internet-based, free program run by theUnited States government to verify employment eligibility, in states in which participation is required. However, use of the E-Verify program does not guaranteethat we will properly identify all applicants who are ineligible for employment. Unauthorized workers are subject to deportation and may subject us to fines orpenalties, and if any of our workers are found to be unauthorized we could experience adverse publicity that negatively impacts our brand and may make it moredifficult to hire and keep qualified employees. Termination of a significant number of employees who were unauthorized employees may disrupt our operations,cause temporary increases in our labor costs as we train new employees and result in additional adverse publicity. We could also become subject to fines, penaltiesand other costs related to claims that we did not fully comply with all recordkeeping obligations of federal and state immigration compliance laws.
Although we believe that compliance with these laws has not had a material adverse effect on our operations to date, we may experience material difficultiesor failures with respect to compliance with such laws in the future. Complying with these laws and regulations subjects us to substantial expense and non-compliance could expose us to significant liabilities. For example, lawsuits have been filed against us alleging violations of federal and state laws regardingemployee wages and payment of overtime, meal and rest breaks, employee classification, employee record-keeping and related practices with respect to ouremployees. We may incur legal costs to defend such lawsuits, and we could suffer losses from, these and similar cases, and the amount of such losses or costscould be significant.
In addition, the amount that we pay our restaurant employees will likely be impacted by minimum wage laws. To the extent implemented, federal, state, andlocal proposals that increase minimum wage requirements or mandates or impact other employee matters could, to the extent implemented, materially increase ourlabor and other costs. For example, the state of Florida recently approved a minimum wage increase effective in September of 2021 which will increase theminimum wage gradually over a period of five years. As other jurisdictions implement minimum wage increases, we expect our labor costs will continue toincrease. Our ability to respond to minimum wage increases by increasing menu prices depends on the willingness of our guests to pay higher prices and recognizeour perceived value relative to competitors. Our distributors and suppliers could also be affected by higher minimum wage, benefit standards and compliance costs,which could result in higher costs for goods and services supplied to us.
Additionally, while our employees are not currently covered by any collective bargaining agreements, union organizers have engaged in efforts to organize ouremployees and those of other restaurant companies. If a significant portion of our employees were to become covered by collective bargaining agreements, ourlabor costs could increase, and it could negatively impact our culture and reduce our flexibility to attract and retain top performing employees. Labor unions haveattempted, and likely will continue to attempt, to attract media attention to their organizing efforts in our restaurants, and their organizing efforts include claimsthat we mistreat or undervalue our employees. Despite our efforts to provide more accurate information about our policies and practices, these messages maydissuade guests from patronizing our restaurants.
If one of our employees sells alcoholic beverages to an intoxicated patron or to a minor, we may be liable to third parties for the acts of the patron or incursignificant fines or penalties.
We serve alcoholic beverages at our restaurants and are subject to the "dram-shop" statutes of the jurisdictions in which we serve alcoholic beverages. "Dram-shop" statutes generally provide that serving alcohol to an intoxicated patron is a violation of the law.
In most jurisdictions, if one of our employees sells alcoholic beverages to an intoxicated patron we may be liable to third parties for the acts of the patron. Wecannot guarantee that those patrons will not be served or that we will not be subject to liability for their acts. Our liquor liability insurance coverage may not beadequate to cover any potential liability and insurance may not continue to be available on commercially acceptable terms or at all, or we may face increaseddeductibles on such insurance. A significant dram-shop claim or claims could have a material adverse effect on us as a result of the costs of defending against suchclaims; paying deductibles and increased insurance premium amounts; implementing improved training and heightened control procedures for our employees; andpaying any damages or settlements on such claims.
Additionally, we are subject to statutes of the jurisdictions in which we serve alcoholic beverages which prohibit us from selling or serving alcohol to minorpatrons. These statutes generally provide that serving or selling alcohol to minors is a violation of the law, and will result in fines and other penalties including thesuspension or loss of our license to sell alcohol in the future. If we were to incur a significant number of sale to minor violations the fines or penalties could have amaterial adverse effect on us.
23

Table of Contents
The effect of changes to U.S. health care laws may increase our health care costs and negatively impact our financial results.
Under the comprehensive U.S. health care reform law, the Affordable Care Act, changes in the law including the employer mandate and employer penaltiesmay increase our labor costs significantly. While changes in the law, including the imposition of a penalty on individuals who do not obtain health care coverage,have not resulted in significant numbers of additional employees electing to participate in our health care plans, there can be no assurance that this will not changein the future which may increase our health care costs. It is also possible that making changes or failing to make changes in the health care plans we offer willmake us less attractive to our current or potential employees. The costs and other effects of these new health care requirements on future periods cannot bedetermined with certainty and could have a material adverse effect on our results of operations.
We may incur significant liability or reputational harm if claims are brought against us or against our franchisees.
We or our franchisees may be subject to complaints, regulatory proceedings or litigation from guests or other persons alleging food-related illness, injuriessuffered on our premises or other food quality, health, or operational concerns, including environmental claims. In addition, in recent years a number of restaurantcompanies have been subject to lawsuits, including class action lawsuits, alleging, among other things, violations of federal and state law regarding workplace andemployment matters, discrimination, harassment, wrongful termination and wage, rest break, meal break and overtime compensation issues and, in the case ofcertain restaurants, alleging that they have failed to disclose the health risks associated with high-fat or high sodium foods and that their marketing practices haveencouraged obesity. We may also be subject to litigation or other actions initiated by governmental authorities, our employees and our franchisees, among others,based upon these and other matters. Adverse publicity resulting from such allegations or occurrences or alleged discrimination or other operating issues stemmingfrom one of our locations, a number of our locations or our franchisees could adversely affect our business, regardless of whether the allegations are true, orwhether we are ultimately held liable. Any cases filed against us could materially adversely affect us if we lose such cases and have to pay substantial damages orif we settle such cases. In addition, any such cases may materially and adversely affect our operations by increasing our litigation costs and diverting our attentionand resources to address such actions. In addition, if a claim is successful, our insurance coverage may not cover or be adequate to cover all liabilities or losses andwe may not be able to continue to maintain such insurance, or to obtain comparable insurance at a reasonable cost, if at all. If we suffer losses, liabilities or loss ofincome in excess of our insurance coverage or if our insurance does not cover such loss, liability or loss of income, there could be a material adverse effect on ourresults of operations.
Our franchisees or licensees could take actions that harm our reputation.
As of January 3, 2021, a total of 35 Pollo Tropical and Taco Cabana restaurants were owned and operated by our franchisees and licensees. We do not exercisecontrol of the day-to-day operations of our franchisees and licensees and the number of franchised or licensed restaurants may increase in the future. While weattempt to ensure that franchisee-owned and licensee-owned restaurants maintain the same high operating standards as our Company-owned restaurants, one ormore of these franchisees or licensees may fail to meet these standards. Any shortcomings at our franchisee-owned and licensee-owned restaurants could beattributed to our company as a whole and could adversely affect our reputation and damage our brands.
Federal, state and local environmental regulations relating to the use, storage, discharge, emission and disposal of hazardous materials could expose us toliabilities, which could adversely affect our results of operations.
We are subject to a variety of federal, state and local environmental regulations relating to the use, storage, discharge, emission and disposal of hazardoussubstances or other regulated materials, release of pollutants into the air, soil and water, and the remediation of contaminated sites.
Failure to comply with environmental laws could result in the imposition of fines or penalties, restrictions on operations by governmental agencies or courts oflaw, as well as investigatory or remedial liabilities and claims for alleged personal injury or damages to property or natural resources. Some environmental lawsimpose strict, and under some circumstances joint and several, liability for costs of investigation and remediation of contaminated sites on current and prior ownersor operators of the sites, as well as those entities that send regulated materials to the sites. We cannot ensure that we have been or will be at all times in completecompliance with such laws, regulations and permits. Therefore, our costs of complying with current and future environmental, health and safety laws couldadversely affect our results of operations.
Major developments on trade relations could have a material adverse effect on our business.
The current political climate has introduced uncertainty with respect to trade policies, tariffs and government regulations impacting trade between the UnitedStates and other countries. We source several of our ingredients, paper products and other materials used within our business from suppliers outside of the UnitedStates, including Asia, Central America and Mexico.
24
Table of Contents
Significant developments in trade relations, such as the imposition of tariffs on items imported by us, could increase our costs and materially and adversely affectour consolidated financial results.
We are subject to all of the risks associated with leasing property subject to long-term non-cancelable leases.
The leases for our restaurant locations generally have initial terms of 10 to 20 years, and typically provide for renewal options in five-year increments as wellas for rent escalations. Generally, our leases are "net" leases, which require us to pay all of the costs of insurance, taxes, maintenance and utilities. We generallycannot cancel these leases. Additional sites that we lease are likely to be subject to similar long-term non-cancelable leases.
From time to time we have, and may in the future, close or relocate a restaurant if a current location becomes less profitable as a result of adverse economicconditions or other factors. If the closures continue for a long period of time, we may not be able to recover our investment due to the high rental rates. Becausesubstantially all of our restaurants operate in leased facilities, we may incur significant lease termination expenses when we close or relocate a restaurant and areoften obligated to continue rent and other lease related payments after restaurant closure. We also may incur significant asset impairment and other charges inconnection with closures and relocations. If the lease termination cost is significant, we may decide to keep underperforming restaurants open. Ongoing leaseobligations at closed or underperforming restaurant locations could decrease our results of operations. In addition, as each of our leases expire, we may fail tonegotiate renewals, either on commercially acceptable terms or at all, which could cause us to close restaurants in desirable locations which could adversely affectour results of operations.
Our failure or inability to enforce our trademarks or other proprietary rights could adversely affect our competitive position or the value of our brand.
We own certain common law trademark rights and a number of federal and international trademark and service mark registrations, including the PolloTropical and Taco Cabana names and logos, and proprietary rights relating to certain of our core menu offerings. We believe that our trademarks, service marks,trade dress and other proprietary rights are important to our success and our competitive position. We, therefore, devote appropriate resources to the protection ofour trademarks and proprietary rights. If our efforts to protect our intellectual property are inadequate or if any third party misappropriates or infringes on ourintellectual property either in print or on the internet, the value of our brands may be harmed which could have a material adverse effect on our business. We areaware of restaurants in foreign jurisdictions using menu items, logos or branding that we believe are based on our intellectual property and our ability to preventthese restaurants from using these elements may be limited in jurisdictions in which we are not operating. This could have an adverse impact on our ability toexpand into other jurisdictions in the future.
We are not aware of any assertions that our trademarks or menu offerings infringe upon the proprietary rights of third parties, but we cannot ensure that thirdparties will not claim infringement by us in the future. Any such claim, whether or not it has merit, could be time-consuming, result in costly litigation, causedelays in introducing new menu items in the future or require us to enter into royalty or licensing agreements. As a result, any such claim could have a materialadverse effect on our business, results of operations and financial condition.
Risks Related to Our Indebtedness
Our indebtedness could adversely affect our financial condition.
As of January 3, 2021, we had $73.3 million of outstanding indebtedness comprised of $71.5 million of term loan borrowings, net of debt issuance costs anddiscounts totaling $3.5 million, under our new senior credit facility and finance lease obligations of $1.9 million.
As a result of our indebtedness, a portion of our operating cash flow will be required to make payments on our outstanding indebtedness. In addition, to theextent we significantly increase our borrowings and interest rates increase under our new senior credit facility, we may not generate sufficient cash flow fromoperations to enable us to both repay our indebtedness and fund our other liquidity needs which could adversely affect our financial condition.
Our indebtedness could have important consequences. For example, it could:
• make it more difficult for us to satisfy our obligations with respect to our debt;• increase our vulnerability to general adverse economic and industry conditions;• require us to dedicate a portion of our cash flow from operations to payments on our indebtedness and related interest, including indebtedness we may
incur in the future, thereby reducing the availability of our cash flow to fund working capital, capital expenditures and other general corporate purposes;• limit our flexibility in planning for, or reacting to, changes in our business and the industry in which we operate;
25

Table of Contents
• increase our cost of borrowing;• place us at a competitive disadvantage compared to our competitors that may have less debt; and• limit our ability to obtain additional financing for working capital, capital expenditures, acquisitions, debt service requirements or general corporate
purposes.
We expect to use cash flow from operations and revolving borrowings under our new senior credit facility to meet our current and future financial obligations,including funding our operations, debt service and capital expenditures. Our ability to make these payments depends on our future performance, which will beaffected by financial, business, economic and other factors, many of which we cannot control. Our business may not generate sufficient cash flow from operationsin the future, which could result in our being unable to repay indebtedness, or to fund other liquidity needs. If we do not have enough money, we may be forced toreduce or delay our business activities and capital expenditures, sell assets, obtain additional debt or equity capital or restructure or refinance all or a portion of ourdebt, including our new senior credit facility, on or before maturity which could adversely impact our business. We cannot make any assurances that we will beable to accomplish any of these alternatives on terms acceptable to us, or at all. In addition, the terms of existing or future indebtedness, including the agreementsfor our new senior credit facility, may limit our ability to pursue any of these alternatives.
Despite current indebtedness levels and restrictive covenants, we may still be able to incur more debt or make certain restricted payments, which couldfurther exacerbate the risks described above.
We and our subsidiaries may be able to incur additional debt in the future. Although our new senior credit facility contains restrictions on our ability to incurindebtedness, those restrictions are subject to a number of exceptions. We may also consider investments in joint ventures or acquisitions, which may increase ourindebtedness. Moreover, although our new senior credit facility contains restrictions on our ability to make restricted payments, including the declaration andpayment of dividends, we are able to make such restricted payments under certain circumstances. Adding new debt to current debt levels or making restrictedpayments could intensify the related risks that we and our subsidiaries now face.
Our new senior credit facility restricts our ability to engage in some business and financial transactions.
Our new senior credit facility restricts our ability in certain circumstances to, among other things:
• incur additional debt;• pay dividends and make other distributions on, redeem or repurchase, capital stock;• make investments or other restricted payments;• enter into transactions with affiliates;• sell all, or substantially all, of our assets;• create liens on assets to secure debt; or• effect a consolidation or merger.
These covenants limit our operational flexibility and could prevent us from taking advantage of business opportunities as they arise, growing our business orcompeting effectively which could adversely impact our business. In addition, our new senior credit facility requires us to maintain specified financial ratios andsatisfy other financial condition tests. Our ability to meet these financial ratios and tests can be affected by events beyond our control, and we cannot ensure thatwe will meet these tests.
Risks Related to Our Common Stock
We do not expect to pay any cash dividends for the foreseeable future, and our senior credit facility limits our ability to pay dividends to our stockholders.
We do not anticipate that we will pay any cash dividends to holders of our common stock in the foreseeable future. The absence of a dividend on our commonstock may increase the volatility of the market price of our common stock or make it more likely that the market price of our common stock will decrease in theevent of adverse economic conditions or adverse developments affecting our company. Our new senior credit facility limits, and the debt instruments that we andour subsidiaries may enter into in the future may limit, our ability to pay dividends to our stockholders.
26
Table of Contents
If securities analysts do not publish research or reports about our business or if they downgrade our stock, the price of our stock could decline.
The trading market for our common stock will rely in part on the research and reports that industry or financial analysts publish about us or our business. Wecannot ensure that these analysts will publish research or reports about us or that any analysts that do so will not discontinue publishing research or reports about usin the future. If one or more analysts who cover us downgrade our stock, our stock price could decline rapidly. If analysts do not publish reports about us or if oneor more analyst ceases coverage of our stock, we could lose visibility in the market, which in turn could cause our stock price to decline.
Percentage ownership of our common stock may be diluted in the future.
Percentage ownership of our common stock may be diluted in the future because of equity awards that we expect will be granted to our directors, officers andemployees. The Fiesta Restaurant Group, Inc. 2012 Stock Incentive Plan (and any successor stock incentive plan that we may adopt) provides for the grant ofequity-based awards, including restricted stock, restricted stock units, stock options, and other equity-based awards to our directors, officers and other employees,advisors and consultants. In addition, in the future we may also issue common stock or other securities to raise additional capital. Any new shares issued woulddilute our existing shareholders.
Proxy contests threatened or commenced against us could be disruptive and costly, and adversely affect our business, operation results and financialcondition.
Stockholders may from time to time attempt to effect changes, engage in proxy solicitations or advance stockholder proposals. Responding to proxy contestsand related actions by activist stockholders can be costly and time-consuming, disrupt our operations, and divert the attention of our management and employeesaway from their regular duties and the pursuit of our business strategies, which could materially and adversely affect our business, operating results and financialconditions. Perceived uncertainties as to our future direction as a result of proxy contests and related actions by activist stockholders may lead to the perception ofa change in the direction of our business, instability or lack of continuity. This may affect our relationship with current or potential suppliers, vendors, and otherthird parties, and make it more difficult to attract and retain management employees and executives which could adversely affect our business, operating resultsand financial condition. Further, proxy contests and related actions by activist stockholders could cause significant fluctuations in our stock price based ontemporary or speculative market perceptions or other factors that do not necessarily reflect the underlying fundamentals and prospects of our business.
Provisions in our restated certificate of incorporation and amended and restated bylaws or Delaware law might discourage, delay or prevent a change ofcontrol of our company or changes in our management and, therefore, depress the trading price of our common stock.
Delaware corporate law and our restated certificate of incorporation and amended and restated bylaws contain provisions that could discourage, delay orprevent a change in control of our company or changes in our management that the stockholders of our company may deem advantageous. These provisions:
• require that special meetings of our stockholders be called only by our board of directors or certain of our officers, thus prohibiting our stockholders fromcalling special meetings;
• deny holders of our common stock cumulative voting rights in the election of directors, meaning that stockholders owning a majority of our outstandingcommon stock will be able to elect all of our directors;
• authorize the issuance of "blank check" preferred stock that our board could issue to dilute the voting and economic rights of our common stock and todiscourage a takeover attempt;
• provide the approval of our board of directors or a supermajority of stockholders is necessary to make, alter or repeal our amended and restated bylawsand that approval of a supermajority of stockholders is necessary to amend, alter or change certain provisions of our restated certificate of incorporation;
• establish advance notice requirements for stockholder nominations for election to our board or for proposing matters that can be acted upon bystockholders at stockholder meetings; and
• require that any action required or permitted to be taken by our stockholders must be effected at a duly called annual or special meeting of stockholdersand may not be effected by any consent in writing.
ITEM 1B. UNRESOLVED STAFF COMMENTSNone.
27

Table of Contents
ITEM 2. PROPERTIES
As of January 3, 2021, we owned or leased the following operating restaurant properties:
Owned Leased Total Restaurants:
Pollo Tropical — 138 138 Taco Cabana 2 141 143
Total operating restaurants 2 279 281
(1) Includes ten restaurants located in in-line or storefront locations.(2) Excludes restaurants operated by our Pollo Tropical and Taco Cabana franchisees.
As of January 3, 2021, we leased 100% of our Pollo Tropical restaurants and 99% of our Taco Cabana restaurants. We typically enter into leases (includingrenewal options) ranging from 35 to 45 years. The average remaining term for all leases for operating restaurant properties, including renewal options, wasapproximately 24 years as of January 3, 2021. Generally, we have been able to renew leases, upon or prior to their expiration, at the prevailing market rates,although there can be no assurance that this will continue to occur.
Most leases require us to pay utility and water charges and real estate taxes. Certain leases also require contingent rentals based upon a percentage of grosssales of the particular restaurant that exceed specified minimums. In some of our mall locations, we are also required to pay certain other charges such as a pro-ratashare of the mall's common area maintenance costs, insurance and security costs.
As of January 3, 2021, we had no restaurants under development, 29 closed properties subleased to third parties, 12 closed properties under contract for futuresublease or assignment to third parties, 17 closed properties available for sublease, and one owned and closed restaurant property which was available for sale orlease.
In addition to the restaurant locations, we lease approximately 21,000 square feet at 14800 Landmark Boulevard, Suite 500, Dallas, Texas which houses someof our executive offices and certain of our administrative functions. We also lease approximately 19,500 square feet at 7255 Corporate Center Drive, Miami,Florida, which house some of our executive offices and administrative operations for our Pollo Tropical restaurants. Additionally, we lease approximately 10,300square feet of office space at 1077 Central Parkway South, Suite 600, San Antonio, Texas, which houses most of our administrative operations for our TacoCabana restaurants. In addition, we lease an office facility located at 3220 Keller Springs Road, Suite 108, Carrollton, Texas, which is subleased to a third party.
ITEM 3. LEGAL PROCEEDINGS
We are a party to various litigation matters incidental to the conduct of business. We do not believe that the outcome of any of these matters will have amaterial adverse effect on our business, results of operations or financial condition.
ITEM 4. MINE SAFETY DISCLOSURES
None.
(1) (2)
28
Table of Contents
PART II
ITEM 5. MARKET FOR REGISTRANT'S COMMON EQUITY, RELATED STOCKHOLDER MATTERS AND ISSUER PURCHASES OF EQUITYSECURITIES
Our common stock trades on The NASDAQ Global Select Market under the symbol "FRGI". On February 26, 2021, shares of our common stock outstandingwere held by 410 holders of record. This excludes persons whose shares are held by a brokerage house or clearing agency.
Dividends
We did not pay any cash dividends during 2020 or 2019. We do not anticipate paying any cash dividends on our common stock in the foreseeable future. Wecurrently intend to retain the majority of available funds to fund the development and growth of our business or to use for other corporate related purposes such asthe repayment of borrowings under our new senior credit facility. In addition, we are a holding company and conduct all of our operations through our direct andindirect subsidiaries. As a result, for us to pay dividends, we need to rely on dividends and distributions to us from our subsidiaries. Our new senior credit facilitylimits—and debt instruments that we and our subsidiaries may enter into in the future may limit—our ability to pay dividends to our stockholders.
Stock Performance Graph
The following performance graph compares our cumulative total stockholder return on our common stock with the cumulative total returns of The NASDAQComposite Index and a peer group, The S&P Small Cap 600 Restaurant Index. We have elected to use the S&P Small Cap 600 Restaurant Index in compiling ourstock performance graph because we believe that index represents a comparison to competitors with similar market capitalization as us. The graph and table belowassume that $100 was invested on January 3, 2016, with dividends reinvested quarterly.
The trading price of our common stock on January 3, 2016, was $33.60 and the closing price of our common stock on December 31, 2020, the last trading daybefore our fiscal year end date of January 3, 2021, was $11.40.
29

Table of Contents
Total Cumulative Shareholder Returns 1/3/2016 1/1/2017 12/31/2017 12/30/2018 12/29/2019 1/3/2021
Fiesta Restaurant Group, Inc. $ 100.00 $ 88.84 $ 56.55 $ 45.36 $ 28.21 $ 33.93 NASDAQ Composite 100.00 108.87 141.13 137.12 187.44 271.64 S&P Small Cap 600 Restaurants 100.00 106.80 106.81 111.42 126.10 141.12
30
Table of Contents
ITEM 6. SELECTED FINANCIAL DATA
The following table sets forth our selected consolidated financial data derived from our audited consolidated financial statements for each of the years endedJanuary 3, 2021; December 29, 2019; December 30, 2018; December 31, 2017; and January 1, 2017. The information in the following table should be readtogether with our audited consolidated financial statements and accompanying notes as of January 3, 2021, and December 29, 2019, and for the years endedJanuary 3, 2021; December 29, 2019; and December 30, 2018, and "Management's Discussion and Analysis of Financial Condition and Results of Operations"included under Item 7 of this Annual Report on Form 10-K. These historical results are not necessarily indicative of the results to be expected in the future. Ourfiscal years ended December 29, 2019; December 30, 2018; December 31, 2017; and January 1, 2017, each contained 52 weeks. The fiscal year ended January 3,2021, contained 53 weeks.
31

Table of Contents
(Dollars in thousands, except share and per share data)
Year Ended
January 3, 2021December 29,
2019December 30,
2018December 31,
2017 January 1, 2017Statement of operations data:Revenues:
Restaurant sales $ 552,797 $ 658,263 $ 685,925 $ 666,584 $ 708,956 Franchise royalty revenues and fees 2,006 2,680 2,672 2,548 2,814
Total revenues 554,803 660,943 688,597 669,132 711,770 Costs and expenses:
Cost of sales 170,513 207,453 218,946 202,888 214,609 Restaurant wages and related expenses (including stock-basedcompensation expense of $200, $195, $90, $52, and $142, respectively) 149,145 179,178 188,131 184,742 185,305 Restaurant rent expense 45,361 47,805 36,034 36,936 37,493 Other restaurant operating expenses 82,180 91,897 100,828 98,927 96,457 Advertising expense 14,839 23,179 23,695 26,091 26,800 General and administrative (including stock-based compensationexpense of $3,284, $2,649, $3,379, $3,493, and $3,141, respectively) 53,077 56,195 54,525 59,633 54,826 Depreciation and amortization 38,206 39,195 37,604 34,957 36,776 Pre-opening costs 69 972 1,716 2,118 5,511 Impairment and other lease charges 9,139 13,101 21,144 61,760 25,644 Goodwill impairment — 67,909 — — — Closed restaurant rent expense, net of sublease income 6,487 4,163 — — — Other expense (income), net (1,697) 1,041 (3,007) 2,190 1,130
Total operating expenses 567,319 732,088 679,616 710,242 684,551 Income (loss) from operations (12,516) (71,145) 8,981 (41,110) 27,219 Interest expense 4,756 3,872 3,966 2,877 2,171 Loss on extinguishment of debt 1,241 — — — — Income (loss) before income taxes (18,513) (75,017) 5,015 (43,987) 25,048 Provision for (benefit from) income taxes (8,302) 9,369 (2,772) (7,755) 8,336 Net income (loss) $ (10,211) $ (84,386) $ 7,787 $ (36,232) $ 16,712 Per share data:Earnings (loss) per common share—basic $ (0.40) $ (3.18) $ 0.29 $ (1.35) $ 0.62 Earnings (loss) per common share—diluted (0.40) (3.18) 0.29 (1.35) 0.62 Weighted average shares outstanding:Weighted average common shares outstanding—basic 25,341,415 26,500,356 26,890,577 26,821,471 26,682,227 Weighted average common shares outstanding—diluted 25,341,415 26,500,356 26,894,083 26,821,471 26,689,179 Other financial data:Net cash provided by operating activities $ 40,272 $ 65,032 $ 53,803 $ 50,820 $ 80,679 Net cash used for investing activities 8,412 (39,431) (52,124) (55,492) (81,160)Net cash provided by (used in) financing activities (8,478) (17,446) (20) 4,075 (604)Total capital expenditures (18,369) (41,247) (57,850) (55,866) (82,365)
(1)
(1)
(2)
(3)
(4)
32
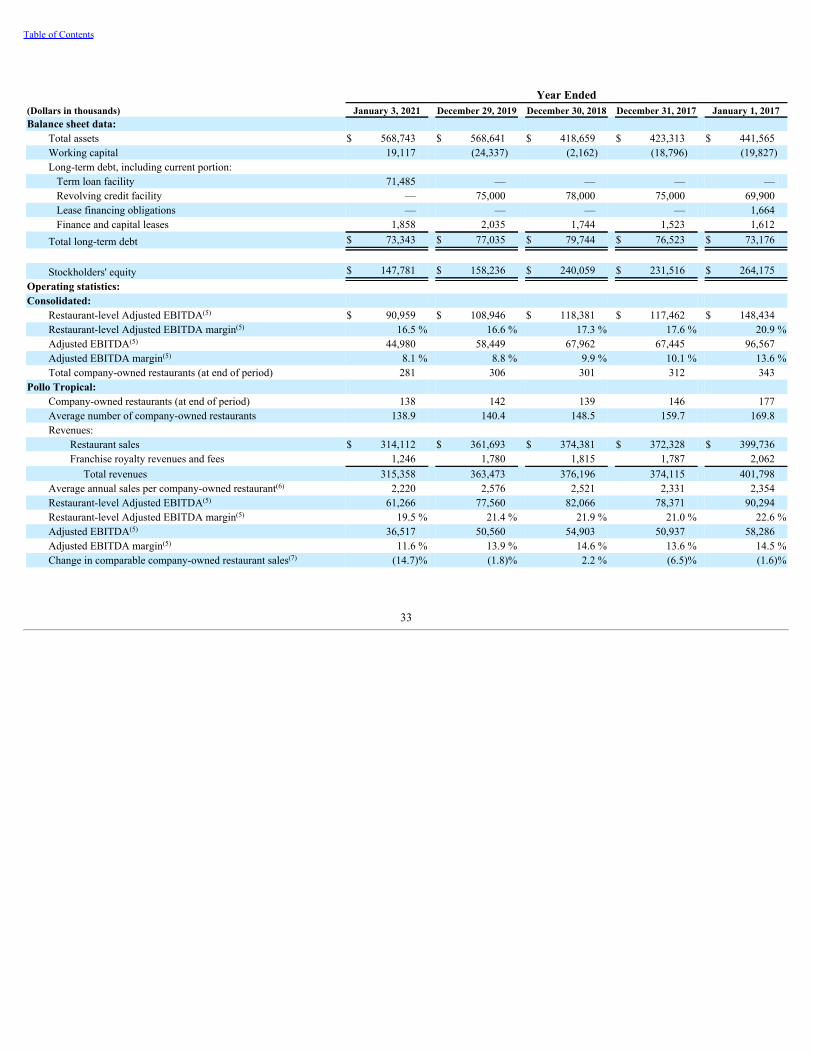
Table of Contents
Year Ended(Dollars in thousands) January 3, 2021 December 29, 2019 December 30, 2018 December 31, 2017 January 1, 2017Balance sheet data:
Total assets $ 568,743 $ 568,641 $ 418,659 $ 423,313 $ 441,565 Working capital 19,117 (24,337) (2,162) (18,796) (19,827)Long-term debt, including current portion:
Term loan facility 71,485 — — — — Revolving credit facility — 75,000 78,000 75,000 69,900 Lease financing obligations — — — — 1,664 Finance and capital leases 1,858 2,035 1,744 1,523 1,612
Total long-term debt $ 73,343 $ 77,035 $ 79,744 $ 76,523 $ 73,176
Stockholders' equity $ 147,781 $ 158,236 $ 240,059 $ 231,516 $ 264,175 Operating statistics:Consolidated:
Restaurant-level Adjusted EBITDA $ 90,959 $ 108,946 $ 118,381 $ 117,462 $ 148,434 Restaurant-level Adjusted EBITDA margin 16.5 % 16.6 % 17.3 % 17.6 % 20.9 %Adjusted EBITDA 44,980 58,449 67,962 67,445 96,567 Adjusted EBITDA margin 8.1 % 8.8 % 9.9 % 10.1 % 13.6 %Total company-owned restaurants (at end of period) 281 306 301 312 343
Pollo Tropical:Company-owned restaurants (at end of period) 138 142 139 146 177 Average number of company-owned restaurants 138.9 140.4 148.5 159.7 169.8 Revenues:
Restaurant sales $ 314,112 $ 361,693 $ 374,381 $ 372,328 $ 399,736 Franchise royalty revenues and fees 1,246 1,780 1,815 1,787 2,062
Total revenues 315,358 363,473 376,196 374,115 401,798 Average annual sales per company-owned restaurant 2,220 2,576 2,521 2,331 2,354 Restaurant-level Adjusted EBITDA 61,266 77,560 82,066 78,371 90,294 Restaurant-level Adjusted EBITDA margin 19.5 % 21.4 % 21.9 % 21.0 % 22.6 %Adjusted EBITDA 36,517 50,560 54,903 50,937 58,286 Adjusted EBITDA margin 11.6 % 13.9 % 14.6 % 13.6 % 14.5 %Change in comparable company-owned restaurant sales (14.7)% (1.8)% 2.2 % (6.5)% (1.6)%
(5)
(5)
(5)
(5)
(6)
(5)
(5)
(5)
(5)
(7)
33

Table of Contents
Year Ended(Dollars in thousands) January 3, 2021 December 29, 2019 December 30, 2018 December 31, 2017 January 1, 2017Taco Cabana:
Company-owned restaurants (at end of period) 143 164 162 166 166 Average number of company-owned restaurants 146.2 163.7 168.8 167.2 163.3 Revenues:
Restaurant sales $ 238,685 $ 296,570 $ 311,544 $ 294,256 $ 309,220 Franchise royalty revenues and fees 760 900 857 761 752
Total revenues 239,445 297,470 312,401 295,017 309,972 Average annual sales per company-owned restaurant 1,605 1,812 1,846 1,760 1,894 Restaurant-level Adjusted EBITDA 29,693 31,386 36,315 39,091 58,140 Restaurant-level Adjusted EBITDA margin 12.4 % 10.6 % 11.7 % 13.3 % 18.8 %Adjusted EBITDA 8,463 7,889 13,059 16,508 38,281 Adjusted EBITDA margin 3.5 % 2.7 % 4.2 % 5.6 % 12.3 %Change in comparable company-owned restaurant sales (14.4)% (4.1)% 4.5 % (7.3)% (2.5)%
(1) Due to the adoption of ASC 842, real estate taxes and fixed common area maintenance expenses for leased properties are included in restaurant rent expensefor the years ended January 3, 2021, and December 29, 2019, and in other restaurant operating expenses for the year ended December 30, 2018, and prioryears.
(2) Impairment and other lease charges for the year ended January 3, 2021, primarily include impairment charges for three underperforming Pollo Tropicalrestaurants, two of which were closed in the third quarter of 2020, as well as two underperforming Taco Cabana restaurants, for which continued sales declinescoupled with the impact of expected sales declines resulted in a decrease in the estimated future cash flows. Additionally, impairment charges consisted of thewrite-down of saucing islands and self-service soda machines that were removed from dining rooms as a result of COVID-19 and the write-down of assetsheld for sale to their fair value less costs to sell. Other lease charges for the year ended January 3, 2021, were primarily related to lease terminations forrestaurant locations that we decided not to develop, net of a gain from lease terminations. Impairment and other lease charges for the year ended December 29,2019, primarily include impairment charges for 19 Taco Cabana restaurants that were subsequently closed in January 2020, five of which were initiallyimpaired in prior years, as well as previously closed Pollo Tropical restaurants and other underperforming Taco Cabana restaurants that we continue tooperate. Net lease charge recoveries for the year ended December 29, 2019, were primarily related to lease terminations for previously closed restaurants.Impairment charges for the year ended December 30, 2018, primarily include impairment charges for 14 Pollo Tropical restaurants that were closed in 2018,two of which were initially impaired in 2017, nine Taco Cabana locations that were closed in 2018, one of which was initially impaired in 2017, and one PolloTropical and six Taco Cabana locations that we continued to operate. Other lease charges, net of recoveries, for the year ended December 30, 2018, wereprimarily related to restaurants that closed in 2018 and net recoveries related to restaurants and an office location that closed in prior years. Impairmentcharges for the year ended December 31, 2017, primarily include impairment charges for 40 Pollo Tropical restaurants that were closed in 2017, seven ofwhich were initially impaired in 2016, six Taco Cabana restaurants that were closed in 2017, four of which were initially impaired in 2016, two Pollo Tropicalrestaurants and five Taco Cabana restaurants which we continued to operate and an office location that was closed in December 2017. Other lease charges, netof recoveries, for the year ended December 31, 2017, were related primarily to restaurants and an office location that were closed in 2017 as well as previouslyclosed restaurants. Impairment and other lease charges for the year ended January 1, 2017, primarily include impairment charges for 17 Pollo Tropicalrestaurants that were closed in 2016 and 2017, and seven Taco Cabana restaurants, four of which were subsequently closed in 2017 and three of which wecontinued to operate. Other lease charges, net of recoveries, for the year ended January 1, 2017, were related to restaurants closed in 2016 as well aspreviously closed restaurants.
(3) Closed restaurant rent expense, net of sublease income for the year ended January 3, 2021, primarily includes closed restaurant lease costs of $11.8 millionpartially offset by sublease income of $(5.3) million. Closed restaurant rent expense, net of sublease income for the year ended December 29, 2019, primarilyincludes closed restaurant lease costs of $8.2 million partially offset by sublease income of $(4.0) million. As a result of adopting ASC 842, lease costs relatedto closed restaurants are recorded as closed restaurant rent for the years ended January 3, 2021, and December 29, 2019. These costs were previously recordedas lease charges within impairment and other lease charges when a restaurant closed.
(4) Other expense (income), net for the year ended January 3, 2021, primarily includes total gains of $(3.8) million on the sale-leaseback of seven restaurantproperties and the sale of six restaurant properties, partially offset by costs for the removal, transfer and storage of equipment from closed restaurants of $1.5million and the write-off of site development costs
(6)
(5)
(5)
(5)
(5)
(7)
34

Table of Contents
of $0.7 million. Other expense (income), net for the year ended December 29, 2019, primarily includes costs for the removal, transfer and storage ofequipment from closed restaurants of $0.8 million and the write-off of site development costs of $0.1 million. Other expense (income), net for the year endedDecember 30, 2018, primarily includes $(3.5) million in insurance recoveries related to the Hurricanes and total gains of $(1.2) million on the sale of threerestaurant properties, partially offset by the write-off of site development costs of $0.6 million and severance related to the closure of restaurants and costs forthe removal, transfer and storage of equipment from closed restaurants of $1.1 million. Other expense (income), net for the year ended December 31, 2017,primarily includes $2.1 million in costs for the removal of signs and equipment and equipment transfers and storage related to the closure of restaurants andseverance for closed restaurant employees, and $0.5 million in food donated to charitable organizations, partially offset by $(0.4) million in additionalproceeds received related to two Taco Cabana locations as a result of eminent domain proceedings, $(0.3) million in expected insurance proceeds related to aTaco Cabana restaurant that was temporarily closed due to a fire, and $(0.2) million in estimated insurance recoveries related to a restaurant closed due toHurricane Harvey damage. Other expense (income), net for the year ended January 1, 2017, includes costs for the removal of signs and equipment related tothe closure of 10 Pollo Tropical restaurants in the fourth quarter of 2016 partially offset by additional proceeds related to a location that closed in 2015 as aresult of an eminent domain proceeding.
(5) Consolidated Adjusted EBITDA and margin and Restaurant-level Adjusted EBITDA and margin, are non-GAAP financial measures. Prior to the secondquarter of 2017, Adjusted EBITDA and Consolidated Adjusted EBITDA were defined as earnings before interest expense, income taxes, depreciation andamortization, impairment and other lease charges, stock-based compensation expense, and other expense (income), net. In 2017, our board of directorsappointed a new Chief Executive Officer who initiated the Strategic Renewal Plan and uses an Adjusted EBITDA measure for the purpose of assessingperformance and allocating resources to segments. The Adjusted EBITDA measure used by the chief operating decision maker includes adjustments forsignificant items that management believes are related to strategic changes and/or are not related to the ongoing operation of our restaurants. Beginning in thesecond quarter of 2017, the primary measure of segment profit or loss used by the chief operating decision maker to assess performance and allocate resourcesis Adjusted EBITDA, which is now defined as earnings attributable to the applicable operating segments before interest expense, income taxes, depreciationand amortization, impairment and other lease charges, goodwill impairment, closed restaurant rent expense, net of sublease income, stock-based compensationexpense, other expense (income), net, and certain significant items for each segment that are related to strategic changes and/or are not related to the ongoingoperation of our restaurants as set forth in the reconciliation table below. Adjusted EBITDA for each of our segments includes an allocation of general andadministrative expenses associated with administrative support for executive management, information systems and certain finance, legal, supply chain,human resources, construction and other administrative functions. Consolidated Adjusted EBITDA margin and Adjusted EBITDA margin are derived bydividing Consolidated Adjusted EBITDA and Adjusted EBITDA by total revenues and segment revenues, respectively.
Restaurant-level Adjusted EBITDA is defined as Adjusted EBITDA for the applicable segment excluding franchise royalty revenue and fees, pre-openingcosts, and general and administrative expense (including corporate-level general and administrative expenses). Restaurant-level Adjusted EBITDA margin isderived by dividing Restaurant-level Adjusted EBITDA by restaurant sales.
Management believes that such non-GAAP financial measures, when viewed with our results of operations calculated in accordance with GAAP and ourreconciliation of net income (loss) to Consolidated Adjusted EBITDA and Restaurant-level Adjusted EBITDA (i) provide useful information about ouroperating performance and period-over-period changes, (ii) provide additional information that is useful for evaluating the operating performance of ourbusiness, and (iii) permit investors to gain an understanding of the factors and trends affecting our ongoing earnings, from which capital investments are madeand debt is serviced. However, such measures are not measures of financial performance or liquidity under GAAP and, accordingly, should not be consideredas alternatives to net income or cash flow from operating activities as indicators of operating performance or liquidity. Also, these measures may not becomparable to similarly titled captions of other companies.
35

Table of Contents
A reconciliation from consolidated net income (loss) to Consolidated Adjusted EBITDA and Restaurant-level Adjusted EBITDA is presented below:
Year Ended
(Dollars in thousands) January 3, 2021December 29,
2019December 30,
2018December 31,
2017 January 1, 2017Net income (loss) $ (10,211) $ (84,386) $ 7,787 $ (36,232) $ 16,712 Provision for (benefit from) income taxes (8,302) 9,369 (2,772) (7,755) 8,336 Income (loss) before taxes (18,513) (75,017) 5,015 (43,987) 25,048 Add:
Non-general and administrative expense adjustments:Depreciation and amortization 38,206 39,195 37,604 34,957 36,776 Impairment and other lease charges 9,139 13,101 21,144 61,760 25,644 Goodwill impairment — 67,909 — — — Interest expense 4,756 3,872 3,966 2,877 2,171 Closed restaurant rent expense, net of sublease income 6,487 4,163 — — — Loss on extinguishment of debt 1,241 — — — — Other expense (income), net (1,697) 1,041 (3,007) 2,190 1,130 Stock-based compensation expense in restaurant wages 200 195 90 52 142 Unused pre-production costs in advertising expense — — — 410 — Total non-general and administrative expense adjustments 58,332 129,476 59,797 102,246 65,863
General and administrative expense adjustments:Stock-based compensation expense 3,284 2,649 3,379 3,493 3,141 Terminated capital project — — — 849 — Board and shareholder matter costs — — (597) 3,049 1,580 Restructuring costs and retention bonuses 1,107 964 545 2,420 86 Office restructuring and relocation costs — — — (152) 539 Legal settlements and related costs — — (177) (473) 310 Digital and brand repositioning costs 770 377 — — — Total general and administrative expense adjustments 5,161 3,990 3,150 9,186 5,656
Consolidated Adjusted EBITDA 44,980 58,449 67,962 67,445 96,567 Add:
Pre-opening costs 69 972 1,716 2,118 5,511 General and administrative 47,916 52,205 51,375 50,447 49,170
Less:Franchise royalty revenue and fees 2,006 2,680 2,672 2,548 2,814
Restaurant-level Adjusted EBITDA:Pollo Tropical $ 61,266 $ 77,560 $ 82,066 $ 78,371 $ 90,294 Taco Cabana 29,693 31,386 36,315 39,091 58,140 Consolidated 90,959 108,946 118,381 117,462 148,434
(a) Unused pre-production costs for the year ended December 31, 2017, include costs for advertising pre-production that will not be used.(b) Terminated capital project costs for the year ended December 31, 2017, include costs related to the write-off of a capital project that was terminated in the first quarter of 2017.(c) Board and shareholder matter costs for the twelve months ended December 30, 2018, include fee reductions and final insurance recoveries related to 2017 shareholder activism costs.
Board and shareholder matter costs for the year ended December 31, 2017, include fees related to shareholder activism and CEO and board member searches. Board and shareholdermatter costs for the year ended January 1, 2017, primarily include fees related to the previously proposed and terminated separation transaction, and costs related to shareholderactivism.
(d) Restructuring costs and retention bonuses for the year ended January 3, 2021, include severance costs related to terminations in response to the COVID-19 pandemic. Restructuringcosts and retention bonuses for the years ended December 29, 2019, and January 1, 2017, include severance related to eliminated positions. Restructuring costs and retention bonusesfor the years ended December 30, 2018, and December 31, 2017, include severance related to the Strategic Renewal Plan and reduction in force and bonuses paid to certain employeesfor retention purposes.
(e) Office restructuring and relocation costs for the years ended December 31, 2017, and January 1, 2017, include severance and relocation adjustments and costs associated with theprior-year restructuring of Pollo Tropical brand and corporate offices.
(f) Legal settlements and related costs for the year ended December 30, 2018, include reductions to final settlement amounts related to litigation matters. Legal settlements and relatedcosts for the years ended December 31, 2017, and January 1, 2017, include benefits or costs related to litigation matters.
(g) Digital and brand repositioning costs for the years ended January 3, 2021, and December 29, 2019, include consulting costs related to repositioning the digital experience for ourcustomers.
(h) Excludes general and administrative adjustments included in Adjusted EBITDA.
(a)
(b)
(c)
(d)
(e)
(f)
(g)
(h)
36

Table of Contents
(6) Average annual sales per company-owned restaurant are derived by dividing restaurant sales for the applicable segment by the average number of company-owned and operated restaurants. For comparative purposes, the calculation of average annual sales per company-owned restaurant is based on a 52-week fiscalyear. Restaurant sales data for the extra week in the fiscal year ended January 3, 2021, have been excluded for purposes of calculating average annual sales percompany-owned restaurant.
(7) Restaurants are included in comparable restaurant sales after they have been open for 18 months. Restaurants are excluded from comparable restaurant salesfor any fiscal month in which the restaurant was closed for more than five days. Comparable restaurant sales are compared to the same period in the prior year.For comparative purposes, the calculation of the changes in comparable restaurant sales is based on a 52-week fiscal year. Restaurant sales for the extra weekin the fiscal year ended January 3, 2021, have been excluded for purposes of calculating the change in comparable company-owned restaurant sales.
37
Table of Contents
ITEM 7. MANAGEMENT'S DISCUSSION AND ANALYSIS OF FINANCIAL CONDITION AND RESULTS OF OPERATIONS
The following Management's Discussion and Analysis of financial condition and results of operations ("MD&A") is written to help the reader understand ourcompany. The MD&A is provided as a supplement to, and should be read in conjunction with, our audited consolidated financial statements and the accompanyingnotes. Any reference to restaurants refers to company-owned restaurants unless otherwise indicated.
We use a 52- or 53-week fiscal year ending on the Sunday closest to December 31. The fiscal years ended December 29, 2019; December 30, 2018;December 31, 2017; and January 1, 2017, each contained 52 weeks. The fiscal year ended January 3, 2021 contained 53 weeks. The next fiscal year to contain 53weeks will be the fiscal year ending January 3, 2027.
Company Overview
We own, operate and franchise two restaurant brands, Pollo Tropical and Taco Cabana , which have over 30 and 40 years, respectively, of operating historyand loyal customer bases. Our Pollo Tropical restaurants feature fire-grilled and crispy citrus marinated chicken and other freshly prepared menu items, while ourTaco Cabana restaurants specialize in Mexican-inspired food with most items made fresh. We believe that both brands offer distinct and unique flavors with broadappeal at a compelling value, which differentiates them in the competitive fast-casual and quick-service restaurant segments. Nearly all of our restaurants offer theconvenience of drive-thru windows. As of January 3, 2021, our restaurants included 138 Pollo Tropical restaurants in Florida and 143 Taco Cabana restaurants inTexas for a total of 281 restaurants.
We franchise our Pollo Tropical restaurants primarily in international markets, and as of January 3, 2021, we had 23 franchised Pollo Tropical restaurantslocated in Puerto Rico, Panama, Guyana, Ecuador, and the Bahamas, and five on college campuses and one at a hospital in Florida. We have agreements for thecontinued development of franchised Pollo Tropical restaurants in certain of our existing franchised markets.
As of January 3, 2021, we had six franchised Taco Cabana restaurants located in New Mexico.
Events Affecting Our Results of Operations
COVID-19 Pandemic
The novel coronavirus (COVID-19) pandemic has affected and is continuing to affect the restaurant industry and the economy. In response to COVID-19 andin compliance with governmental restrictions, we closed the dining room seating areas in all Pollo Tropical and Taco Cabana restaurants, limiting service to take-out, drive-thru, and delivery operations beginning in mid-March 2020. We also temporarily closed three Pollo Tropical locations due to the impact of therestrictions on sales, one of which was reopened during the second quarter of 2020 and two of which were subsequently permanently closed in August 2020. Webegan opening certain dining rooms at 50% capacity with the easing of municipality restrictions during the second quarter of 2020; however, we temporarily closedall dining rooms on July 12, 2020, in response to increased COVID-19 infection rates in both Texas and Florida. We began re-opening certain dining rooms andpatios with limited capacity and hours at both brands and the state of Florida removed restaurant capacity restrictions at the end of September 2020. We openedapproximately 25 dining rooms with limited hours and capacity at both brands and opened approximately 75 patios at Taco Cabana in the fourth quarter of 2020.We are evaluating opening additional dining rooms with limited hours at Pollo Tropical and Taco Cabana. Comparable restaurant sales at both Pollo Tropical andTaco Cabana restaurants declined in 2020 compared to the prior year as a result of the pandemic. However, both brands experienced sequential comparablerestaurant sales improvement in the third and fourth quarters of 2020 compared to the second quarter of 2020.
As we continue to prioritize the well-being of our team members and guests during this pandemic, we believe we are also creating a better business model thatis easier and safer for our consumers. We currently do not expect sales trends to significantly deteriorate further, although there can be no assurance that salestrends will not deteriorate further, and we have implemented measures to control costs. We have also implemented a number of changes to maximize sales,maintain service, and improve liquidity:
• We have adjusted our operating model to better meet our customers' needs during the COVID-19 crisis. We have also adjusted staffing models to matchshifting traffic and channel patterns of our guests and to improve efficiency.
• We are maximizing off-premise sales opportunities. We significantly increased the number of delivery service providers that offer our brands during thefirst quarter of 2020, modified our menus, and worked with a third party to
® ®
38

Table of Contents
enhance our online ordering and mobile apps including curbside pickup features. We launched curbside pickup for both brands in July 2020.
• We reduced our 2020 capital expenditures to $18.4 million as compared to $41.2 million in 2019.
• We terminated or furloughed and subsequently terminated approximately 55 support personnel positions representing annualized general andadministrative savings of approximately $4.1 million. Additionally, the salaries for all vice-presidents and executives were reduced by 10% to 35% for thesecond quarter of 2020.
• We sold six restaurant properties and completed seven sale-leaseback transactions in 2020. We have completed one sale-leaseback transaction in the firstquarter of 2021 through March 4, 2021, and currently have offers or contracts in place for the sale or sale-leaseback of our two remaining ownedproperties, although there can be no assurance that any such sale will be consummated. Net proceeds from the transactions that occurred prior toNovember 23, 2020, were used to reduce the outstanding revolving credit borrowings and availability under our former amended senior credit facility (asdefined below).
• We repaid and terminated our former amended senior credit facility and entered into a new senior credit facility with a five-year maturity and a minimumliquidity covenant (as defined in the new senior credit facility) until January 3, 2022, which we believe provides us with more flexibility.
We incurred additional costs related to the COVID-19 pandemic totaling an estimated $4.3 million during the year ended January 3, 2021, including additionallabor costs such as COVID-19 special incentive pay, quarantine pay and overtime to cover for employees in quarantine, as well as COVID-19 testing costs andadditional operating expenses for safety related supplies including masks, cleaning supplies and sanitizer. Although we discontinued COVID-19 special incentivepay after the second quarter of 2020, we expect many of the other COVID-19 related costs to continue during the pandemic.
Restaurant Closures
As a result of restaurant portfolio reviews, we closed 19 underperforming Taco Cabana restaurants in January 2020, all of which were impaired in prior years.Additionally, we closed one Pollo Tropical restaurant as a result of landlord redevelopment that was not compatible with our use in the first quarter of 2020, twounderperforming Pollo Tropical restaurants in the third quarter of 2020, and one Taco Cabana restaurant at the end of its lease term in the fourth quarter of 2020. Inaddition, we closed and sold one owned Pollo Tropical restaurant and two owned Taco Cabana restaurants in the third and fourth quarters of 2020 to generateadditional cash to reduce our outstanding borrowings under our former amended senior credit facility.
New Senior Credit Facility
On November 23,2020, we entered into a new senior secured credit agreement (the "new senior credit facility") that provides for a term loan of $75.0 millionand a revolving credit facility of $10.0 million. The new senior credit facility matures on November 23, 2025. We borrowed $75.0 million in term loan borrowingssubject to a 2.0% original issue discount on November 23, 2020, and the revolving credit facility is undrawn as of January 3, 2021. Revolving credit borrowingsunder our former amended senior credit facility were fully repaid using proceeds from the term loan borrowings. See Note 8 to our consolidated financialstatements and Senior Credit Facility under Liquidity and Capital Resources in this MD&A for a further discussion.
39
Table of Contents
Executive Summary—Consolidated Operating Performance for the Year Ended January 3, 2021
Our fiscal year 2020 results include the following:
• We recognized a net loss of $(10.2) million in 2020, or $(0.40) per diluted share, compared to a net loss of $(84.4) million, or $(3.18) per diluted share in2019, due in part to a $67.9 million goodwill impairment charge for the Taco Cabana reporting unit and a $13.5 million charge to establish a valuationallowance on our deferred income tax assets in 2019, as well as an income tax benefit in 2020 related to adjusting our deferred tax asset valuationallowance and reclassifying certain assets as qualified improvement property and other changes to depreciation methods for certain assets in conjunctionwith filing our 2019 federal income tax return in 2020. Lower advertising and repair and maintenance expense in 2020 and the extra week in our 2020fiscal year contributed to the reduction in net loss in 2020, partially offset by the impact of declines in comparable restaurant sales at both brands in 2020,higher delivery fees in 2020, and additional costs related to the COVID-19 pandemic. In addition, gains from the sale-leaseback and sale of property,lower general and administrative expenses and other impairment charges, as well as favorable operating and labor efficiencies at both brands in 2020,positively contributed to the reduction of the net loss in 2020.
• Total revenues decreased 16.1% in 2020 to $554.8 million from $660.9 million in 2019, driven primarily by a decrease in comparable restaurant sales atboth brands (including as a result of the impact of COVID-19), and the impact of closing 19 underperforming Taco Cabana restaurants in the first quarterof 2020, partially offset by the extra week in our 2020 fiscal year. Comparable restaurant sales decreased 14.7% for our Pollo Tropical restaurantsresulting from a decrease in comparable restaurant transactions of 22.1% and an increase in the net impact of product/channel mix and pricing of 7.4%.Comparable restaurant sales decreased 14.4% for our Taco Cabana restaurants resulting from a decrease in comparable restaurant transactions of 22.1%and an increase in the net impact of product/channel mix and pricing of 7.7%.
• Consolidated Adjusted EBITDA decreased $13.5 million for the twelve months ended January 3, 2021, to $45.0 million compared to $58.4 million for thetwelve months ended December 29, 2019, driven primarily by the impact of lower restaurant sales and higher delivery fee expense and additional costsrelated to the COVID-19 pandemic in 2020, partially offset by lower advertising and general and administrative expenses, favorable operating and laborefficiencies, the impact of the closure of unprofitable restaurants in the first quarter of 2020, and the additional week in 2020. Consolidated AdjustedEBITDA is a non-GAAP financial measure of performance. For a discussion of our use of Consolidated Adjusted EBITDA and a reconciliation from netincome (loss) to Consolidated Adjusted EBITDA, see "Management's Use of Non-GAAP Financial Measures."
• The COVID-19 pandemic had the largest impact on our first and second quarters. Comparable restaurant sales improved sequentially in the third andfourth quarters. In addition, we made changes that resulted in improved Restaurant-level Adjusted EBITDA margins in the third and fourth quarters of2020 compared to the same periods in the prior year. Restaurant-level Adjusted EBITDA is a non-GAAP financial measure. For a discussion of our use ofRestaurant-level Adjusted EBITDA and a reconciliation from net income (loss) to Restaurant-level Adjusted EBITDA, see "Management's Use of Non-GAAP Financial Measures."
40
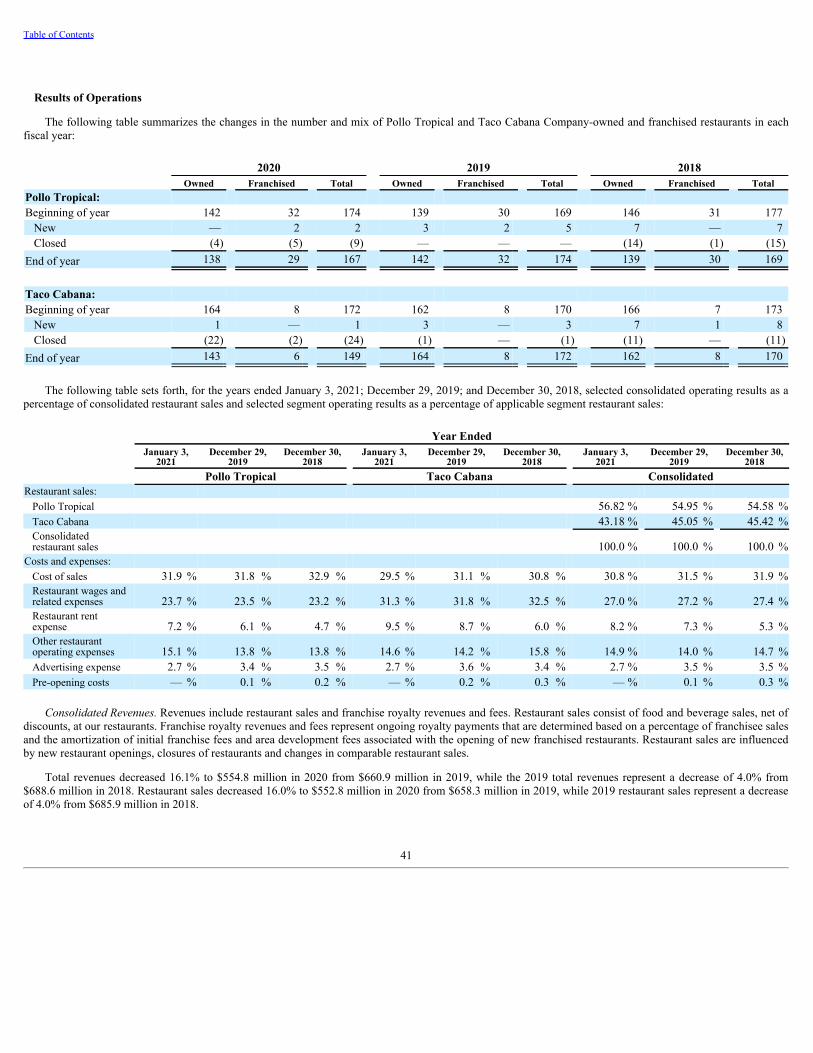
Table of Contents
Results of Operations
The following table summarizes the changes in the number and mix of Pollo Tropical and Taco Cabana Company-owned and franchised restaurants in eachfiscal year:
2020 2019 2018Owned Franchised Total Owned Franchised Total Owned Franchised Total
Pollo Tropical:Beginning of year 142 32 174 139 30 169 146 31 177 New — 2 2 3 2 5 7 — 7 Closed (4) (5) (9) — — — (14) (1) (15)End of year 138 29 167 142 32 174 139 30 169
Taco Cabana:Beginning of year 164 8 172 162 8 170 166 7 173 New 1 — 1 3 — 3 7 1 8 Closed (22) (2) (24) (1) — (1) (11) — (11)End of year 143 6 149 164 8 172 162 8 170
The following table sets forth, for the years ended January 3, 2021; December 29, 2019; and December 30, 2018, selected consolidated operating results as apercentage of consolidated restaurant sales and selected segment operating results as a percentage of applicable segment restaurant sales:
Year EndedJanuary 3,
2021December 29,
2019December 30,
2018January 3,
2021December 29,
2019December 30,
2018January 3,
2021December 29,
2019December 30,
2018Pollo Tropical Taco Cabana Consolidated
Restaurant sales:Pollo Tropical 56.82 % 54.95 % 54.58 %Taco Cabana 43.18 % 45.05 % 45.42 %Consolidatedrestaurant sales 100.0 % 100.0 % 100.0 %
Costs and expenses:Cost of sales 31.9 % 31.8 % 32.9 % 29.5 % 31.1 % 30.8 % 30.8 % 31.5 % 31.9 %Restaurant wages andrelated expenses 23.7 % 23.5 % 23.2 % 31.3 % 31.8 % 32.5 % 27.0 % 27.2 % 27.4 %Restaurant rentexpense 7.2 % 6.1 % 4.7 % 9.5 % 8.7 % 6.0 % 8.2 % 7.3 % 5.3 %Other restaurantoperating expenses 15.1 % 13.8 % 13.8 % 14.6 % 14.2 % 15.8 % 14.9 % 14.0 % 14.7 %Advertising expense 2.7 % 3.4 % 3.5 % 2.7 % 3.6 % 3.4 % 2.7 % 3.5 % 3.5 %Pre-opening costs — % 0.1 % 0.2 % — % 0.2 % 0.3 % — % 0.1 % 0.3 %
Consolidated Revenues. Revenues include restaurant sales and franchise royalty revenues and fees. Restaurant sales consist of food and beverage sales, net ofdiscounts, at our restaurants. Franchise royalty revenues and fees represent ongoing royalty payments that are determined based on a percentage of franchisee salesand the amortization of initial franchise fees and area development fees associated with the opening of new franchised restaurants. Restaurant sales are influencedby new restaurant openings, closures of restaurants and changes in comparable restaurant sales.
Total revenues decreased 16.1% to $554.8 million in 2020 from $660.9 million in 2019, while the 2019 total revenues represent a decrease of 4.0% from$688.6 million in 2018. Restaurant sales decreased 16.0% to $552.8 million in 2020 from $658.3 million in 2019, while 2019 restaurant sales represent a decreaseof 4.0% from $685.9 million in 2018.
41
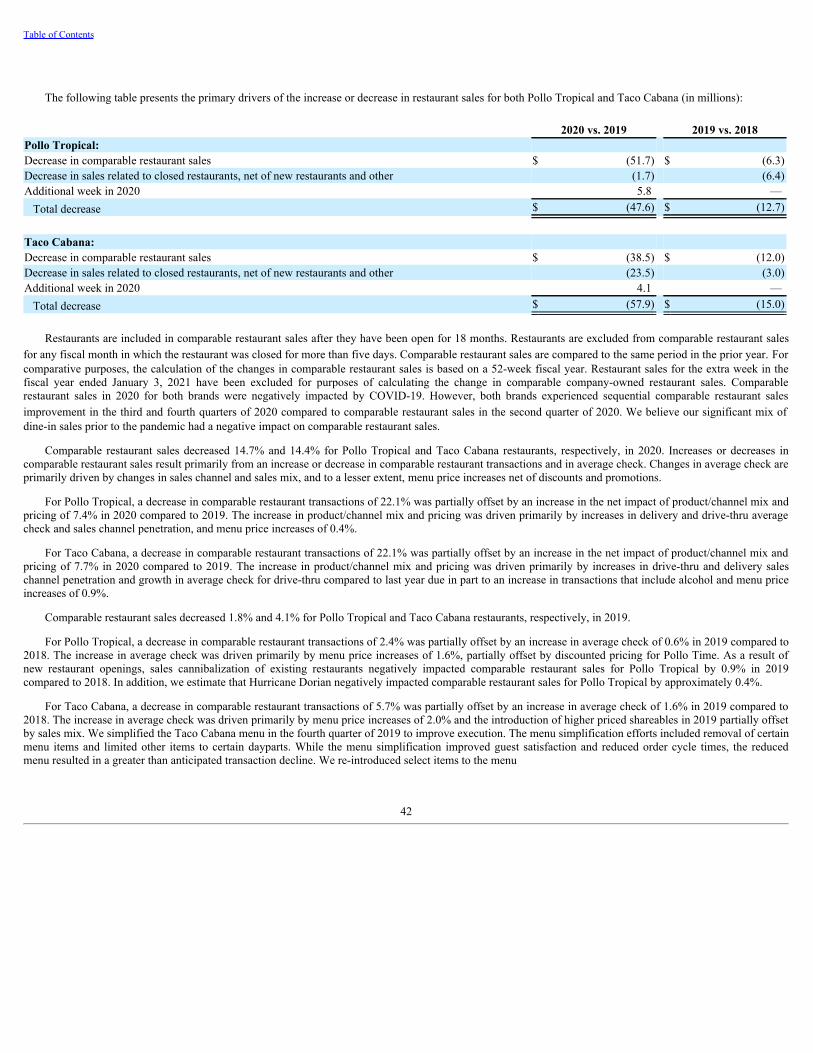
Table of Contents
The following table presents the primary drivers of the increase or decrease in restaurant sales for both Pollo Tropical and Taco Cabana (in millions):
2020 vs. 2019 2019 vs. 2018Pollo Tropical:Decrease in comparable restaurant sales $ (51.7) $ (6.3)Decrease in sales related to closed restaurants, net of new restaurants and other (1.7) (6.4)Additional week in 2020 5.8 — Total decrease $ (47.6) $ (12.7)
Taco Cabana:Decrease in comparable restaurant sales $ (38.5) $ (12.0)Decrease in sales related to closed restaurants, net of new restaurants and other (23.5) (3.0)Additional week in 2020 4.1 — Total decrease $ (57.9) $ (15.0)
Restaurants are included in comparable restaurant sales after they have been open for 18 months. Restaurants are excluded from comparable restaurant salesfor any fiscal month in which the restaurant was closed for more than five days. Comparable restaurant sales are compared to the same period in the prior year. Forcomparative purposes, the calculation of the changes in comparable restaurant sales is based on a 52-week fiscal year. Restaurant sales for the extra week in thefiscal year ended January 3, 2021 have been excluded for purposes of calculating the change in comparable company-owned restaurant sales. Comparablerestaurant sales in 2020 for both brands were negatively impacted by COVID-19. However, both brands experienced sequential comparable restaurant salesimprovement in the third and fourth quarters of 2020 compared to comparable restaurant sales in the second quarter of 2020. We believe our significant mix ofdine-in sales prior to the pandemic had a negative impact on comparable restaurant sales.
Comparable restaurant sales decreased 14.7% and 14.4% for Pollo Tropical and Taco Cabana restaurants, respectively, in 2020. Increases or decreases incomparable restaurant sales result primarily from an increase or decrease in comparable restaurant transactions and in average check. Changes in average check areprimarily driven by changes in sales channel and sales mix, and to a lesser extent, menu price increases net of discounts and promotions.
For Pollo Tropical, a decrease in comparable restaurant transactions of 22.1% was partially offset by an increase in the net impact of product/channel mix andpricing of 7.4% in 2020 compared to 2019. The increase in product/channel mix and pricing was driven primarily by increases in delivery and drive-thru averagecheck and sales channel penetration, and menu price increases of 0.4%.
For Taco Cabana, a decrease in comparable restaurant transactions of 22.1% was partially offset by an increase in the net impact of product/channel mix andpricing of 7.7% in 2020 compared to 2019. The increase in product/channel mix and pricing was driven primarily by increases in drive-thru and delivery saleschannel penetration and growth in average check for drive-thru compared to last year due in part to an increase in transactions that include alcohol and menu priceincreases of 0.9%.
Comparable restaurant sales decreased 1.8% and 4.1% for Pollo Tropical and Taco Cabana restaurants, respectively, in 2019.
For Pollo Tropical, a decrease in comparable restaurant transactions of 2.4% was partially offset by an increase in average check of 0.6% in 2019 compared to2018. The increase in average check was driven primarily by menu price increases of 1.6%, partially offset by discounted pricing for Pollo Time. As a result ofnew restaurant openings, sales cannibalization of existing restaurants negatively impacted comparable restaurant sales for Pollo Tropical by 0.9% in 2019compared to 2018. In addition, we estimate that Hurricane Dorian negatively impacted comparable restaurant sales for Pollo Tropical by approximately 0.4%.
For Taco Cabana, a decrease in comparable restaurant transactions of 5.7% was partially offset by an increase in average check of 1.6% in 2019 compared to2018. The increase in average check was driven primarily by menu price increases of 2.0% and the introduction of higher priced shareables in 2019 partially offsetby sales mix. We simplified the Taco Cabana menu in the fourth quarter of 2019 to improve execution. The menu simplification efforts included removal of certainmenu items and limited other items to certain dayparts. While the menu simplification improved guest satisfaction and reduced order cycle times, the reducedmenu resulted in a greater than anticipated transaction decline. We re-introduced select items to the menu
42
Table of Contents
and expanded dayparts in the first quarter of 2020 to increase sales while maintaining the operational improvements provided by the menu simplification.
Franchise revenues decreased $0.7 million to $2.0 million in 2020 compared to 2019 due to lower sales at franchised restaurants as a result of COVID-19.Franchise revenues remained flat in 2019 compared to 2018.
Operating costs and expenses. Operating costs and expenses include cost of sales, restaurant wages and related expenses, other restaurant expenses andadvertising expenses. Cost of sales consists of food, paper and beverage costs including packaging costs, less rebates and purchase discounts. Cost of sales isgenerally influenced by changes in commodity costs, the sales mix of items sold and the effectiveness of our restaurant-level controls to manage food and papercosts. Key commodities, including chicken and beef, are generally purchased under contracts for future periods of up to one year.
Restaurant wages and related expenses include all restaurant management and hourly productive labor costs, employer payroll taxes, restaurant-level bonusesand related benefits. Payroll and related taxes and benefits are subject to inflation, including minimum wage increases and changes in costs for health insurance,workers' compensation insurance and state unemployment insurance.
Other restaurant operating expenses include all other restaurant-level operating costs, the major components of which are utilities, repairs and maintenance,general liability insurance, sanitation, supplies and credit card and delivery fees. In addition, for periods prior to fiscal 2019, other restaurant operating expensesinclude real estate taxes related to our leases characterized as operating leases.
Advertising expense includes all promotional expenses including television, radio, billboards and other sponsorships and promotional activities and agencyfees.
Pre-opening costs include costs incurred prior to opening a restaurant, including restaurant employee wages and related expenses, travel expenditures,recruiting, training, promotional costs associated with the restaurant opening and rent, including any non-cash rent expense recognized during the constructionperiod. Pre-opening costs are generally incurred beginning four to six months prior to a restaurant opening.
43
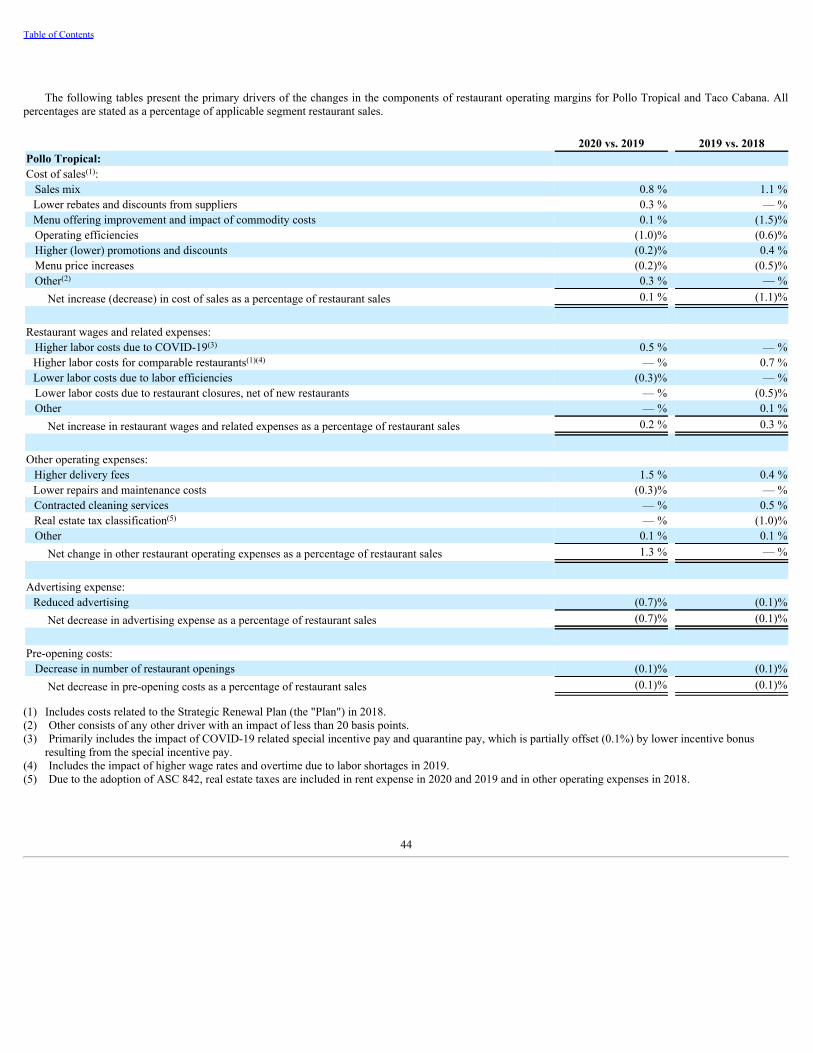
Table of Contents
The following tables present the primary drivers of the changes in the components of restaurant operating margins for Pollo Tropical and Taco Cabana. Allpercentages are stated as a percentage of applicable segment restaurant sales.
2020 vs. 2019 2019 vs. 2018Pollo Tropical:Cost of sales : Sales mix 0.8 % 1.1 %
Lower rebates and discounts from suppliers 0.3 % — %Menu offering improvement and impact of commodity costs 0.1 % (1.5)%
Operating efficiencies (1.0)% (0.6)% Higher (lower) promotions and discounts (0.2)% 0.4 % Menu price increases (0.2)% (0.5)% Other 0.3 % — %
Net increase (decrease) in cost of sales as a percentage of restaurant sales 0.1 % (1.1)%
Restaurant wages and related expenses: Higher labor costs due to COVID-19 0.5 % — %
Higher labor costs for comparable restaurants — % 0.7 %Lower labor costs due to labor efficiencies (0.3)% — %
Lower labor costs due to restaurant closures, net of new restaurants — % (0.5)% Other — % 0.1 %
Net increase in restaurant wages and related expenses as a percentage of restaurant sales 0.2 % 0.3 %
Other operating expenses:Higher delivery fees 1.5 % 0.4 %Lower repairs and maintenance costs (0.3)% — %Contracted cleaning services — % 0.5 %Real estate tax classification — % (1.0)%
Other 0.1 % 0.1 %Net change in other restaurant operating expenses as a percentage of restaurant sales 1.3 % — %
Advertising expense:Reduced advertising (0.7)% (0.1)%
Net decrease in advertising expense as a percentage of restaurant sales (0.7)% (0.1)%
Pre-opening costs: Decrease in number of restaurant openings (0.1)% (0.1)%
Net decrease in pre-opening costs as a percentage of restaurant sales (0.1)% (0.1)%
(1) Includes costs related to the Strategic Renewal Plan (the "Plan") in 2018.(2) Other consists of any other driver with an impact of less than 20 basis points.(3) Primarily includes the impact of COVID-19 related special incentive pay and quarantine pay, which is partially offset (0.1%) by lower incentive bonus
resulting from the special incentive pay.(4) Includes the impact of higher wage rates and overtime due to labor shortages in 2019.(5) Due to the adoption of ASC 842, real estate taxes are included in rent expense in 2020 and 2019 and in other operating expenses in 2018.
(1)
(2)
(3)
(1)(4)
(5)
44

Table of Contents
2020 vs. 2019 2019 vs. 2018Taco Cabana:Cost of sales : Menu offering improvement and higher (lower) commodity costs (1.5)% 1.0 % Operating efficiencies (0.7)% — % Higher (lower) promotions and discounts (0.5)% 0.5 % Menu price increases (0.3)% (0.6)% Sales mix 1.1 % (0.5)% Lower rebates and discounts from suppliers 0.3 % — % Other — % (0.1)% Net increase (decrease) in cost of sales as a percentage of restaurant sales (1.6)% 0.3 %
Restaurant wages and related expenses: Lower labor costs due to labor efficiencies (1.4)% (0.2)%
Higher labor costs due to COVID-19 0.7 % — %Higher (lower) incentive bonus costs 0.2 % (0.4)%
Other — % (0.1)%Net decrease in restaurant wages and related expenses as a percentage of restaurant sales (0.5)% (0.7)%
Other operating expenses:Higher delivery fees 0.9 % 0.2 %Higher (lower) repairs and maintenance (0.4)% 0.3 %Real estate tax classification — % (1.7)%Lower security costs (0.1)% (0.2)%
Other — % (0.2)%Net increase (decrease) in other restaurant operating expenses as a percentage of restaurant sales 0.4 % (1.6)%
Advertising expense: Increased (reduced) advertising (0.9)% 0.2 %
Net increase (decrease) in advertising expense as a percentage of restaurant sales (0.9)% 0.2 %
Pre-opening costs: Decrease in number of restaurant openings (0.2)% (0.1)% Net decrease in pre-opening costs as a percentage of restaurant sales (0.2)% (0.1)%
(1) Includes costs related to the Plan in 2018.(2) Primarily includes the impact of COVID-19 related special incentive pay and quarantine pay, which is partially offset (0.1%) by lower incentive bonus
resulting from the special incentive pay.(3) Due to the adoption of ASC 842, real estate taxes are included in rent expense in 2020 and 2019 and in other operating expenses in 2018.
Consolidated Restaurant Rent Expense. Beginning in fiscal 2019, restaurant rent expense includes base rent, contingent rent and common area maintenanceand property taxes related to our leases characterized as operating leases. For periods prior to the adoption of ASC 842 at the beginning of fiscal 2019, restaurantrent expense included base rent and contingent rent on our leases characterized as operating leases, reduced by amortization of gains on sale-leaseback transactions.Restaurant rent expense, as a percentage of total restaurant sales, increased to 8.2% in 2020 from 7.3% in 2019, due primarily to the impact of lower comparablerestaurant sales. Restaurant rent expense, as a percentage of total restaurant sales, was 7.3% in 2019 compared to 5.3% in 2018, due primarily to a $3.3million increase in rent expense as a result of no longer amortizing gains on
(1)
(2)
(3)
45

Table of Contents
sale-leaseback transactions, the inclusion of property taxes and common area maintenance costs related to our leases characterized as operating leases, and theimpact of lower comparable restaurant sales.
Consolidated General and Administrative Expenses. General and administrative expenses are comprised primarily of (1) salaries and expenses associated withthe development and support of our Company and brands and the management oversight of the operation of our restaurants; and (2) legal, auditing and otherprofessional fees, corporate system costs, and stock-based compensation expense.
General and administrative expenses decreased to $53.1 million in 2020 from $56.2 million in 2019, and as a percentage of total revenues, were 9.6% in 2020and 8.5% in 2019 due primarily to the impact of lower total revenues partially offset by lower management support costs primarily as a result of headcountreductions in the second quarter of 2020, reduced travel and other cost savings initiatives. General and administrative expenses in 2020 also included $1.1 millionrelated to severance costs associated with positions eliminated in response to the COVID-19 pandemic, $0.8 million related to digital and brand repositioning costs,and $0.1 million related to search fees for senior executive positions. General and administrative expense in 2019 included $1.0 million related to restructuringcosts due to eliminated or relocated positions, $0.4 million related to digital and brand repositioning costs and $0.5 million related to search fees for seniorexecutive positions.
General and administrative expenses increased to $56.2 million in 2019 from $54.5 million in 2018, and as a percentage of total revenues, were 8.5% in 2019and 7.9% in 2018 due primarily to the impact of lower total revenues on higher general and administrative expenses including investments in off-premise supportin 2019. General and administrative expense in 2019 also included $1.0 million related to restructuring costs due to eliminated or relocated positions, $0.4million related to digital and brand repositioning costs and $0.5 million related to search fees for senior executive positions. General and administrative expenses in2018 included $0.5 million related to the Strategic Renewal Plan restructuring costs and retention bonuses, $0.4 million related to discontinuing certain services,$1.0 million related to system implementation and project-oriented advisory services and $1.0 million related to severance costs and executive and board membersearches, partially offset by the benefit of fee reductions and final insurance recoveries totaling $0.6 million related to 2017 shareholder activism matters andreductions to final settlement amounts related to a litigation matter of $0.2 million.
Adjusted EBITDA. Adjusted EBITDA is the primary measure of segment profit or loss used by our chief operating decision maker for purposes of allocatingresources to our segments and assessing their performance and is defined as earnings attributable to the applicable segment before interest expense, income taxes,depreciation and amortization, impairment and other lease charges, goodwill impairment, closed restaurant rent expense, net of sublease income, stock-basedcompensation expense, other expense (income), net, and certain significant items that management believes are related to strategic changes and/or are not related tothe ongoing operation of our restaurants.
Adjusted EBITDA may not necessarily be comparable to other similarly titled captions of other companies due to differences in methods of calculationAdjusted EBITDA for each of our segments includes an allocation of general and administrative expenses associated with administrative support for executivemanagement, information systems and certain finance, legal, supply chain, human resources, development, and other administrative functions. ConsolidatedAdjusted EBITDA is a non-GAAP financial measure of performance. For a discussion of our use of Adjusted EBITDA and Consolidated Adjusted EBITDA and areconciliation from net income (loss) to Consolidated Adjusted EBITDA, see the heading entitled "Management's Use of Non-GAAP Financial Measures."
Adjusted EBITDA for Pollo Tropical restaurants decreased to $36.5 million, or 11.6% of total revenues, in 2020 from $50.6 million, or 13.9% of totalrevenues, in 2019 due primarily to the impact of lower restaurant sales, including the impact of COVID-19, higher delivery fee expense, and additional costsrelated to the COVID-19 pandemic, partially offset by lower advertising expense, labor costs as a percentage of restaurant sales due to labor efficiencies, certainother operating expenses, and general and administrative expenses. Adjusted EBITDA for our Taco Cabana restaurants increased to $8.5 million, or 3.5% of totalrevenues, in 2020 from $7.9 million, or 2.7% of total revenues, in 2019 due primarily to lower cost of sales as a percentage of restaurant sales, advertisingexpenses, certain other operating expenses, labor costs as a percentage of restaurant sales due to labor efficiencies, the impact of the closure of unprofitablerestaurants in the first quarter of 2020 and lower general and administrative expenses, partially offset by the impact of lower restaurant sales, including the impactof COVID-19, higher delivery fee expense and additional costs related to the COVID-19 pandemic. In addition, we estimate the additional week of sales in ourfiscal 2020 had a $1.7 million and $1.2 million favorable impact on Adjusted EBITDA for Pollo Tropical and Taco Cabana, respectively, in 2020.
Adjusted EBITDA for Pollo Tropical restaurants decreased to $50.6 million (which includes the negative impact of a $1.5 million increase in rent expense as aresult of adopting ASC 842 and the estimated negative impact of Hurricane Dorian of $0.6 million), or 13.9% of total revenues, in 2019 from $54.9 million, or14.6% of total revenues, in 2018 due primarily to the impact of lower restaurant sales, including the impact of Hurricane Dorian, and higher rent expense,contracted cleaning
46

Table of Contents
services, delivery fees and general and administrative expenses, partially offset by lower cost of sales as a percentage of restaurant sales. Adjusted EBITDA for ourTaco Cabana restaurants decreased to $7.9 million (which includes the negative impact of a $1.9 million increase in rent expense as a result of adopting ASC 842),or 2.7% of total revenues, in 2019 from $13.1 million, or 4.2% of total revenues, in 2018 due primarily to the impact of lower restaurant sales and higher rentexpense, cost of sales as a percentage of restaurant sales, delivery fees, and general and administrative expenses, partially offset by lower restaurant wages andrelated expenses as a percentage of restaurant sales.
Restaurant-level Adjusted EBITDA. We also use Restaurant-level Adjusted EBITDA, a non-GAAP financial measure, as a supplemental measure to evaluatethe performance and profitability of our restaurants in the aggregate, which is defined as Adjusted EBITDA excluding franchise royalty revenues and fees, pre-opening costs and general and administrative expenses (including corporate-level general and administrative expenses).
Restaurant-level Adjusted EBITDA for Pollo Tropical was $61.3 million (19.5% of restaurant sales), $77.6 million (which includes the negative impact of a$1.5 million increase in rent expense as a result of adopting ASC 842 and the estimated negative impact of Hurricane Dorian of $0.6 million) (21.4% of restaurantsales), and $82.1 million (21.9% of restaurant sales) in 2020, 2019, and 2018, respectively. Restaurant-level Adjusted EBITDA for Taco Cabana was $29.7 million(12.4% of restaurant sales), $31.4 million (which includes the negative impact of a $1.9 million increase in rent expense as a result of adopting ASC 842) (10.6%of restaurant sales), and $36.3 million (11.7% of restaurant sales) in 2020, 2019, and 2018, respectively. The changes in Restaurant-level Adjusted EBITDA wereprimarily due to the foregoing. In addition, we estimate the additional week of sales in our fiscal 2020 had a $2.0 million and $1.4 million favorable impact onRestaurant-level Adjusted EBITDA for Pollo Tropical and Taco Cabana, respectively, in 2020. For a reconciliation from Adjusted EBITDA to Restaurant-levelAdjusted EBITDA, see the heading entitled "Management's Use of Non-GAAP Financial Measures."
Depreciation and Amortization. Depreciation and amortization expense decreased to $38.2 million in 2020 from $39.2 million in 2019 due primarily todecreased depreciation as a result of impairing closed restaurant assets, partially offset by an increase in depreciation related to new restaurant openings andongoing reinvestment and enhancements to our restaurants. Depreciation and amortization expense increased to $39.2 million in 2019 from $37.6 million in 2018primarily as a result of increased depreciation related to new restaurant openings and ongoing reinvestment and enhancements to our restaurants, partially offset bya decrease in depreciation as a result of impairing closed restaurant assets.
Impairment and Other Lease Charges. Impairment and other lease charges decreased to $9.1 million in 2020 from $13.1 million in 2019.
Impairment and other lease charges in 2020 for Pollo Tropical include impairment charges of $7.3 million related primarily to the impairment of assets fromthree underperforming Pollo Tropical restaurants, two of which we closed in the third quarter of 2020, the write-down of saucing islands and self-service sodamachines that are being removed from dining rooms as a result of COVID-19, and the write-down of assets held for sale to their fair value less costs to sell, andlease termination charges of $0.9 million for restaurant locations we decided not to develop, net of a gain from lease terminations of $(0.2) million. Impairment andother lease charges in 2020 for Taco Cabana include impairment charges of $1.1 million related primarily to the write-down of assets held for sale to their fairvalue less costs to sell and the impairment of assets for two underperforming Taco Cabana restaurants that we continue to operate, and two offsetting leaseterminations.
Impairment and other lease charges decreased to $13.1 million in 2019 from $21.1 million in 2018. Impairment and other lease charges in 2019 consisted ofimpairment charges for Pollo Tropical and Taco Cabana restaurants of $0.8 million and $13.2 million, respectively, and net lease charge recoveries for PolloTropical and Taco Cabana restaurants of $(0.8) million and $(0.1) million, respectively. Impairment charges in 2019 also included right-of-use assets and wererelated primarily to 19 Taco Cabana restaurants that were subsequently closed in January 2020, five of which were initially impaired in prior years, as well aspreviously closed Pollo Tropical restaurants and other underperforming Taco Cabana restaurants that we continued to operate, while the net lease charge recoverieswere related primarily to lease terminations for previously closed restaurants.
Impairment and other lease charges in 2018 consisted of impairment charges for Pollo Tropical and Taco Cabana restaurants of $13.1 million and $6.0million, respectively, and lease and other charges for Pollo Tropical and Taco Cabana restaurants (as well as a Taco Cabana office location) of $0.5 million and$1.6 million, respectively, net of recoveries. Impairment charges in 2018 were related primarily to 14 Pollo Tropical restaurants that were closed in 2018, two ofwhich were initially impaired in 2017, nine Taco Cabana restaurants that were closed in 2018, one of which was initially impaired in 2017, two Taco Cabanarestaurants that were closed in 2020, and one Pollo Tropical restaurant and four Taco Cabana restaurants that we continued to operate. Other lease charges, net ofrecoveries, in 2018 were related primarily to restaurants and an office location that were closed in 2018 as well as previously closed restaurants.
Each quarter we assess the potential impairment of any long-lived assets that have experienced a triggering event, including restaurants for which the relatedtrailing twelve-month cash flows are below a certain threshold. We determine if there is
47

Table of Contents
impairment at the restaurant level by comparing undiscounted future cash flows from the related long-lived assets, exclusive of operating lease payments, to theirrespective carrying values, excluding operating lease liabilities. In determining future cash flows, significant estimates are made by us with respect to futureoperating results of each restaurant over its remaining lease term, including sales trends, labor rates, commodity costs and other operating cost assumptions. Ifassets are determined to be impaired, the impairment charge is measured by calculating the amount by which the asset group's carrying amount exceeds its fairvalue. This process of assessing fair values requires the use of estimates and assumptions, including our ability to sell or reuse the related assets and marketconditions, and for right-of-use lease assets, current market lease rent and discount rates, which are subject to a high degree of judgment. If these assumptionschange in the future, we may be required to record impairment charges for these assets and these charges could be material. Due to the uncertainty associated withthe unprecedented nature of the COVID-19 pandemic and the impact it will continue to have on restaurant operations and future cash flows, it is reasonablypossible that the estimates of future cash flows used in impairment assessments will change in the near term and the effect of the change could be material. Ourcurrent estimates assume that operating restrictions, regulations and directives for restaurants and other changes related to COVID-19 will continue to have asignificant impact through at least the first half of 2021 with the greatest impact in the near term.
For four Pollo Tropical restaurants and four Taco Cabana restaurants with combined carrying values (excluding right-of-use lease assets) of $2.8 million and$1.4 million, respectively, projected cash flows are not substantially in excess of their carrying values. In addition, one Pollo Tropical restaurant and one TacoCabana restaurant with combined carrying values (excluding right-of-use lease assets) of $1.9 million and $0.9 million, respectively, have initial sales volumeslower than expected, but do not have significant operating history to form a good basis for future projections. If the performance of these restaurants does notimprove as projected, an impairment charge could be recognized in future periods, and such charge could be material.
Goodwill Impairment. Goodwill impairment was $67.9 million in 2019 and consisted of non-cash impairment charges to write down the value of goodwill forthe Taco Cabana reporting unit.
Closed Restaurant Rent Expense, Net of Sublease Income. Closed restaurant rent expense, net of sublease income was $6.5 million in 2020 and consisted ofclosed restaurant rent and ancillary lease costs of $6.9 million and $4.9 million net of sublease income of $(4.8) million and $(0.5) million for Pollo Tropical andTaco Cabana, respectively.
Closed restaurant rent expense, net of sublease income was $4.2 million in 2019 and consisted of closed restaurant rent and ancillary lease costs of $6.8million and $1.4 million net of sublease income of $(3.4) million and $(0.5) million for Pollo Tropical and Taco Cabana, respectively.
Other Expense (Income), Net. Other expense (income), net was $(1.7) million in 2020 and primarily consisted of total gains of $(3.8) million on the sale-leaseback of seven restaurant properties and the sale of six restaurant properties, partially offset by $1.5 million in costs for the removal, transfer and storage ofequipment from closed restaurants and other closed restaurant costs and $0.7 million for the write-off of site development costs. Other expense (income), net in2019 primarily consisted of $0.8 million in costs for the removal, transfer and storage of equipment from closed restaurants and $0.1 million for the write-off ofsite development costs. Other expense (income), net in 2018 consisted primarily of $(3.5) million in insurance recoveries related to the Hurricanes and total gainsof $(1.2) million on the sale of three restaurant properties, partially offset by the write-off of site development costs of $0.6 million and severance costs related tothe closure of restaurants and costs for the removal, transfer and storage of equipment from closed restaurants of $1.1 million.
Interest Expense. Interest expense increased $0.9 million to $4.8 million in 2020 from 2019 due to a higher borrowing level under our former amended seniorcredit facility and higher interest rates in 2020 and to higher interest rates under the term loan in our new senior credit facility. Interest expense decreased $0.1million to $3.9 million in 2019 from 2018 due primarily to lower interest rates and a lower borrowing level under our former senior credit facility in 2019.
Loss on Extinguishment of Debt. Loss on extinguishment of debt was $1.2 million in 2020 and consisted of charges to write-off unamortized deferredfinancing costs related to the capacity reduction and termination of our former senior credit facility.
Provision for (Benefit from) Income Taxes. The effective tax rate was 44.8% for the year ended January 3, 2021, and (12.5)% for the year ended December 29,2019. The benefit from income taxes for 2020 includes a benefit related to the carryback of net operating losses and reclassifying certain assets as qualifiedimprovement property as permitted by the Coronavirus Aid, Relief, and Economic Security Act (the "CARES Act") and other changes to depreciation methods forcertain assets made in conjunction with a cost segregation study conducted prior to filing our 2019 federal income tax return, as well as a decrease to the valuationallowance on our deferred tax assets related to changes in our deferred tax assets and liabilities. The provision for income taxes for 2019 included the effect ofimpairing non-deductible goodwill and establishing a valuation allowance on our deferred income taxes.
48
Table of Contents
The CARES Act, which was signed into law on March 27, 2020, includes provisions that allow net operating losses arising in 2018, 2019, and 2020 to becarried back for up to five years and includes technical amendments that are retroactive to 2018 which permit certain assets to be classified as qualifiedimprovement property and expensed immediately.
The effective tax rate was (12.5)% for 2019 and (55.3)% for 2018. The change in the effective rate was primarily the result of impairing non-deductiblegoodwill and establishing a valuation allowance on our deferred income tax assets in 2019 and changing the depreciation method for certain assets for federalincome tax purposes to accelerate tax deductions in 2018 as well as the impact of lower pre-tax earnings (excluding non-deductible goodwill) in 2019.
Net Income (Loss). As a result of the foregoing, we had a net loss of $10.2 million in 2020 compared to a net loss of $84.4 million in 2019, and net income of$7.8 million in 2018.
Liquidity and Capital Resources
We do not have significant receivables or inventory and receive trade credit based upon negotiated terms in purchasing food products and other supplies.Although, as a result of our substantial cash balance, we did not have a working capital deficit at January 3, 2021, we have the ability to operate with a substantialworking capital deficit (and we have historically operated with a working capital deficit) because:
• restaurant operations are primarily conducted on a cash basis;
• rapid turnover results in a limited investment in inventories; and
• cash from sales is usually received before related liabilities for supplies and payroll become due.
Capital expenditures and payments related to our lease obligations represent significant liquidity requirements for us. We believe our cash reserves, cashgenerated from our operations, and availability of borrowings under our senior credit facility will provide sufficient cash availability to cover our anticipatedworking capital needs, capital expenditures and debt service requirements for the next twelve months.
Operating Activities. Net cash provided by operating activities for 2020, 2019, and 2018 was $40.3 million, $65.0 million and $53.8 million, respectively. The$24.8 million decrease in net cash provided by operating activities in 2020 compared to 2019 was driven primarily by a decrease in Adjusted EBITDA and thereceipt of a tax refund in 2019, partially offset by the timing of payments. The impact of extended vendor payment terms in 2020 was partially offset by thepayment of January 2021 rent in fiscal 2020 as a result of the 53 week in fiscal 2020. The $11.2 million increase in net cash provided by operating activitiesin 2019 compared to 2018 was driven primarily by the receipt of a tax refund, partially offset by a decrease in Adjusted EBITDA and the timing of payments.
Investing Activities. Net cash provided by investing activities in 2020 was $8.4 million. Net cash used in investing activities in 2019, and 2018 was $39.4million and $52.1 million, respectively. Capital expenditures are typically the largest component of our investing activities and include: (1) new restaurantdevelopment, which may include the purchase of real estate; (2) restaurant remodeling/reimaging, which includes the renovation or rebuilding of the interior andexterior of our existing restaurants; (3) other restaurant capital expenditures, which include capital maintenance expenditures for the ongoing reinvestment andenhancement of our restaurants; and (4) corporate and restaurant information systems.
rd
49

Table of Contents
The following table sets forth our capital expenditures for the periods presented (dollars in thousands):
Pollo Tropical
Taco Cabana Other Consolidated
Year ended January 3, 2021:New restaurant development $ 1,009 $ 854 $ — $ 1,863 Restaurant remodeling 358 745 — 1,103 Other restaurant capital expenditures 6,542 4,728 — 11,270 Corporate and restaurant information systems 1,254 887 1,992 4,133
Total capital expenditures $ 9,163 $ 7,214 $ 1,992 $ 18,369 Number of new restaurant openings — 1 1
Year ended December 29, 2019:New restaurant development $ 7,325 $ 4,065 $ — $ 11,390 Restaurant remodeling 1,654 919 — 2,573 Other restaurant capital expenditures 10,069 9,266 — 19,335 Corporate and restaurant information systems 2,873 3,773 1,303 7,949
Total capital expenditures $ 21,921 $ 18,023 $ 1,303 $ 41,247 Number of new restaurant openings 3 3 6
Year ended December 30, 2018:New restaurant development $ 12,340 $ 9,105 $ — $ 21,445 Restaurant remodeling 51 531 — 582 Other restaurant capital expenditures 12,157 15,307 — 27,464 Corporate and restaurant information systems 3,119 3,943 1,297 8,359
Total capital expenditures $ 27,667 $ 28,886 $ 1,297 $ 57,850 Number of new restaurant openings 7 7 14
(1) Excludes restaurant repair and maintenance expenses included in other restaurant operating expenses in our consolidated financial statements. For the yearsended January 3, 2021; December 29, 2019; and December 30, 2018, total restaurant repair and maintenance expenses were approximately $17.4 million,$23.1 million, and $23.4 million, respectively.
Cash provided by investing activities in 2020 included net proceeds of $17.2 million from the sale-leaseback of seven restaurant properties and $9.6 millionfrom the sale of an additional six restaurant properties.
In 2019, investing activities also included net proceeds of $1.8 million from the sale of one restaurant property.
In 2018, investing activities also included $4.7 million in additional proceeds received related to three restaurant properties and $1.0 million received related toa closed Taco Cabana restaurant that suffered flood damages due to Hurricane Harvey and a Taco Cabana restaurant that was temporarily closed due to a fire.
Total capital expenditures in 2021 are expected to be between $33.0 million and $38.0 million including $12.0 million to $15.0 million for digital platformsand technology enhancements.
Financing Activities. Net cash used in financing activities in 2020 was $8.5 million and included net revolving credit borrowing repayments under our formeramended senior credit facility of $75.0 million, $3.0 million in payment of debt issuance costs associated with our former amended senior credit facility and newsenior credit facility combined with $3.7 million in payments to repurchase our common stock, partially offset by proceeds of $73.5 million under our new seniorcredit facility.
Net cash used in financing activities in 2019 included $14.3 million in payments to repurchase our common stock combined with net revolving creditborrowing repayments under our former senior credit facility of $3.0 million.
Net cash used in financing activities in 2018 included $2.8 million in payments to repurchase our common stock and $0.2 million in payment of debt issuancecosts associated with our former senior credit facility, offset by net borrowings under our former senior credit facility of $3.0 million.
(1)
(1)
(1)
50

Table of Contents
New Senior Credit Facility. On November 23, 2020, we terminated our former amended senior secured revolving credit facility, referred to as the "formersenior credit facility," and entered into a new senior secured credit facility, which is referred to as the "new senior credit facility." The new senior credit facility iscomprised of a term loan facility (the "term loan facility") of $75.0 million and a revolving credit facility (the "revolving credit facility") of up to $10.0 million andmatures on November 23, 2025. The new senior credit facility also provides for potential incremental term loan borrowing increases of up to $37.5 million in theaggregate, subject to, among other items, compliance with a minimum Total Leverage Ratio and other terms specified in the new senior credit facility. OnJanuary 3, 2021, there were $75.0 million in outstanding borrowings, subject to an original issue discount, under the term loan facility and no borrowings under therevolving credit facility.
Under the new senior credit facility, we must repay the unpaid principal amount of the term loan facility quarterly which commences on March 31, 2021, in anamount equal to 0.25% of the aggregate principal amount of the term loan facility on the effective date of the new senior credit facility, resulting in annualmandatory repayments of $0.8 million.
The new senior credit facility provides that we must maintain minimum Liquidity (as defined in the new senior credit facility) of $20.0 million (the "LiquidityThreshold") until January 3, 2022. The new senior credit facility also provides that we are not required to be in compliance with the Total Leverage Ratio under thenew senior credit facility until January 3, 2022, or the date in which Liquidity is less than the Liquidity Threshold. We will be permitted to exercise equity curerights with respect to compliance with the Total Leverage Ratio subject to certain restrictions as set forth in the new senior credit facility.
Borrowings under the new senior credit facility bear interest at a rate per annum, at our option, equal to either (all terms as defined in the new senior creditfacility):
1) the Base Rate plus the Applicable Margin of 6.75% with a minimum Base Rate of 2.00%, or2) the LIBOR (or Benchmark Replacement) Rate plus the Applicable Margin of 7.75%, with a minimum LIBOR (or Benchmark Replacement) Rate of
1.00%.
In addition, the new senior credit facility requires us to pay a commitment fee of 0.50% per annum on the daily amount of the unused portion of the revolvingcredit facility.
The outstanding borrowings under the revolving credit facility are prepayable without penalty or premium (other than customary breakage costs). Theoutstanding borrowings under the term loan facility are voluntarily prepayable by us, and the term loan facility provides that each of the following shall require amandatory prepayment of outstanding term loan borrowings by us as follows: (i) 100% of any cash Net Proceeds (as defined in the new senior credit facility) inexcess of $2.0 million individually or in the aggregate over the term of the new senior credit facility in respect of any Casualty Event (as defined in the new seniorcredit facility) affecting collateral provided that we are permitted to reinvest such Net Proceeds in accordance with the new senior credit facility, (ii) 100% of anyNet Proceeds of a Specified Equity Contribution (as defined in the new senior credit facility), (iii) 100% of any cash Net Proceeds from the issuance of debt issuedby us or our subsidiaries other than Permitted Debt (as defined in the new senior credit facility), (iv) 100% of any Net Proceeds from the Disposition (as defined inthe new senior credit facility) of certain assets individually, or in the aggregate, in excess of $2.0 million in any fiscal year provided that we are permitted toreinvest such Net Proceeds in accordance with the new senior credit facility and (v) beginning with the fiscal year ending January 2, 2022, an amount equal to theExcess Cash Flow (as defined in the new senior credit facility) in accordance with the new senior credit facility.
Our new senior credit facility contains customary default provisions, including without limitation, a cross default provision pursuant to which it is an event ofdefault under this facility if there is a default under any of our indebtedness having an outstanding principal amount in excess of $5.0 million which results in theacceleration of such indebtedness prior to its stated maturity or is caused by a failure to pay principal when due.
The new senior credit facility contains certain covenants, including, without limitation, those limiting our ability to, among other things, incur indebtedness,incur liens, sell or acquire assets or businesses, change the character of our business in any material respects, engage in transactions with related parties, makecertain investments, make certain restricted payments or pay dividends.
Our obligations under the new senior credit facility are secured by all of our and our subsidiaries' assets (including a pledge of all of the capital stock andequity interests of our subsidiaries).
Under the new senior credit facility, the lenders may terminate their obligation to advance and may declare the unpaid balance of borrowings, or any partthereof, immediately due and payable upon the occurrence and during the continuance of customary defaults which include, without limitation, payment default,covenant defaults, bankruptcy type defaults, defaults on other indebtedness, certain judgments or upon the occurrence of a change of control (as specified in thenew senior credit facility).
51

Table of Contents
As of January 3, 2021, we were in compliance with the financial covenants under our new senior credit facility. At January 3, 2021, $10.0 million wasavailable for borrowing under the revolving credit facility.
Former Senior Credit Facility. On July 10, 2020, we entered into the Second Amendment to Credit Agreement (as previously defined as the "former seniorcredit facility") among Fiesta and a syndicate of lenders that included adjustments to our covenants that were more reflective of current sales and profit trends.Pursuant to the former senior credit facility, the available revolving credit borrowings under the former senior credit facility were reduced from $150.0 million to$95.0 million in a phased reduction beginning with a $30.0 million permanent reduction that occurred on July 10, 2020. The former senior secured credit facilitywas terminated on November 23, 2020.
Initial Share Repurchase Plan
In 2018, our board of directors approved a share repurchase program for up to 1.5 million shares of our common stock. In 2019, our board of directorsapproved increases to the share repurchase program of an additional 1.5 million shares of our common stock. Under the share repurchase program, shares may berepurchased from time to time in open market transactions at prevailing market prices, in privately negotiated transactions or by other means in accordance withfederal securities laws, including Rule 10b-18 under the Securities Exchange Act of 1934, as amended. The number of shares repurchased and the timing ofrepurchases will depend on a number of factors, including, but not limited to, stock price, trading volume, general market and economic conditions, and othercorporate considerations. The share repurchase program has no time limit and may be modified, suspended, superseded or terminated at any time by our board ofdirectors. Our new senior credit facility prohibits share repurchases, and we currently do not intend to repurchase additional shares of our common stock for theforeseeable future.
Contractual Obligations
The following table summarizes our contractual obligations and commitments as of January 3, 2021 (in thousands):
Payments due by period
Contractual Obligations Total Less than
1 Year1 - 3 Years
3 - 5 Years
More than 5 Years
Credit facility debt obligations, including interest $ 106,633 $ 7,338 $ 14,479 $ 84,816 $ — Finance lease obligations, including interest 2,734 455 921 645 713Operating lease obligations 450,488 40,741 84,086 73,425 252,236Purchase obligations 10,328 6,862 3,323 143 — Total contractual obligations $ 570,183 $ 55,396 $ 102,809 $ 159,029 $ 252,949
(1) Our credit facility debt obligations at January 3, 2021, totaled $75.0 million. Total interest payments on the obligations of $31.4 million for all years presentedare included at the cash interest rate of 8.75%. Total credit facility fees of $0.2 million for all years presented are included based on January 3, 2021, rates andbalances. Actual interest and fee payments will vary based on our outstanding credit facility balances and the rates in effect during those years. Refer to Note 8of the consolidated financial statements included in this Annual Report on Form 10-K for details of our debt.
(2) Includes total interest of $0.9 million for all years presented.(3) Represents the aggregate minimum lease payments under operating leases. Many of our leases also require contingent rent based on a percentage of sales in
addition to the minimum base rent and require expenses incidental to the use of the property, all of which have been excluded from this table.(4) Represents contractual obligations under various agreements to purchase goods or services that are enforceable and legally binding and include $7.7 million
related to the master subscription agreement for an ERP system through April 27, 2024.
We have not included in the contractual obligations table payments we may make for workers' compensation, general liability and employee health care claimsfor which we pay all claims, subject to some annual stop-loss limitations both for individual claims and claims in the aggregate. The majority of our recordedliabilities related to employee health and insurance plans represent estimated reserves for incurred claims that have yet to be filed or settled. We are also party tovarious service and supply contracts that generally extend approximately twelve months. These arrangements are primarily individual contracts for routine goodsand services that are part of our normal operations and are reflected in historical operating cash flow trends. These contract obligations are generally short-term innature and can be canceled within a reasonable time period, at our option. We do not believe such arrangements will adversely affect our liquidity position.
(1)
(2)
(3)
(4)
52

Table of Contents
Off-Balance Sheet Arrangements
We have no off-balance sheet arrangements. Prior to the adoption of ASC 842, off-balance sheet arrangements consisted of our operating leases, which areprimarily for our restaurant properties and are now included in other current liabilities and operating lease liabilities on the consolidated balance sheet asof January 3, 2021.
Inflation
The inflationary factors that have historically affected our results of operations include increases in food and paper costs, labor and other operating expensesand energy costs. Labor costs in our restaurants are impacted by changes in the federal and state hourly minimum wage rates as well as changes in payroll relatedtaxes, including federal and state unemployment taxes. We typically attempt to offset the effect of inflation, at least in part, through periodic menu price increasesand various cost reduction programs. However, no assurance can be given that we will be able to fully offset such inflationary cost increases in the future.
Application of Critical Accounting Policies
Our consolidated financial statements and accompanying notes are prepared in accordance with accounting principles generally accepted in the United Statesof America. Preparing consolidated financial statements requires us to make estimates and assumptions that affect the reported amounts of assets, liabilities,revenue and expenses. These estimates and assumptions are affected by the application of our accounting policies. Our significant accounting policies aredescribed in the "Basis of Presentation" note in the Notes to our Consolidated Financial Statements. Critical accounting estimates are those that require applicationof management's most difficult, subjective, or complex judgments, often as a result of matters that are inherently uncertain and may change in subsequent periods.
Sales recognition at our restaurants is straightforward as customers pay for products at the time of sale and inventory turns over very quickly. Payments tovendors for products sold in the restaurants are generally settled within 60 days. The earnings reporting process is covered by our system of internal controls andgenerally does not require significant management estimates and judgments. However, critical accounting estimates and judgments, as noted below, are inherent inthe assessment and recording of insurance liabilities, the valuation of goodwill for impairment, assessing impairment of long-lived assets, lease accounting mattersand the valuation of deferred income tax assets. While we apply our judgment based on assumptions believed to be reasonable under the circumstances, actualresults could vary from these assumptions. It is possible that materially different amounts would be reported using different assumptions.
Insurance liabilities. We are insured for workers' compensation, general liability and medical insurance claims under policies where we pay all claims, subjectto annual stop-loss limitations both for individual claims and for general liability, medical insurance and certain workers' compensation claims in the aggregate. AtJanuary 3, 2021, we had $10.4 million accrued for these insurance claims. We record insurance liabilities based on historical and industry trends, which arecontinually monitored, with the assistance of actuaries, and adjust accruals as warranted by changing circumstances. Since there are estimates and assumptionsinherent in recording these insurance liabilities, including the ability to estimate the future development of incurred claims based on historical trends or the severityof the claims, differences between actual future events and prior estimates and assumptions could result in adjustments to these liabilities.
Evaluation of Goodwill. We must evaluate our recorded goodwill for impairment annually or more frequently when events and circumstances indicate that thecarrying amount may be impaired. We have elected to conduct our annual impairment review of goodwill assets as of the last day of our fiscal year. We may firstqualitatively assess goodwill impairment to determine whether it is more likely than not that the fair value of a reporting unit is less than its carrying amount. Thisqualitative analysis is performed by examining key events and circumstances affecting fair value. If it is determined it is more likely than not that the reportingunit's fair value is not greater than its carrying amount, we perform a quantitative assessment. We adopted ASU No. 2017-04, Simplifying the Test for GoodwillImpairment ("ASU 2017-04") in the second quarter of 2019, which eliminates the requirement to calculate the implied fair value of goodwill if the fair value of areporting unit is less than the carrying amount of the reporting unit. Instead, if the carrying amount of a reporting unit exceeds its fair value, an impairment losswill be recognized in an amount equal to that excess, limited to the total amount of goodwill allocated to that reporting unit.
In performing the quantitative assessment for impairment, we compare the net book values of our reporting units to their estimated fair values. In determiningthe estimated fair values of the reporting units, we employ a combination of a discounted cash flow analysis based on management's best estimates of future cashflows and one or two market-based approaches. The results of these analyses are corroborated with other value indicators where available, such as comparablecompany earnings multiples. This evaluation of goodwill requires us to make estimates and assumptions to determine the fair value of our
53

Table of Contents
reporting units including projections regarding future operating results, anticipated growth rates, the weighted average cost of capital used to discount projectedcash flows, and market multiples.
We performed a qualitative assessment, which included examining key events and circumstances affecting fair value, for our annual impairment review as ofJanuary 3, 2021, and determined it was more likely than not that the Pollo Tropical reporting unit's fair value was greater than its carrying amount. As of January 3,2021, our Pollo Tropical reporting unit goodwill has a carrying value of $56.3 million and our Taco Cabana reporting unit goodwill has no remaining carryingvalue as it was fully impaired in 2019. See Note 4 to our audited consolidated financial statements.
We estimate the fair value of the Pollo Tropical reporting unit significantly exceeds its carrying value as of January 3, 2021. The estimates and assumptionsused to determine and assess fair value may differ from actual future events and if these estimates or related projections change significantly in the future, we maybe required to record material impairment charges for goodwill assets.
Impairment of Long-lived Assets. We assess the potential impairment of long-lived assets, principally property and equipment and operating lease right-of-useassets, whenever events or changes in circumstances indicate that the carrying value of the restaurant asset group may not be recoverable. In addition toconsidering management's plans, known regulatory/governmental actions and damage due to acts of God (hurricanes, tornadoes, etc.), we consider an eventindicating that the carrying value may not be recoverable to have occurred related to a specific restaurant if the restaurant's cash flows for the last twelve monthsare less than a minimum threshold or if consistent levels of cash flows for the remaining lease period are less than the carrying value of the restaurant's assets. Wedetermine if there is impairment at the restaurant level by comparing undiscounted future cash flows from the related long-lived assets to their respective carryingvalues. We have elected to exclude operating lease payments and liabilities from future cash flows and carrying values, respectively, in the comparison. Indetermining future cash flows, significant estimates are made by us with respect to future operating results of each restaurant over its remaining lease term,including sales trends, labor rates, commodity costs and other operating cost assumptions. If assets are determined to be impaired, the impairment charge ismeasured by calculating the amount by which the asset carrying amount exceeds its fair value. This process of assessing fair values requires the use of estimatesand assumptions, including our ability to sell or reuse the related assets and market conditions and, for right-of-use lease assets, current market lease rent anddiscount rates, which are subject to a high degree of judgment. If these assumptions change in the future, we may be required to record impairment charges forthese assets and these charges could be material.
For four Pollo Tropical restaurants and four Taco Cabana restaurants with combined carrying values (excluding right-of-use lease assets) of $2.8 million and$1.4 million, respectively, projected cash flows are not substantially in excess of their carrying values. In addition, one Pollo Tropical restaurant and one TacoCabana restaurant with combined carrying values (excluding right-of-use lease assets) of $1.9 million and $0.9 million, respectively, have initial sales volumeslower than expected, but do not have significant operating history to form a good basis for future projections. If the performance of these restaurants does notimprove as projected, an impairment charge could be recognized in future periods, and such charge could be material.
Lease Accounting. We adopted Accounting Standards Update ("ASU") 2016-02, Leases (ASC 842), the new lease accounting standard, as of as of December31, 2018, using the modified retrospective method, with certain optional practical expedients including the transition practical expedient package, which amongother things does not require reassessment of lease classification. Judgments made by management for our lease obligations include the determination of ourincremental borrowing rate, the determination of standalone selling prices used to allocate the consideration in the contract, and the length of the lease term, whichincludes the determination of renewal options that are reasonably assured. The lease term can affect the classification of a lease as finance or operating foraccounting purposes, the amount of the lease liability and corresponding right-of-use lease asset recognized, the term over which related leasehold improvementsfor each restaurant are amortized and any rent holidays and/or changes in rental amounts for recognizing rent expense over the term of the lease. These judgmentsmay produce materially different amounts of depreciation, amortization and rent expense than would be reported if different assumed lease terms were used.
We use our estimated incremental borrowing rate in determining the present value of lease payments for purposes of determining lease classification andrecording lease liabilities and lease assets on our consolidated balance sheet. Our incremental borrowing rate is determined based on a synthetic credit rating,determined using a valuation model, adjusted to reflect a secured credit rating and a developed spread curve applied to a risk-free rate yield curve. Changes in thedetermination of our incremental borrowing rate could also have an impact on the depreciation and interest expense recognized for finance leases.
Valuation of Deferred Income Tax Assets. Deferred tax assets and liabilities, which represent temporary differences between the financial statement and taxbasis of assets and liabilities, are measured using enacted tax rates expected to apply to
54

Table of Contents
the years in which those differences are expected to be recovered or settled. Deferred tax assets are recognized to the extent we believe these assets will more likelythan not be realized. A valuation allowance is established to reduce the carrying amount of deferred tax assets if we believe it is more likely than not that a portionor all of the tax benefit from these deferred tax assets will not be realized. The realization of a deferred tax asset is dependent on the generation of sufficient taxableincome in future periods, and the reversal of existing taxable temporary differences in the applicable periods. In evaluating the realizability of our net deferred taxassets, we perform an assessment of positive and negative evidence. The weight given to negative and positive evidence is commensurate only to the extent thatsuch evidence can be objectively verified. Objective historical evidence is given greater weight than subjective evidence such as forecasts of future taxable income.We considered three years of cumulative operating income (loss) in evaluating the objective evidence that historical results provide. Objective negative evidencelimits our ability to consider other subjective evidence, such as our future earnings projections. Based on our evaluation of all available positive and negativeevidence, and placing greater weight on the objective evidence, we determined that it is more likely than not that our deferred tax assets will not be fully realized infuture periods. We recorded a $13.5 million valuation allowance to reduce our deferred tax assets in the fourth quarter of 2019, which increased our tax expense.Based on changes in our deferred tax assets and liabilities in 2020, adjustments to our valuation allowance totaling $0.8 million were recorded in 2020 resulting ina valuation allowance of $12.7 million as of January 3, 2021. If we generate sufficient taxable income in the future to fully utilize the tax benefits of the deferredtax assets on which a valuation allowance was recorded, a portion or all of the valuation allowance could be reversed, which would decrease our tax expense in theperiod or periods in which the valuation allowance is reversed. We will continue to monitor and evaluate the positive and negative evidence considered in arrivingat the above conclusion in order to assess whether such conclusion remains appropriate in future periods.
New Accounting Pronouncements
In August 2018, the Financial Accounting Standards Board ("FASB") issued ASU No. 2018-15, Customer's Accounting for Implementation Costs Incurred ina Cloud Computing Arrangement That is a Service Contract, which aligns the requirements for capitalizing implementation costs incurred in a hosting arrangementthat is a service contract with the requirements for capitalizing implementation costs incurred to develop or obtain internal-use software (and hosting arrangementsthat include an internal-use software license). We adopted this new accounting standard on December 30, 2019, and applied it prospectively to all implementationcosts incurred after the date of adoption. The adoption of this standard did not have a material effect on our financial statements. We deferred and amortizedapplication development stage costs for cloud-based computing arrangements over the life of the related service (subscription) agreement in the same line item thatthe fees associated with the subscription arrangement were presented prior to adoption of the new standard.
In December 2019, the FASB issued ASU No. 2019-12, Income Taxes (Topic 740) ("ASU No. 2019-12"), which is a part of the Simplification Initiative beingundertaken by the FASB to reduce complexity of accounting standards. The amendments in this update simplify the accounting for income taxes by removingcertain exceptions, the most notable for us being the exception to the general methodology for calculating income taxes in an interim period when the year-to-dateloss exceeds the anticipated loss for the full year. The guidance will be effective for interim and annual periods beginning after December 15, 2020. Early adoptionis permitted and any adjustments should be reflected as of the beginning of the annual period of adoption. Amendments relevant to us should be applied on aprospective basis. The impact of the standard is largely dependent on interim and anticipated profit or loss in a given period, however we do not expect ASU No.2019-12 to have a significant impact on our financial statements.
In March 2020, the FASB issued ASU No. 2020-04, Reference Rate Reform (Topic 848) ("ASU No. 2020-04"), which provides optional expedients andexceptions for applying GAAP to contracts, hedging relationships, and other transactions affected by reference rate reform if certain criteria are met. Theamendments in this update are effective as of March 12, 2020, through December 31, 2022. As of January 3, 2021, our only exposure to LIBOR rates was our newsenior credit facility. Upon cessation of the LIBOR, the new senior credit facility will use a benchmark replacement rate. According to ASU No. 2020-04,modifications of contracts within the scope of Topic 470 Debt should be accounted for by prospectively adjusting the effective interest rate. We do not expect ASUNo. 2020-04 to have a significant impact on our financial statements.
55
Table of Contents
Management's Use of Non-GAAP Financial Measures
Consolidated Adjusted EBITDA is a non-GAAP financial measure. We use Consolidated Adjusted EBITDA in addition to net income and income fromoperations to assess our performance, and we believe it is important for investors to be able to evaluate us using the same measures used by management. Webelieve this measure is an important indicator of our operational strength and the performance of our business and it provides a view of operations absent non-cashactivity and items that are not related to the ongoing operation of our restaurants or affect comparability period over period. Consolidated Adjusted EBITDA ascalculated by us is not necessarily comparable to similarly titled measures reported by other companies and should not be considered as an alternative to netincome (loss), earnings (loss) per share, cash flows from operating activities or other financial information determined under GAAP.
The primary measure of segment profit or loss used by the chief operating decision maker to assess performance and allocate resources is Adjusted EBITDA,which is defined as earnings attributable to the applicable operating segments before interest expense, income taxes, depreciation and amortization, impairment andother lease charges, goodwill impairment, closed restaurant rent expense, net of sublease income, stock-based compensation expense, other expense (income), net,and certain significant items for each segment that management believes are related to strategic changes and/or are not related to the ongoing operation of ourrestaurants as set forth in the reconciliation table below. Adjusted EBITDA for each of our segments includes an allocation of general and administrative expensesassociated with administrative support for executive management, information systems and certain finance, legal, supply chain, human resources, construction andother administrative functions. See Note 11 to our audited consolidated financial statements.
We also use Restaurant-level Adjusted EBITDA as a supplemental measure to evaluate the performance and profitability of our restaurants in the aggregate,which is defined as Adjusted EBITDA for the applicable segment excluding franchise royalty revenues and fees, pre-opening costs, and general and administrativeexpenses (including corporate-level general and administrative expenses). Restaurant-level Adjusted EBITDA margin is derived by dividing Restaurant-levelAdjusted EBITDA by restaurant sales. Restaurant-level Adjusted EBITDA is also a non-GAAP financial measure.
Management believes that Consolidated Adjusted EBITDA and Restaurant-level Adjusted EBITDA, when viewed with our results of operations calculated inaccordance with GAAP and our reconciliation of net income (loss) to Consolidated Adjusted EBITDA and Restaurant-level Adjusted EBITDA (i) provide usefulinformation about our operating performance and period-over-period changes, (ii) provide additional information that is useful for evaluating the operatingperformance of our business and (iii) permit investors to gain an understanding of the factors and trends affecting our ongoing earnings, from which capitalinvestments are made and debt is serviced. However, such measures are not measures of financial performance or liquidity under GAAP and, accordingly, shouldnot be considered as alternatives to net income or cash flow from operating activities as indicators of operating performance or liquidity. Also, these measures maynot be comparable to similarly titled captions of other companies.
All such financial measures have important limitations as analytical tools. These limitations include the following:
• such financial information does not reflect our capital expenditures, future requirements for capital expenditures or contractual commitments to purchasecapital equipment;
• such financial information does not reflect interest expense or the cash requirements necessary to service payments on our debt;• although depreciation and amortization are non-cash charges, the assets that we currently depreciate and amortize will likely have to be replaced in the
future, and such financial information does not reflect the cash required to fund such replacements; and• such financial information does not reflect the effect of earnings or charges resulting from matters that our management does not consider to be indicative
of our ongoing operations. However, some of these charges and gains (such as impairment and other lease charges, closed restaurant rent expense, net ofsublease income, other income and expense, and stock-based compensation expense) have recurred and may recur.
56

Table of Contents
A reconciliation from consolidated net income (loss) to Consolidated Adjusted EBITDA follows (in thousands):
Year EndedJanuary 3, 2021 December 29, 2019 December 30, 2018
Net income (loss) $ (10,211) $ (84,386) $ 7,787 Provision for (benefit from) income taxes (8,302) 9,369 (2,772)Income (loss) before taxes (18,513) (75,017) 5,015 Add: Non-general and administrative expense adjustments: Depreciation and amortization 38,206 39,195 37,604 Impairment and other lease charges 9,139 13,101 21,144 Goodwill impairment — 67,909 — Interest expense 4,756 3,872 3,966 Closed restaurant rent expense, net of sublease income 6,487 4,163 —
Loss on extinguishment of debt 1,241 — — Other expense (income), net (1,697) 1,041 (3,007) Stock-based compensation expense in restaurant wages 200 195 90 Total non-general and administrative expense adjustments 58,332 129,476 59,797 General and administrative expense adjustments: Stock-based compensation expense 3,284 2,649 3,379 Board and shareholder matter costs — — (597)
Restructuring costs and retention bonuses 1,107 964 545 Legal settlements and related costs — — (177) Digital and brand repositioning costs 770 377 — Total general and administrative expense adjustments 5,161 3,990 3,150 Consolidated Adjusted EBITDA $ 44,980 $ 58,449 $ 67,962
Total revenues $ 554,803 $ 660,943 $ 688,597 Adjusted EBITDA as a percentage of total revenues 8.1 % 8.8 % 9.9 %
(1) Goodwill impairment for the twelve months ended December 29, 2019, consists of a non-cash impairment charge to write down the value of goodwill for the Taco Cabana reporting unit.The related benefit from income taxes is the benefit attributable to the portion of the goodwill that was tax deductible.
(2) Closed restaurant rent, net of sublease income for the twelve months ended January 3, 2021, and December 29, 2019, primarily consists of closed restaurant lease costs of $11.8 millionand $8.2 million, respectively, partially offset by sublease income of $(5.3) million and $(4.0) million, respectively. As a result of adopting ASC 842, lease costs related to closedrestaurants are recorded as closed restaurant rent. Prior to December 31, 2018, these costs were recorded as lease charges within impairment and other lease charges when a restaurantclosed.
(3) Board and shareholder matter costs for the twelve months ended December 30, 2018, include fee reductions and final insurance recoveries related to 2017 shareholder activism costs.(4) Restructuring costs and retention bonuses for the twelve months ended January 3, 2021, include severance costs related to eliminated positions related to terminations in response to the
COVID-19 pandemic. Restructuring costs and retention bonuses for the twelve months ended December 29, 2019, include severance costs related to eliminated positions. Restructuringcosts and retention bonuses for the twelve months ended December 30, 2018, include severance costs related to the Strategic Renewal Plan and reduction in force and bonuses paid tocertain employees for retention purposes.
(5) Legal settlements and related costs for the twelve months ended December 30, 2018, include reductions to final settlement amounts and benefits related to litigation matters.(6) Digital and brand repositioning costs for the twelve months ended January 3, 2021, and December 29, 2019, include consulting costs related to repositioning the digital experience for our
customers.
(1)
(2)
(3)
(4)
(5)
(6)
57

Table of Contents
A reconciliation from Adjusted EBITDA to Restaurant-level Adjusted EBITDA follows (in thousands):
Twelve Months Ended Pollo Tropical Taco CabanaJanuary 3, 2021:Adjusted EBITDA $ 36,517 $ 8,463 Restaurant-level adjustments: Add: Pre-opening costs — 69 Add: Other general and administrative expense 25,995 21,921 Less: Franchise royalty revenue and fees 1,246 760 Restaurant-level Adjusted EBITDA $ 61,266 $ 29,693
Restaurant sales $ 314,112 $ 238,685 Restaurant-level Adjusted EBITDA as a percentage of restaurant sales 19.5 % 12.4 %
December 29, 2019:Adjusted EBITDA $ 50,560 $ 7,889 Restaurant-level adjustments: Add: Pre-opening costs 380 592 Add: Other general and administrative expense 28,400 23,805 Less: Franchise royalty revenue and fees 1,780 900 Restaurant-level Adjusted EBITDA $ 77,560 $ 31,386
Restaurant sales $ 361,693 $ 296,570 Restaurant-level Adjusted EBITDA as a percentage of restaurant sales 21.4 % 10.6 %
December 30, 2018:Adjusted EBITDA $ 54,903 $ 13,059 Restaurant-level adjustments: Add: Pre-opening costs 933 783 Add: Other general and administrative expense 28,045 23,330 Less: Franchise royalty revenue and fees 1,815 857 Restaurant-level Adjusted EBITDA $ 82,066 $ 36,315
Restaurant sales $ 374,381 $ 311,544 Restaurant-level Adjusted EBITDA as a percentage of restaurant sales 21.9 % 11.7 %
(1) Excludes general and administrative adjustments included in Adjusted EBITDA.
(1)
(1)
(1)
58

Table of Contents
ITEM 7A. QUANTITATIVE AND QUALITATIVE DISCLOSURES ABOUT MARKET RISK
Interest Rate Risk
We are exposed to market risk associated with fluctuations in interest rates, primarily limited to our senior credit facility, under which we had outstandingborrowings of $75.0 million as of January 3, 2021. Borrowings under the senior credit facility bear interest at a per annum rate, at our option, of either (all terms asdefined in the senior credit facility):
1) the Base Rate plus the Applicable Margin of 6.75%with a minimum Base Rate of 2.00%, or2) the LIBOR (or Benchmark Replacement) Rate plus the Applicable Margin of 7.75%, with a minimum LIBOR (or Benchmark Replacement) Rate of
1.00%.
For variable rate debt instruments, market risk is defined as the potential change in earnings resulting from a hypothetical adverse change in interest rates. Asof January 3, 2021, we had primarily elected to be charged interest on borrowings under our senior credit facility at the LIBOR Rate plus the applicable margin.We elected a one-month LIBOR Rate for $75.0 million of borrowings under the senior credit facility as of January 3, 2021. The stated interest rate applicable tothese borrowings as of January 3, 2021 was 8.75%, which would result in interest expense in 2021 of $6.6 million assuming that outstanding borrowings andinterest rates remain unchanged during the year. A hypothetical increase of 100 basis points in the variable interest rate would increase interest expense in 2021 by$0.1 million.
Commodity Price Risk
We purchase certain products which are affected by commodity prices and are, therefore, subject to price volatility caused by weather, market conditions andother factors which are not considered predictable or within our control. Although many of the products purchased are subject to changes in commodity prices,certain purchasing contracts or pricing arrangements have been negotiated in advance to minimize price volatility. Where possible, we use these types ofpurchasing techniques to control costs as an alternative to using financial instruments to hedge commodity prices. In many cases, we believe we will be able toaddress commodity cost increases that are significant and appear to be long-term in nature by adjusting our menu pricing. However, long-term increases incommodity prices may result in lower restaurant-level operating margins.
ITEM 8. FINANCIAL STATEMENTS AND SUPPLEMENTARY DATA
The financial statements and supplementary data of Fiesta Restaurant Group, Inc. required by this Item are described in Item 15 of this Annual Report onForm 10-K and are presented beginning on page F-1.
ITEM 9. CHANGES IN AND DISAGREEMENTS WITH ACCOUNTANTS ON ACCOUNTING AND FINANCIAL DISCLOSURE
Not applicable.
ITEM 9A. CONTROLS AND PROCEDURES
Disclosure Controls and Procedures. Our senior management is responsible for establishing and maintaining disclosure controls and procedures (as defined inRule 13a-15(e) and Rule 15d-15(e) under the Securities Exchange Act of 1934, as amended (the "Exchange Act")), designed to ensure that information required tobe disclosed by us in the reports that we file or submit under the Exchange Act is recorded, processed, summarized and reported, within the time periods specifiedin the Securities and Exchange Commission's rules and forms. Disclosure controls and procedures include, without limitation, controls and procedures designed toensure that information required to be disclosed by an issuer in the reports that it files or submits under the Exchange Act is accumulated and communicated to theissuer's management, including its principal executive officer or officers and principal financial officer or officers, or persons performing similar functions, asappropriate to allow timely decisions regarding required disclosure.
Evaluation of Disclosure Controls and Procedures. We have evaluated the effectiveness of our disclosure controls and procedures (as defined in Rules 13a-15(e) and 15d-15(e) under the Exchange Act) as of the end of the period covered by this report, with the participation of our Chief Executive Officer and ChiefFinancial Officer, as well as other key members of our
59
Table of Contents
management. Based on this evaluation, our Chief Executive Officer and Chief Financial Officer concluded that our disclosure controls and procedures wereeffective as of January 3, 2021.
Changes in Internal Control over Financial Reporting. No change occurred in our internal control over financial reporting during the fourth quarter of 2020that materially affected, or is reasonably likely to materially affect, our internal control over financial reporting.
Management's Report on Internal Control over Financial Reporting
Our senior management is responsible for establishing and maintaining adequate internal control over financial reporting (as defined in Rule 13a-15(f) andRule 15d-15(f) under the Exchange Act), designed to ensure that information required to be disclosed by us in the reports that we file or submit under the ExchangeAct is recorded, processed, summarized and reported, within the time periods specified in the Securities and Exchange Commission's rules and forms.
Because of inherent limitations, a system of internal control over financial reporting may not prevent or detect misstatements. Also, projections of anyevaluation of effectiveness to future periods are subject to the risk that controls may become inadequate because of changes in conditions, or that the degree ofcompliance with the policies or procedures may deteriorate.
Management has evaluated the effectiveness of its internal control over financial reporting as of January 3, 2021 based on the criteria set forth in a reportentitled Internal Control-Integrated Framework (2013), issued by the Committee of Sponsoring Organizations of the Treadway Commission (COSO). Based onthis evaluation, we have concluded that, as of January 3, 2021, our internal control over financial reporting was effective based on those criteria.
Our independent registered public accounting firm, Deloitte & Touche LLP, has issued an audit report on the effectiveness of our internal control overfinancial reporting and their report is included herein.
60
Table of Contents
REPORT OF INDEPENDENT REGISTERED PUBLIC ACCOUNTING FIRM
To the stockholders and the Board of Directors of Fiesta Restaurant Group, Inc.
Opinion on Internal Control over Financial Reporting
We have audited the internal control over financial reporting of Fiesta Restaurant Group, Inc. and subsidiaries (the "Company") as of January 3, 2021, based oncriteria established in Internal Control – Integrated Framework (2013) issued by the Committee of Sponsoring Organizations of the Treadway Commission(COSO). In our opinion, the Company maintained, in all material respects, effective internal control over financial reporting as of January 3, 2021, based oncriteria established in Internal Control – Integrated Framework (2013) issued by COSO.
We have also audited, in accordance with the standards of the Public Company Accounting Oversight Board (United States) (PCAOB), the consolidated financialstatements as of and for the year ended January 3, 2021, of the Company and our report dated March 4, 2021, expressed an unqualified opinion on those financialstatements.
Basis for Opinion
The Company's management is responsible for maintaining effective internal control over financial reporting and for its assessment of the effectiveness of internalcontrol over financial reporting, included in the accompanying Management's Annual Report on internal control over Financial Reporting under Item 9A. Ourresponsibility is to express an opinion on the Company's internal control over financial reporting based on our audit. We are a public accounting firm registeredwith the PCAOB and are required to be independent with respect to the Company in accordance with the U.S. federal securities laws and the applicable rules andregulations of the Securities and Exchange Commission and the PCAOB.
We conducted our audit in accordance with the standards of the PCAOB. Those standards require that we plan and perform the audit to obtain reasonable assuranceabout whether effective internal control over financial reporting was maintained in all material respects. Our audit included obtaining an understanding of internalcontrol over financial reporting, assessing the risk that a material weakness exists, testing and evaluating the design and operating effectiveness of internal controlbased on the assessed risk, and performing such other procedures as we considered necessary in the circumstances. We believe that our audit provides a reasonablebasis for our opinion.
Definition and Limitations of Internal Control over Financial Reporting
A company's internal control over financial reporting is a process designed to provide reasonable assurance regarding the reliability of financial reporting and thepreparation of financial statements for external purposes in accordance with generally accepted accounting principles. A company's internal control over financialreporting includes those policies and procedures that (1) pertain to the maintenance of records that, in reasonable detail, accurately and fairly reflect thetransactions and dispositions of the assets of the company; (2) provide reasonable assurance that transactions are recorded as necessary to permit preparation offinancial statements in accordance with generally accepted accounting principles, and that receipts and expenditures of the company are being made only inaccordance with authorizations of management and directors of the company; and (3) provide reasonable assurance regarding prevention or timely detection ofunauthorized acquisition, use, or disposition of the company's assets that could have a material effect on the financial statements.
Because of its inherent limitations, internal control over financial reporting may not prevent or detect misstatements. Also, projections of any evaluation ofeffectiveness to future periods are subject to the risk that controls may become inadequate because of changes in conditions, or that the degree of compliance withthe policies or procedures may deteriorate.
/s/ Deloitte & Touche LLPDallas, Texas March 4, 2021
61

Table of Contents
ITEM 9B. OTHER INFORMATION
None.
62

Table of Contents
PART III
ITEM 10. DIRECTORS, EXECUTIVE OFFICERS AND CORPORATE GOVERNANCE
Incorporated by reference from our Definitive Proxy Statement to be filed in connection with the 2021 Annual Meeting of Stockholders.
We have adopted a written code of ethics applicable to our directors, officers and employees in accordance with the rules of The NASDAQ Stock Market andthe SEC. We make our code of ethics available free of charge through our internet website, www.frgi.com. We will disclose on our website amendments to orwaivers from our code of ethics in accordance with all applicable laws and regulations.
ITEM 11. EXECUTIVE COMPENSATION
Incorporated by reference from our Definitive Proxy Statement to be filed in connection with the 2021 Annual Meeting of Stockholders.
ITEM 12. SECURITY OWNERSHIP OF CERTAIN BENEFICIAL OWNERS AND MANAGEMENT AND RELATED STOCKHOLDER MATTERS
Incorporated by reference from our Definitive Proxy Statement to be filed in connection with the 2021 Annual Meeting of Stockholders.
ITEM 13. CERTAIN RELATIONSHIPS AND RELATED TRANSACTIONS, AND DIRECTOR INDEPENDENCE
Incorporated by reference from our Definitive Proxy Statement to be filed in connection with the 2021 Annual Meeting of Stockholders.
ITEM 14. PRINCIPAL ACCOUNTANT FEES AND SERVICES
Incorporated by reference from our Definitive Proxy Statement to be filed in connection with the 2021 Annual Meeting of Stockholders.
63

PART IV
ITEM 15. EXHIBITS AND FINANCIAL STATEMENT SCHEDULES
(a) (1) Financial Statements - Fiesta Restaurant Group, Inc. and Subsidiaries
Page
FIESTA RESTAURANT GROUP, INC. AND SUBSIDIARIES
Report of Independent Registered Public Accounting Firm F-1Financial Statements:
Consolidated Balance Sheets F-2Consolidated Statements of Operations F-3Consolidated Statements of Changes in Stockholders' Equity F-4Consolidated Statements of Cash Flows F-5Notes to Consolidated Financial Statements F-6
(a) (2) Financial Statement Schedules
Schedule Description Page
II Valuation and Qualifying Accounts F-33
Schedules other than those listed are omitted for the reason that they are not required, not applicable, or the required information is shown in the financialstatements or notes thereto.
(a) (3) Exhibits
Exhibit No. Description
3.1 Amended and Restated Certificate of Incorporation of Fiesta Restaurant Group, Inc. ("Fiesta") (incorporated by reference to Exhibit 3.1to Amendment No. 3 to Fiesta's Form 10, File No. 001-35373, filed on April 5, 2012)
3.2 Certificate of Amendment to Restated Certificate of Incorporation of Fiesta (incorporated by reference to Exhibit 3.1 of Fiesta'sQuarterly Report on Form 10-Q for the period ended July 2, 2017)
3.3 Certificate of Amendment to Restated Certificate of Incorporation of Fiesta (incorporated by reference to Exhibit 3.1 of Fiesta'sQuarterly Report on Form 10-Q for the period ended April 1, 2018)
3.4 Amended and Restated Bylaws of Fiesta (incorporated by reference to Exhibit 3.2 to Amendment No. 1 to Fiesta's Form 10, File No.001-35373, filed on January 26, 2012)
3.5 Amendment to Amended and Restated Bylaws of Fiesta (incorporated by reference to Exhibit 3.2 of Fiesta's Quarterly Report on Form10-Q for the period ended July 2, 2017)
3.6 Amendment to Amended and Restated ByLaws of Fiesta (incorporated by reference to Exhibit 3.2 of Fiesta's Quarterly Report on Form10-Q for the period ended April 1, 2018)
4.1 Form of Stock Certificate for Common Stock (incorporated by reference to Exhibit 4.4 to Amendment No.2 to Fiesta's Form 10, File No.001-35373, filed on March 14, 2012)
4.2 Description of Common Stock (incorporated by reference to Exhibit 4.2 to Fiesta's Annual Report on Form 10-K for the fiscal yearended December 29, 2019)
64

10.1 Form of Separation and Distribution Agreement among Fiesta, Carrols Restaurant Group, Inc. ("Carrols Restaurant Group") and CarrolsCorporation ("Carrols") (incorporated by reference to Exhibit 10.1 to Amendment No. 3 to Fiesta's Form 10, File No. 001-35373, filedon April 5, 2012)
10.2 Form of Tax Matters Agreement between Fiesta, Carrols and Carrols Restaurant Group (incorporated by reference to Exhibit 10.2 toAmendment No. 3 to Fiesta's Form 10, File No. 001-35373, filed on April 5, 2012)
10.3 Form of Employee Matters Agreement between Fiesta, Carrols and Carrols Restaurant Group (incorporated by reference to Exhibit 10.3to Amendment No. 3 to Fiesta's Form 10, File No. 001-35373, filed on April 5, 2012)
10.4 Form of Transition Services Agreement among Fiesta, Carrols Restaurant Group and Carrols (incorporated by reference to Exhibit 10.4to Amendment No. 3 to Fiesta's Form 10, File No. 001-35373, filed on April 5, 2012)
10.5 Fiesta Restaurant Group, Inc. 2012 Stock Incentive Plan (incorporated by reference to Exhibit 10.2 to Fiesta's Current Report on Form8-K filed on May 8, 2012)+
10.6 Executive Employment Agreement, dated as of February 24, 2017, between Fiesta and Richard Stockinger (incorporated by referenceto Exhibit 10.1 of Fiesta's Current Report on Form 8-K filed on February 27, 2017)+
10.7 Fiesta Restaurant Group, Inc. and Subsidiaries Deferred Compensation Plan (incorporated by reference to Exhibit 10.10 of Fiesta'sAmendment No. 1 to Registration Statement on Form 10 filed on January 26, 2012)+
10.8 Offer letter dated November 2, 2018 between Fiesta and Louis DiPietro (incorporated by reference to Exhibit 10.16 to Fiesta's AnnualReport on Form 10-K for the fiscal year ended December 29, 2019)+
10.9 Offer letter dated as of September 9, 2019 between Fiesta and Dirk Montgomery (incorporated by reference to Exhibit 10.1 of Fiesta'sQuarterly Report on Form 10-Q for the period ended September 29, 2019)+
10.10 Form of Agreement (incorporated by reference to Exhibit 10.18 to Fiesta's Annual Report on Form 10-K for the fiscal year endedDecember 29, 2019)+
10.11 Credit Agreement, dated as of November 30, 2017, among Fiesta, the guarantors named therein, the lenders named therein andJPMorgan Chase Bank, N.A., as administrative agent (incorporated by reference to Exhibit 10.1 of Fiesta's Current Report on Form 8-Kfiled on December 4, 2017)
10.12 Pledge and Security Agreement, dated as of November 30, 2017, among Fiesta, the guarantors named therein and JP Morgan ChaseBank, N,A., as administrative agent (incorporated by reference to Exhibit 10.2 of Fiesta's Current Report on Form 8-K filed onDecember 4, 2017)
10.13 Amendment to Credit Agreement, dated as of March 9, 2018. among Fiesta, the guarantors named therein, the lenders named thereinand JPMorgan Chase Bank, N.A., individually as a lender and as administrative agent (incorporated by reference to Exhibit 10.1 ofFiesta's Current Report on Form 8-K filed on March 12, 2018)
10.14 Amendment to Fiesta Restaurant Group, Inc. 2012 Stock Incentive Plan (incorporated by reference to Exhibit 10.1 of Fiesta's AnnualReport on Form 10-K filed on February 19, 2015)+
10.15 Cooperation Agreement, dated February 5, 2020, by and among Fiesta, AREX Capital Management, LP, AREX Capital Master Fund,LP, AREX Capital GP, LLC, AREX Capital Management GP, LLC and Andrew Rechtschaffen (incorporated by reference to Exhibit10.1 of Fiesta's Current Report on Form 8-K filed on February 7, 2020)
65

10.16 Second Amendment to Credit Agreement dated as of July 10, 2020 among Fiesta, the guarantors named therein, JPMorgan ChaseBank, N.A., as administrative agent, and the lenders party thereto (incorporated by reference to Exhibit 10.1 to Fiesta's Current Reporton Form 8-K filed on July 16, 2020)
10.17 First Amended and Restated Pledge and Security Agreement dated as of July 10, 2020 among Fiesta, the guarantors named therein andJPMorgan Chase Bank, N.A., as administrative agent (incorporated by reference to Exhibit 10.2 to Fiesta's Current Report on Form 8-Kfiled on July 16, 2020)
10.18 Credit Agreement dated as of November 23, 2020 among Fiesta, Fortress Credit Corp., as administrative agent and collateral agent, andthe lenders party thereto (incorporated by reference to Exhibit 10.1 to Fiesta's Current Report on Form 8-K filed on November 30,2020)
10.19 Security Agreement dated as of November 23, 2020 among Fiesta, the guarantors named therein and Fortress Credit Corp., asadministrative agent and collateral agent (incorporated by reference to Exhibit 10.2 to Fiesta's Current Report on Form 8-K filed onNovember 30, 2020)
10.20 Guarantee Agreement dated as of November 23, 2020 among the guarantors named therein and Fortress Credit Corp., as administrativeagent and collateral agent (incorporated by reference to Exhibit 10.3 to Fiesta's Current Report on Form 8-K filed on November 30,2020)
10.21 Offer letter dated as of August 5, 2019 between Fiesta and Hope Diaz#+
21.1 Subsidiaries of Fiesta#
23.1 Consent of Deloitte & Touche LLP#
31.1 Chief Executive Officer's Certificate Pursuant to Section 302 of the Sarbanes-Oxley Act of 2002 for Fiesta Restaurant Group, Inc.#
31.2 Chief Financial Officer's Certificate Pursuant to Section 302 of the Sarbanes-Oxley Act of 2002 for Fiesta Restaurant Group, Inc.#
32.1 Chief Executive Officer's Certificate Pursuant to 18 U.S.C. Section 1350, As Adopted Pursuant to Section 906 of the Sarbanes-OxleyAct of 2002 for Fiesta Restaurant Group, Inc.#
32.2 Chief Financial Officer's Certificate Pursuant to 18 U.S.C. Section 1350, As Adopted Pursuant to Section 906 of the Sarbanes-OxleyAct of 2002 for Fiesta Restaurant Group, Inc.#
101.INS Inline XBRL Instance Document—the instance document does not appear in the Interactive Data File because its XBRL tags areembedded within the Inline XBRL document
101.SCH Inline XBRL Taxonomy Extension Schema Document
101.CAL Inline XBRL Taxonomy Extension Calculation Linkbase Document
101.DEF Inline XBRL Taxonomy Extension Definition Linkbase Document
101.LAB Inline XBRL Taxonomy Extension Label Linkbase Document
101.PRE Inline XBRL Taxonomy Extension Presentation Linkbase Document
# Filed herewith.+ Compensatory plan or arrangement.
66

ITEM 16. FORM 10-K SUMMARY
None.
67

REPORT OF INDEPENDENT REGISTERED PUBLIC ACCOUNTING FIRM
To the stockholders and the Board of Directors of Fiesta Restaurant Group, Inc.
Opinion on the Financial Statements
We have audited the accompanying consolidated balance sheets of Fiesta Restaurant Group, Inc. and subsidiaries (the "Company") as of January 3, 2021 andDecember 29, 2019, the related consolidated statements of operations, changes in stockholders' equity, and cash flows, for each of the three years in the periodended January 3, 2021, and the related notes and the schedule listed in the Index at Item 15 (collectively referred to as the "financial statements"). In our opinion,the financial statements present fairly, in all material respects, the financial position of the Company as of January 3, 2021 and December 29, 2019, and the resultsof its operations and its cash flows for each of the three years in the period ended January 3, 2021, in conformity with accounting principles generally accepted inthe United States of America.
We have also audited, in accordance with the standards of the Public Company Accounting Oversight Board (United States) (PCAOB), the Company's internalcontrol over financial reporting as of January 3, 2021, based on criteria established in Internal Control – Integrated Framework (2013) issued by the Committee ofSponsoring Organizations of the Treadway Commission and our report dated March 4, 2021, expressed an unqualified opinion on the Company's internal controlover financial reporting.
Change in Accounting Principle
As discussed in Note 1 to the financial statements, the Company has changed its method of accounting for leases effective December 31, 2018 due to adoption ofFASB ASC 842, Leases, using the modified retrospective method.
Basis for Opinion
These financial statements are the responsibility of the Company's management. Our responsibility is to express an opinion on the Company's financial statementsbased on our audits. We are a public accounting firm registered with the PCAOB and are required to be independent with respect to the Company in accordancewith the U.S. federal securities laws and the applicable rules and regulations of the Securities and Exchange Commission and the PCAOB.
We conducted our audits in accordance with the standards of the PCAOB. Those standards require that we plan and perform the audit to obtain reasonableassurance about whether the financial statements are free of material misstatement, whether due to error or fraud. Our audits included performing procedures toassess the risks of material misstatement of the financial statements, whether due to error or fraud, and performing procedures that respond to those risks. Suchprocedures included examining, on a test basis, evidence regarding the amounts and disclosures in the financial statements. Our audits also included evaluating theaccounting principles used and significant estimates made by management, as well as evaluating the overall presentation of the financial statements. We believethat our audits provide a reasonable basis for our opinion.
Critical Audit Matter
The critical audit matter communicated below is a matter arising from the current-period audit of the financial statements that was communicated or required to becommunicated to the audit committee and that (1) relates to accounts or disclosures that are material to the financial statements and (2) involved our especiallychallenging, subjective, or complex judgments. The communication of critical audit matters does not alter in any way our opinion on the financial statements, takenas a whole, and we are not, by communicating the critical audit matter below, providing a separate opinion on the critical audit matter or on the accounts ordisclosures to which it relates.
Impairment of Long-Lived Assets – Refer to Notes 1 and 5 to the financial statements
Critical Audit Matter Description
The Company assesses the potential impairment of long-lived assets, principally property and equipment and operating lease right-of-use assets, whenever eventsor changes in circumstances indicate that the carrying value of the restaurant asset group may not be fully recoverable. The Company reviews its long-lived assets,principally property and equipment and lease ROU assets, for impairment at the restaurant level. In addition to considering management's plans, known regulatoryor governmental actions and damage due to acts of God (hurricanes, tornadoes, etc.), the Company considers a triggering event to have occurred related to aspecific restaurant if the restaurant's cash flows, exclusive of operating lease payments, for the last twelve months are less than a minimum threshold or ifconsistent levels of cash flows for the remaining lease period are less than the carrying value of the restaurant's assets. If an indicator of impairment exists for anyof its assets, an estimate of undiscounted future cash
F-1

flows, exclusive of operating lease payments, over the life of the primary asset for each restaurant is compared to that long-lived asset group's carrying value,excluding operating lease liabilities. If the carrying value is greater than the undiscounted cash flow, the Company then determines the fair value of the asset and ifan asset is determined to be impaired, the loss is measured by the excess of the carrying amount of the asset over its fair value. This process of assessing fair valuesrequires the use of estimates and assumptions, including the Company’s ability to sell or reuse the related assets and market conditions and, for right-of-use leaseassets, current market lease rent and discount rates, which are subject to a high degree of judgment. There is uncertainty in the projected undiscounted future cashflows used in the Company's impairment review analysis. Property and equipment, net as of January 3, 2021 was $161.1 million and Operating lease right-of-useassets was $261.3 million. During the year ended January 3, 2021 the Company recorded impairment charges of $8.4 million.
Given the judgment used by the Company to evaluate whether there are impairment indicators for long-lived assets as well as judgment in determining theundiscounted future cash flows when an impairment indicator has been identified and the fair value of the asset, auditing management’s judgments regardingindicators of potential impairment, estimated future cash flows and the fair value of assets involved especially subjective audit judgment.
How the Critical Audit Matter Was Addressed in the Audit
Our audit procedures in connection with identification of impairment indicators, recoverability of asset groups, determination of fair value of assets, andimpairment charges included the following, among others• We tested the effectiveness of controls over the evaluation for impairment of long-lived assets• We evaluated the impairment indicators considered by management and evaluated whether management had contemplated other potential factors that may be
an indicator of impairment.• We evaluated the reasonableness of management’s estimated future cash flows by comparing them to:
• Historical actual cash flows for the restaurant being evaluated• Strategic business plans and actions planned by the Company to support estimated future revenue• Chain and Fast Food Restaurants industry reports
• With the assistance of our fair value specialists, we evaluated current market lease rent and discount rate assumptions utilized in evaluating right-of-use assetsfor potential impairment.
/s/ Deloitte & Touche LLPDallas, TexasMarch 4, 2021
We have served as the Company's auditor since 2011.

Table of Contents
FIESTA RESTAURANT GROUP, INC.CONSOLIDATED BALANCE SHEETS
(In thousands, except share and per share data)
January 3, 2021 December 29, 2019ASSETS
Current assets:Cash $ 50,035 $ 13,413 Restricted cash 3,584 — Accounts receivable 8,884 7,933 Inventories 4,205 3,394 Prepaid rent 115 117 Income tax receivable 9,399 3,821 Prepaid expenses and other current assets 7,804 10,605
Total current assets 84,026 39,283 Property and equipment, net 161,081 211,944 Operating lease right-of-use assets 261,304 251,272 Goodwill 56,307 56,307 Other assets 6,025 9,835
Total assets $ 568,743 $ 568,641 LIABILITIES AND STOCKHOLDERS' EQUITY
Current liabilities:Current portion of long-term debt $ 1,015 $ 212 Accounts payable 13,339 14,776 Accrued payroll, related taxes and benefits 14,236 9,866 Accrued real estate taxes 6,600 6,497 Other current liabilities 29,719 32,269
Total current liabilities 64,909 63,620 Long-term debt, net of current portion 72,328 76,823 Operating lease liabilities 268,086 256,798 Deferred tax liabilities 4,109 4,759 Other non-current liabilities 11,530 8,405
Total liabilities 420,962 410,405 Commitments and contingenciesStockholders' equity:
Preferred stock, $0.01 par value; 20,000,000 shares authorized, no shares issued — — Common stock, $0.01 par value; 100,000,000 shares authorized, 28,278,320 and 27,461,697 shares issued,respectively, and 25,293,149 and 25,612,597 shares outstanding, respectively 273 271 Additional paid-in capital 176,614 173,132 Retained earnings (accumulated deficit) (8,327) 1,884 Treasury stock, at cost; 1,993,495 and 1,493,495 shares, respectively (20,779) (17,051)
Total stockholders' equity 147,781 158,236 Total liabilities and stockholders' equity $ 568,743 $ 568,641
The accompanying notes are an integral part of these consolidated financial statements.F-2
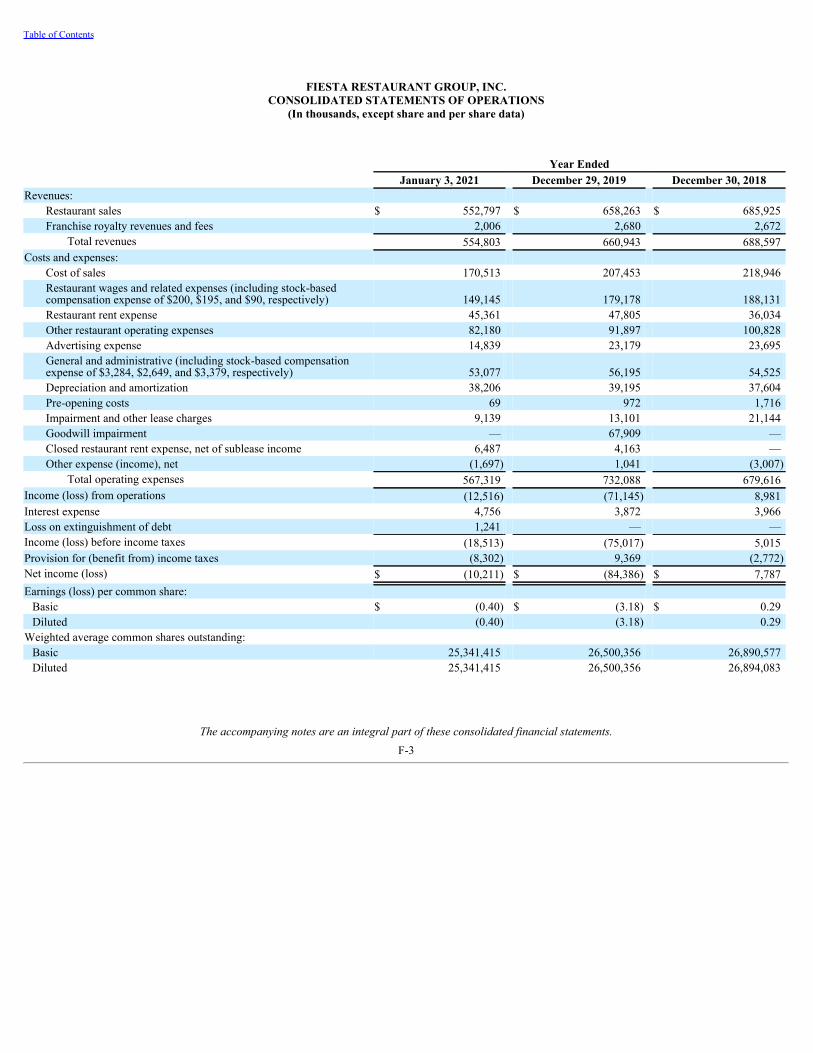
Table of Contents
FIESTA RESTAURANT GROUP, INC.CONSOLIDATED STATEMENTS OF OPERATIONS
(In thousands, except share and per share data)
Year EndedJanuary 3, 2021 December 29, 2019 December 30, 2018
Revenues:Restaurant sales $ 552,797 $ 658,263 $ 685,925 Franchise royalty revenues and fees 2,006 2,680 2,672
Total revenues 554,803 660,943 688,597 Costs and expenses:
Cost of sales 170,513 207,453 218,946 Restaurant wages and related expenses (including stock-basedcompensation expense of $200, $195, and $90, respectively) 149,145 179,178 188,131 Restaurant rent expense 45,361 47,805 36,034 Other restaurant operating expenses 82,180 91,897 100,828 Advertising expense 14,839 23,179 23,695 General and administrative (including stock-based compensationexpense of $3,284, $2,649, and $3,379, respectively) 53,077 56,195 54,525 Depreciation and amortization 38,206 39,195 37,604 Pre-opening costs 69 972 1,716 Impairment and other lease charges 9,139 13,101 21,144 Goodwill impairment — 67,909 — Closed restaurant rent expense, net of sublease income 6,487 4,163 — Other expense (income), net (1,697) 1,041 (3,007)
Total operating expenses 567,319 732,088 679,616 Income (loss) from operations (12,516) (71,145) 8,981 Interest expense 4,756 3,872 3,966 Loss on extinguishment of debt 1,241 — — Income (loss) before income taxes (18,513) (75,017) 5,015 Provision for (benefit from) income taxes (8,302) 9,369 (2,772)Net income (loss) $ (10,211) $ (84,386) $ 7,787 Earnings (loss) per common share:
Basic $ (0.40) $ (3.18) $ 0.29 Diluted (0.40) (3.18) 0.29
Weighted average common shares outstanding:Basic 25,341,415 26,500,356 26,890,577 Diluted 25,341,415 26,500,356 26,894,083
The accompanying notes are an integral part of these consolidated financial statements.F-3

Table of Contents
FIESTA RESTAURANT GROUP, INC.CONSOLIDATED STATEMENTS OF CHANGES IN STOCKHOLDERS' EQUITY
(In thousands, except share data)
Common Stock Additional Paid-In Capital
Retained Earnings (Accumulated
Deficit)Treasury
Stock
Total Stockholders'
EquityShares AmountBalance at December 31, 2017 26,847,458 $ 268 $ 166,823 $ 64,425 $ — $ 231,516
Stock-based compensation — — 3,469 — — 3,469 Vesting of restricted shares 123,888 2 (2) — — — Cumulative effect of adopting a newaccounting standard — — — 56 — 56 Purchase of treasury stock (112,358) — — — (2,769) (2,769)Net income — — — 7,787 — 7,787
Balance at December 30, 2018 26,858,988 270 170,290 72,268 (2,769) 240,059 Stock-based compensation — — 2,844 — — 2,844 Vesting of restricted shares 134,746 1 (2) — — (1)Cumulative effect of adopting a newaccounting standard — — — 14,002 — 14,002 Purchase of treasury stock (1,381,137) — — — (14,282) (14,282)Net loss — — — (84,386) — (84,386)
Balance at December 29, 2019 25,612,597 271 173,132 1,884 (17,051) 158,236 Stock-based compensation — — 3,484 — — 3,484 Vesting of restricted shares 180,552 2 (2) — — — Purchase of treasury stock (500,000) — — — (3,728) (3,728)Net loss — — — (10,211) — (10,211)
Balance at January 3, 2021 25,293,149 $ 273 $ 176,614 $ (8,327) $ (20,779) $ 147,781
The accompanying notes are an integral part of these consolidated financial statements.F-4
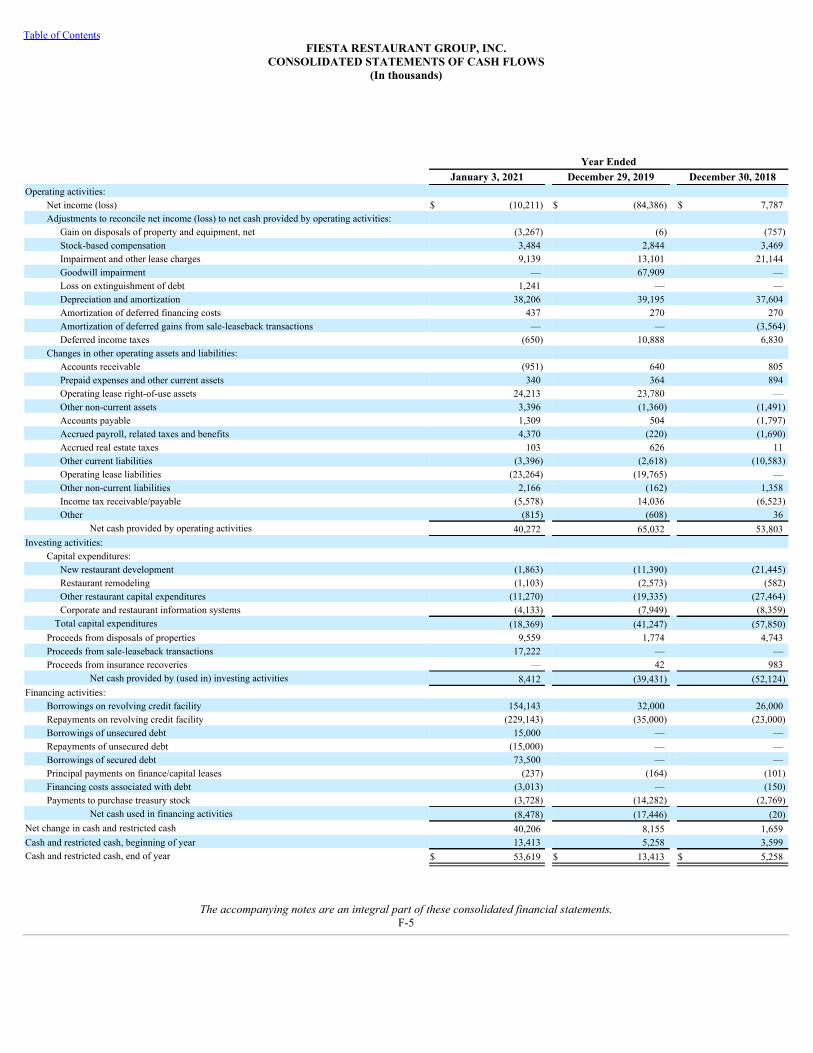
Table of ContentsFIESTA RESTAURANT GROUP, INC.
CONSOLIDATED STATEMENTS OF CASH FLOWS(In thousands)
Year EndedJanuary 3, 2021 December 29, 2019 December 30, 2018
Operating activities:Net income (loss) $ (10,211) $ (84,386) $ 7,787 Adjustments to reconcile net income (loss) to net cash provided by operating activities:
Gain on disposals of property and equipment, net (3,267) (6) (757)Stock-based compensation 3,484 2,844 3,469 Impairment and other lease charges 9,139 13,101 21,144 Goodwill impairment — 67,909 — Loss on extinguishment of debt 1,241 — — Depreciation and amortization 38,206 39,195 37,604 Amortization of deferred financing costs 437 270 270 Amortization of deferred gains from sale-leaseback transactions — — (3,564)Deferred income taxes (650) 10,888 6,830
Changes in other operating assets and liabilities:Accounts receivable (951) 640 805 Prepaid expenses and other current assets 340 364 894 Operating lease right-of-use assets 24,213 23,780 — Other non-current assets 3,396 (1,360) (1,491)Accounts payable 1,309 504 (1,797)Accrued payroll, related taxes and benefits 4,370 (220) (1,690)Accrued real estate taxes 103 626 11 Other current liabilities (3,396) (2,618) (10,583)Operating lease liabilities (23,264) (19,765) — Other non-current liabilities 2,166 (162) 1,358 Income tax receivable/payable (5,578) 14,036 (6,523)Other (815) (608) 36
Net cash provided by operating activities 40,272 65,032 53,803 Investing activities:
Capital expenditures:New restaurant development (1,863) (11,390) (21,445)Restaurant remodeling (1,103) (2,573) (582)Other restaurant capital expenditures (11,270) (19,335) (27,464)Corporate and restaurant information systems (4,133) (7,949) (8,359)
Total capital expenditures (18,369) (41,247) (57,850)Proceeds from disposals of properties 9,559 1,774 4,743 Proceeds from sale-leaseback transactions 17,222 — — Proceeds from insurance recoveries — 42 983
Net cash provided by (used in) investing activities 8,412 (39,431) (52,124)Financing activities:
Borrowings on revolving credit facility 154,143 32,000 26,000 Repayments on revolving credit facility (229,143) (35,000) (23,000)Borrowings of unsecured debt 15,000 — — Repayments of unsecured debt (15,000) — — Borrowings of secured debt 73,500 — — Principal payments on finance/capital leases (237) (164) (101)Financing costs associated with debt (3,013) — (150)Payments to purchase treasury stock (3,728) (14,282) (2,769)
Net cash used in financing activities (8,478) (17,446) (20)Net change in cash and restricted cash 40,206 8,155 1,659 Cash and restricted cash, beginning of year 13,413 5,258 3,599 Cash and restricted cash, end of year $ 53,619 $ 13,413 $ 5,258
The accompanying notes are an integral part of these consolidated financial statements.F-5
Table of ContentsFIESTA RESTAURANT GROUP, INC.
NOTES TO CONSOLIDATED FINANCIAL STATEMENTS(Dollars in thousands, except per share data)
1. Basis of Presentation
Business Description. Fiesta Restaurant Group, Inc. ("Fiesta Restaurant Group" or "Fiesta") owns, operates and franchises two fast-casual restaurant brandsthrough its wholly-owned subsidiaries Pollo Operations, Inc., and its subsidiaries, and Pollo Franchise, Inc., (collectively "Pollo Tropical") and Taco Cabana, Inc.and its subsidiaries (collectively "Taco Cabana"). Unless the context otherwise requires, Fiesta and its subsidiaries, Pollo Tropical and Taco Cabana, arecollectively referred to as the "Company." At January 3, 2021, the Company owned and operated 138 Pollo Tropical restaurants and 143 Taco Cabanarestaurants. All of the Company-owned Pollo Tropical restaurants are located in Florida, and all of the Company-owned Taco Cabana restaurants are located inTexas. At January 3, 2021, Fiesta franchised a total of 29 Pollo Tropical restaurants and six Taco Cabana restaurants. The franchised Pollo Tropical restaurantsinclude 17 in Puerto Rico, two in Panama, one in Guyana, two in Ecuador, one in the Bahamas, and five on college campuses and one at a hospital in Florida. Thefranchised Taco Cabana restaurants include six in New Mexico.
Basis of Consolidation. The consolidated financial statements presented herein reflect the consolidated financial position, results of operations and cash flowsof Fiesta and its wholly-owned subsidiaries. All intercompany transactions have been eliminated in consolidation.
Fiscal Year. The Company uses a 52–53 week fiscal year ending on the Sunday closest to December 31. The fiscal years ended December 29, 2019 andDecember 30, 2018, each contained 52 weeks. The fiscal year ended January 3, 2021 contained 53 weeks.
Use of Estimates. The preparation of the consolidated financial statements in conformity with U.S. Generally Accepted Accounting Principles ("GAAP")requires management to make estimates and assumptions that affect the reported amounts of assets and liabilities and disclosure of contingent assets and liabilitiesat the dates of the financial statements. Estimates also affect the reported amounts of expenses during the reporting periods. Significant items subject to suchestimates and assumptions include: insurance liabilities, evaluation for impairment of goodwill and long-lived assets, lease accounting matters, and deferredincome tax assets. Actual results could differ from those estimates. Due to the uncertainty associated with the unprecedented nature of the COVID-19 pandemicand the impact it will have on the Company's operations and future cash flows, it is reasonably possible that the estimates of future cash flows used in impairmentassessments will change in the near term and the effect of the change could be material. The Company's current estimates assume that operating restrictions,regulations and directives for restaurants and other changes related to COVID-19 will continue to have a significant impact through at least the first half of 2021with the greatest impact in the near term.
Concentrations of Risk. Food and supplies are ordered from approved suppliers and are shipped to the restaurants via distributors. Performance Food Group,Inc. is the primary distributor of food and beverage products and supplies for both Pollo Tropical and Taco Cabana. In the twelve months ended January 3, 2021,and December 29, 2019, Performance Food Group, Inc. accounted for approximately 96% and 85%, respectively, of the food and supplies delivered to restaurants.The Company's limited distributor relationships could have an adverse effect on the Company's operations.
Cash and Cash Equivalents. The Company considers all highly liquid investments with an original maturity of three months or less when purchased to be cashequivalents.
Restricted Cash. The Company's restricted cash is comprised of certain cash balances that are reserved as cash collateral for the Company's existing letters ofcredit.
Inventories. Inventories, primarily consisting of food and paper, are stated at the lower of cost (first-in, first-out) or market.
Property and Equipment. The Company capitalizes all direct costs incurred to construct and substantially improve its restaurants. These costs are depreciatedand charged to expense based upon their property classification when placed in service. Property and equipment is recorded at cost. Application development stagecosts for significant internally developed software
® ®
F-6
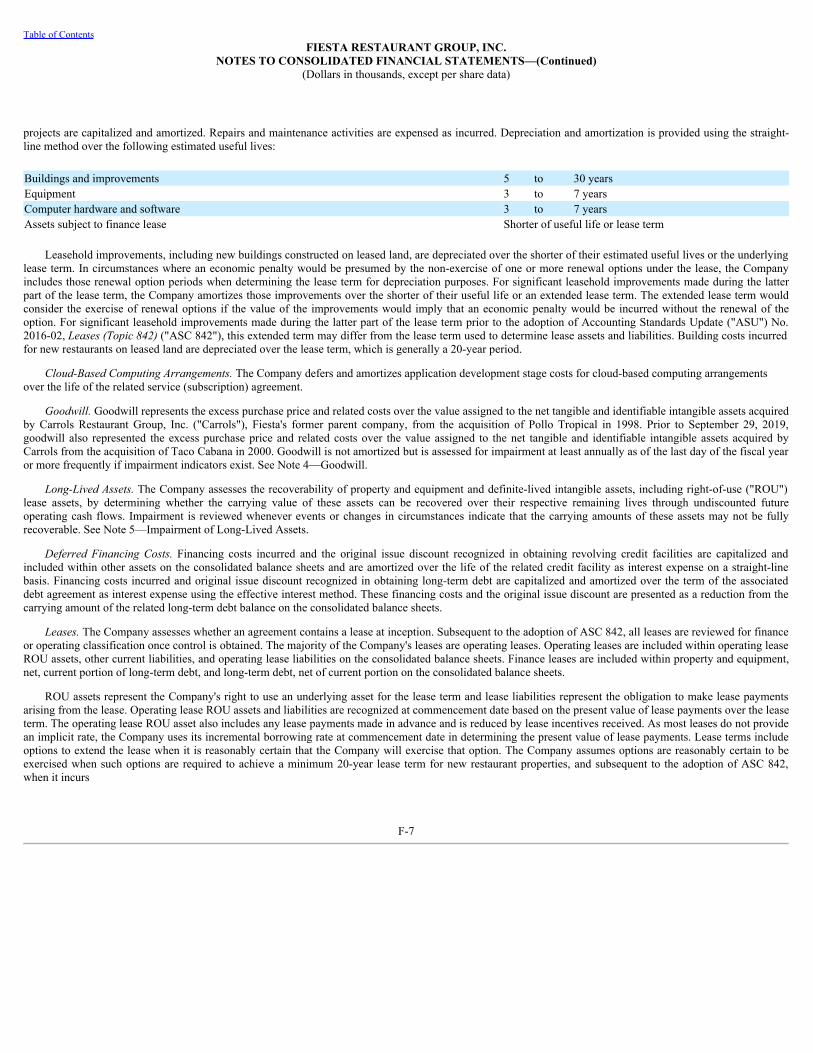
Table of ContentsFIESTA RESTAURANT GROUP, INC.
NOTES TO CONSOLIDATED FINANCIAL STATEMENTS—(Continued)(Dollars in thousands, except per share data)
projects are capitalized and amortized. Repairs and maintenance activities are expensed as incurred. Depreciation and amortization is provided using the straight-line method over the following estimated useful lives:
Buildings and improvements 5 to 30 yearsEquipment 3 to 7 yearsComputer hardware and software 3 to 7 yearsAssets subject to finance lease Shorter of useful life or lease term
Leasehold improvements, including new buildings constructed on leased land, are depreciated over the shorter of their estimated useful lives or the underlyinglease term. In circumstances where an economic penalty would be presumed by the non-exercise of one or more renewal options under the lease, the Companyincludes those renewal option periods when determining the lease term for depreciation purposes. For significant leasehold improvements made during the latterpart of the lease term, the Company amortizes those improvements over the shorter of their useful life or an extended lease term. The extended lease term wouldconsider the exercise of renewal options if the value of the improvements would imply that an economic penalty would be incurred without the renewal of theoption. For significant leasehold improvements made during the latter part of the lease term prior to the adoption of Accounting Standards Update ("ASU") No.2016-02, Leases (Topic 842) ("ASC 842"), this extended term may differ from the lease term used to determine lease assets and liabilities. Building costs incurredfor new restaurants on leased land are depreciated over the lease term, which is generally a 20-year period.
Cloud-Based Computing Arrangements. The Company defers and amortizes application development stage costs for cloud-based computing arrangementsover the life of the related service (subscription) agreement.
Goodwill. Goodwill represents the excess purchase price and related costs over the value assigned to the net tangible and identifiable intangible assets acquiredby Carrols Restaurant Group, Inc. ("Carrols"), Fiesta's former parent company, from the acquisition of Pollo Tropical in 1998. Prior to September 29, 2019,goodwill also represented the excess purchase price and related costs over the value assigned to the net tangible and identifiable intangible assets acquired byCarrols from the acquisition of Taco Cabana in 2000. Goodwill is not amortized but is assessed for impairment at least annually as of the last day of the fiscal yearor more frequently if impairment indicators exist. See Note 4—Goodwill.
Long-Lived Assets. The Company assesses the recoverability of property and equipment and definite-lived intangible assets, including right-of-use ("ROU")lease assets, by determining whether the carrying value of these assets can be recovered over their respective remaining lives through undiscounted futureoperating cash flows. Impairment is reviewed whenever events or changes in circumstances indicate that the carrying amounts of these assets may not be fullyrecoverable. See Note 5—Impairment of Long-Lived Assets.
Deferred Financing Costs. Financing costs incurred and the original issue discount recognized in obtaining revolving credit facilities are capitalized andincluded within other assets on the consolidated balance sheets and are amortized over the life of the related credit facility as interest expense on a straight-linebasis. Financing costs incurred and original issue discount recognized in obtaining long-term debt are capitalized and amortized over the term of the associateddebt agreement as interest expense using the effective interest method. These financing costs and the original issue discount are presented as a reduction from thecarrying amount of the related long-term debt balance on the consolidated balance sheets.
Leases. The Company assesses whether an agreement contains a lease at inception. Subsequent to the adoption of ASC 842, all leases are reviewed for financeor operating classification once control is obtained. The majority of the Company's leases are operating leases. Operating leases are included within operating leaseROU assets, other current liabilities, and operating lease liabilities on the consolidated balance sheets. Finance leases are included within property and equipment,net, current portion of long-term debt, and long-term debt, net of current portion on the consolidated balance sheets.
ROU assets represent the Company's right to use an underlying asset for the lease term and lease liabilities represent the obligation to make lease paymentsarising from the lease. Operating lease ROU assets and liabilities are recognized at commencement date based on the present value of lease payments over the leaseterm. The operating lease ROU asset also includes any lease payments made in advance and is reduced by lease incentives received. As most leases do not providean implicit rate, the Company uses its incremental borrowing rate at commencement date in determining the present value of lease payments. Lease terms includeoptions to extend the lease when it is reasonably certain that the Company will exercise that option. The Company assumes options are reasonably certain to beexercised when such options are required to achieve a minimum 20-year lease term for new restaurant properties, and subsequent to the adoption of ASC 842,when it incurs
F-7
Table of ContentsFIESTA RESTAURANT GROUP, INC.
NOTES TO CONSOLIDATED FINANCIAL STATEMENTS—(Continued)(Dollars in thousands, except per share data)
significant leasehold improvement costs near the end of a lease term. The Company uses judgment and available data to allocate consideration in a contract when itleases land and a building. The Company also uses judgment in determining its incremental borrowing rate, which includes selecting a yield curve based on asynthetic credit rating determined using a valuation model. Lease expense for lease payments is recognized on a straight-line basis over the lease term unless therelated ROU asset has been adjusted for an impairment charge. The Company has real estate lease agreements with lease and non-lease components, which areaccounted for as a single lease component. See Note 7—Leases.
Upon adoption of ASC 842 at the beginning of fiscal year 2019, the Company recognized lease liabilities and corresponding ROU lease assets for substantiallyall of the leases it previously accounted for as operating leases, including leases related to closed restaurant properties. The initial ROU assets were calculated asthe present value of the remaining operating lease payments using the Company's incremental borrowing rate as of December 31, 2018, reduced by accruedoccupancy costs such as certain closed-restaurant lease reserves, accrued rent (including accruals to expense operating lease payments on a straight-line basis),unamortized lease incentives and any unamortized sale-leaseback gains that resulted from off-market terms and increased by unamortized lease acquisition costs.Upon the adoption of ASC 842, the Company no longer records closed restaurant lease reserves, and ROU lease assets are reviewed for impairment with theCompany's long-lived assets.
The Company elected the practical expedient to combine lease and non-lease components of real estate contracts, which resulted in classification of certainoccupancy related expenses that are included in other restaurant operating expenses for periods prior to the adoption of ASC 842 as restaurant rent expenses in theconsolidated statement of operations for periods subsequent to the adoption of ASC 842. The Company separately presents rent expense related to its closedrestaurant locations and any sublease income related to these closed restaurant locations within closed restaurant rent expense, net of sublease income in theconsolidated statement of operations for periods subsequent to the adoption of ASC 842.
The Company recorded an initial adjustment to the opening balance of retained earnings of $14.0 million associated with previously deferred gains on sale-leaseback transactions and impairment of operating lease right-of-use assets as of the date of adoption. This adjustment consisted of $18.6 million in deferred gainson sale-leaseback transactions, net of a related deferred tax asset of $4.3 million and $0.2 million in impairment charges, net of tax. Gains or losses (adjusted forany off-market terms) from sale-leaseback transactions subsequent to the adoption of ASC 842 are recognized immediately.
Income Taxes. Deferred income tax assets and liabilities are based on the difference between the financial statement and tax bases of assets and liabilities asmeasured by the tax rates that are anticipated to be in effect when those differences reverse. The deferred tax provision generally represents the net change indeferred tax assets and liabilities during the period. The effect on deferred tax assets and liabilities of a change in tax rates is recognized in the results of operationsin the period that includes the enactment date. A valuation allowance is established when it is necessary to reduce deferred tax assets to amounts for whichrealization is more likely than not. The Company recognizes the tax benefit from an uncertain tax position only if it is more likely than not that the tax position willbe sustained on examination by the taxing authorities, based on the technical merits of the position.
Advertising Costs. All advertising costs are expensed as incurred.
Cost of Sales. The Company includes the cost of food, beverage and paper, net of any discounts, in cost of sales. Cost of sales excludes depreciation andamortization expense, which are presented separately on the consolidated statement of operations.
Pre-opening Costs. The Company's pre-opening costs are generally incurred beginning four to six months prior to a restaurant opening and generally includerestaurant employee wages and related expenses, travel expenditures, recruiting, training, promotional costs associated with the restaurant opening and rent,including any non-cash rent expense recognized during the construction period.
Insurance. The Company is insured for workers' compensation, general liability and medical insurance claims under policies where it pays all claims, subjectto stop-loss limitations both for individual claims and for general liability, medical insurance and certain workers' compensation claims in the aggregate. Losses areaccrued based upon estimates of the aggregate liability for claims based on the Company's experience and certain actuarial methods used to measure suchestimates. The Company does not discount any of its self-insurance obligations.
F-8
Table of ContentsFIESTA RESTAURANT GROUP, INC.
NOTES TO CONSOLIDATED FINANCIAL STATEMENTS—(Continued)(Dollars in thousands, except per share data)
Fair Value of Financial Instruments. Fair value is defined as the price that would be received to sell an asset or paid to transfer a liability in an orderlytransaction between market participants on the measurement date under current market conditions. In determining fair value, the accounting standards establish athree-level hierarchy for inputs used in measuring fair value as follows: Level 1 inputs are quoted prices in active markets for identical assets or liabilities; Level 2inputs are observable for the asset or liability, either directly or indirectly, including quoted prices in active markets for similar assets or liabilities; and Level 3inputs are unobservable and reflect management's own assumptions. The following methods were used to estimate the fair value of each class of financialinstruments for which it is practicable to estimate the fair value:
• Current Assets and Liabilities. The carrying values reported on the consolidated balance sheets of cash and restricted cash, accounts receivable andaccounts payable approximate fair value because of the short maturity of those financial instruments.
• Revolving Credit Borrowings. The fair value of outstanding revolving credit borrowings under the Company's former senior credit facility, which wasconsidered Level 2, was based on current LIBOR rates. The fair value of the Company's former senior credit facility was approximately $75.0 million atDecember 29, 2019. The carrying value of the Company's former senior credit facility was $75.0 million at December 29, 2019.
• Term Loan Borrowings. The fair value of outstanding term loan borrowings under the Company's new senior credit facility, which is considered Level 2,is based on current LIBOR rates. The fair value of the Company's senior credit facility was approximately $74.4 million at January 3, 2021. The carryingvalue of Company's new senior credit facility was $71.5 million at January 3, 2021.
See Note 5 for discussion of the fair value measurement of non-financial assets.
Revenue Recognition. Revenue is recognized upon transfer of promised products or services to customers in an amount that reflects the consideration theCompany received in exchange for those products or services. Revenues from the Company's owned and operated restaurants are recognized when payment istendered at the time of sale. Franchise royalty revenues are based on a percent of gross sales and are recorded as income when earned. Initial franchise fees andarea development fees associated with new franchise agreements are not distinct from the continuing rights and services offered by the Company during the term ofthe related franchise agreements and are recognized as income over the term of the related franchise agreements. A portion of the initial franchise fee is allocated totraining services and is recognized as revenue when the Company completes the training services. See Note 11—Business Segment Information.
Gift Cards. The Company sells gift cards to its customers in its restaurants and through select third parties. The Company recognizes revenue from gift cardsupon redemption by the customer. For unredeemed gift cards that the Company expects to be entitled to breakage, the Company recognizes expected breakage asrevenue in proportion to the pattern of redemption by the customers. The gift cards have no stated expiration dates. Revenues from unredeemed gift cards and giftcard liabilities, which are recorded in other current liabilities, are not material to the Company's financial statements.
Loyalty Programs. The Company's loyalty programs for Pollo Tropical (My Pollo™) and Taco Cabana (My TC™) allow eligible customers who enroll in theprogram to earn points for every dollar spent. After accumulating a certain number of points, the customer earns a reward that can be used for future purchases atthe Company's respective restaurants. Earned rewards generally expire 90 days after they are issued, however, certain issued rewards outstanding have expirationsup to ten months from January 3, 2021. Earned points that have not been converted to rewards do not currently expire.
The Company defers revenue associated with the estimated standalone selling price of points earned by customers as each point is earned, net of points theCompany does not expect to be redeemed. The estimated standalone selling price of each point earned is based on the estimated value of the reward which isexpected to be redeemed.
Loyalty revenue is recognized when a customer redeems an earned reward. For unredeemed rewards that the Company expects to be entitled to breakage, theCompany recognizes expected breakage as revenue in proportion to the pattern of redemption of the rewards by the customers. The costs associated with rewardsare recorded when they are redeemed and are included within cost of sales on the consolidated statements of operations. Deferred revenue associated with therewards is included within other current liabilities on the consolidated balance sheets.
Guidance Adopted in 2020. In August 2018, the Financial Accounting Standards Board ("FASB") issued ASU No. 2018-15, Customer's Accounting forImplementation Costs Incurred in a Cloud Computing Arrangement That is a Service Contract, which aligns the requirements for capitalizing implementationcosts incurred in a hosting arrangement that is a service contract with the requirements for capitalizing implementation costs incurred to develop or obtain internal-use software (and hosting arrangements that include an internal-use software license). The Company adopted this new accounting standard
F-9

Table of ContentsFIESTA RESTAURANT GROUP, INC.
NOTES TO CONSOLIDATED FINANCIAL STATEMENTS—(Continued)(Dollars in thousands, except per share data)
as of December 30, 2019 and applied it prospectively to all implementation costs incurred after the date of adoption. The standard did not have a material effect onthe Company's financial statements. The Company deferred and amortized application development stage costs for cloud-based computing arrangements over thelife of the related service (subscription) agreement in the same line item that the fees associated with the subscription arrangement were presented prior to adoptionof the new standard.
Recent Accounting Pronouncements. In December 2019, the FASB issued ASU No. 2019-12, Income Taxes (Topic 740) ("ASU No. 2019-12"), which is a partof the Simplification Initiative being undertaken by the FASB to reduce complexity of accounting standards. The amendments in this update simplify theaccounting for income taxes by removing certain exceptions, the most notable for the Company being the exception to the general methodology for calculatingincome taxes in an interim period when the year-to-date loss exceeds the anticipated loss for the full year. The guidance will be effective for interim and annualperiods beginning after December 15, 2020. Early adoption is permitted and any adjustments should be reflected as of the beginning of the annual period ofadoption. Amendments relevant to the Company should be applied on a prospective basis. The impact of the standard is largely dependent on interim andanticipated profit or loss in a given period, however the Company does not expect ASU No. 2019-12 to have a significant impact on its financial statements.
In March 2020, the FASB issued ASU No. 2020-04, Reference Rate Reform (Topic 848) ("ASU No. 2020-04"), which provides optional expedients andexceptions for applying GAAP to contracts, hedging relationships, and other transactions affected by reference rate reform if certain criteria are met. Theamendments in this update are effective as of March 12, 2020, through December 31, 2022. As of January 3, 2021, the Company's only exposure to LIBOR rateswas its new senior credit facility. Upon cessation of the LIBOR, the new senior credit facility will use a benchmark replacement rate. According to ASU No. 2020-04, modifications of contracts within the scope of Topic 470 Debt should be accounted for by prospectively adjusting the effective interest rate. The Company doesnot expect ASU No. 2020-04 to have a significant impact on its financial statements.
2. Prepaid Expenses and Other Current Assets
Prepaid expenses and other current assets, consist of the following:
January 3, 2021 December 29, 2019Prepaid contract expenses $ 4,279 $ 4,410 Assets held for sale 1,257 4,110 Other 2,268 2,085
$ 7,804 $ 10,605
(1) As of January 3, 2021, one closed Taco Cabana restaurant property owned by the Company was classified as held for sale. As of December 29, 2019, oneclosed Pollo Tropical restaurant property and two closed Taco Cabana restaurant properties owned by the Company were classified as held for sale.
3. Property and Equipment
Property and equipment consisted of the following:
January 3, 2021 December 29, 2019Land and land improvements $ 2,162 $ 21,051 Owned buildings 1,841 13,978 Leasehold improvements 217,000 212,413 Equipment 212,526 219,610 Assets subject to finance leases 2,733 2,713
436,262 469,765 Less accumulated depreciation and amortization (275,181) (257,821)
$ 161,081 $ 211,944
(1) Leasehold improvements include the cost of new buildings constructed on leased land.
(1)
(1)
F-10
Table of ContentsFIESTA RESTAURANT GROUP, INC.
NOTES TO CONSOLIDATED FINANCIAL STATEMENTS—(Continued)(Dollars in thousands, except per share data)
Assets subject to finance leases primarily pertain to buildings leased for certain restaurant locations and fleet vehicles, and had accumulated amortization atJanuary 3, 2021, and December 29, 2019, of $1.6 million and $1.3 million, respectively.
During the year ended January 3, 2021, the Company sold 13 properties, including seven properties as a part of sale-leaseback transactions. The net proceedsof the sales were $26.8 million and resulted in a net gain of $(3.8) million, which is included within other expense (income), net on the consolidated statement ofoperations.
Depreciation and amortization expense for all property and equipment for the years ended January 3, 2021; December 29, 2019; and December 30, 2018, was$38.2 million, $39.2 million, and $37.6 million, respectively.
4. Goodwill
The Company is required to review goodwill for impairment annually or more frequently when events and circumstances indicate that the carrying amountmay be impaired. If the determined fair value of goodwill is less than the related carrying amount, an impairment loss is recognized. The Company performs itsannual impairment assessment as of the last day of the fiscal year and has determined its reporting units to be its operating segments, Pollo Tropical and TacoCabana.
There were no changes in goodwill or goodwill impairment losses recorded during the years ended January 3, 2021 and December 30, 2018.
In performing its goodwill impairment test as of December 30, 2018, the Company compared the net book values of its reporting units to their estimated fairvalues, the latter determined by employing an income-based discounted cash flow analysis approach and a market-based approach, which was corroborated withother value indicators where available, such as comparable company earnings multiples.
As of June 30, 2019, the Company determined that a triggering event had occurred due to a sustained decrease in the market price of the Company's commonstock. In response to the triggering event, the Company performed a quantitative impairment test for both the Pollo Tropical and Taco Cabana reporting units. Fairvalue for each reporting unit was determined using a combination of the income-based approach and two market-based approaches. Based on the impairment testanalysis, the fair value of the Pollo Tropical reporting unit substantially exceeded its carrying amount, while the carrying amount for the Taco Cabana reportingunit exceeded its estimated fair value, which indicated an impairment of the Taco Cabana reporting unit. Lower than expected profitability and a lower profitabilityand growth outlook for the Taco Cabana reporting unit reduced its income-based and market-based approach fair value. The Company early adopted ASU 2017-04, which eliminates Step 2 from the goodwill impairment test, and requires recognition of an impairment charge for the amount by which the carrying amountexceeds the reporting unit's fair value, limited to the carrying value of the reporting unit's goodwill. In the second quarter of 2019, the Company recorded animpairment charge on the goodwill of its Taco Cabana reporting unit of $46.5 million, which represented the excess of the reporting unit's carrying value over itsfair value at June 30, 2019, and which was not deductible for tax purposes.
In addition, in response to a further decrease in the market price of the Company's common stock and lower than expected profitability in the third quarter of2019, the Company performed a quantitative impairment test for both the Pollo Tropical and Taco Cabana reporting units as of September 29, 2019. Based on theimpairment test analysis, which utilized the same approach used in the second quarter of 2019, the fair value of the Pollo Tropical reporting unit continued tosubstantially exceed its carrying amount, while the carrying amount for the Taco Cabana reporting unit exceeded its estimated fair value. In the third quarter of2019, the Company recorded an impairment charge on the goodwill of its Taco Cabana reporting unit of $21.4 million, of which $9.1 million was deductible fortax purposes at the time of acquisition and resulted in an income tax benefit of $2.1 million. The excess of the Taco Cabana reporting unit's carrying value over itsfair value was greater than the balance of the reporting unit's goodwill, resulting in a full impairment of the Taco Cabana reporting unit's goodwill.
The Company's annual goodwill impairment assessments as of January 3, 2021, and December 29, 2019, were performed using a qualitative assessment,which included examining key events and circumstances affecting fair value and indicated that it is more likely than not that the Pollo Tropical reporting unit's fairvalue is greater than its carrying value. There were no changes in goodwill or goodwill impairment losses for the Pollo Tropical reporting unit recorded during theyear ended December 29, 2019.
F-11

Table of ContentsFIESTA RESTAURANT GROUP, INC.
NOTES TO CONSOLIDATED FINANCIAL STATEMENTS—(Continued)(Dollars in thousands, except per share data)
A summary of changes in goodwill during the twelve months ended January 3, 2021, is as follows:
Pollo Tropical
TacoCabana Total
Balance at December 30, 2018:Goodwill, gross $ 56,307 $ 67,177 $ 123,484 Accumulated impairment losses — — — Goodwill 56,307 67,177 123,484 Impairment charges — (67,177) (67,177)
Balance at December 29, 2019:Goodwill, gross 56,307 67,177 123,484 Accumulated impairment losses — (67,177) (67,177)Goodwill 56,307 — 56,307
Balance at January 3, 2021:Goodwill, gross 56,307 67,177 123,484 Accumulated impairment losses — (67,177) (67,177)Goodwill $ 56,307 $ — $ 56,307
(1) Impairment charges for the year ended December 29, 2019, and accumulated impairment losses at January 3, 2021 and December 29, 2019, represent the fullgoodwill balance of the Taco Cabana reporting unit. Impairment charges during the year ended December 29, 2019, include $0.7 million previously classifiedas an intangible asset and included in other assets.
5. Impairment of Long-Lived Assets and Other Lease Charges
The Company reviews its long-lived assets, principally property and equipment and lease ROU assets, for impairment at the restaurant level. The Companyhas elected to exclude operating lease payments and liabilities from future cash flows and carrying values, respectively, in its impairment review. In addition toconsidering management's plans, known regulatory or governmental actions and damage due to acts of God (hurricanes, tornadoes, etc.), the Company considers atriggering event to have occurred related to a specific restaurant if the restaurant's cash flows, exclusive of operating lease payments, for the last twelve months areless than a minimum threshold or if consistent levels of cash flows for the remaining lease period are less than the carrying value of the restaurant's assets. If anindicator of impairment exists for any of its assets, an estimate of undiscounted future cash flows, exclusive of operating lease payments, over the life of theprimary asset for each restaurant is compared to that long-lived asset group's carrying value, excluding operating lease liabilities. If the carrying value is greaterthan the undiscounted cash flow, the Company then determines the fair value of the asset and if an asset is determined to be impaired, the loss is measured by theexcess of the carrying amount of the asset over its fair value. There is uncertainty in the projected undiscounted future cash flows used in the Company'simpairment review analysis. If actual performance does not achieve the projections, the Company may recognize impairment charges in future periods, and suchcharges could be material. Prior to the adoption of ASC 842 on December 31, 2018, for closed restaurant locations, the Company reviewed the future minimumlease payments and related ancillary costs from the date of the restaurant closure to the end of the remaining lease term and recorded a lease charge for the leaseliabilities to be incurred, net of any estimated sublease recoveries.
(1)
(1)
(1)
(1)
F-12

Table of ContentsFIESTA RESTAURANT GROUP, INC.
NOTES TO CONSOLIDATED FINANCIAL STATEMENTS—(Continued)(Dollars in thousands, except per share data)
A summary of impairment on long-lived assets and other lease charges recorded by segment is as follows:
Year Ended January 3, 2021 December 29, 2019 December 30, 2018Pollo Tropical $ 8,023 $ 15 $ 13,587 Taco Cabana 1,116 13,086 7,557
$ 9,139 $ 13,101 $ 21,144
In December 2018, based on a restaurant portfolio examination, the Company closed 14 Pollo Tropical restaurants and nine Taco Cabana restaurants. TheCompany also closed two Taco Cabana restaurants in the second quarter of 2018 as a result of the sale of a property and a lease termination, one Taco Cabanarestaurant in the fourth quarter of 2019 as a result of a lease termination, and 19 Taco Cabana restaurants in January 2020 as a result of a restaurant portfolioreview. Additionally, the Company closed one Pollo Tropical restaurant in the first quarter of 2020 as a result of a lease termination, one Pollo Tropical restaurantand one Taco Cabana restaurant as the result of the sale of a property and two Pollo Tropical restaurants as a result of a limited restaurant portfolio review in thethird quarter of 2020, and two Taco Cabana restaurants in the fourth quarter of 2020 as the result of the sale of a property and a lease termination.
Impairment and other lease charges for the twelve months ended January 3, 2021, consisted of impairment charges for Pollo Tropical and Taco Cabanarestaurants of $7.3 million and $1.1 million, respectively, and other lease charges for Pollo Tropical of $0.7 million. Impairment charges in 2020, which alsoincluded right-of-use asset impairment, were related primarily to three underperforming Pollo Tropical restaurants, two of which were closed in the third quarter of2020, as well as two underperforming Taco Cabana restaurants, for which continued sales declines coupled with the impact of expected sales declines resulted in adecrease in the estimated future cash flows. Additionally, impairment charges consisted of the write-down of saucing islands and self-service soda machines thatwere removed from Pollo Tropical dining rooms as a result of COVID-19 and the write-down of assets held for sale to their fair value less costs to sell for PolloTropical and Taco Cabana. Other lease charges in 2020 related primarily to lease termination charges of $0.9 million for Pollo Tropical restaurant locations theCompany decided not to develop and other lease termination charges of $0.2 million, net of a gain from lease terminations of $(0.4) million.
Impairment and other lease charges for the twelve months ended December 29, 2019, consisted of impairment charges for Pollo Tropical and Taco Cabanarestaurants of $0.8 million and $13.2 million, respectively, and net lease charge recoveries for Pollo Tropical and Taco Cabana restaurants of $(0.8) million and$(0.1) million, respectively. Impairment charges in 2019, which also included right-of-use asset impairment, were related primarily to 19 Taco Cabana restaurantsthat were subsequently closed in 2020, five of which were initially impaired in prior years, as well as previously closed Pollo Tropical restaurants and otherunderperforming Taco Cabana restaurants that the Company continued to operate. Net lease charge recoveries in 2019 were related primarily to lease terminationsfor previously closed restaurants.
Impairment and other lease charges for the twelve months ended December 30, 2018, consisted of impairment charges for Pollo Tropical and Taco Cabanarestaurants of $13.1 million and $6.0 million, respectively, and lease and other charges for Pollo Tropical and Taco Cabana restaurants (as well as a Taco Cabanaoffice location) of $0.5 million and $1.6 million, respectively, net of recoveries. Impairment charges in 2018 were related primarily to 14 Pollo Tropical restaurantsthat were closed in 2018, two of which were initially impaired in 2017, nine Taco Cabana restaurants that were closed in 2018, one of which was initially impairedin 2017, and one Pollo Topical restaurant and six Taco Cabana restaurants the Company continued to operate. Other lease charges, net of recoveries, in 2018 wererelated primarily to restaurants and an office location that were closed in 2018 as well as previously closed restaurants.
The Company determined the fair value of restaurant equipment, for those restaurants reviewed for impairment, based on current economic conditions, theCompany's history of using these assets in the operation of its business and the Company's expectation of how a market participant would value the assets. Inaddition, for those restaurants reviewed for impairment where the Company owns the land and building, the Company utilized third-party information such as abroker quoted value to determine the fair value of the property. The Company also utilized discounted future cash flows to determine the fair value of assets forcertain leased restaurants with positive discounted projected future cash flows. The Company utilized current market lease rent and discount rates to determine thefair value of right-of-use lease assets. These fair value asset measurements rely on significant unobservable inputs and are considered Level 3 in the fair valuehierarchy. The Level 3 assets measured at fair value associated with impairment charges recorded during the twelve months ended January 3, 2021, andDecember 29, 2019, totaled $2.8 million and $5.8 million, respectively.
F-13
Table of ContentsFIESTA RESTAURANT GROUP, INC.
NOTES TO CONSOLIDATED FINANCIAL STATEMENTS—(Continued)(Dollars in thousands, except per share data)
6. Other Liabilities
Other current liabilities consist of the following:
January 3, 2021 December 29, 2019Operating lease liabilities $ 19,803 $ 22,338 Accrued workers' compensation and general liability claims 3,619 4,354 Sales and property taxes 2,347 1,889 Accrued occupancy costs 330 891 Other 3,620 2,797
$ 29,719 $ 32,269
Other non-current liabilities consist of the following:
January 3, 2021 December 29, 2019Accrued workers' compensation and general liability claims 6,791 7,348 Accrued payroll taxes 3,003 — Deferred compensation 491 424 Other 1,245 633
$ 11,530 $ 8,405
Includes employer Social Security payroll tax deferred as a result of the Coronavirus Aid, Relief, and Economic Security Act (the "CARES Act").
The following table presents the activity in the closed restaurant reserve, which is included within other current liabilities on the consolidated balance sheets atJanuary 3, 2021 and December 29, 2019.
Year EndedJanuary 3, 2021 December 29, 2019
Balance, beginning of period $ 752 $ 8,819 Payments, net (259) (1,405)Other adjustments (275) (6,662)
Balance, end of period $ 218 $ 752
As a result of adopting ASC 842 on December 31, 2018, the portion of the closed restaurant reserve related to operating lease rental payments totaling $6.0million was reclassified and included as a component of the related ROU assets during the twelve months ended December 29, 2019. The portion of the closedrestaurant reserve related to variable ancillary lease costs was not reclassified and was not included as a reduction to ROU assets.
7. Leases
The Company utilizes land and buildings in its operations under various operating and finance lease agreements. The Company does not consider any one ofthese individual leases material to the Company's operations. Initial lease terms are generally for 20 years and, in many cases, provide for renewal options and inmost cases rent escalations. As of January 3, 2021, the Company's leases have remaining lease terms of 0.1 years to 21.4 years. Some of the Company's leasesinclude options to extend the lease for up to 40 years. Certain leases require contingent rent, determined as a percentage of sales as defined by the terms of theapplicable lease agreement. For most locations, the Company is obligated for occupancy related costs including payment of property taxes, insurance and utilities.Variable lease payments included in rent expense consist of such contingent rent, certain rent payments based on changes in an index and certain occupancy relatedcosts, such as variable common area maintenance expense and property taxes. The Company is not subject to residual value guarantees under any of the leaseagreements. Many of the Company's real estate leases contain usage restrictions, but its leases do not contain financial covenants and restrictions.
(1)
(1)
(1)
(1)
F-14
Table of ContentsFIESTA RESTAURANT GROUP, INC.
NOTES TO CONSOLIDATED FINANCIAL STATEMENTS—(Continued)(Dollars in thousands, except per share data)
During fiscal 2020, the Company completed seven sale-leaseback transactions with third parties, with transactions for two Pollo Tropical properties occurringin the third quarter of 2020 and transactions for three Pollo Tropical properties and two Taco Cabana properties occurring in the fourth quarter of 2020. The sale-leaseback transactions do not provide for any continuing involvement by the Company other than normal leases where the Company intends to use the propertyduring the lease term. The net proceeds of the sales were $17.2 million which resulted in a net gain of $3.0 million which is included within other expense(income), net on the consolidated statement of operations. The leases have initial terms of 20 years plus renewal options and have been accounted for as operatingleases.
Lease expense consisted of the following:
Year EndedJanuary 3, 2021 December 29, 2019
Operating lease cost $ 45,746 $ 45,414
Finance lease costs:Amortization of right-of-use assets $ 272 $ 202 Interest on lease liabilities 219 226
Total finance lease costs $ 491 $ 428
Variable lease costs $ 12,605 $ 12,050 Sublease income (5,300) (4,037)Total lease costs $ 53,542 $ 53,855
F-15

Table of ContentsFIESTA RESTAURANT GROUP, INC.
NOTES TO CONSOLIDATED FINANCIAL STATEMENTS—(Continued)(Dollars in thousands, except per share data)
Supplemental balance sheet information related to leases is as follows:
January 3, 2021 December 29, 2019Operating LeasesOperating lease right-of-use assets $ 261,304 $ 251,272
Other current liabilities $ 19,803 $ 22,338 Operating lease liabilities 268,086 256,798 Total operating lease liabilities $ 287,889 $ 279,136
Finance LeasesProperty and equipment, gross $ 2,733 $ 2,713 Accumulated amortization (1,599) (1,323)Property and equipment, net $ 1,134 $ 1,390
Current portion of long-term debt $ 265 $ 212 Long-term debt, net of current portion 1,593 1,823 Total finance lease liabilities $ 1,858 $ 2,035
Weighted Average Remaining Lease Term (in Years)Operating leases 11.6 12.1Finance leases 6.7 7.9
Weighted Average Discount RateOperating leases 7.60 % 7.67 %Finance leases 11.89 % 12.67 %
F-16
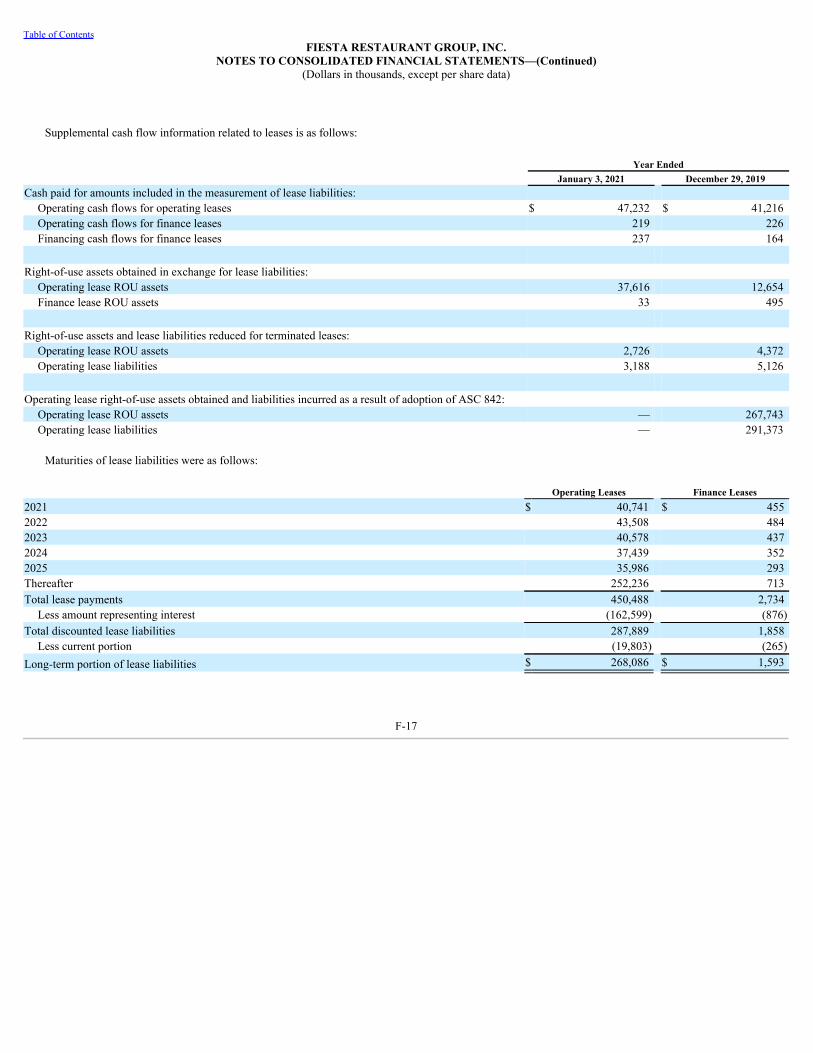
Table of ContentsFIESTA RESTAURANT GROUP, INC.
NOTES TO CONSOLIDATED FINANCIAL STATEMENTS—(Continued)(Dollars in thousands, except per share data)
Supplemental cash flow information related to leases is as follows:
Year EndedJanuary 3, 2021 December 29, 2019
Cash paid for amounts included in the measurement of lease liabilities:Operating cash flows for operating leases $ 47,232 $ 41,216 Operating cash flows for finance leases 219 226 Financing cash flows for finance leases 237 164
Right-of-use assets obtained in exchange for lease liabilities:Operating lease ROU assets 37,616 12,654 Finance lease ROU assets 33 495
Right-of-use assets and lease liabilities reduced for terminated leases:Operating lease ROU assets 2,726 4,372 Operating lease liabilities 3,188 5,126
Operating lease right-of-use assets obtained and liabilities incurred as a result of adoption of ASC 842:Operating lease ROU assets — 267,743 Operating lease liabilities — 291,373
Maturities of lease liabilities were as follows:
Operating Leases Finance Leases2021 $ 40,741 $ 455 2022 43,508 484 2023 40,578 437 2024 37,439 352 2025 35,986 293 Thereafter 252,236 713 Total lease payments 450,488 2,734
Less amount representing interest (162,599) (876)Total discounted lease liabilities 287,889 1,858
Less current portion (19,803) (265)Long-term portion of lease liabilities $ 268,086 $ 1,593
F-17

Table of ContentsFIESTA RESTAURANT GROUP, INC.
NOTES TO CONSOLIDATED FINANCIAL STATEMENTS—(Continued)(Dollars in thousands, except per share data)
The Company subleases land and buildings related to closed restaurant locations and a closed office location under various operating sublease agreements.Initial sublease terms are generally for the period of time remaining on the head lease term and, in some cases, subleases provide for renewal options and in mostcases rent escalations. As of January 3, 2021, the Company's subleases have remaining sublease terms of 1.3 years to 18.4 years. Some of the Company's subleasesinclude options to extend the lease for up to 25 years. Variable lease payments included in sublease income consist of certain occupancy related costs, such asvariable common area maintenance expense and property taxes where the Company makes the real estate payment and is reimbursed by the lessee. The subleaseagreements do not include residual value guarantees. Consistent with the Company's real estate leases, many of the subleases contain usage restrictions, but itssubleases do not contain financial covenants and restrictions.
The undiscounted cash flows to be received under operating subleases were as follows:
Operating Leases2021 $ 5,004 2022 4,971 2023 4,967 2024 5,024 2025 5,146 Thereafter 41,798 Total $ 66,910
Total rent expense on operating leases, including contingent rentals, prior to the adoption of ASC 842 was as follows:
Year EndedDecember 30, 2018
Minimum rent on real property, excluding rent included in pre-opening costs $ 35,881 Additional rent based on percentage of sales 153 Restaurant rent expense 36,034 Rent included in pre-opening costs 861 Administrative and equipment rent 850
$ 37,745
8. Long-Term Debt
Long-term debt at January 3, 2021 and December 29, 2019, consisted of the following:
January 3, 2021 December 29, 2019Term loan facility $ 75,000 $ — Revolving credit facility — 75,000 Finance leases 1,858 2,035
76,858 77,035 Less: current portion of long-term debt (1,015) (212)Less: unamortized discount and debt issuance costs (3,515) —
$ 72,328 $ 76,823
New Senior Credit Facility. On November 23, 2020, the Company terminated its former senior secured revolving credit facility, referred to as the "formersenior credit facility," and entered into a new senior secured credit facility among the Company and the lenders, which is referred to as the "new senior creditfacility." The new senior credit facility is comprised of a term loan facility (the "term loan facility") of $75.0 million and a revolving credit facility (the "revolvingcredit facility") of up to $10.0 million and matures on November 23, 2025. The new senior credit facility also provides for potential incremental
F-18
Table of ContentsFIESTA RESTAURANT GROUP, INC.
NOTES TO CONSOLIDATED FINANCIAL STATEMENTS—(Continued)(Dollars in thousands, except per share data)
term loan borrowing increases of up to $37.5 million in the aggregate, subject to, among other items, compliance with a minimum Total Leverage Ratio and otherterms specified in the new senior credit facility. On January 3, 2021, there were $75.0 million in outstanding borrowings, subject to an original issue discount,under the term loan facility and no borrowings under the revolving credit facility.
Under the new senior credit facility, the Company must repay the unpaid principal amount of the term loan facility quarterly which commences on March 31,2021, in an amount equal to 0.25% of the aggregate principal amount of the term loan facility on the effective date of the new senior credit facility, resulting inannual mandatory principal repayments of $0.8 million.
The new senior credit facility provides that the Company must maintain minimum Liquidity (as defined in the new senior credit facility) of $20.0 million (the"Liquidity Threshold") until January 3, 2022. The new senior credit facility also provides that the Company is not required to be in compliance with the TotalLeverage Ratio under the new senior credit facility until January 3, 2022, or the date in which Liquidity is less than the Liquidity Threshold. The Company will bepermitted to exercise equity cure rights with respect to compliance with the Total Leverage Ratio subject to certain restrictions as set forth in the new senior creditfacility.
Borrowings under the new senior credit facility bear interest at a rate per annum, at the Company's option, equal to either (all terms as defined in the newsenior credit facility):
1) the Base Rate plus the Applicable Margin of 6.75% with a minimum Base Rate of 2.00%, or2) the LIBOR (or Benchmark Replacement) Rate plus the Applicable Margin of 7.75%, with a minimum LIBOR (or Benchmark Replacement) Rate of
1.00%.
In addition, the new senior credit facility requires the Company to pay a commitment fee of 0.50% per annum on the daily amount of the unused portion of therevolving credit facility.
The outstanding borrowings under the revolving credit facility are prepayable without penalty or premium (other than customary breakage costs). Theoutstanding borrowings under the term loan facility are voluntarily prepayable by the Company, and the new senior credit facility requires that proceeds receivedwhen certain prepayment events (as defined in the new senior credit facility) occur must be used to reduce the outstanding revolver and term loan borrowingsunder the new senior credit facility. Voluntary and mandatory prepayments of the term loan facility are subject to payment of an Applicable Premium as definedunder the new senior credit facility.
The Company's new senior credit facility contains customary default provisions, including without limitation, a cross default provision pursuant to which it isan event of default under this facility if there is a default under any of the Company's indebtedness having an outstanding principal amount in excess of $5.0million which results in the acceleration of such indebtedness prior to its stated maturity or is caused by a failure to pay principal when due.
The new senior credit facility contains certain covenants, including, without limitation, those limiting the Company's ability to, among other things, incurindebtedness, incur liens, sell or acquire assets or businesses, change the character of its business in any material respects, engage in transactions with relatedparties, make certain investments, make certain restricted payments or pay dividends.
The Company's obligations under the new senior credit facility are secured by all of the Company's and its subsidiaries assets (including a pledge of all of thecapital stock and equity interests of our subsidiaries).
Under the new senior credit facility, the lenders may terminate their obligation to advance and may declare the unpaid balance of borrowings, or any partthereof, immediately due and payable upon the occurrence and during the continuance of customary defaults which include, without limitation, payment default,covenant defaults, bankruptcy type defaults, defaults on other indebtedness, certain judgments or upon the occurrence of a change of control (as specified in thenew senior credit facility).
As of January 3, 2021, the Company was in compliance with the financial covenants under its new senior credit facility. At January 3, 2021, $10.0 million wasavailable for borrowing under the revolving credit facility.
F-19
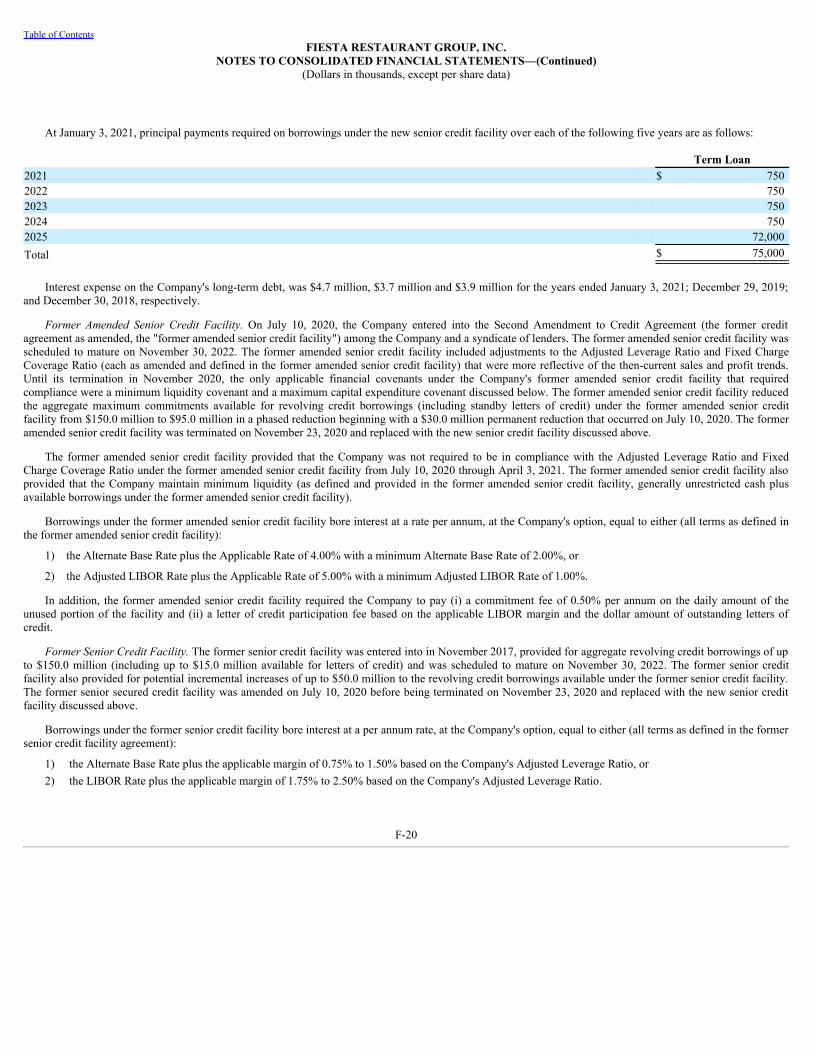
Table of ContentsFIESTA RESTAURANT GROUP, INC.
NOTES TO CONSOLIDATED FINANCIAL STATEMENTS—(Continued)(Dollars in thousands, except per share data)
At January 3, 2021, principal payments required on borrowings under the new senior credit facility over each of the following five years are as follows:
Term Loan2021 $ 750 2022 750 2023 750 2024 750 2025 72,000 Total $ 75,000
Interest expense on the Company's long-term debt, was $4.7 million, $3.7 million and $3.9 million for the years ended January 3, 2021; December 29, 2019;and December 30, 2018, respectively.
Former Amended Senior Credit Facility. On July 10, 2020, the Company entered into the Second Amendment to Credit Agreement (the former creditagreement as amended, the "former amended senior credit facility") among the Company and a syndicate of lenders. The former amended senior credit facility wasscheduled to mature on November 30, 2022. The former amended senior credit facility included adjustments to the Adjusted Leverage Ratio and Fixed ChargeCoverage Ratio (each as amended and defined in the former amended senior credit facility) that were more reflective of the then-current sales and profit trends.Until its termination in November 2020, the only applicable financial covenants under the Company's former amended senior credit facility that requiredcompliance were a minimum liquidity covenant and a maximum capital expenditure covenant discussed below. The former amended senior credit facility reducedthe aggregate maximum commitments available for revolving credit borrowings (including standby letters of credit) under the former amended senior creditfacility from $150.0 million to $95.0 million in a phased reduction beginning with a $30.0 million permanent reduction that occurred on July 10, 2020. The formeramended senior credit facility was terminated on November 23, 2020 and replaced with the new senior credit facility discussed above.
The former amended senior credit facility provided that the Company was not required to be in compliance with the Adjusted Leverage Ratio and FixedCharge Coverage Ratio under the former amended senior credit facility from July 10, 2020 through April 3, 2021. The former amended senior credit facility alsoprovided that the Company maintain minimum liquidity (as defined and provided in the former amended senior credit facility, generally unrestricted cash plusavailable borrowings under the former amended senior credit facility).
Borrowings under the former amended senior credit facility bore interest at a rate per annum, at the Company's option, equal to either (all terms as defined inthe former amended senior credit facility):
1) the Alternate Base Rate plus the Applicable Rate of 4.00% with a minimum Alternate Base Rate of 2.00%, or
2) the Adjusted LIBOR Rate plus the Applicable Rate of 5.00% with a minimum Adjusted LIBOR Rate of 1.00%.
In addition, the former amended senior credit facility required the Company to pay (i) a commitment fee of 0.50% per annum on the daily amount of theunused portion of the facility and (ii) a letter of credit participation fee based on the applicable LIBOR margin and the dollar amount of outstanding letters ofcredit.
Former Senior Credit Facility. The former senior credit facility was entered into in November 2017, provided for aggregate revolving credit borrowings of upto $150.0 million (including up to $15.0 million available for letters of credit) and was scheduled to mature on November 30, 2022. The former senior creditfacility also provided for potential incremental increases of up to $50.0 million to the revolving credit borrowings available under the former senior credit facility.The former senior secured credit facility was amended on July 10, 2020 before being terminated on November 23, 2020 and replaced with the new senior creditfacility discussed above.
Borrowings under the former senior credit facility bore interest at a per annum rate, at the Company's option, equal to either (all terms as defined in the formersenior credit facility agreement):
1) the Alternate Base Rate plus the applicable margin of 0.75% to 1.50% based on the Company's Adjusted Leverage Ratio, or2) the LIBOR Rate plus the applicable margin of 1.75% to 2.50% based on the Company's Adjusted Leverage Ratio.
F-20
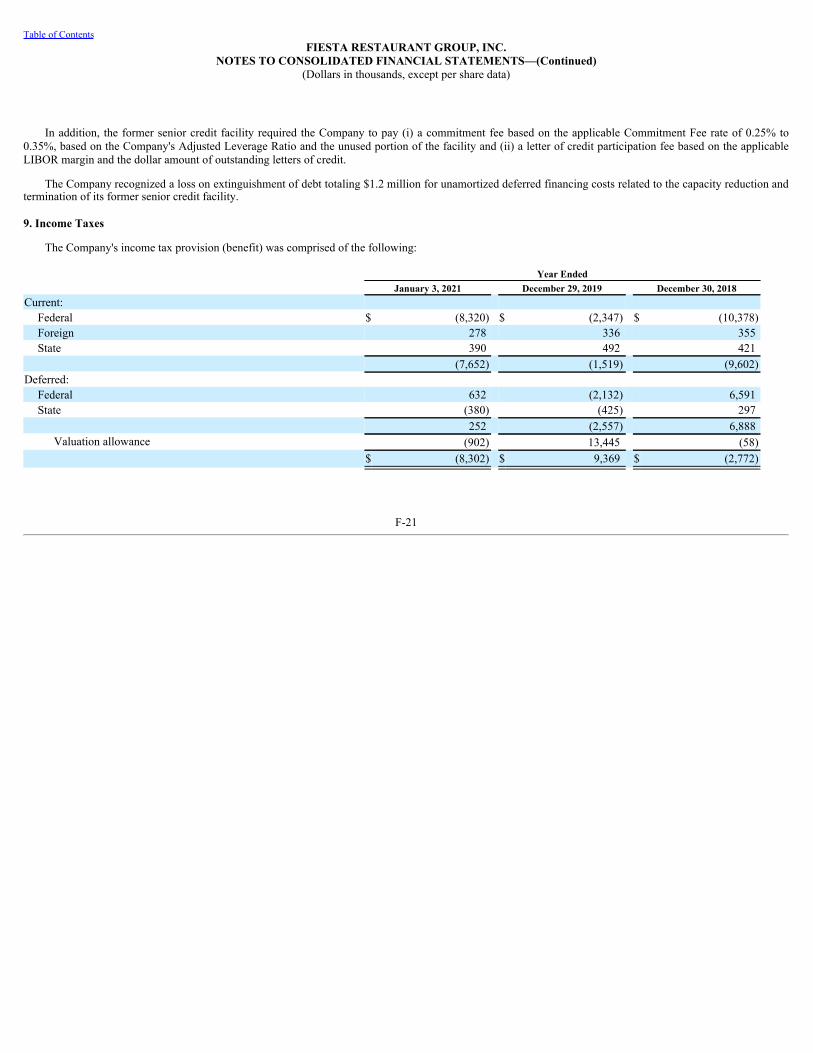
Table of ContentsFIESTA RESTAURANT GROUP, INC.
NOTES TO CONSOLIDATED FINANCIAL STATEMENTS—(Continued)(Dollars in thousands, except per share data)
In addition, the former senior credit facility required the Company to pay (i) a commitment fee based on the applicable Commitment Fee rate of 0.25% to0.35%, based on the Company's Adjusted Leverage Ratio and the unused portion of the facility and (ii) a letter of credit participation fee based on the applicableLIBOR margin and the dollar amount of outstanding letters of credit.
The Company recognized a loss on extinguishment of debt totaling $1.2 million for unamortized deferred financing costs related to the capacity reduction andtermination of its former senior credit facility.
9. Income Taxes
The Company's income tax provision (benefit) was comprised of the following:
Year Ended January 3, 2021 December 29, 2019 December 30, 2018Current:
Federal $ (8,320) $ (2,347) $ (10,378)Foreign 278 336 355 State 390 492 421
(7,652) (1,519) (9,602)Deferred:
Federal 632 (2,132) 6,591 State (380) (425) 297
252 (2,557) 6,888 Valuation allowance (902) 13,445 (58)
$ (8,302) $ 9,369 $ (2,772)
F-21
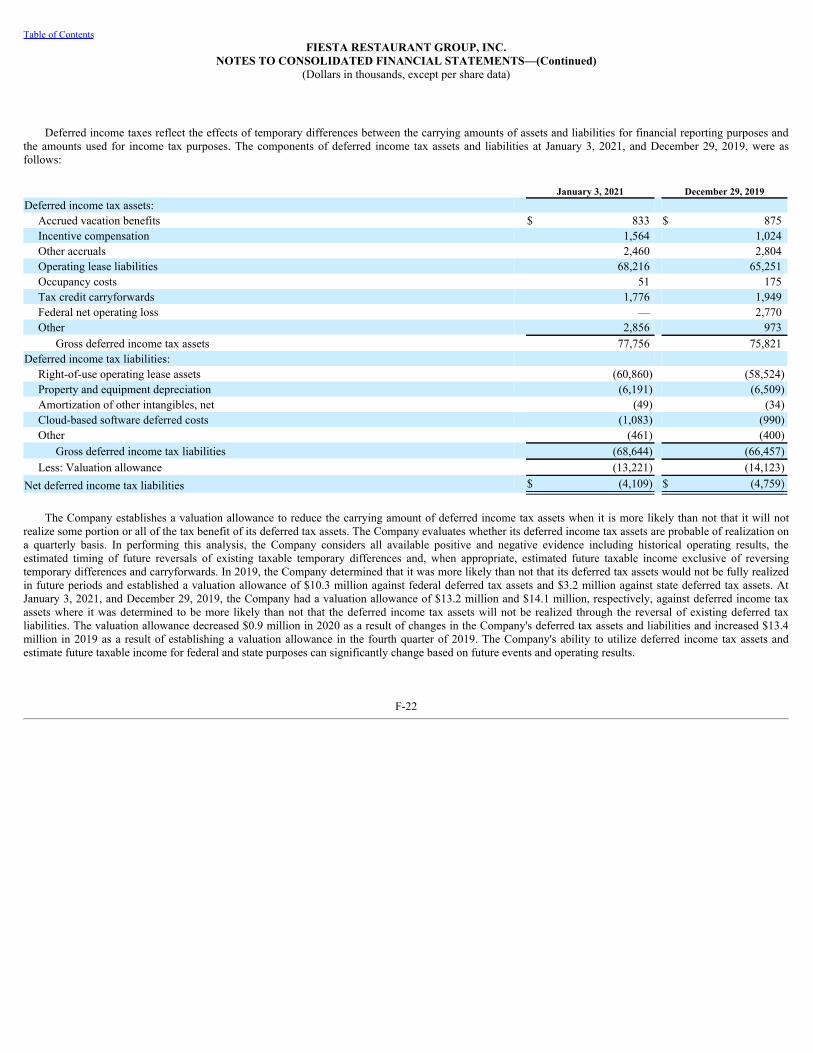
Table of ContentsFIESTA RESTAURANT GROUP, INC.
NOTES TO CONSOLIDATED FINANCIAL STATEMENTS—(Continued)(Dollars in thousands, except per share data)
Deferred income taxes reflect the effects of temporary differences between the carrying amounts of assets and liabilities for financial reporting purposes andthe amounts used for income tax purposes. The components of deferred income tax assets and liabilities at January 3, 2021, and December 29, 2019, were asfollows:
January 3, 2021 December 29, 2019Deferred income tax assets:
Accrued vacation benefits $ 833 $ 875 Incentive compensation 1,564 1,024 Other accruals 2,460 2,804 Operating lease liabilities 68,216 65,251 Occupancy costs 51 175 Tax credit carryforwards 1,776 1,949 Federal net operating loss — 2,770 Other 2,856 973 Gross deferred income tax assets 77,756 75,821
Deferred income tax liabilities: Right-of-use operating lease assets (60,860) (58,524) Property and equipment depreciation (6,191) (6,509) Amortization of other intangibles, net (49) (34) Cloud-based software deferred costs (1,083) (990) Other (461) (400) Gross deferred income tax liabilities (68,644) (66,457) Less: Valuation allowance (13,221) (14,123)
Net deferred income tax liabilities $ (4,109) $ (4,759)
The Company establishes a valuation allowance to reduce the carrying amount of deferred income tax assets when it is more likely than not that it will notrealize some portion or all of the tax benefit of its deferred tax assets. The Company evaluates whether its deferred income tax assets are probable of realization ona quarterly basis. In performing this analysis, the Company considers all available positive and negative evidence including historical operating results, theestimated timing of future reversals of existing taxable temporary differences and, when appropriate, estimated future taxable income exclusive of reversingtemporary differences and carryforwards. In 2019, the Company determined that it was more likely than not that its deferred tax assets would not be fully realizedin future periods and established a valuation allowance of $10.3 million against federal deferred tax assets and $3.2 million against state deferred tax assets. AtJanuary 3, 2021, and December 29, 2019, the Company had a valuation allowance of $13.2 million and $14.1 million, respectively, against deferred income taxassets where it was determined to be more likely than not that the deferred income tax assets will not be realized through the reversal of existing deferred taxliabilities. The valuation allowance decreased $0.9 million in 2020 as a result of changes in the Company's deferred tax assets and liabilities and increased $13.4million in 2019 as a result of establishing a valuation allowance in the fourth quarter of 2019. The Company's ability to utilize deferred income tax assets andestimate future taxable income for federal and state purposes can significantly change based on future events and operating results.
F-22

Table of ContentsFIESTA RESTAURANT GROUP, INC.
NOTES TO CONSOLIDATED FINANCIAL STATEMENTS—(Continued)(Dollars in thousands, except per share data)
The Company's effective tax rate was 44.8%, (12.5)%, and (55.3)% for the years ended January 3, 2021; December 29, 2019; and December 30, 2018,respectively. A reconciliation of the statutory federal income tax provision (benefit) to the effective tax provision (benefit) was as follows:
Year EndedJanuary 3, 2021 December 29, 2019 December 30, 2018
Statutory federal income tax provision (benefit) $ (3,888) $ (15,753) $ 1,053 State income taxes, net of federal benefit 8 49 552 Change in valuation allowance (902) 13,445 (58)Change in federal income tax rate and tax methods (3,846) (716) (3,977)Net share-based compensation-tax benefit deficiencies 352 235 178 Non-deductible goodwill — 12,357 — Non-deductible expenses 139 214 53 Foreign taxes 278 336 355 Employment tax credits (325) (381) (897)Foreign tax credits/deductions (241) (71) (75)Other 123 (346) 44
$ (8,302) $ 9,369 $ (2,772)
Tax Law Changes. In 2018, in conjunction with a cost segregation study conducted prior to filing its 2017 federal income tax return, the Company changed thedepreciation method for certain assets for federal income tax purposes to accelerate tax deductions. Changes in the Company's 2017 federal income tax return fromthe amounts recorded as of December 31, 2017 were primarily the result of changing the depreciable lives of assets for federal income tax purposes. These changesallowed the Company to record an incremental benefit of $4.0 million during the twelve months ended December 30, 2018.
On March 27, 2020, the CARES Act was signed into law. The CARES Act includes provisions that allow net operating losses in 2018, 2019, and 2020 to becarried back for up to five years and eliminates the 80% taxable income limitation on net operating loss deductions for 2018 through 2020. The CARES Act alsoincludes technical amendments that are retroactive to 2018 which permit certain assets to be classified as qualified improvement property and expensedimmediately. These changes allowed the Company to record an incremental benefit of $3.8 million, which represents the impact of carrying net operating lossesfrom 2018 and 2019 back to years with a higher federal corporate income tax rate as well as reclassifying certain assets as qualified improvement property andother changes to depreciation methods for certain assets made in conjunction with a cost segregation study conducted prior to filing the Company's 2019 federalincome tax return in 2020.
The Company recognizes interest and/or penalties related to uncertain tax positions in income tax expense. As of January 3, 2021, and December 29, 2019, theCompany had no unrecognized tax benefits and no accrued interest related to uncertain tax positions.
The Company has deferred tax benefits of $1.3 million related to employment tax credits which, if unutilized after various times beginning in 2038, will havea reduced value of $0.3 million. The Company also has a deferred tax benefit of $0.4 million (for which a valuation allowance has been established) related to aFlorida net operating loss carryforward that has no expiration date.
The Company is currently under examination by the Internal Revenue Service for the tax years 2015–2017. It is not currently under examination by any othertaxing jurisdictions. The tax years 2013–2020 remain open to examination by the taxing jurisdictions to which the Company is subject. Although it is notreasonably possible to estimate the amount by which unrecognized tax benefits may increase within the next twelve months due to uncertainties regarding thetiming of any examinations, the Company does not expect unrecognized tax benefits to significantly change in the next twelve months.
F-23

Table of ContentsFIESTA RESTAURANT GROUP, INC.
NOTES TO CONSOLIDATED FINANCIAL STATEMENTS—(Continued)(Dollars in thousands, except per share data)
10. Stockholders' Equity
Purchase of Treasury Stock
In 2018, the Company's board of directors approved a share repurchase program for up to 1,500,000 shares of the Company's common stock. In 2019, theCompany's board of directors approved increases to the share repurchase program of an additional 1,500,000 shares of the Company's common stock for anaggregate approval of 3,000,000 shares of the Company's common stock. Under the share repurchase program, shares may be repurchased from time to time inopen market transactions at prevailing market prices, in privately negotiated transactions or by other means in accordance with federal securities laws, includingRule 10b-18 under the Securities Exchange Act of 1934, as amended. The share repurchase program has no time limit and may be modified, suspended, supersededor terminated at any time by the Company's board of directors. The Company repurchased 500,000 shares of common stock valued at approximately $3.7 millionand 1,381,137 shares of common stock valued at approximately $14.3 million during the twelve months ended January 3, 2021, and December 29, 2019,respectively. The shares repurchased in 2020 were purchased on or before March 12, 2020. The repurchased shares are held as treasury stock at cost. TheCompany's new senior credit facility prohibits share repurchases, and the Company currently does not intend to repurchase additional shares of its common stockfor the foreseeable future.
Stock-Based Compensation
The Company established the Fiesta Restaurant Group, Inc. 2012 Stock Incentive Plan (the "Fiesta Plan") in order to be able to compensate its employees anddirectors by issuing stock options, stock appreciation rights, or stock awards to them under this plan. The aggregate number of shares of stock authorized for grantsor awards under the Fiesta Plan is 3,300,000. As of January 3, 2021, there were 676,853 shares available for future grants or awards under the Fiesta Plan.
During the years ended January 3, 2021; December 29, 2019; and December 30, 2018, the Company granted certain employees, and in 2019 and 2018 aconsultant, in the aggregate 422,446, 243,948, and 161,791 non-vested restricted shares, respectively, under the Fiesta Plan. Shares granted to employees duringthe years ended January 3, 2021; December 29, 2019; and December 30, 2018, vest and become non-forfeitable over a four-year vesting period. The shares grantedto the consultant vest over a three-year vesting period. Additionally, during the year ended January 3, 2021, the Company granted certain employees 366,445 non-vested restricted shares that fully vest and become non-forfeitable after two years. The weighted average fair value at the grant date for restricted non-vested sharesissued during the years ended January 3, 2021; December 29, 2019; and December 30, 2018, was $9.33 per share, $13.06 per share, and $18.70 per share,respectively.
During the years ended January 3, 2021; December 29, 2019; and December 30, 2018, the Company granted non-employee directors 79,260, 43,054, and31,146 non-vested restricted shares, respectively, under the Fiesta Plan. The weighted average fair value at the grant date for restricted non-vested shares issued todirectors during the twelve months ended January 3, 2021; December 29, 2019; and December 30, 2018, was $8.16 per share, $12.66 per share, and $20.71 pershare, respectively. These shares vest and become non-forfeitable over a one-year vesting period, or for certain grants to new directors, over a five-year vestingperiod.
During the years ended December 29, 2019 and December 30, 2018, the Company also granted certain employees 15,348 and 112,169 restricted stock units,respectively, under the Fiesta Plan subject to continued service requirements and market performance conditions.
• During the year ended and December 30, 2018, the Company granted certain executives 112,169 restricted stock units which vest in three tranches over athree-year vesting period subject to continued service and attainment of specified share price of the Company's common stock. Each tranche vests by theend of a one-year period if the specified target stock price condition for that year is met. If the specified target stock price condition for any tranche is notmet for the year, the cumulative unearned units will be rolled over to subsequent tranches on a pro rata basis. The number of shares into which theserestricted stock units convert ranges from no shares, if the service and market performance conditions are not met, to 112,169 shares, if the service andmarket performance conditions are met in the third year. The weighted average fair value at grant date for the restricted stock units granted to executivesin the year ended December 30, 2018 was $6.96 per share.
• During the year ended December 29, 2019, the Company granted a certain executive 15,348 restricted stock units, which vest in two tranches over a two-year vesting period subject to continued service and attainment of specified share price of the Company's common stock. Each tranche vests by the end ofa one-year period if the specified target stock price condition for that year is met. If the specified target stock price condition for the first tranche is notmet for the year, the cumulative unearned units will be rolled over to the subsequent tranche. The number of shares into which
F-24

Table of ContentsFIESTA RESTAURANT GROUP, INC.
NOTES TO CONSOLIDATED FINANCIAL STATEMENTS—(Continued)(Dollars in thousands, except per share data)
these restricted stock units convert ranges from no shares, if the service and market performance conditions are not met, to 15,348 shares, if the serviceand market performance conditions are met in the last vesting period. The weighted average fair value at grant date for the restricted stock units granted inthe year ended December 29, 2019 was $1.76 per share.
Stock-based compensation expense is measured at the grant date based on the fair value of the award and is recognized as expense over the applicablerequisite service period of the award (the vesting period) using the straight-line method, or for restricted stock units subject to market performance conditions usingthe accelerated method. Stock-based compensation expense for the years ended January 3, 2021; December 29, 2019; and December 30, 2018, was $3.5 million,$2.8 million, and $3.5 million, respectively. As of January 3, 2021, the total unrecognized stock-based compensation expense related to non-vested shares andrestricted stock units was approximately $7.9 million. At January 3, 2021, the remaining weighted average vesting period for non-vested restricted shares was 2.3years and restricted stock units was 0.2 years.
A summary of all non-vested restricted shares and restricted stock units activity for the year ended January 3, 2021, is as follows:
Non-Vested Shares Restricted Stock Units
Shares
Weighted AverageGrant Date Fair Value Units
Weighted AverageGrant Date Fair Value
Outstanding at December 29, 2019 355,605 $ 15.47 176,362 $ 9.42 Granted 868,151 9.22 — — Vested/Released (179,805) 15.22 (747) 32.44 Forfeited (52,275) 11.86 (25,030) 8.33 Outstanding at January 3, 2021 991,676 $ 10.26 150,585 $ 9.49
The fair value of the non-vested restricted shares and all other restricted stock units is based on the closing price on the date of grant. The fair value of therestricted stock units subject to market conditions was estimated using the Monte Carlo simulation method. The assumptions used to value grant restricted stockunits subject to market conditions are detailed below:
2019 2018Non-CEO Grant Non-CEO Grant
Grant date stock price $ 14.66 $ 18.70 Fair value at grant date $ 1.76 $ 6.96 Risk free interest rate 2.53 % 2.40 %Expected term (in years) 2 3Dividend yield — % — %Expected volatility 43.18 % 41.49 %
The fair value of the shares vested and released during the years ended January 3, 2021; December 29, 2019; and December 30, 2018, was $1.2 million, $1.8million, and $2.5 million, respectively.
F-25

Table of ContentsFIESTA RESTAURANT GROUP, INC.
NOTES TO CONSOLIDATED FINANCIAL STATEMENTS—(Continued)(Dollars in thousands, except per share data)
11. Business Segment Information
The Company owns, operates and franchises two restaurant brands, Pollo Tropical and Taco Cabana , each of which is an operating segment. Pollo Tropicalrestaurants feature fire-grilled and crispy citrus marinated chicken and other freshly prepared tropical-inspired menu items, while Taco Cabana restaurantsspecialize in Mexican-inspired food.
Each segment's accounting policies are the same as those described in the summary of significant accounting policies in Note 1. The primary measure ofsegment profit or loss used by the chief operating decision maker to assess performance and allocate resources is Adjusted EBITDA, which is defined as earningsattributable to the applicable operating segments before interest expense, income taxes, depreciation and amortization, impairment and other lease charges,goodwill impairment, closed restaurant rent expense, net of sublease income, stock-based compensation expense, other expense (income), net, and certainsignificant items for each segment that management believes are related to strategic changes and/or are not related to the ongoing operation of the Company'srestaurants as set forth in the reconciliation table below. The Company has included the presentation of Adjusted EBITDA for all periods presented.
The "Other" column includes corporate-related items not allocated to reportable segments and consists primarily of corporate-owned property and equipment,lease assets, miscellaneous prepaid costs, capitalized costs associated with the issuance of indebtedness, corporate cash accounts, and a current income taxreceivable.
® ®
F-26

Table of ContentsFIESTA RESTAURANT GROUP, INC.
NOTES TO CONSOLIDATED FINANCIAL STATEMENTS—(Continued)(Dollars in thousands, except per share data)
Year Ended Pollo Tropical Taco Cabana Other ConsolidatedJanuary 3, 2021:Restaurant sales $ 314,112 $ 238,685 $ — $ 552,797 Franchise revenue 1,246 760 — 2,006 Cost of sales 100,080 70,433 — 170,513 Restaurant wages and related expenses 74,328 74,817 — 149,145 Restaurant rent expense 22,773 22,588 — 45,361 Other restaurant operating expenses 47,354 34,826 — 82,180 Advertising expense 8,384 6,455 — 14,839 General and administrative expense 28,622 24,455 — 53,077 Adjusted EBITDA 36,517 8,463 — 44,980 Depreciation and amortization 21,112 17,094 — 38,206 Capital expenditures 9,163 7,214 1,992 18,369 December 29, 2019:Restaurant sales $ 361,693 $ 296,570 $ — $ 658,263 Franchise revenue 1,780 900 — 2,680 Cost of sales 115,119 92,334 — 207,453 Restaurant wages and related expenses 84,909 94,269 — 179,178 Restaurant rent expense 22,050 25,755 — 47,805 Other restaurant operating expenses 49,768 42,129 — 91,897 Advertising expense 12,358 10,821 — 23,179 General and administrative expense 31,023 25,172 — 56,195 Adjusted EBITDA 50,560 7,889 — 58,449 Depreciation and amortization 21,476 17,719 — 39,195 Capital expenditures 21,921 18,023 1,303 41,247 December 30, 2018:Restaurant sales $ 374,381 $ 311,544 $ — $ 685,925 Franchise revenue 1,815 857 — 2,672 Cost of sales 123,042 95,904 — 218,946 Restaurant wages and related expenses 87,025 101,106 — 188,131 Restaurant rent expense 17,457 18,577 — 36,034 Other restaurant operating expenses 51,757 49,071 — 100,828 Advertising expense 13,068 10,627 — 23,695 General and administrative expense 29,621 24,904 — 54,525 Adjusted EBITDA 54,903 13,059 — 67,962 Depreciation and amortization 21,372 16,232 — 37,604 Capital expenditures 27,667 28,886 1,297 57,850 Identifiable Assets:January 3, 2021 $ 311,905 $ 182,009 $ 74,829 $ 568,743 December 29, 2019 340,012 195,883 32,746 568,641
(1) Includes stock-based compensation expense of $200, $195 and $90 for the years ended January 3, 2021; December 29, 2019; and December 30, 2018,respectively.
(2) Includes stock-based compensation expense of $3,284, $2,649 and $3,379 for the years ended January 3, 2021; December 29, 2019; and December 30, 2018,respectively.
(1)
(2)
(1)
(2)
(1)
(2)
F-27

Table of ContentsFIESTA RESTAURANT GROUP, INC.
NOTES TO CONSOLIDATED FINANCIAL STATEMENTS—(Continued)(Dollars in thousands, except per share data)
A reconciliation of consolidated net income (loss) to Adjusted EBITDA follows:
Year Ended Pollo Tropical Taco Cabana Other ConsolidatedJanuary 3, 2021:Net loss $ (10,211)Benefit from income taxes (8,302)Income (loss) before taxes $ 2,557 $ (19,829) $ (1,241) $ (18,513)Add: Non-general and administrative expense adjustments: Depreciation and amortization 21,112 17,094 — 38,206 Impairment and other lease charges 8,023 1,116 — 9,139 Interest expense 2,405 2,351 — 4,756 Closed restaurant rent expense, net of sublease income 2,093 4,394 — 6,487
Loss on extinguishment of debt — — 1,241 1,241 Other expense (income), net (2,373) 676 — (1,697) Stock-based compensation expense in restaurant wages 73 127 — 200 Total non-general and administrative expense adjustments 31,333 25,758 1,241 58,332 General and administrative expense adjustments: Stock-based compensation expense 1,652 1,632 — 3,284 Restructuring costs and retention bonuses 551 556 — 1,107 Digital and brand repositioning costs 424 346 — 770 Total general and administrative expense adjustments 2,627 2,534 — 5,161 Adjusted EBITDA $ 36,517 $ 8,463 $ — $ 44,980
December 29, 2019:Net loss $ (84,386)Provision for income taxes 9,369 Income (loss) before taxes $ 20,300 $ (95,317) $ — $ (75,017)Add: Non-general and administrative expense adjustments: Depreciation and amortization 21,476 17,719 — 39,195 Impairment and other lease charges 15 13,086 — 13,101 Goodwill impairment — 67,909 — 67,909 Interest expense 1,953 1,919 — 3,872 Closed restaurant rent expense, net of sublease income 3,260 903 — 4,163 Other expense (income), net 862 179 — 1,041 Stock-based compensation expense in restaurant wages 70 125 — 195 Total non-general and administrative expense adjustments 27,636 101,840 — 129,476 General and administrative expense adjustments: Stock-based compensation expense 1,590 1,059 — 2,649 Restructuring costs and retention bonuses 827 137 — 964 Digital and brand repositioning costs 207 170 — 377 Total general and administrative expense adjustments 2,624 1,366 — 3,990 Adjusted EBITDA $ 50,560 $ 7,889 $ — $ 58,449
F-28

Table of ContentsFIESTA RESTAURANT GROUP, INC.
NOTES TO CONSOLIDATED FINANCIAL STATEMENTS—(Continued)(Dollars in thousands, except per share data)
Year Ended: Pollo Tropical Taco Cabana Other ConsolidatedDecember 30, 2018:Net income $ 7,787 Benefit from income taxes (2,772)Income (loss) before taxes $ 17,639 $ (12,624) $ — $ 5,015 Add: Non-general and administrative expense adjustments: Depreciation and amortization 21,372 16,232 — 37,604 Impairment and other lease charges 13,587 7,557 — 21,144 Interest expense 1,920 2,046 — 3,966 Other expense (income), net (1,225) (1,782) — (3,007) Stock-based compensation expense in restaurant wages 34 56 — 90 Total non-general and administrative expense adjustments 35,688 24,109 — 59,797 General and administrative expense adjustments: Stock-based compensation expense 1,885 1,494 — 3,379 Board and shareholder matter costs (328) (269) — (597) Restructuring costs and retention bonuses 196 349 — 545 Legal settlements and related costs (177) — — (177) Total general and administrative expense adjustments 1,576 1,574 — 3,150 Adjusted EBITDA $ 54,903 $ 13,059 $ — $ 67,962
12. Earnings (Loss) Per Share
Basic earnings (loss) per share ("EPS") is computed by dividing net income (loss) applicable to common shares by the weighted average number of commonshares outstanding during each period. Non-vested restricted shares contain a non-forfeitable right to receive dividends on a one-to-one per share ratio to commonshares and are thus considered participating securities. The impact of the participating securities is included in the computation of basic EPS pursuant to the two-class method. The two-class method of computing EPS is an earnings allocation formula that determines earnings attributable to common shares and participatingsecurities according to dividends declared (whether paid or unpaid) and participation rights in undistributed earnings. EPS is computed by dividing undistributedearnings allocated to common stockholders by the weighted average number of common shares outstanding for the period. In applying the two-class method,undistributed earnings are allocated to both common shares and non-vested restricted shares based on the weighted average shares outstanding during the period.
Diluted EPS reflects the potential dilution that could occur if the restricted stock units were to be converted into common shares. Restricted stock units withperformance conditions are only included in the diluted EPS calculation to the extent that performance conditions have been met at the measurement date. DilutedEPS is computed by adjusting the basic weighted average number of common shares by the dilutive effect of the restricted stock units, determined using thetreasury stock method.
Weighted average outstanding restricted stock units totaling 560 shares were not included in the computation of diluted earnings per share for the twelvemonths ended December 30, 2018, because including these restricted stock units would have been antidilutive. For the twelve months ended January 3, 2021 andDecember 29, 2019, all restricted stock units outstanding were excluded from the computation of diluted earnings per share because including restricted stock unitswould have been antidilutive as a result of the net loss in the period.
F-29
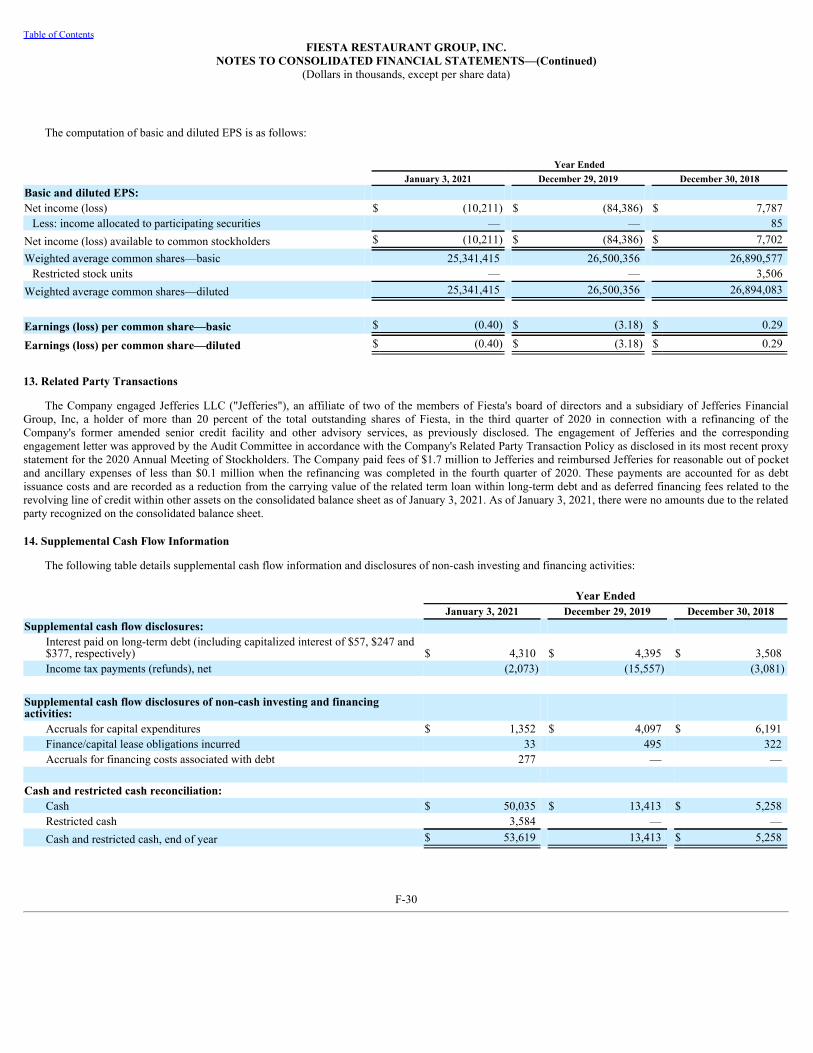
Table of ContentsFIESTA RESTAURANT GROUP, INC.
NOTES TO CONSOLIDATED FINANCIAL STATEMENTS—(Continued)(Dollars in thousands, except per share data)
The computation of basic and diluted EPS is as follows:
Year Ended January 3, 2021 December 29, 2019 December 30, 2018
Basic and diluted EPS:Net income (loss) $ (10,211) $ (84,386) $ 7,787
Less: income allocated to participating securities — — 85 Net income (loss) available to common stockholders $ (10,211) $ (84,386) $ 7,702 Weighted average common shares—basic 25,341,415 26,500,356 26,890,577
Restricted stock units — — 3,506 Weighted average common shares—diluted 25,341,415 26,500,356 26,894,083
Earnings (loss) per common share—basic $ (0.40) $ (3.18) $ 0.29
Earnings (loss) per common share—diluted $ (0.40) $ (3.18) $ 0.29
13. Related Party Transactions
The Company engaged Jefferies LLC ("Jefferies"), an affiliate of two of the members of Fiesta's board of directors and a subsidiary of Jefferies FinancialGroup, Inc, a holder of more than 20 percent of the total outstanding shares of Fiesta, in the third quarter of 2020 in connection with a refinancing of theCompany's former amended senior credit facility and other advisory services, as previously disclosed. The engagement of Jefferies and the correspondingengagement letter was approved by the Audit Committee in accordance with the Company's Related Party Transaction Policy as disclosed in its most recent proxystatement for the 2020 Annual Meeting of Stockholders. The Company paid fees of $1.7 million to Jefferies and reimbursed Jefferies for reasonable out of pocketand ancillary expenses of less than $0.1 million when the refinancing was completed in the fourth quarter of 2020. These payments are accounted for as debtissuance costs and are recorded as a reduction from the carrying value of the related term loan within long-term debt and as deferred financing fees related to therevolving line of credit within other assets on the consolidated balance sheet as of January 3, 2021. As of January 3, 2021, there were no amounts due to the relatedparty recognized on the consolidated balance sheet.
14. Supplemental Cash Flow Information
The following table details supplemental cash flow information and disclosures of non-cash investing and financing activities:
Year EndedJanuary 3, 2021 December 29, 2019 December 30, 2018
Supplemental cash flow disclosures:Interest paid on long-term debt (including capitalized interest of $57, $247 and$377, respectively) $ 4,310 $ 4,395 $ 3,508 Income tax payments (refunds), net (2,073) (15,557) (3,081)
Supplemental cash flow disclosures of non-cash investing and financingactivities:
Accruals for capital expenditures $ 1,352 $ 4,097 $ 6,191 Finance/capital lease obligations incurred 33 495 322 Accruals for financing costs associated with debt 277 — —
Cash and restricted cash reconciliation:Cash $ 50,035 $ 13,413 $ 5,258 Restricted cash 3,584 — — Cash and restricted cash, end of year $ 53,619 13,413 $ 5,258
F-30

Table of ContentsFIESTA RESTAURANT GROUP, INC.
NOTES TO CONSOLIDATED FINANCIAL STATEMENTS—(Continued)(Dollars in thousands, except per share data)
15. Commitments and Contingencies
Lease Assignments. Taco Cabana assigned one lease to a third party on a property where it no longer operates with a lease term expiring in 2029. Although theassignee is responsible for making the payments required by the lease, the Company remains secondarily liable as a surety with respect to the lease. Pollo Tropicalassigned one lease to a third party on a property where it no longer operates with a lease term expiring in 2033. Although the assignee is responsible for making thepayments required by the lease, the Company is a guarantor under the lease.
The maximum potential liability for future rental payments that the Company could be required to make under these leases at January 3, 2021, was $2.9million. The Company could also be obligated to pay property taxes and other lease-related costs. The obligations under these leases will generally continue todecrease over time as the operating leases expire. The Company does not believe it is probable that it will be ultimately responsible for the obligations under theseleases.
Legal Matters. The Company is a party to various legal proceedings incidental to the conduct of business. The Company does not believe that the outcome ofany of these matters will have a material effect on its consolidated financial statements. The Company records accruals for outstanding legal matters when itbelieves it is probable that a loss will be incurred and the amount can be reasonably estimated. The Company evaluates, on a quarterly basis, developments in legalmatters that could affect the amount of any accrual and developments that would make a loss contingency both probable and reasonably estimable. If a losscontingency is not both probable and estimable, the Company does not establish an accrued liability.
Contingency Related to Insurance Recoveries. During the third quarter of 2017, Texas and Florida were struck by Hurricane Harvey and Irma (the"Hurricanes"). Forty-three Taco Cabana and two Pollo Tropical restaurants in the Houston metropolitan area and all Pollo Tropical restaurants in Florida and theAtlanta metropolitan area were temporarily closed and affected by the Hurricanes to varying degrees. In the twelve months ended December 30, 2018, theCompany received business interruption and property damage insurance settlement proceeds of $2.8 million and $1.7 million, respectively, and recognized otherincome of $2.1 million and $1.4 million for Pollo Tropical and Taco Cabana, respectively, related to the Hurricanes. The Company received a final settlementrelated to the Hurricanes as of December 30, 2018.
16. Retirement Plans
Fiesta offers certain of the Company's salaried employees the option to participate in the Fiesta Corporation Retirement Savings Plan (the "Retirement Plan").The Retirement Plan includes a savings option pursuant to section 401(k) of the Internal Revenue Code in addition to a post-tax savings option. Fiesta may elect tocontribute to the Retirement Plan on an annual basis. Contributions made by Fiesta to the Retirement Plan for the Company's employees are made after the end ofeach plan year. For 2019 and 2018, Fiesta's discretionary annual contribution is equal to 50% of the employee's contribution up to the first 6% of eligiblecompensation for a maximum Fiesta contribution of 3% of eligible compensation per participating employee. Under the Retirement Plan, Fiesta contributions priorto 2020 begin to vest after one year and fully vest after five years of service. A year of service is defined as a plan year during which an employee completes atleast 1,000 hours of service. For 2020, Fiesta's discretionary contribution is equal to 100% of the first 3% of eligible compensation plus 50% of the next 2% ofeligible compensation through the second quarter of 2020. On July 1, 2020, the Company suspended its employer matching contribution through the end of theyear as a result of the COVID-19 Pandemic. Fiesta contributions for 2020 will vest immediately. Participating employees may contribute up to 50% of their salaryannually to either of the savings options, subject to other limitations. The employees have various investment options available under a trust established by theRetirement Plan. Retirement Plan employer matching expense for the years ended January 3, 2021; December 29, 2019; and December 30, 2018, was $0.3 million,$0.4 million and $0.5 million respectively.
Fiesta also has a Deferred Compensation Plan which permits employees not eligible to participate in the Retirement Plan because they have been excluded as"highly compensated" employees (as so defined in the Retirement Plan) to voluntarily defer portions of their base salary and annual bonus. All amounts deferredby the participants earn interest at 8% per annum. There is no Company matching on any portion of the funds. At January 3, 2021, and December 29, 2019, a totalof $0.5 million and $0.4 million, respectively, was deferred by the Company's employees under the Deferred Compensation Plan, including accrued interest.
F-31

Table of ContentsFIESTA RESTAURANT GROUP, INC.
NOTES TO CONSOLIDATED FINANCIAL STATEMENTS—(Continued)(Dollars in thousands, except per share data)
17. Selected Quarterly Financial and Earnings Data (Unaudited)
Year Ended January 3, 2021
First QuarterSecondQuarter Third Quarter Fourth Quarter
Revenue $ 146,699 $ 121,868 $ 137,332 $ 148,904 Income (loss) from operations (9,361) (8,849) 1,822 3,872 Net income (loss) (7,317) (8,343) 4,593 856 Earnings (loss) per common share—basic $ (0.29) $ (0.33) $ 0.18 $ 0.03 Earnings (loss) per common share—diluted (0.29) (0.33) 0.18 0.03
Year Ended December 29, 2019
First QuarterSecondQuarter Third Quarter Fourth Quarter
Revenue $ 165,852 $ 171,381 $ 164,248 $ 159,462 Income (loss) from operations 4,469 (41,850) (24,305) (9,459)Net income (loss) 2,289 (43,440) (22,182) (21,053)Earnings (loss) per common share—basic $ 0.08 $ (1.62) $ (0.84) $ (0.82)Earnings (loss) per common share—diluted 0.08 (1.62) (0.84) (0.82)
(1) The Company recognized impairment and other lease charges of $4.2 million, $2.3 million, $2.4 million and $0.2 million in the first, second, third and fourthquarters of 2020, respectively, and $(0.3) million, $1.8 million, $3.3 million and $8.4 million in the first, second, third and fourth quarters of 2019,respectively. See Note 5—Impairment of Long-lived Assets and Other Lease Charges. The Company recognized goodwill impairment charges of $46.5million (which was not tax deductible) and $21.4 million (of which $9.1 million was tax deductible) in the second and third quarters of 2019, respectively.
(2) The Company recorded a valuation allowance on its deferred income tax assets, which resulted in a $13.5 million increase in income taxes in the fourthquarter of 2019.
18. Subsequent Events
Subsequent to January 3, 2021, the Company sold one restaurant property in a sale-leaseback transaction for total net proceeds of $1.3 million.
(1)
(2)
(1)
F-32

Table of Contents
FIESTA RESTAURANT GROUP, INC.SCHEDULE II—VALUATION AND QUALIFYING ACCOUNTS
(In thousands of dollars)
Column B Column C Column D Column E
Description
Balance at beginning of
period
Charged to costs and expenses
Charged to other
accounts Deduction
Balance at end of
periodYear ended January 3, 2021:
Deferred income tax valuation allowance $ 14,123 $ (902) $ — $ — $ 13,221 Year ended December 29, 2019:
Deferred income tax valuation allowance 678 13,445 — — 14,123 Year ended December 30, 2018:
Deferred income tax valuation allowance 736 (58) — — 678
F-33
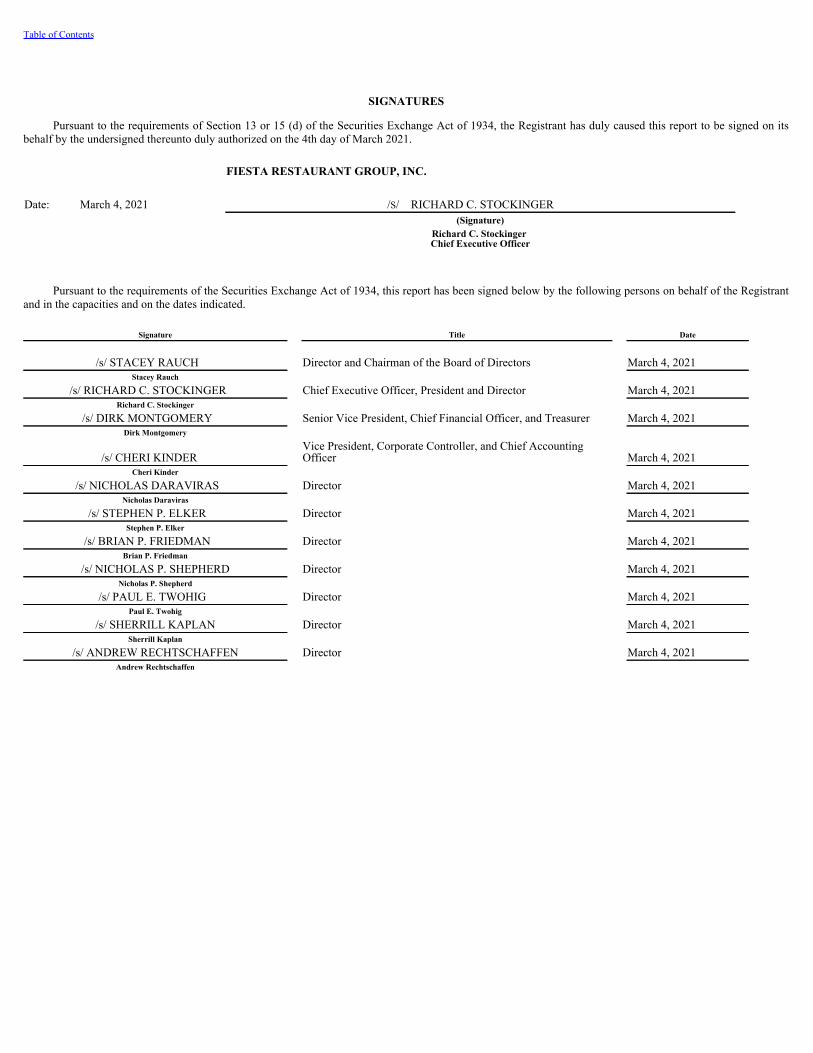
Table of Contents
SIGNATURES
Pursuant to the requirements of Section 13 or 15 (d) of the Securities Exchange Act of 1934, the Registrant has duly caused this report to be signed on itsbehalf by the undersigned thereunto duly authorized on the 4th day of March 2021.
FIESTA RESTAURANT GROUP, INC.
Date: March 4, 2021 /S/ RICHARD C. STOCKINGER (Signature)
Richard C. Stockinger Chief Executive Officer
Pursuant to the requirements of the Securities Exchange Act of 1934, this report has been signed below by the following persons on behalf of the Registrantand in the capacities and on the dates indicated.
Signature Title Date
/s/ STACEY RAUCH Director and Chairman of the Board of Directors March 4, 2021Stacey Rauch
/s/ RICHARD C. STOCKINGER Chief Executive Officer, President and Director March 4, 2021Richard C. Stockinger
/s/ DIRK MONTGOMERY Senior Vice President, Chief Financial Officer, and Treasurer March 4, 2021Dirk Montgomery
/s/ CHERI KINDER Vice President, Corporate Controller, and Chief AccountingOfficer March 4, 2021
Cheri Kinder
/s/ NICHOLAS DARAVIRAS Director March 4, 2021Nicholas Daraviras
/s/ STEPHEN P. ELKER Director March 4, 2021Stephen P. Elker
/s/ BRIAN P. FRIEDMAN Director March 4, 2021Brian P. Friedman
/s/ NICHOLAS P. SHEPHERD Director March 4, 2021Nicholas P. Shepherd
/s/ PAUL E. TWOHIG Director March 4, 2021Paul E. Twohig
/s/ SHERRILL KAPLAN Director March 4, 2021Sherrill Kaplan
/s/ ANDREW RECHTSCHAFFEN Director March 4, 2021Andrew Rechtschaffen

Exhibit 10.21
August 5, 2019
Dear Ms. Hope Diaz:
I am pleased to extend this conditional offer of employment as Chief Marketing Officer with Fiesta Restaurant Group, Inc. {"Fiesta"), reporting toRich Stockinger, President and Chief Executive Officer. Your new office will be located at 7255 Corporate Center Drive, Miami, Florida 33126. Ipropose a start date of September 14, 2019 and am excited to work with you.
The following is a brief outline of the major components of this conditional offer of employment:
Base CompensationYour annualized base salary will be $325,000. You will be paid biweekly.
Discretionary BonusYour bonus target is equal to 60% of your annual base salary, subject to the terms of the Fiesta bonus plan applicable to you and subject to thediscretion of the Compensation Committee of the Board of Directors.
Sign-on BonusYou are eligible for a one-time special incentive bonus of $150,000 to be paid on or before March 15, 2020. In the event you voluntarily terminatefrom the Company other than for Good Reason (as defined in the Severance Agreement described below) within one year of the payment date ofthe sign on bonus, the sign on bonus must be refunded and you authorize the Company to deduct this obligation insofar as possible, from anysalary, wages, accrued vacation, bonus or other payments or employee benefits to which you may be entitled or business expense reimbursementamounts that may be due to you. You agree that you remain liable for any amount that is not withheld from your wages. By signing this offer letter,you accept the terms of this agreement.
Special Retention BonusYou are eligible for a one-time special incentive bonus of $375,000 to be paid over five (5) years in equal annual installments of $75,000 per year.The first payment will be on January 1, 2020. You will earn each installment 12 months after it is paid. In the event you voluntarily terminate from theCompany prior to your final incentive payment you will forfeit any future payments and you will be required to refund any unearned payment to theCompany. You authorize the Company to deduct this obligation insofar as possible, from any salary, wages, accrued vacation, bonus or otherpayments or employee benefits to which you may be entitled, or business expense reimbursement amounts that may be due to you. You agree thatyou remain liable for any amount that is not withheld from your wages. By signing this offer letter you accept the terms of this agreement.
Long Term Incentive PlanCommencing in 2020, you will be eligible for annual equity grants of approximately $227,500, subject to the discretion of the CompensationCommittee of the Board of Directors. The equity grants are currently expected to be comprised of 25% restricted stock awards, 25% stock optionsand 50% based on performance- based criteria to be determined prior to the date of grant.
Severance AgreementFiesta will enter into a separate agreement with you to provide certain severance payments upon termination of your employment by Fiesta withoutCause and for reasons other than death or "permanent and total disability" (within the meaning Section 22(e)(3) of the Code) or by you voluntarilyfor Good Reason (to be defined in the agreement). The severance payments will include an amount equal to one
times your annual base salary in effect prior to the date employment is terminated and an amount equal to a pro rata portion of the aggregate bonusyou would have been entitled to receive with respect to the fiscal year of termination had employment not been terminated. Such bonus shall bepaid at the same time it would have been paid had your employment not been terminated.
Insurance BenefitsDetails regarding our comprehensive benefits package will be provided to you.
VacationYou are eligible for three weeks of vacation from date of hire through your ninth year. On your tenth year of employment, you will then be eligible forfour weeks of vacation.
Personal DaysCommencing your start date you are eligible for three (3) personal/sick days and each calendar year thereafter, you will receive five (5)personal/sick days.
This offer of employment is contingent upon the following (bold items will be provided):
• Acceptable results from all Fiesta employment screening evaluations.• Execution of the attached Agreement to Respect Confidential Information.• Execution of the attached Binding Arbitration Program acknowledgment.• Execution of the attached Background Information Release Form.• Satisfactory proof of identification and work authorization as required by federal law.• Satisfactory assurance that you are not subject to any non-compete or other restrictive covenant that could impair your ability to perform the job
responsibilities of the position you are offered. If you are subject to any such restrictions, please provide us with a copy of relevant documents atyour earliest convenience.
While we are confident that we will have a mutually beneficial employment relationship, employment with Fiesta is at-will and this is not a contractfor employment. Under this relationship, Fiesta may, at any time, decide to end an individual's employment with or without cause, prior notice ordiscipline at Fiesta's sole discretion. likewise, any employee is free to end his or her employment at any time for any reason with or without notice.
Please let me know if you have any questions. I can be reached at 786- 714- 5496.
Warm welcome,
/s/ Anthony D. DinkinsAnthony D. DinkinsSenior Vice President, Human ResourcesFiesta Restaurant Group, Inc.
Accepted:/s/ Hope DiazHope Diaz
August 6, 2019Date

Exhibit 21.1
FIESTA RESTAURANT GROUP, INC.Subsidiaries
Name State of Incorporation or OrganizationPollo Franchise, Inc. Florida
Pollo Operations, Inc. Florida
Pollo Tropical Management, LLC Texas
Pollo Tropical Beverages, LLC Texas
Taco Cabana, Inc. Delaware
Cabana Grill, Inc. Delaware
TP Acquisition Corp. Texas
T.C. Management, Inc. Delaware
Texas Taco Cabana, L.P. Texas
Cabana Bevco LLC Texas
TC Bevco LLC Texas
Cabana Beverages, Inc. Texas
TPAQ Holding Corporation Delaware
Exhibit 23.1
CONSENT OF INDEPENDENT REGISTERED PUBLIC ACCOUNTING FIRM
We consent to the incorporation by reference in Registration Statement Nos. 333-248840, 333-192254 and 333-184866 on Form S-3, and Registration StatementNo. 333-181954 on Form S-8 of our reports dated March 4, 2021, relating to the financial statements of Fiesta Restaurant Group, Inc., and the effectiveness ofFiesta Restaurant Group, Inc.'s internal control over financial reporting, appearing in this Annual Report on Form 10-K for the year ended January 3, 2021.
/s/ Deloitte & Touche LLP
Dallas, TexasMarch 4, 2021

Exhibit 31.1
CERTIFICATIONS
I, Richard C. Stockinger, certify that:
1. I have reviewed this annual report on Form 10-K for the period ended January 3, 2021 of Fiesta Restaurant Group, Inc.;
2. Based on my knowledge, this report does not contain any untrue statement of a material fact or omit to state a material fact necessary to make the statementsmade, in light of the circumstances under which such statements were made, not misleading with respect to the period covered by this report;
3. Based on my knowledge, the financial statements, and other financial information included in this report, fairly present in all material respects the financialcondition, results of operations and cash flows of the registrant as of, and for, the periods presented in this report;
4. The registrant's other certifying officer and I are responsible for establishing and maintaining disclosure controls and procedures (as defined in Exchange ActRules 13a-15(e) and 15d-15(e)) and internal control over financial reporting (as defined in Exchange Act Rules 13a-15(f) and 15d-15(f)) for the registrant andhave:
a) Designed such disclosure controls and procedures, or caused such disclosure controls and procedures to be designed under our supervision, to ensure thatmaterial information relating to the registrant, including its consolidated subsidiaries, is made known to us by others within those entities, particularly during theperiod in which this report is being prepared;
b) Designed such internal control over financial reporting, or caused such internal control over financial reporting to be designed under our supervision, to providereasonable assurance regarding the reliability of financial reporting and the preparation of financial statements for external purposes in accordance with generallyaccepted accounting principles;
c) Evaluated the effectiveness of the registrant's disclosure controls and procedures and presented in this report our conclusions about the effectiveness of thedisclosure controls and procedures, as of the end of the period covered by this report based on such evaluation; and
d) Disclosed in this report any change in the registrant's internal control over financial reporting that occurred during the registrant's most recent fiscal quarter thathas materially affected, or is reasonably likely to materially affect, the registrant's internal control over financial reporting; and
5. The registrant's other certifying officer and I have disclosed, based on our most recent evaluation of internal control over financial reporting, to the registrant'sauditors and the audit committee of the registrant's board of directors (or persons performing the equivalent functions):
a) All significant deficiencies and material weaknesses in the design or operation of internal control over financial reporting which are reasonably likely toadversely affect the registrant's ability to record, process, summarize and report financial information; and
b) Any fraud, whether or not material, that involves management or other employees who have a significant role in the registrant's internal control over financialreporting.
Date: March 4, 2021 /s/ RICHARD C. STOCKINGERRichard C. Stockinger Chief Executive Officer

Exhibit 31.2
CERTIFICATIONS
I, Dirk Montgomery, certify that:
1. I have reviewed this annual report on Form 10-K for the period ended January 3, 2021 of Fiesta Restaurant Group, Inc.;
2. Based on my knowledge, this report does not contain any untrue statement of a material fact or omit to state a material fact necessary to make the statementsmade, in light of the circumstances under which such statements were made, not misleading with respect to the period covered by this report;
3. Based on my knowledge, the financial statements, and other financial information included in this report, fairly present in all material respects the financialcondition, results of operations and cash flows of the registrant as of, and for, the periods presented in this report;
4. The registrant's other certifying officer and I are responsible for establishing and maintaining disclosure controls and procedures (as defined in Exchange ActRules 13a-15(e) and 15d-15(e)) and internal control over financial reporting (as defined in Exchange Act Rules 13a-15(f) and 15d-15(f)) for the registrant andhave:
a) Designed such disclosure controls and procedures, or caused such disclosure controls and procedures to be designed under our supervision, to ensure thatmaterial information relating to the registrant, including its consolidated subsidiaries, is made known to us by others within those entities, particularly during theperiod in which this report is being prepared;
b) Designed such internal control over financial reporting, or caused such internal control over financial reporting to be designed under our supervision, to providereasonable assurance regarding the reliability of financial reporting and the preparation of financial statements for external purposes in accordance with generallyaccepted accounting principles;
c) Evaluated the effectiveness of the registrant's disclosure controls and procedures and presented in this report our conclusions about the effectiveness of thedisclosure controls and procedures, as of the end of the period covered by this report based on such evaluation; and
d) Disclosed in this report any change in the registrant's internal control over financial reporting that occurred during the registrant's most recent fiscal quarter thathas materially affected, or is reasonably likely to materially affect, the registrant's internal control over financial reporting; and
5. The registrant's other certifying officer and I have disclosed, based on our most recent evaluation of internal control over financial reporting, to the registrant'sauditors and the audit committee of the registrant's board of directors (or persons performing the equivalent functions):
a) All significant deficiencies and material weaknesses in the design or operation of internal control over financial reporting which are reasonably likely toadversely affect the registrant's ability to record, process, summarize and report financial information; and
b) Any fraud, whether or not material, that involves management or other employees who have a significant role in the registrant's internal control over financialreporting.
Date: March 4, 2021 /s/ DIRK MONTGOMERYDirk Montgomery Senior Vice President, Chief Financial Officer and Treasurer
Exhibit 32.1
CERTIFICATE PURSUANT TO
18 U.S.C. SECTION 1350,
AS ADOPTED PURSUANT TO
SECTION 906 OF THE SARBANES-OXLEY ACT OF 2002
The undersigned, Richard C. Stockinger, Chief Executive Officer of Fiesta Restaurant Group, Inc. (the "Company"), hereby certifies, pursuant to 18 U.S.C. §1350,as adopted pursuant to §906 of the Sarbanes-Oxley Act of 2002, that:
(1) The Company's Annual Report on Form 10-K for the period ended January 3, 2021, as filed with the Securities and Exchange Commission on the date hereof(the "Annual Report"), fully complies with the requirements of Section 13(a) or 15(d) of the Securities Exchange Act of 1934; and
(2) The information contained in the Annual Report fairly presents, in all material respects, the financial condition and results of operations of the Company.
/s/ RICHARD C. STOCKINGERRichard C. StockingerChief Executive Officer
March 4, 2021
Exhibit 32.2
CERTIFICATE PURSUANT TO
18 U.S.C. SECTION 1350,
AS ADOPTED PURSUANT TO
SECTION 906 OF THE SARBANES-OXLEY ACT OF 2002
The undersigned, Dirk Montgomery, Chief Financial Officer of Fiesta Restaurant Group, Inc. (the "Company"), hereby certifies, pursuant to 18 U.S.C. §1350, asadopted pursuant to §906 of the Sarbanes-Oxley Act of 2002, that:
(1) The Company's Annual Report on Form 10-K for the period ended January 3, 2021, as filed with the Securities and Exchange Commission on the date hereof(the "Annual Report"), fully complies with the requirements of Section 13(a) or 15(d) of the Securities Exchange Act of 1934; and
(2) The information contained in the Annual Report fairly presents, in all material respects, the financial condition and results of operations of the Company.
/s/ DIRK MONTGOMERY
Dirk MontgomerySenior Vice President, Chief Financial Officer and Treasurer
March 4, 2021