reference data for the syllable repetition task (srt ... · srt performance data: percentage of...
TRANSCRIPT

REFERENCE DATA FOR
THE SYLLABLE REPETITION TASK (SRT)
Technical Report No. 17
Heather L. Lohmeier
Lawrence D. Shriberg
Revised November 2011
Phonology Project, Waisman Center University of Wisconsin-Madison
Development of the Syllable Repetition Task (SRT) and preparation of this technical report was supported by research grant DC00496 from the National Institute on Deafness and Other Communication Disorders, National Institutes of Health (Lawrence D. Shriberg, Principal Investigator) and the Australian Research Council Discovery Grant (DP0773978). We thank the following colleagues for their contributions to the development and validation of the SRT and/or for their contribution of reference data obtained in the context of collaborative research: Richard Boada, Roger Brown, Thomas Campbell, Christine Dollaghan, Lisa Freebairn, Jordan Green, Linda J. Harrison, Christine Hollar, Joan Kwiatkowski, Barbara Lewis, Lindy McAllister, Jane McCormack, Sharynne McLeod, Jane McSweeny, Christopher Moore, Bruce Pennington, Steven Pittelko, Heather Leavy Rusiewicz, Christine Tilkens, Sonja Wilson, and David Wilson.

2
CONTENTS
Overview: The Syllable Repetition Task (SRT) A. Overviews of Prior SRT Papers ......................................................................................4 B. Overview of the Present Technical Report .....................................................................6
I. Reference Data for Participants with Typical Speech and Typical Language
A. Graphic SRT Data (means, standard deviations)
1. SRT Performance Data: Percentage of Correctly Repeated Consonants ...........10 2. SRT Performance Data: Percentage of Correctly Repeated Items ....................11 3. SRT Processes Data: Encoding ..........................................................................12 4. SRT Processes Data: Memorial .........................................................................13 5. SRT Processes Data: Transcoding .....................................................................14
B. Tabular SRT Data (means; standard deviations)
1. Source A – Individual Ages ...............................................................................15 2. Source A – Combined Ages ...............................................................................16 3. Source BCD – Individual Ages..........................................................................17 4. Source BCD – Combined Ages .........................................................................18
II. Reference Data for Participants with Speech Delay and Typical Language
A. Graphic SRT Data (means, standard deviations)
1. SRT Performance Data: Percentage of Correctly Repeated Consonants ...........19 2. SRT Performance Data: Percentage of Correctly Repeated Items ....................20 3. SRT Processes Data: Encoding ..........................................................................21 4. SRT Processes Data: Memorial .........................................................................22 5. SRT Processes Data: Transcoding .....................................................................23
B. Tabular SRT Data (means; standard deviations)
1. Source A – Individual Ages ...............................................................................24 2. Source A – Combined Ages ...............................................................................25 3. Source BCD – Individual Ages..........................................................................26 4. Source BCD – Combined Ages .........................................................................27

3
III. Reference Data for Participants with Typical Speech and Language Impairment
A. Graphic SRT Data (means, standard deviations)
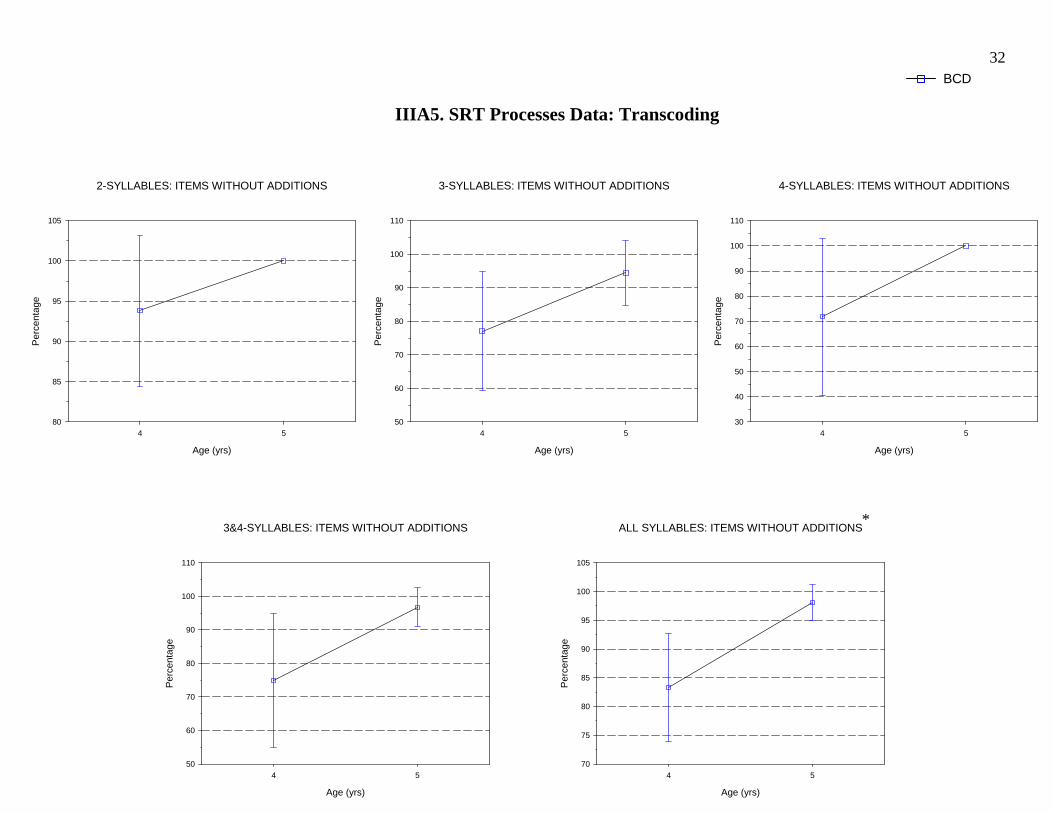
1. SRT Performance Data: Percentage of Correctly Repeated Consonants ...........28 2. SRT Performance Data: Percentage of Correctly Repeated Items ....................29 3. SRT Processes Data: Encoding ..........................................................................30 4. SRT Processes Data: Memorial .........................................................................31 5. SRT Processes Data: Transcoding .....................................................................32
B. Tabular SRT Data (means; standard deviations)
1. Source A – Individual Ages ...............................................................................33 2. Source A – Combined Ages ...............................................................................34
IV. Reference Data for Participants with Speech Delay and Language Impairment
A. Graphic SRT Data (means, standard deviations)
1. SRT Performance Data: Percentage of Correctly Repeated Consonants ...........35 2. SRT Performance Data: Percentage of Correctly Repeated Items ....................36 3. SRT Processes Data: Encoding ..........................................................................37 4. SRT Processes Data: Memorial .........................................................................38 5. SRT Processes Data: Transcoding .....................................................................39
B. Tabular SRT Data (means; standard deviations)
1. Source A – Individual Ages ...............................................................................40 2. Source A – Combined Ages ...............................................................................41 3. Source BCD – Individual Ages..........................................................................42 4. Source BCD – Combined Ages .........................................................................43
V. References .................................................................................................................................44

4
OVERVIEW: THE SYLLABLE REPETITION TASK (SRT)
The goal of this technical report, the fourth in a series of papers on the Syllable
Repetition Task (SRT), is to extend the reference data available for this task. This overview
provides brief summaries of the goals and findings of the three prior papers and an overview of
the present Phonology Project Technical Report No. 17. The following four sections provide
reference data from five sources organized by participants’ speech-language status.
A. Overviews of Prior SRT Papers
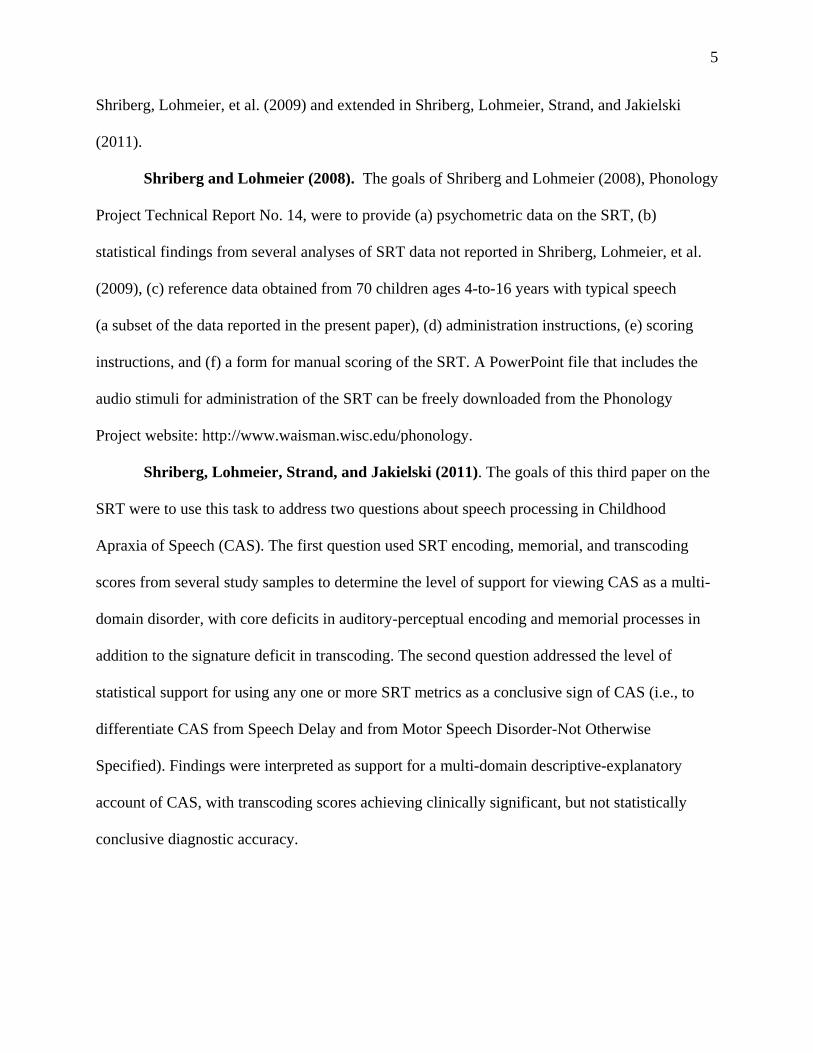
Shriberg, Lohmeier, et al. (2009). The goals of Shriberg, Lohmeier, et al. (2009) were
to describe the development of the SRT and to report findings from three validity studies. The
SRT is an 18-item imitation task that assesses a speaker’s ability to repeat non(sense) words. The
SRT was designed specifically for speakers whose speech errors preclude their completing
conventional nonword repetition tasks or biases nonword task findings due to their difficulty
repeating some sounds correctly and/or the difficulty transcribers have in reliably transcribing
and scoring disordered speech. The only five speech sounds in the SRT nonwords are the four
voiced consonants /b/, /d/, /m/, and /n/ and the vowel /e/. By limiting the target consonants to
just four of the ‘Early-8’ speech sounds (Shriberg, 1993), speaker and transcriber constraints
associated with more complex consonants and consonant environments are eliminated. Shriberg,
Lohmeier, et al. (2009) includes a proof of concept study that supports use of the SRT to identify
children with expressive language impairment. This first paper also reports initial findings from
analyses that illustrate how the error responses on the SRT can be used to deconstruct speech
processing constraints underlying lowered SRT performance scores. Definitions for the three
speech processes of interest, termed encoding, memorial, and transcoding, are provided in
5
Shriberg, Lohmeier, et al. (2009) and extended in Shriberg, Lohmeier, Strand, and Jakielski
(2011).
Shriberg and Lohmeier (2008). The goals of Shriberg and Lohmeier (2008), Phonology
Project Technical Report No. 14, were to provide (a) psychometric data on the SRT, (b)
statistical findings from several analyses of SRT data not reported in Shriberg, Lohmeier, et al.
(2009), (c) reference data obtained from 70 children ages 4-to-16 years with typical speech
(a subset of the data reported in the present paper), (d) administration instructions, (e) scoring
instructions, and (f) a form for manual scoring of the SRT. A PowerPoint file that includes the
audio stimuli for administration of the SRT can be freely downloaded from the Phonology
Project website: http://www.waisman.wisc.edu/phonology.
Shriberg, Lohmeier, Strand, and Jakielski (2011). The goals of this third paper on the
SRT were to use this task to address two questions about speech processing in Childhood
Apraxia of Speech (CAS). The first question used SRT encoding, memorial, and transcoding
scores from several study samples to determine the level of support for viewing CAS as a multi-
domain disorder, with core deficits in auditory-perceptual encoding and memorial processes in
addition to the signature deficit in transcoding. The second question addressed the level of
statistical support for using any one or more SRT metrics as a conclusive sign of CAS (i.e., to
differentiate CAS from Speech Delay and from Motor Speech Disorder-Not Otherwise
Specified). Findings were interpreted as support for a multi-domain descriptive-explanatory
account of CAS, with transcoding scores achieving clinically significant, but not statistically
conclusive diagnostic accuracy.

6
B. Overview of the Present Technical Report
The goals of the present technical report were to assess the stability of means and
standard deviations data reported in the prior SRT technical report (Shriberg & Lohmeier, 2008),
and to make extended reference data available to individuals using the SRT for research or
clinical decision making. SRT Performance and Processing scores were assembled from 552
participants who had been administered the SRT in the context of collaborative studies at four
sources in the U.S., and one source in Australia.
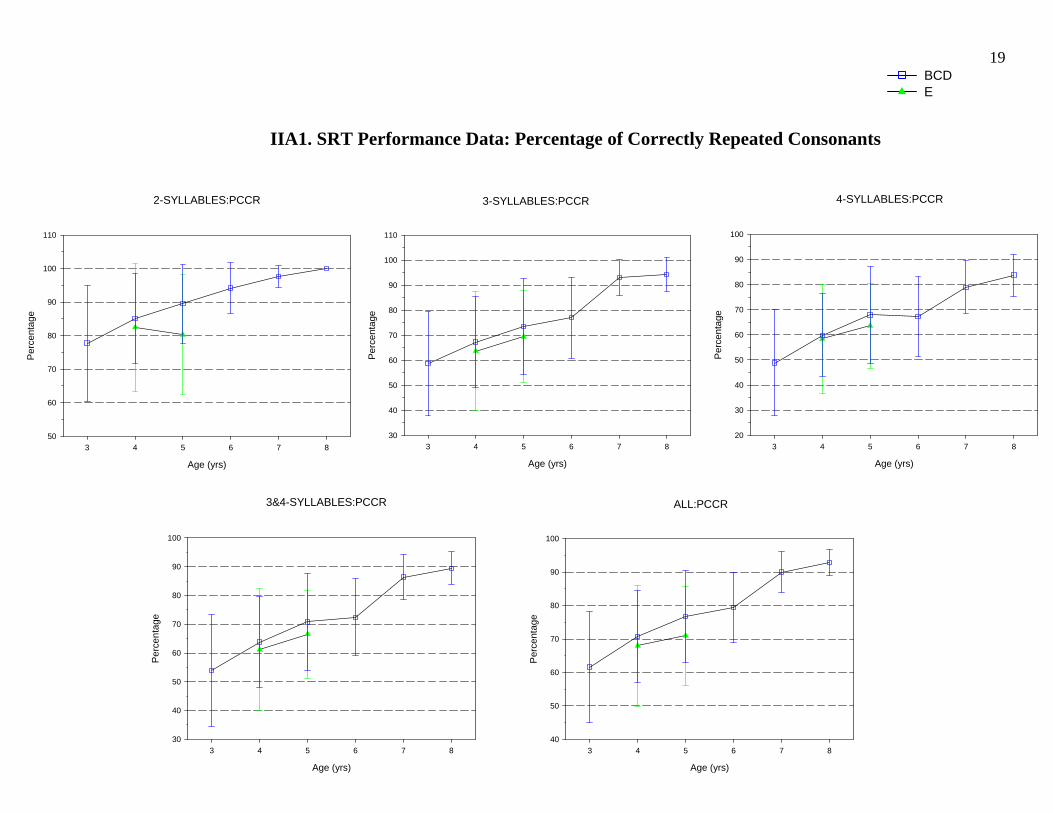
Table 1 provides descriptive statistics for each of the five study sources organized by
participants’ speech-language status: Typical Speech-Typical Language; Speech Delay-Typical
Language; Typical Speech-Language Impairment, and Speech Delay-Language Impairment. All
participants spoke English as their only or primary language. Participants had no known
cognitive, structural, sensory, motor, or affective problems other than (for three of the groups),
speech and/or language impairments of unknown origin. As indicated in Table 1, Source A
provides information on 3- to 17-year-old speakers with typical speech-language development.
Source BCD is the combined data from three American study samples, B, C, and D. Source E
provides SRT information from young speakers with Speech Delay from eight cities and towns
in two different states of Australia. Cell sizes for each of the four speech-language status groups
from each source ranged from 11 to 150 participants, including from 38-81% males in each
sample. Shriberg, Lohmeier, et al. (2009) found no statistically significant gender effect on SRT
Competence scores. Participant data on socioeconomic variables are not included in the present
report.
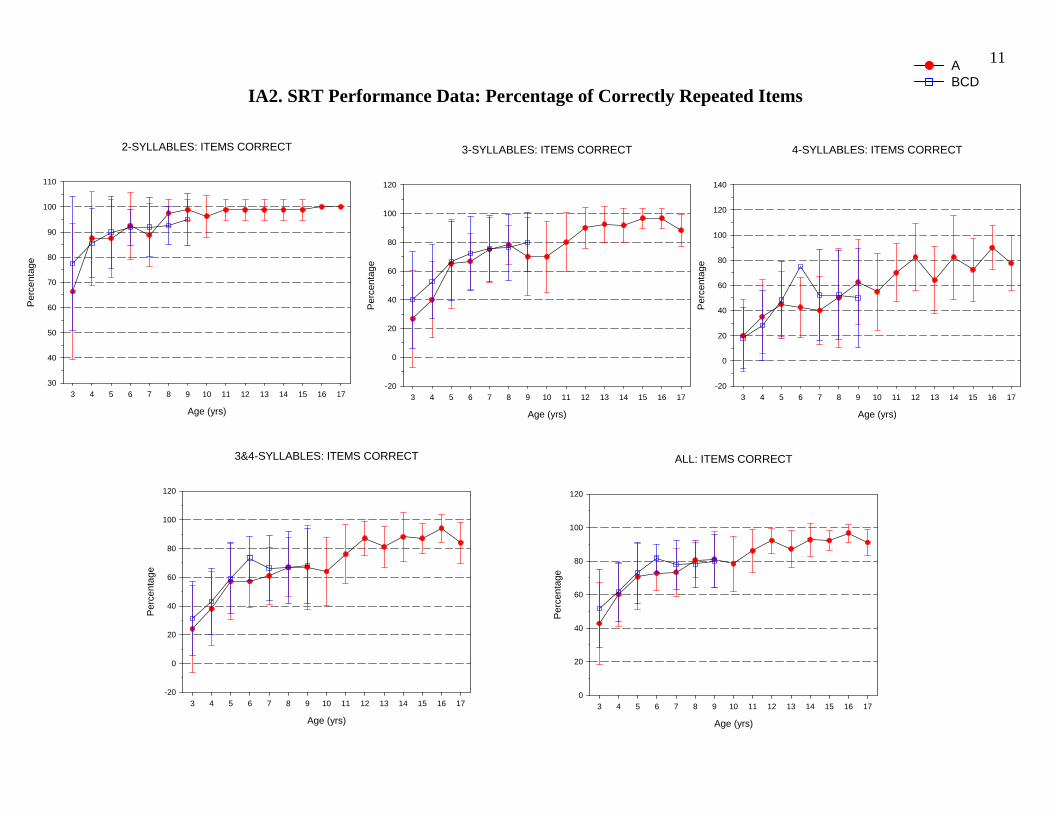
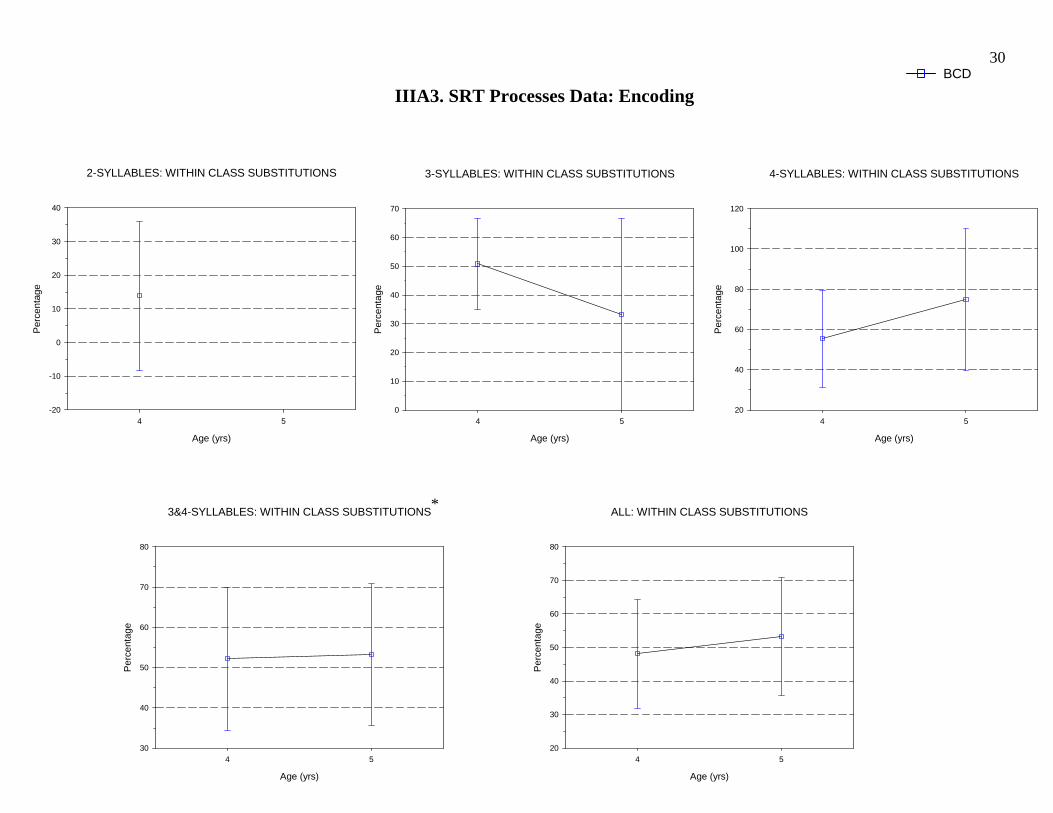
Sections I-IV include graphic and tabular data for participants grouped by speech-
language status. For the graphic data, the panel titles ending with an asterisk are the variables

7
used to complete the performance and processing scores report in Shriberg, Lohmeier, et al.
(2011). Section I, which includes data from a total of 257 participants with typical speech and
typical language, provides information that can be used to derive age-sex standardized scores for
children from 3-18 years olds. To provide more stable means and standard deviations, data are
also provided for combined ages, some of which have individual values per year and some of
which do not. There are some differences in the values obtained on the same SRT values by
participants in the different sources. The values from Source A are considered the ‘standard’
reference data for z-scores. SRT reference data for 20-70 year old speakers will be available in
2012. It is important to underscore that the validity of SRT scores requires that the task is
administered and scored using procedures described in the Phonology Project technical report
described above (No. 14). As noted, constraints on these reference data include small cell sizes
for some ages, distributional restrictions, and the lack of sociodemographic diversity.
For ease of analyses of information from two sources of the same speech-language status
and same ages, the graphic information was purposefully created to overlay the means and
standard deviations. These comparative data are readily separated on a computer display or when
printed in color, particularly the standard deviation bars. As indicated previously, the tabular data
include findings at each sampled age, and aggregated over age groups, the latter providing more
stable descriptive statistics, particular for ages with relatively small cell sizes.
Last, the reference data in this report are presented without comment. A thorough
analyses of trends between and among the variables of age, sex, speech-language status, and
study sample for each of the 23 SRT variables is beyond the scope of the present goal.
Forthcoming papers will use subsets of the present findings to address substantive questions
about speech processing in children with speech sound disorders, particularly, for subtypes of

8
pediatric motor speech disorders (i.e., apraxia, subtypes of dysarthria, and motor speech
disorders not otherwise specified: see Shriberg, Lohmeier, et al., 2011). However, readers who
observe trends of interest for any clinical-research question are welcomed to reference this
information, contacting the authors for additional information that may be needed or helpful.

9
Table 1. Descriptive statistics for study samples from five sources organized by participants’ speech-language status.
Group Speech-Language Status Sourcea n Age (yrs) % Males
Speech Competenceb
PCC PCCR M SD M SD
1 Typical Speech-
Typical Language
A
150 3-17 50.0 96.9 5.2 98.3 2.7 BCD 107 3-9 38.0 93.4 5.8 95.6 4.0 2 Speech Delay-
Typical Language
BCD
132 3-8 66.7 78.1 11.9 83.6 10.8 E 68 4-5 68.6 ─ ─ ─ ─ 3 Typical Speech-
Language Impairment
BCD
11 4-5 63.6 90.3 3.8 93.1 2.3 4 Speech Delay-
Language Impairment
BCD
63 3-7 76.2 71.4 14.3 75.8 14.2 E 21 4-5 81.0 ─ ─ ─ ─
a Sources A-D are cities in the United States; Source E includes data collected from 8 cities and towns in 2 different states in Australia. Cities B-D were treated as one sample termed “BCD.” b PCC: Percentage of Consonants Correct; PCCR: Percentage of Consonants Correct-Revised.

10
IA1. SRT Performance Data: Percentage of Correctly Repeated Consonants
Age (yrs)
3 4 5 6 7 8 9 10 11 12 13 14 15 16 17
Per
cent
age
20
40
60
80
100
120
4-SYLLABLES:PCCR2-SYLLABLES:PCCR
Age (yrs)
3 4 5 6 7 8 9 10 11 12 13 14 15 16 17
Per
cent
age
60
70
80
90
100
110
Age (yrs)
3 4 5 6 7 8 9 10 11 12 13 14 15 16 17
Per
cent
age
20
40
60
80
100
120
3-SYLLABLES:PCCR
Age (yrs)
3 4 5 6 7 8 9 10 11 12 13 14 15 16 17
Per
cent
age
20
40
60
80
100
120
3&4-SYLLABLES:PCCR
Age (yrs)
3 4 5 6 7 8 9 10 11 12 13 14 15 16 17
Per
cent
age
40
50
60
70
80
90
100
110
ALL:PCCR
ABCD
11 IA2. SRT Performance Data: Percentage of Correctly Repeated Items
2-SYLLABLES: ITEMS CORRECT
Age (yrs)
3 4 5 6 7 8 9 10 11 12 13 14 15 16 17
Per
cent
age
30
40
50
60
70
80
90
100
110
3-SYLLABLES: ITEMS CORRECT
Age (yrs)
3 4 5 6 7 8 9 10 11 12 13 14 15 16 17
Per
cent
age
-20
0
20
40
60
80
100
120
4-SYLLABLES: ITEMS CORRECT
Age (yrs)
3 4 5 6 7 8 9 10 11 12 13 14 15 16 17
Per
cent
age
-20
0
20
40
60
80
100
120
140
3&4-SYLLABLES: ITEMS CORRECT
Age (yrs)
3 4 5 6 7 8 9 10 11 12 13 14 15 16 17
Per
cent
age
-20
0
20
40
60
80
100
120
ALL: ITEMS CORRECT
Age (yrs)
3 4 5 6 7 8 9 10 11 12 13 14 15 16 17
Per
cent
age
0
20
40
60
80
100
120
ABCD

12
IA3. SRT Processes Data: Encoding
*
2-SYLLABLES: WITHIN CLASS SUBSTITUTIONS
Age (yrs)
3 4 5 6 7 8 9 10 11 12 13 14 15 16 17
Per
cent
age
-40
-20
0
20
40
60
80
100
120
140
3-SYLLABLES: WITHIN CLASS SUBSTITUTIONS
Age (yrs)
3 4 5 6 7 8 9 10 11 12 13 14 15 16 17
Per
cent
age
0
20
40
60
80
100
120
140
4-SYLLABLES: WITHIN CLASS SUBSTITUTIONS
Age (yrs)
3 4 5 6 7 8 9 10 11 12 13 14 15 16 17
Per
cent
age
-20
0
20
40
60
80
100
120
3&4-SYLLABLES: WITHIN CLASS SUBSTITUTIONS
Age (yrs)
3 4 5 6 7 8 9 10 11 12 13 14 15 16 17
Per
cent
age
0
20
40
60
80
100
120
ALL: WITHIN CLASS SUBSTITUTIONS
Age (yrs)
3 4 5 6 7 8 9 10 11 12 13 14 15 16 17
Per
cent
age
0
20
40
60
80
100
120
140
ABCD

13
IA4. SRT Processes Data: Memorial
ABCD
MEMORY: 4/3 SYLLABLES
Age (yrs)
3 4 5 6 7 8 9 10 11 12 13 14 15 16 17
Sca
led
Log
Sco
res
(per
cent
-like
)
20
40
60
80
100
120
MEMORY: 3/2 SYLLABLES*
Age (yrs)
3 4 5 6 7 8 9 10 11 12 13 14 15 16 17
Sca
led
Log
Sco
res
(per
cent
-like
)
0
20
40
60
80
100
120
MEMORY: 4/2 SYLLABLES
Age (yrs)
3 4 5 6 7 8 9 10 11 12 13 14 15 16 17
Sca
led
Log
Sco
res
(per
cent
-like
)
0
20
40
60
80
100
120

14
IA5. SRT Processes Data: Transcoding *
2-SYLLABLES: ITEMS WITHOUT ADDITIONS
Age (yrs)
3 4 5 6 7 8 9 10 11 12 13 14 15 16 17
Per
cent
age
75
80
85
90
95
100
105
110
115
3-SYLLABLES: ITEMS WITHOUT ADDITIONS
Age (yrs)
3 4 5 6 7 8 9 10 11 12 13 14 15 16 17
Per
cent
age
40
50
60
70
80
90
100
110
120
4-SYLLABLES: ITEMS WITHOUT ADDITIONS
Age (yrs)
3 4 5 6 7 8 9 10 11 12 13 14 15 16 17
Per
cent
age
50
60
70
80
90
100
110
120
3&4-SYLLABLES: ITEMS WITHOUT ADDITIONS
Age (yrs)
3 4 5 6 7 8 9 10 11 12 13 14 15 16 17
Per
cent
age
50
60
70
80
90
100
110
120
ALL SYLLABLES: ITEMS WITHOUT ADDITIONS
Age (yrs)
3 4 5 6 7 8 9 10 11 12 13 14 15 16 17
Per
cent
age
60
70
80
90
100
110
ABCD

15 Table IB1 (Source A – Individual Ages). SRT Competence and Processing Scores for 150 participants with Typical Speech-Typical Language from ages 3 years to 17 years.
TYPICAL SPEECH-TYPICAL LANGUAGE Variable 3 Yrs 4 Yrs 5 Yrs 6 Yrs 7 Yrs 8 Yrs 9 Yrs 10 Yrs 11 Yrs 12 Yrs 13 Yrs 14 Yrs 15 Yrs 16 Yrs 17 Yrs (n=10) (n=10) (n=10) (n=10) (n=10) (n=10) (n=10) (n=10) (n=10) (n=10) (n=10) (n=10) (n=10) (n=10) (n=10) M SD M SD M SD M SD M SD M SD M SD M SD M SD M SD M SD M SD M SD M SD M SD
Competence
Consonants Correct
2-syll 82.5 15.5 93.1 10.8 93.8 7.8 96.9 6.1 94.4 6.2 98.8 2.6 99.4 2.0 97.5 6.0 99.4 2.0 100.0 0.0 99.4 2.0 99.4 2.0 99.4 2.0 100.0 0.0 100.0 0.0 3-syll 55.6 27.3 73.3 21.1 86.1 12.6 88.9 7.4 88.3 11.2 92.2 6.5 85.6 17.8 85.0 15.7 92.2 10.5 95.6 7.3 95.6 7.3 97.2 3.9 98.3 3.7 98.9 2.3 97.2 2.9 4-syll 55.6 27.4 71.3 20.9 75.0 18.4 80.0 12.4 77.5 11.1 82.5 13.8 87.5 11.8 86.3 13.4 85.6 15.3 93.1 10.8 87.7 10.9 96.3 9.9 83.1 17.2 94.4 9.5 91.9 9.8 3&4-syll 55.6 25.5 72.4 20.0 80.9 14.4 84.7 7.6 83.2 10.4 87.6 8.7 86.5 14.2 85.6 12.0 89.1 11.9 94.4 5.6 91.9 6.9 96.8 5.8 91.2 8.5 96.8 4.9 94.7 5.7 All 64.2 18.9 79.0 15.6 85.0 11.1 88.6 5.3 86.8 8.1 91.2 5.5 90.6 9.7 89.4 9.8 92.4 8.5 96.2 3.8 94.3 4.8 97.6 3.9 93.8 5.8 97.8 3.3 96.4 3.9 Items Correct 2-syll 66.3 27.0 87.5 18.6 87.5 15.6 92.5 13.4 88.8 12.4 97.5 5.3 98.8 4.0 96.3 8.4 98.8 4.0 98.8 4.0 98.8 4.0 98.8 4.0 98.8 4.0 100.0 0.0 100.0 0.0 3-syll 26.7 33.5 40.0 26.3 65.0 30.9 66.7 19.2 75.0 22.6 78.3 13.7 70.0 27.0 70.0 24.6 80.0 20.5 90.0 14.1 92.5 12.7 91.7 11.8 96.7 7.0 96.7 7.0 88.3 11.2 4-syll 20.0 28.4 35.0 29.3 45.0 25.8 42.5 23.7 40.0 26.9 50.0 39.1 62.5 33.9 55.0 30.7 70.0 23.0 82.5 26.5 64.2 26.7 82.5 33.4 72.5 24.9 90.0 17.5 77.5 21.9 3&4-syll 24.0 30.3 38.0 25.7 57.0 26.7 57.0 18.3 61.0 19.7 67.0 20.6 67.0 29.1 64.0 23.7 76.0 20.7 87.0 11.6 81.1 14.4 88.0 16.9 87.0 10.6 94.0 9.7 84.0 14.3 All 42.8 24.4 60.0 18.8 70.6 19.6 72.8 10.3 73.3 14.3 80.6 10.2 81.1 16.6 78.3 16.2 86.1 12.9 92.2 7.5 87.2 10.8 92.8 9.8 92.2 6.0 96.7 5.4 91.1 7.9 Processing Encoding (w/in class subst)
2-syllable 58.3 32.6 51.7 42.3 33.3 47.1 100.0 0.0 40.0 54.8 50.0 70.7 0.0 0.0 50.0 70.7 0.0 0.0 0.0 0.0 0.0 0.0 0.0 0.0 0.0 0.0 0.0 0.0 0.0 0.0 3-syllable 48.4 29.9 57.2 20.0 52.4 37.0 81.3 20.8 77.4 24.9 78.1 36.4 65.5 41.5 77.2 29.3 83.3 27.9 100.0 0.0 83.3 28.9 87.5 25.0 75.0 35.4 100.0 0.0 80.0 44.7 4-syllable 27.9 18.6 58.9 20.8 70.5 32.7 71.9 26.4 51.8 35.7 74.0 21.6 73.8 38.3 61.4 45.6 80.5 20.2 69.2 21.7 60.5 40.0 100 0.0 51.7 39.3 44.4 50.9 50.0 37.3 3&4-syllable 37.9 16.6 60.5 20.9 68.4 29.5 72.8 20.7 58.8 31.3 72.3 32.4 67.1 40.0 74.9 26.9 82.9 19.1 86.0 18.0 66.4 33.9 91.7 16.7 58.8 39.2 62.5 47.9 62.5 30.6 All 41.6 12.0 54.6 27.7 65.1 29.1 76.7 18.3 55.6 27.9 72.3 20.6 66.7 40.6 74.9 27.6 82.3 20.1 86.0 18.0 65.5 34.8 73.3 43.5 56.7 40.1 62.5 47.9 62.5 30.6 Memory 4/3 77.6 31.6 89.6 14.3 82.9 16.7 86.7 17.0 86.3 10.7 86.7 12.9 96.5 7.4 93.9 12.5 90.8 12.9 93.4 12.6 89.8 12.7 96.8 10.0 80.5 22.5 94.3 10.0 93.3 8.9 3/2 54.7 41.4 71.3 24.7 90.5 11.5 89.2 8.2 92.2 12.0 92.8 8.1 82.8 23.0 84.7 15.3 91.9 10.9 95.2 8.2 95.2 8.0 97.1 4.1 98.3 4.0 98.9 2.4 97.1 3.0 4/2 61.8 43.9 67.2 29.4 73.5 24.2 79.0 17.1 79.5 14.0 79.5 16.7 86.4 14.6 86.8 14.9 83.5 18.6 92.2 12.7 86.8 11.6 95.6 11.8 79.9 23.5 93.7 10.8 91.0 11.0 Transcoding (w/out additions)
2-syllable 92.5 13.4 95.0 15.8 98.8 4.0 97.5 7.9 100.0 0.0 100.0 0.0 100.0 0.0 100.0 0.0 100.0 0.0 98.8 4.0 100.0 0.0 100.0 0.0 100.0 0.0 100.0 0.0 100.0 0.0 3-syllable 81.7 32.8 85.0 18.3 86.7 17.2 88.3 11.2 95.0 11.2 93.3 8.6 96.7 10.5 91.7 11.8 95.0 8.1 100.0 0.0 98.3 5.3 100.0 0.0 100.0 0.0 100.0 0.0 96.7 7.0 4-syllable 87.5 21.2 75.0 20.4 87.5 13.2 90.0 12.9 75.0 20.4 82.5 20.6 100.0 0.0 85.0 24.2 92.5 12.1 100.0 0.0 87.5 17.7 95.0 15.8 97.5 7.9 100.0 0.0 95.0 10.5 3&4-syllable 84.0 25.9 81.0 13.7 87.0 13.4 89.0 11.0 87.0 11.6 89.0 9.9 98.0 6.3 89.0 12.9 94.0 8.4 100.0 0.0 94.0 8.4 98.0 6.3 99.0 3.2 100.0 0.0 96.0 5.2 All 87.8 19.9 87.2 10.5 92.2 8.4 92.8 7.9 92.8 6.4 93.9 5.5 98.9 3.5 93.9 7.1 96.7 4.7 99.4 1.8 96.7 4.7 98.9 3.5 99.4 1.8 100.0 0.0 97.8 2.9

16 Table IB2 (Source A – Combined Ages). SRT Competence and Processing Scores for 150 participants with Typical Speech-Typical Language subgrouped from ages 3 years to 17 years.
TYPICAL SPEECH-TYPICAL LANGUAGE Variable 3-5 Yrs 6-8 Yrs 9-11 Yrs 12-14 Yrs 15-17 Yrs (n=30) (n=30) (n=30) (n=30) (n=30) M SD M SD M SD M SD M SD M SD M SD M SD M SD M SD M SD M SD M SD M SD M SD
Competence
Consonants Correct
2-syll 89.8 12.6 96.7 5.4 98.8 3.8 99.6 1.6 99.8 1.1 3-syll 71.7 24.1 89.8 8.5 87.6 14.9 96.1 6.2 98.1 3.0 4-syll 67.3 23.4 80.0 12.2 86.5 13.1 92.4 10.8 89.8 13.2 3&4-syll 69.6 22.5 85.2 8.9 87.1 12.4 94.3 6.3 94.2 6.8 All 76.1 17.5 88.9 6.5 90.8 9.1 96.0 4.3 96.0 4.6 Items Correct 2-syll 80.4 22.7 92.9 11.2 97.9 5.8 98.8 3.8 99.6 2.3 3-syll 43.9 33.5 73.3 18.9 73.3 23.8 91.4 12.5 93.9 9.3 4-syll 33.3 28.9 44.2 29.9 62.5 29.2 76.4 29.4 80.0 22.2 3&4-syll 39.7 30.0 61.7 19.3 69.0 24.4 85.4 14.3 88.3 12.1 All 57.8 23.5 75.6 11.9 81.9 15.2 90.7 9.5 93.3 6.7 Processing Encoding (w/in class subst)
2-syllable 49.4 38.4 60.0 51.6 25.0 50.0 0.0 0.0 0.0 0.0 3-syllable 52.5 28.4 79.0 27.0 75.4 32.2 90.9 20.2 83.3 35.4 4-syllable 53.1 30.4 65.0 30.0 71.9 35.4 69.2 33.5 49.7 37.9 3&4-syllable 55.4 25.9 67.8 28.2 75.0 29.3 79.6 26.3 60.8 36.3 All 53.8 25.3 68.0 23.8 74.6 30.0 75.1 31.9 59.9 36.8 Memory 4/3 83.4 22.0 86.6 13.3 93.7 11.1 93.3 11.8 89.3 15.9 3/2 72.1 31.4 91.4 9.4 86.5 17.0 95.8 6.8 98.1 3.2 4/2 67.5 32.7 79.3 15.4 85.6 15.6 91.5 12.2 88.2 16.8 Transcoding (w/out additions)
2-syllable 95.4 12.1 99.2 4.6 100.0 0.0 99.6 2.3 100.0 0.0 3-syllable 84.4 23.1 92.2 10.5 94.4 10.1 99.4 3.0 98.9 4.2 4-syllable 83.3 19.0 82.5 18.7 92.5 16.3 94.2 14.2 97.5 7.6 3&4-syllable 84.0 18.1 88.3 10.5 93.7 10.0 97.3 6.4 98.3 3.8 All 89.1 13.6 93.1 6.5 96.5 5.6 98.3 3.6 99.1 2.1

17 Table IB3 (Source BCD – Individual Ages). SRT Competence and Processing Scores for 107 participants with Typical Speech-Typical Language from ages 3 years to 9 years.
TYPICAL SPEECH-TYPICAL LANGUAGE Variable 3 Yrs 4 Yrs 5 Yrs 6 Yrs 7 Yrs 8 Yrs 9 Yrs 10 Yrs 11 Yrs 12 Yrs 13 Yrs 14 Yrs 15 Yrs 16 Yrs 17 Yrs (n=15) (n=31) (n=15) (n=3) (n=11) (n=22) (n=10) M SD M SD M SD M SD M SD M SD M SD M SD M SD M SD M SD M SD M SD M SD M SD
Competence
Consonants Correct
2-syll 89.6 17.5 92.5 8.3 95.0 8.3 95.8 3.6 96.0 5.8 96.0 4.1 97.5 5.3 3-syll 70.7 19.5 78.1 17.7 84.4 13.1 94.4 9.6 88.4 11.8 91.2 9.5 92.8 8.7 4-syll 52.1 25.8 64.1 24.2 80.0 14.2 93.8 6.3 77.5 20.0 75.3 25.6 76.3 19.9 3&4-syll 62.0 18.9 71.5 18.0 82.4 12.5 94.1 2.9 83.2 13.4 83.7 15.5 85.0 12.5 All 70.8 16.6 78.3 14.1 86.4 10.3 94.7 3.1 87.3 9.6 87.6 10.3 89.0 8.9 Items Correct 2-syll 77.5 26.8 85.5 13.7 90.0 14.3 91.7 7.2 92.0 11.6 92.6 7.4 95.0 10.5 3-syll 40.0 33.8 52.7 25.9 66.7 27.5 72.2 25.5 75.8 22.8 76.5 22.8 80.0 20.5 4-syll 18.3 24.0 28.2 27.9 48.3 30.6 75.0 0.0 52.3 36.1 52.3 35.3 50.0 39.1 3&4-syll 31.3 25.6 42.9 23.0 59.3 24.6 73.3 15.3 66.4 22.5 66.8 25.1 68.0 26.2 All 51.9 23.3 61.8 17.6 73.0 18.4 81.5 8.5 77.8 14.7 78.3 14.3 80.0 16.0 Processing Encoding (w/in class subst)
2-syllable 34.3 47.2 31.6 41.5 66.7 47.1 50.0 70.7 46.7 50.6 27.3 46.7 25.0 35.4 3-syllable 53.5 27.5 59.4 37.3 63.3 31.7 66.7 * 67.6 25.9 48.2 45.1 51.7 44.9 4-syllable 61.8 27.9 66.5 25.8 70.3 30.0 100.0 0.0 71.9 28.5 53.5 34.6 61.1 36.5 3&4-syllable 58.9 20.5 62.1 26.8 68.3 27.1 88.9 19.2 69.4 24.2 56.0 35.3 67.5 32.2 All 57.8 21.3 59.3 26.8 68.4 26.6 83.3 28.9 65.2 22.0 55.7 38.3 60.7 37.1 Memory 4/3 64.1 34.8 73.0 34.4 91.3 6.5 93.4 6.7 80.5 19.8 76.9 31.9 76.1 23.5 3/2 73.9 25.7 80.9 20.4 86.4 12.1 96.1 6.8 89.7 12.2 92.4 11.0 93.4 6.8 4/2 45.1 30.0 61.6 32.0 81.6 15.0 95.6 3.9 74.8 28.0 73.4 31.2 70.7 28.0 Transcoding (w/out additions)
2-syllable 94.2 11.4 98.0 5.7 99.2 3.2 100.0 0.0 100.0 0.0 100.0 0.0 100.0 0.0 3-syllable 86.7 19.1 81.7 23.3 91.1 12.4 88.9 19.2 100.0 0.0 97.0 8.4 95.0 8.1 4-syllable 88.3 20.8 83.9 27.0 88.3 22.9 91.7 14.4 95.5 10.1 94.3 17.1 97.5 7.9 3&4-syllable 87.3 17.9 82.6 21.3 90.0 13.6 90.0 10.0 98.2 4.0 95.9 10.5 96.0 7.0 All 90.4 11.6 89.4 12.7 94.1 7.4 94.4 5.6 99.0 2.2 97.7 5.9 97.8 3.9

18 Table IB4 (Source BCD – Combined Ages). SRT Competence and Processing Scores for 101 participants with Typical Speech-Typical Language subgrouped from ages 3 years to 17 years.
TYPICAL SPEECH-TYPICAL LANGUAGE Variable 3-5 Yrs 6-8 Yrs 15&17 Yrs (n=61) (n=36) (n=4) M SD M SD M SD M SD M SD M SD M SD M SD M SD M SD M SD M SD M SD M SD M SD
Competence
Consonants Correct
2-syll 92.4 11.2 96.0 4.5 100.0 0.0 3-syll 77.9 17.6 90.6 10.1 100.0 0.0 4-syll 65.1 24.4 77.5 23.2 95.3 6.0 3&4-syll 71.8 18.3 84.4 14.3 97.8 2.8 All 78.4 14.8 88.1 9.7 98.5 1.9 Items Correct 2-syll 84.6 18.2 92.4 8.6 100.0 0.0 3-syll 53.0 29.4 75.9 22.3 100.0 0.0 4-syll 30.7 29.4 54.2 34.1 81.3 23.9 3&4-syll 44.1 25.7 67.2 23.3 92.5 9.6 All 62.1 20.4 78.4 13.8 95.8 5.3 Processing Encoding (w/in class subst)
2-syllable 39.6 44.8 35.2 47.8 * * 3-syllable 58.8 33.5 55.2 39.2 * * 4-syllable 66.3 27.0 62.8 33.7 100.0 0.0 3&4-syllable 62.8 25.3 63.3 32.0 100.0 0.0 All 61.2 25.4 60.8 33.9 100.0 0.0 Memory 4/3 75.3 31.4 79.4 27.3 95.1 6.4 3/2 80.5 20.4 91.9 11.0 100.0 0.0 4/2 62.5 30.7 75.7 29.1 95.1 6.4 Transcoding (w/out additions)
2-syllable 97.3 7.3 100.0 0.0 100.0 0.0 3-syllable 85.2 20.2 97.2 8.5 100.0 0.0 4-syllable 86.1 24.4 94.4 14.8 93.8 12.5 3&4-syllable 85.6 18.8 96.1 9.0 97.5 5.0 All 90.8 11.3 97.8 5.0 98.6 2.8
19
IIA1. SRT Performance Data: Percentage of Correctly Repeated Consonants
2-SYLLABLES:PCCR
Age (yrs)
3 4 5 6 7 8
Per
cent
age
50
60
70
80
90
100
110
Age (yrs)
3 4 5 6 7 8
Per
cent
age
30
40
50
60
70
80
90
100
110
3-SYLLABLES:PCCR
Age (yrs)
3 4 5 6 7 8
Per
cent
age
20
30
40
50
60
70
80
90
100
4-SYLLABLES:PCCR
Age (yrs)
3 4 5 6 7 8
Per
cent
age
30
40
50
60
70
80
90
100
3&4-SYLLABLES:PCCR
Age (yrs)
3 4 5 6 7 8
Per
cent
age
40
50
60
70
80
90
100
ALL:PCCR
BCDE

20
IIA2. SRT Performance Data: Percentage of Correctly Repeated
2-SYLLABLES: ITEMS CORRECT
Age (yrs)
3 4 5 6 7 8
Per
cent
age
30
40
50
60
70
80
90
100
110
3-SYLLABLES: ITEMS CORRECT
Age (yrs)
3 4 5 6 7 8
Per
cent
age
-20
0
20
40
60
80
100
120
4-SYLLABLES: ITEMS CORRECT
Age (yrs)
3 4 5 6 7 8
Per
cent
age
-20
0
20
40
60
80
100
3&4-SYLLABLES: ITEMS CORRECT
Age (yrs)
3 4 5 6 7 8
Per
cent
age
-20
0
20
40
60
80
100
ALL: ITEMS CORRECT
Age (yrs)
3 4 5 6 7 8
Per
cent
age
0
20
40
60
80
100
BCDE

21
IIA3. SRT Processes Data: Encoding *
2-SYLLABLES: WITHIN CLASS SUBSTITUTIONS
Age (yrs)
3 4 5 6 7 8
Per
cent
age
-20
0
20
40
60
80
100
120
140
3-SYLLABLES: WITHIN CLASS SUBSTITUTIONS
Age (yrs)
3 4 5 6 7 8
Per
cent
age
0
20
40
60
80
100
120
140
4-SYLLABLES: WITHIN CLASS SUBSTITUTIONS
Age (yrs)
3 4 5 6 7 8
Per
cent
age
0
20
40
60
80
100
120
140
3&4-SYLLABLES: WITHIN CLASS SUBSTITUTIONS
Age (yrs)
3 4 5 6 7 8
Per
cent
age
0
20
40
60
80
100
120
ALL: WITHIN CLASS SUBSTITUTIONS
Age (yrs)
3 4 5 6 7 8
Per
cent
age
0
20
40
60
80
100
120
BCDE

22
IIA4. SRT Processes Data: Memorial
BCDE
MEMORY: 4/3 SYLLABLES
Age (yrs)
3 4 5 6 7 8
Sca
led
Log
Sco
res
(per
cent
-like
)
20
40
60
80
100
120
MEMORY: 3/2 SYLLABLES*
Age (yrs)
3 4 5 6 7 8
Sca
led
Log
Sco
res
(per
cent
-like
)
30
40
50
60
70
80
90
100
110
MEMORY: 4/2 SYLLABLES
Age (yrs)
3 4 5 6 7 8
Sca
led
Log
Sco
res
(per
cent
-like
)
0
20
40
60
80
100

23
IIA5. SRT Processes Data: Transcoding
*
2-SYLLABLES: ITEMS WITHOUT ADDITIONS
Age (yrs)
3 4 5 6 7 8
Per
cent
age
75
80
85
90
95
100
105
110
3-SYLLABLES: ITEMS WITHOUT ADDITIONS
Age (yrs)
3 4 5 6 7 8
Per
cent
age
20
40
60
80
100
120
4-SYLLABLES: ITEMS WITHOUT ADDITIONS
Age (yrs)
3 4 5 6 7 8
Per
cent
age
40
50
60
70
80
90
100
110
120
3&4-SYLLABLES: ITEMS WITHOUT ADDITIONS
Age (yrs)
3 4 5 6 7 8
Per
cent
age
40
50
60
70
80
90
100
110
ALL SYLLABLES: ITEMS WITHOUT ADDITIONS
Age (yrs)
3 4 5 6 7 8
Per
cent
age
60
70
80
90
100
110
BCDE

24
Table IIB1 (Source BCD – Individual Ages). SRT Competence and Processing Scores for 132 participants with Speech Delay-Typical Language from ages 3 years to 8 years.
SPEECH DELAY-TYPICAL LANGUAGE Variable 3 Yrs 4 Yrs 5 Yrs 6 Yrs 7 Yrs 8 Yrs 9 Yrs 10 Yrs 11 Yrs 12 Yrs 13 Yrs 14 Yrs 15 Yrs 16 Yrs 17 Yrs (n=20) (n=34) (n=36) (n=29) (n=8) (n=5) M SD M SD M SD M SD M SD M SD M SD M SD M SD M SD M SD M SD M SD M SD M SD
Competence
Consonants Correct
2-syll 77.8 17.3 85.2 13.4 89.5 11.7 94.2 7.6 97.7 3.2 100.0 0.0 3-syll 58.7 20.8 67.3 18.0 73.5 19.2 77.0 16.2 93.1 7.1 94.4 6.8 4-syll 48.8 21.1 59.9 16.6 67.9 19.2 67.2 16.0 78.9 10.5 83.8 8.4 3&4-syll 54.0 19.4 63.8 15.7 70.8 16.9 72.4 13.4 86.4 7.9 89.4 5.7 All 61.6 16.5 70.7 13.8 76.8 13.7 79.4 10.4 90.0 6.1 92.8 3.9 Items Correct 2-syll 60.3 20.0 67.8 21.7 79.3 20.3 87.5 14.2 92.2 9.3 100.0 0.0 3-syll 21.7 23.6 28.3 24.5 41.4 29.5 48.3 27.6 79.2 17.3 83.3 20.4 4-syll 12.5 20.7 16.7 20.4 25.0 25.0 25.0 25.0 34.4 32.6 55.0 20.9 3&4-syll 18.0 20.4 23.6 20.9 34.9 24.8 39.0 23.7 61.3 19.6 72.0 17.9 All 36.9 17.3 43.3 19.6 54.6 20.1 60.5 16.6 75.0 13.6 84.4 9.9 Processing Encoding (w/in class subst)
2-syllable 48.0 39.5 57.5 37.9 51.2 38.3 60.0 47.1 66.7 57.7 * * 3-syllable 33.6 25.3 52.3 28.1 59.7 25.7 65.2 28.4 73.3 43.5 55.6 50.9 4-syllable 53.9 27.0 55.4 23.1 55.4 25.6 62.2 29.7 73.5 19.4 80.0 44.7 3&4-syllable 43.6 22.2 55.1 21.0 57.1 20.3 63.8 23.1 76.2 21.2 66.0 42.2 All 45.4 18.8 55.4 21.2 57.6 22.0 63.5 22.6 75.4 21.2 66.0 42.2 Memory 4/3 71.7 29.4 83.3 20.6 83.7 23.5 80.4 22.8 83.0 10.8 86.8 10.2 3/2 65.8 31.7 73.8 23.3 76.5 24.2 77.4 20.9 95.0 4.9 94.1 7.4 4/2 50.1 32.6 62.1 25.2 67.5 27.2 63.9 24.7 77.9 12.4 81.9 10.1 Transcoding (w/out additions)
2-syllable 93.8 8.6 92.0 13.2 96.4 7.2 97.4 6.1 96.9 5.8 100.0 0.0 3-syllable 80.7 26.6 70.7 28.6 82.4 19.8 89.7 20.1 93.8 12.4 96.7 7.5 4-syllable 85.0 24.9 73.5 28.6 80.0 25.6 81.9 24.0 81.3 25.9 85.0 22.4 3&4-syllable 82.4 23.4 71.8 22.6 81.4 17.5 86.6 17.6 88.8 16.4 92.0 13.0 All 87.5 15.7 80.8 16.6 88.1 11.1 91.4 10.6 92.4 10.3 95.6 7.2

25
Table IIB2 (Source BCD – Combined Ages). SRT Competence and Processing Scores for 132 participants with Speech Delay-Typical Language subgrouped from ages 3 years to 8 years.
SPEECH DELAY-TYPICAL LANGUAGE Variable 3-5 Yrs 6-8 Yrs (n=90) (n=42) M SD M SD M SD M SD M SD M SD M SD M SD M SD M SD M SD M SD M SD M SD M SD
Competence
Consonants Correct
2-syll 85.2 14.3 95.5 6.8 3-syll 67.8 19.8 82.1 15.9 4-syll 60.5 19.9 71.4 15.6 3&4-syll 64.4 18.1 77.1 13.7 All 71.1 15.4 83.0 10.6 Items Correct 2-syll 70.7 21.9 89.9 13.0 3-syll 32.0 27.4 58.3 29.0 4-syll 19.0 22.7 30.4 27.4 3&4-syll 26.8 23.2 47.1 25.3 All 46.3 20.4 66.1 17.5 Processing Encoding (w/in class subst)
2-syllable 52.8 38.0 61.1 47.1 3-syllable 50.5 28.1 65.5 32.0 4-syllable 55.1 24.7 66.6 30.1 3&4-syllable 53.2 21.5 66.5 25.3 All 54.0 21.3 66.1 25.0 Memory 4/3 80.8 24.2 81.7 19.7 3/2 73.1 25.8 82.7 19.3 4/2 61.5 28.3 68.7 22.5 Transcoding (w/out additions)
2-syllable 94.2 10.2 97.6 5.7 3-syllable 77.6 25.2 91.3 17.7 4-syllable 78.7 26.7 82.1 23.6 3&4-syllable 78.1 21.2 87.6 16.6 All 85.2 14.7 92.1 10.1

26
Table IIB3 (Source E – Individual Ages). SRT Competence and Processing Scores for 68 participants from Australia with Speech Delay-Typical Language from ages 4 to 5 years.
SPEECH DELAY-TYPICAL LANGUAGE Variable 3 Yrs 4 Yrs 5 Yrs 6 Yrs 7 Yrs 8 Yrs 9 Yrs 10 Yrs 11 Yrs 12 Yrs 13 Yrs 14 Yrs 15 Yrs 16 Yrs 17 Yrs (n= 26) (n=42) M SD M SD M SD M SD M SD M SD M SD M SD M SD M SD M SD M SD M SD M SD M SD
Competence
Consonants Correct
2-syll 82.5 19.0 80.3 17.9 3-syll 63.7 23.8 69.4 18.4 4-syll 58.4 21.7 63.6 16.9 3&4-syll 61.2 21.1 66.6 15.3 All 68.0 18.1 71.0 14.8 Items Correct 2-syll 69.2 26.7 63.1 29.0 3-syll 33.3 32.0 36.2 29.1 4-syll 23.1 27.3 20.7 24.3 3&4-syll 29.2 28.0 30.0 21.7 All 47.0 23.8 44.7 23.1 Processing Encoding (w/in class subst)
2-syllable 37.9 39.2 38.3 33.0 3-syllable 48.2 27.7 49.9 32.3 4-syllable 51.1 25.3 50.3 29.2 3&4-syllable 47.4 22.2 49.8 24.8 All 46.0 20.4 48.3 23.9 Memory 4/3 80.2 25.9 84.9 19.8 3/2 69.9 29.8 80.9 18.1 4/2 62.9 32.9 72.7 21.9 Transcoding (w/out additions)
2-syllable 93.3 12.4 92.7 15.6 3-syllable 85.3 19.0 76.8 26.6 4-syllable 79.8 23.5 74.4 28.2 3&4-syllable 83.1 16.4 75.9 24.4 All 87.6 12.7 83.3 17.7

27
Table IIB4 (Source E – Combined Ages). SRT Competence and Processing Scores for 70 participants from Australia with Speech Delay-Typical Language for ages 4 years to 6 years combined.
SPEECH DELAY-TYPICAL LANGUAGE Variable 4-6 Yrs (n=68) M SD M SD M SD M SD M SD M SD M SD M SD M SD M SD M SD M SD M SD M SD M SD
Competence
Consonants Correct
2-syll 81.4 18.1 3-syll 67.6 20.6 4-syll 61.6 18.7 3&4-syll 64.8 17.6 All 70.1 16.0 Items Correct 2-syll 65.9 28.0 3-syll 35.7 29.9 4-syll 21.7 25.3 3&4-syll 30.1 24.0 All 46.1 23.2 Processing Encoding (w/in class subst)
2-syllable 38.0 34.9 3-syllable 50.9 31.2 4-syllable 51.8 28.2 3&4-syllable 50.3 24.7 All 48.7 23.4 Memory 4/3 82.7 22.1 3/2 77.0 23.6 4/2 68.7 26.5 Transcoding (w/out additions)
2-syllable 93.1 14.1 3-syllable 80.4 23.9 4-syllable 77.2 26.3 3&4-syllable 79.1 21.7 All 85.3 15.9

28
IIIA1. SRT Performance Data: Percentage of Correctly Repeated Consonants
2-SYLLABLES:PCCR
Age (yrs)
4 5
Per
cent
age
80
85
90
95
100
105
Age (yrs)
4 5
Per
cent
age
30
40
50
60
70
80
90
100
3-SYLLABLES:PCCR
Age (yrs)
4 5
Per
cent
age
20
40
60
80
100
120
4-SYLLABLES:PCCR
Age (yrs)
4 5
Per
cent
age
30
40
50
60
70
80
90
100
110
3&4-SYLLABLES:PCCR
Age (yrs)
4 5
Per
cent
age
40
50
60
70
80
90
100
110
ALL:PCCR
BCD

29
IIIA2. SRT Performance Data: Percentage of Correctly Repeated Items
2-SYLLABLES: ITEMS CORRECT
Age (yrs)
4 5
Per
cent
age
50
60
70
80
90
100
110
3-SYLLABLES: ITEMS CORRECT
Age (yrs)
4 5
Per
cent
age
10
20
30
40
50
60
70
4-SYLLABLES: ITEMS CORRECT
Age (yrs)
4 5
Per
cent
age
-20
0
20
40
60
80
100
120
3&4-SYLLABLES: ITEMS CORRECT
Age (yrs)
4 5
Per
cent
age
0
20
40
60
80
100
ALL: ITEMS CORRECT
Age (yrs)
4 5
Per
cent
age
30
40
50
60
70
80
90
100
BCD
30
IIIA3. SRT Processes Data: Encoding
*
2-SYLLABLES: WITHIN CLASS SUBSTITUTIONS
Age (yrs)
4 5
Per
cent
age
-20
-10
0
10
20
30
40
3-SYLLABLES: WITHIN CLASS SUBSTITUTIONS
Age (yrs)
4 5
Per
cent
age
0
10
20
30
40
50
60
70
4-SYLLABLES: WITHIN CLASS SUBSTITUTIONS
Age (yrs)
4 5
Per
cent
age
20
40
60
80
100
120
3&4-SYLLABLES: WITHIN CLASS SUBSTITUTIONS
Age (yrs)
4 5
Per
cent
age
30
40
50
60
70
80
ALL: WITHIN CLASS SUBSTITUTIONS
Age (yrs)
4 5
Per
cent
age
20
30
40
50
60
70
80
BCD

31
IIIA4. SRT Processes Data: Memorial
BCD
MEMORY: 4/3 SYLLABLES
Age (yrs)
4 5
Sca
led
Log
Sco
res
(per
cent
-like
)
20
40
60
80
100
120
140
MEMORY: 3/2 SYLLABLES*
Age (yrs)
4 5
Sca
led
Log
Sco
res
(per
cent
-like
)
50
60
70
80
90
100
MEMORY: 4/2 SYLLABLES
Age (yrs)
4 5
Sca
led
Log
Sco
res
(per
cent
-like
)
0
20
40
60
80
100
120
140
32
IIIA5. SRT Processes Data: Transcoding *
2-SYLLABLES: ITEMS WITHOUT ADDITIONS
Age (yrs)
4 5
Per
cent
age
80
85
90
95
100
105
3-SYLLABLES: ITEMS WITHOUT ADDITIONS
Age (yrs)
4 5
Per
cent
age
50
60
70
80
90
100
110
4-SYLLABLES: ITEMS WITHOUT ADDITIONS
Age (yrs)
4 5
Per
cent
age
30
40
50
60
70
80
90
100
110
3&4-SYLLABLES: ITEMS WITHOUT ADDITIONS
Age (yrs)
4 5
Per
cent
age
50
60
70
80
90
100
110
ALL SYLLABLES: ITEMS WITHOUT ADDITIONS
Age (yrs)
4 5
Per
cent
age
70
75
80
85
90
95
100
105
BCD

33
Table IIIB1 (Source BCD – Individual Ages). SRT Competence and Processing Scores for 11 participants with Typical Speech-Language Impairment from ages 4 to 5 years.
TYPICAL SPEECH- LANGUAGE IMPAIRMENT Variable 3 Yrs 4 Yrs 5 Yrs 6 Yrs 7 Yrs 8 Yrs 9 Yrs 10 Yrs 11 Yrs 12 Yrs 13 Yrs 14 Yrs 15 Yrs 16 Yrs 17 Yrs (n=8) (n=3) M SD M SD M SD M SD M SD M SD M SD M SD M SD M SD M SD M SD M SD M SD M SD
Competence
Consonants Correct
2-syll 89.1 7.3 100.0 0.0 3-syll 61.1 22.6 75.9 12.8 4-syll 52.3 24.1 72.9 36.6 3&4-syll 57.0 22.1 74.5 24.0 All 67.3 15.8 82.7 16.3 Items Correct 2-syll 75.0 14.9 100.0 0.0 3-syll 33.3 19.9 55.6 9.6 4-syll 18.8 22.2 50.0 50.0 3&4-syll 27.5 18.3 53.3 25.2 All 48.6 15.1 74.1 14.0 Processing Encoding (w/in class subst)
2-syllable 13.9 22.2 * * 3-syllable 50.8 15.8 33.3 33.3 4-syllable 55.5 24.1 75.0 35.4 3&4-syllable 52.2 17.8 53.3 17.6 All 48.1 16.2 53.3 17.6 Memory 4/3 70.5 33.4 77.6 38.7 3/2 75.9 16.1 71.4 17.9 4/2 51.0 28.6 62.2 54.3 Transcoding (w/out additions)
2-syllable 93.8 9.4 100.0 0.0 3-syllable 77.1 17.7 94.4 9.6 4-syllable 71.9 31.2 100.0 0.0 3&4-syllable 75.0 20.0 96.7 5.8 All 83.3 9.4 98.1 3.2

34
Table IIIB2 (Source BCD – Combined Ages). SRT Competence and Processing Scores for 11 participants with Typical Speech-Language Impairment for ages 4 and 5 years combined.
TYPICAL SPEECH–LANGUAGE IMPAIRMENT Variable 4&5 Yrs (n=11) M SD M SD M SD M SD M SD M SD M SD M SD M SD M SD M SD M SD M SD M SD M SD
Competence
Consonants Correct
2-syll 92.0 8.0 3-syll 65.2 20.9 4-syll 58.0 27.7 3&4-syll 61.8 22.9 All 71.5 16.7 Items Correct 2-syll 81.8 17.1 3-syll 39.4 20.1 4-syll 27.3 32.5 3&4-syll 34.5 22.5 All 55.6 18.4 Processing Encoding (w/in class subst)
2-syllable 13.9 22.2 3-syllable 45.6 22.0 4-syllable 59.8 25.8 3&4-syllable 52.6 16.8 All 49.7 15.8 Memory 4/3 72.5 33.0 3/2 65.6 25.6 4/2 54.1 34.5 Transcoding (w/out additions)
2-syllable 95.5 8.4 3-syllable 81.8 17.4 4-syllable 79.5 29.2 3&4-syllable 80.9 19.7 All 87.4 10.6

35
IVA1. SRT Performance Data: Percentage of Correctly Repeated Consonants
2-SYLLABLES:PCCR
Age (yrs)
3 4 5 6 7
Per
cent
age
40
50
60
70
80
90
100
110
Age (yrs)
3 4 5 6 7
Per
cent
age
0
20
40
60
80
100
3-SYLLABLES:PCCR
Age (yrs)
3 4 5 6 7
Per
cent
age
0
20
40
60
80
100
4-SYLLABLES:PCCR
Age (yrs)
3 4 5 6 7
Per
cent
age
0
20
40
60
80
100
3&4-SYLLABLES:PCCR
Age (yrs)
3 4 5 6 7
Per
cent
age
20
30
40
50
60
70
80
90
100
ALL:PCCR
BCDE

36
IVA2. SRT Performance Data: Percentage of Correctly Repeated Items
2-SYLLABLES: ITEMS CORRECT
Age (yrs)
3 4 5 6 7
Per
cent
age
0
20
40
60
80
100
120
3-SYLLABLES: ITEMS CORRECT
Age (yrs)
3 4 5 6 7
Per
cent
age
-20
0
20
40
60
80
4-SYLLABLES: ITEMS CORRECT
Age (yrs)
3 4 5 6 7
Per
cent
age
-20
0
20
40
60
80
100
3&4-SYLLABLES: ITEMS CORRECT
Age (yrs)
3 4 5 6 7
Per
cent
age
-20
0
20
40
60
80
ALL: ITEMS CORRECT
Age (yrs)
3 4 5 6 7
Per
cent
age
0
10
20
30
40
50
60
70
80
BCDE

37
IVA3. SRT Processes Data: Encoding
*
2-SYLLABLES: WITHIN CLASS SUBSTITUTIONS
Age (yrs)
3 4 5 6 7
Per
cent
age
-20
0
20
40
60
80
100
120
140
3-SYLLABLES: WITHIN CLASS SUBSTITUTIONS
Age (yrs)
3 4 5 6 7
Per
cent
age
0
20
40
60
80
100
120
4-SYLLABLES: WITHIN CLASS SUBSTITUTIONS
Age (yrs)
3 4 5 6 7
Per
cent
age
0
20
40
60
80
100
3&4-SYLLABLES: WITHIN CLASS SUBSTITUTIONS
Age (yrs)
3 4 5 6 7
Per
cent
age
0
20
40
60
80
100
ALL: WITHIN CLASS SUBSTITUTIONS
Age (yrs)
3 4 5 6 7
Per
cent
age
0
20
40
60
80
100
BCDE

38
IVA4. SRT Processes Data: Memorial
BCDE
MEMORY: 4/3 SYLLABLES
Age (yrs)
3 4 5 6 7
Sca
led
Log
Sco
res
(per
cent
-like
)
0
20
40
60
80
100
120
MEMORY: 3/2 SYLLABLES*
Age (yrs)
3 4 5 6 7
Sca
led
Log
Sco
res
(per
cent
-like
)
0
20
40
60
80
100
120
MEMORY: 4/2 SYLLABLES
Age (yrs)
3 4 5 6 7
Sca
led
Log
Sco
res
(per
cent
-like
)
0
20
40
60
80
100
120

39
IVA5. SRT Processes Data: Transcoding
*
2-SYLLABLES: ITEMS WITHOUT ADDITIONS
Age (yrs)
3 4 5 6 7
Per
cent
age
75
80
85
90
95
100
105
110
3-SYLLABLES: ITEMS WITHOUT ADDITIONS
Age (yrs)
3 4 5 6 7
Per
cent
age
20
40
60
80
100
120
140
4-SYLLABLES: ITEMS WITHOUT ADDITIONS
Age (yrs)
3 4 5 6 7
Per
cent
age
0
20
40
60
80
100
120
3&4-SYLLABLES: ITEMS WITHOUT ADDITIONS
Age (yrs)
3 4 5 6 7
Per
cent
age
20
40
60
80
100
120
ALL SYLLABLES: ITEMS WITHOUT ADDITIONS
Age (yrs)
3 4 5 6 7
Per
cent
age
50
60
70
80
90
100
110
BCDE
40
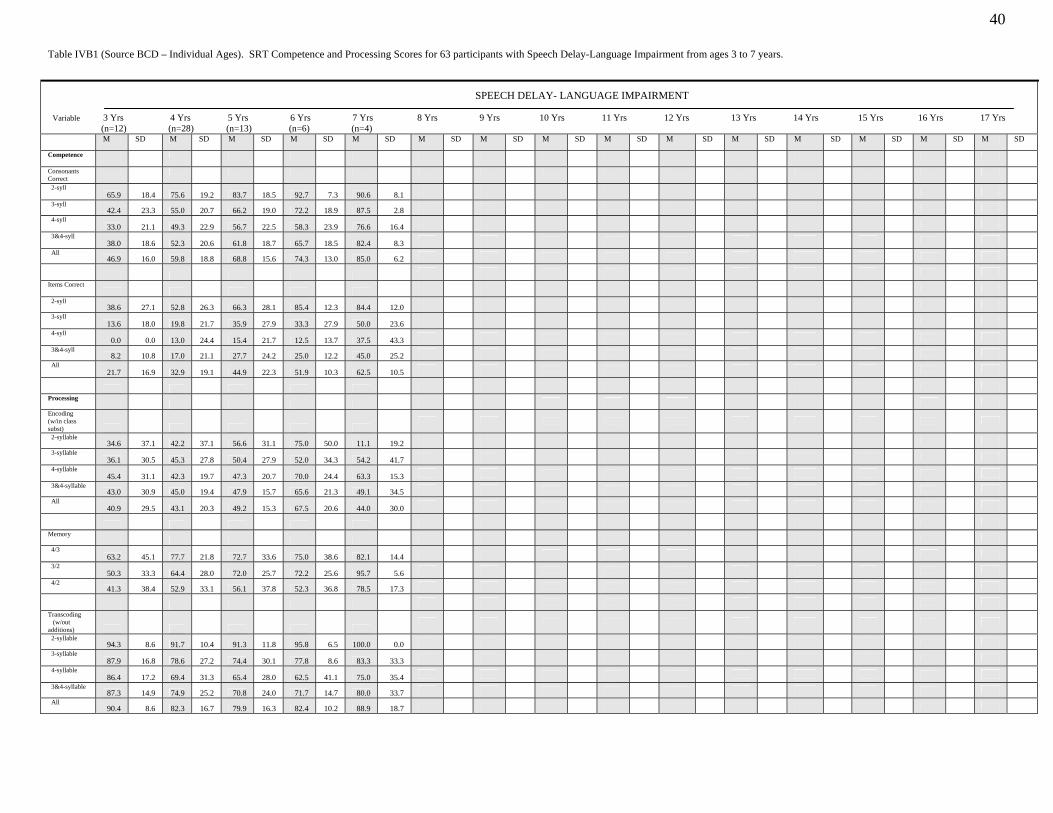
Table IVB1 (Source BCD – Individual Ages). SRT Competence and Processing Scores for 63 participants with Speech Delay-Language Impairment from ages 3 to 7 years.
SPEECH DELAY- LANGUAGE IMPAIRMENT Variable 3 Yrs 4 Yrs 5 Yrs 6 Yrs 7 Yrs 8 Yrs 9 Yrs 10 Yrs 11 Yrs 12 Yrs 13 Yrs 14 Yrs 15 Yrs 16 Yrs 17 Yrs (n=12) (n=28) (n=13) (n=6) (n=4) M SD M SD M SD M SD M SD M SD M SD M SD M SD M SD M SD M SD M SD M SD M SD
Competence
Consonants Correct
2-syll 65.9 18.4 75.6 19.2 83.7 18.5 92.7 7.3 90.6 8.1
3-syll 42.4 23.3 55.0 20.7 66.2 19.0 72.2 18.9 87.5 2.8
4-syll 33.0 21.1 49.3 22.9 56.7 22.5 58.3 23.9 76.6 16.4
3&4-syll 38.0 18.6 52.3 20.6 61.8 18.7 65.7 18.5 82.4 8.3
All 46.9 16.0 59.8 18.8 68.8 15.6 74.3 13.0 85.0 6.2
Items Correct
2-syll 38.6 27.1 52.8 26.3 66.3 28.1 85.4 12.3 84.4 12.0
3-syll 13.6 18.0 19.8 21.7 35.9 27.9 33.3 27.9 50.0 23.6
4-syll 0.0 0.0 13.0 24.4 15.4 21.7 12.5 13.7 37.5 43.3
3&4-syll 8.2 10.8 17.0 21.1 27.7 24.2 25.0 12.2 45.0 25.2
All 21.7 16.9 32.9 19.1 44.9 22.3 51.9 10.3 62.5 10.5
Processing
Encoding (w/in class subst)
2-syllable 34.6 37.1 42.2 37.1 56.6 31.1 75.0 50.0 11.1 19.2
3-syllable 36.1 30.5 45.3 27.8 50.4 27.9 52.0 34.3 54.2 41.7
4-syllable 45.4 31.1 42.3 19.7 47.3 20.7 70.0 24.4 63.3 15.3
3&4-syllable 43.0 30.9 45.0 19.4 47.9 15.7 65.6 21.3 49.1 34.5
All 40.9 29.5 43.1 20.3 49.2 15.3 67.5 20.6 44.0 30.0
Memory
4/3 63.2 45.1 77.7 21.8 72.7 33.6 75.0 38.6 82.1 14.4
3/2 50.3 33.3 64.4 28.0 72.0 25.7 72.2 25.6 95.7 5.6
4/2 41.3 38.4 52.9 33.1 56.1 37.8 52.3 36.8 78.5 17.3
Transcoding (w/out additions)
2-syllable 94.3 8.6 91.7 10.4 91.3 11.8 95.8 6.5 100.0 0.0
3-syllable 87.9 16.8 78.6 27.2 74.4 30.1 77.8 8.6 83.3 33.3
4-syllable 86.4 17.2 69.4 31.3 65.4 28.0 62.5 41.1 75.0 35.4
3&4-syllable 87.3 14.9 74.9 25.2 70.8 24.0 71.7 14.7 80.0 33.7
All 90.4 8.6 82.3 16.7 79.9 16.3 82.4 10.2 88.9 18.7

41
TableIVB2 (Source BCD – Combined Ages). SRT Competence and Processing Scores for 67 participants with Speech Delay-Language Impairment subgrouped for ages 3 to 14 years.
SPEECH DELAY–LANGUAGE IMPAIRMENT Variable 3-5 Yrs 6&7 Yrs 13&14 Yrs (n=53) (n=10) (n=4) M SD M SD M SD M SD M SD M SD M SD M SD M SD M SD M SD M SD M SD M SD M SD
Competence
Consonants Correct
2-syll 75.6 19.4 91.9 7.2 96.9 6.3 3-syll 55.2 22.1 78.3 16.2 77.8 17.6 4-syll 47.7 23.5 65.6 22.3 75.0 16.9 3&4-syll 51.6 21.1 72.4 16.9 76.5 15.6 All 59.3 18.7 78.6 11.7 83.0 10.5 Items Correct 2-syll 53.2 28.0 85.0 11.5 93.8 12.5 3-syll 22.5 23.8 40.0 26.3 54.2 28.5 4-syll 10.8 21.4 22.5 29.9 31.3 47.3 3&4-syll 17.8 21.0 33.0 20.0 45.0 31.1 All 33.6 20.8 56.1 11.3 66.7 18.7 Processing Encoding (w/in class subst)
2-syllable 43.3 36.0 47.6 50.4 50.0 * 3-syllable 44.9 28.1 52.9 35.1 68.1 21.9 4-syllable 44.2 22.1 67.7 21.0 48.9 15.4 3&4-syllable 45.4 21.0 59.0 26.9 65.1 24.8 All 44.1 21.5 58.1 26.1 65.5 24.3 Memory 4/3 73.3 31.0 77.9 30.2 90.0 12.5 3/2 63.3 29.1 81.6 22.9 75.7 27.0 4/2 51.2 35.2 62.8 32.2 72.9 20.4 Transcoding (w/out additions)
2-syllable 92.2 10.3 97.5 5.3 100.0 0.0 3-syllable 79.5 26.1 80.0 20.5 100.0 0.0 4-syllable 72.1 28.6 67.5 37.4 93.8 12.5 3&4-syllable 76.5 23.4 75.0 22.7 97.5 5.0 All 83.4 15.5 85.0 13.6 98.6 2.8

42
Table IVB3 (Source E – Individual Ages). SRT Competence and Processing Scores for 21 participants from Australia with Speech Delay-Language Impairment from ages 4 years to 5 years.
SPEECH DELAY-LANGUAGE IMPAIRMENT Variable 3 Yrs 4 Yrs 5 Yrs 6 Yrs 7 Yrs 8 Yrs 9 Yrs 10 Yrs 11 Yrs 12 Yrs 13 Yrs 14 Yrs 15 Yrs 16 Yrs 17 Yrs (n=8) (n=13) M SD M SD M SD M SD M SD M SD M SD M SD M SD M SD M SD M SD M SD M SD M SD
Competence
Consonants Correct
2-syll 76.6 15.9 80.3 19.1 3-syll 59.7 17.5 57.7 24.2 4-syll 62.5 18.3 53.8 25.6 3&4-syll 61.0 17.3 55.9 23.0 All 66.0 13.8 63.7 19.9 Items Correct 2-syll 56.3 24.1 66.3 31.6 3-syll 16.7 21.8 23.1 29.3 4-syll 21.9 28.1 13.5 19.4 3&4-syll 18.8 23.6 19.2 24.3 All 35.4 19.9 40.2 25.7 Processing Encoding (w/in class subst)
2-syllable 34.6 37.0 49.8 40.9 3-syllable 27.2 22.2 47.8 32.2 4-syllable 58.9 22.5 60.0 29.7 3&4-syllable 42.4 11.5 55.1 24.0 All 41.5 12.2 55.7 24.3 Memory 4/3 97.2 4.4 77.4 26.8 3/2 71.6 26.2 62.2 34.1 4/2 71.9 28.6 56.5 36.9 Transcoding (w/out additions)
2-syllable 96.9 8.8 94.2 11.0 3-syllable 75.0 19.9 69.2 32.5 4-syllable 81.3 25.9 67.3 31.3 3&4-syllable 77.5 18.3 68.5 29.1 All 86.1 11.5 79.9 18.8

43
TableIVB4 (Source E – Combined Ages). SRT Competence and Processing Scores for 21 participants from Australia with Speech Delay-Language Impairment for ages 4 years and 5 years combined.
SPEECH DELAY- LANGUAGE IMPAIRMENT Variable 4&5 Yrs (n=21) M SD M SD M SD M SD M SD M SD M SD M SD M SD M SD M SD M SD M SD M SD M SD
Competence
Consonants Correct
2-syll 78.9 17.6 3-syll 58.5 21.4 4-syll 57.1 23.0 3&4-syll 57.8 20.7 All 64.6 17.5 Items Correct 2-syll 62.5 28.8 3-syll 20.6 26.3 4-syll 16.7 22.8 3&4-syll 19.0 23.4 All 38.4 23.2 Processing Encoding (w/in class subst)
2-syllable 42.6 38.7 3-syllable 40.0 30.0 4-syllable 59.6 26.6 3&4-syllable 50.3 20.7 All 50.3 21.3 Memory 4/3 84.9 23.1 3/2 65.8 31.0 4/2 62.3 34.1 Transcoding (w/out additions)
2-syllable 95.2 10.1 3-syllable 71.4 28.0 4-syllable 72.6 29.5 3&4-syllable 71.9 25.4 All 82.3 16.4

44
REFERENCES
Shriberg, L. D. (1993). Four new speech and prosody-voice measures for genetics research and
other studies in developmental phonological disorders. Journal of Speech and Hearing
Research, 36, 105–140.
Shriberg, L. D. & Lohmeier, H. L. (2008). The Syllable Repetition Task (Tech. Rep. No. 14).
Phonology Project, Waisman Center, University of Wisconsin-Madison.
Shriberg, L. D., Lohmeier, H. L., Campbell, T. F., Dollaghan, C. A., Green, J. R., & Moore, C.
A. (2009). A nonword repetition task for speakers with misarticulations: The Syllable
Repetition Task (SRT). Journal of Speech, Language, and Hearing Research, 52,
1189-1212.
Shriberg, L. D., Lohmeier, H. L., Strand, E. A., & Jakielski, K. J. (2011). Encoding, memorial,
and transcoding deficits in Childhood Apraxia of Speech. Manuscript submitted
for publication.