reexamination of the relationship between … · reexamination of the relationship between...
TRANSCRIPT

GLOBAL JOURNAL OF BUSINESS RESEARCH ♦ Volume 3 ♦ Number 1 ♦2009
REEXAMINATION OF THE RELATIONSHIP BETWEEN DISCLOSURE AND COST OF CAPITAL
Randall Zhaohui Xu, University of Houston-Clear Lake
ABSTRACT
This study examines how information environment and industry concentration affect the relations between firms’ financial disclosure quality and cost of capital. Information environment is proxied by firm size, and industry concentration is proxied by four-firm concentration ratio. The study finds a significant negative association between financial disclosure quality and cost of capital only for small firms and firms in more concentrated industries. The results of this study suggest that the contradictory findings in the extant accounting literature (Botosan, 1997; Botosan and Plumlee, 2002; Cheng et al., 2006) may be driven by variation in their sample in terms of firm size. The findings in this paper suggest that managers of small firms should recognize the significant role of disclosure in reducing cost of capital and increase their financial disclosure to enhance firm value.
JEL: M41, G14, D80. INTRODUCTION
he role of accounting information in firm valuation and corporate finance has been an intriguing topic in voluntary disclosure literature. However, the findings are inconsistent in the extant literature on the relation between corporate disclosure and cost of capital. Using a self-constructed
index to measure the amount of disclosure in firms’ financial reports, Botosan (1997) documents a significant negative association between firms’ disclosure level and cost of capital for a sample of manufacturing firms. On the other hand, Cheng et al. (2006) find a significant positive relation between Standard & Poor’s Transparency & Disclosure rankings and cost of capital for S&P 500 firms.
T This study examines the relation between corporate disclosure and cost of capital in the context of information environment (hereafter, IE) and industry competition in order to provide a potential explanation for the mixed findings. Prior studies have been treating disclosing firms as a homogeneous group. This paper is the first empirical study that directly tests whether the impacts of disclosure on cost of capital vary with firm size and industry competition. A firm’s information environments refer to the aggregate information available on the firm from all sources, including the firm’s corporate disclosure, public media coverage and private information production by investors, etc. Therefore, the weight of a firm’s disclosure in the information environment varies with the amount of information from other sources. Prior disclosure studies ignore the existence of other sources of information, implicitly assuming that corporate disclosure is the only source of information available to investors. However, public media and private information production activities by institutional investors and financial analysts contribute substantial information on the firms. Empirical evidence shows that there is systematic difference between large and small firms’ IEs. Public media and private information production activities tend to focus on large firms (Atiase, 1980; Bhushan, 1989). Large firms generally make more disclosure than small firms do (Land and Lundholm, 1993). On the other hand, financial reporting regulations by the SEC on publicly traded corporations require all public firms to file a whole set of financial reports and forms, thus guaranteeing substantial flows of financial disclosure from all public firms. As a result, financial disclosure constitutes a bigger component of small
15
R.Z. Xu| Global Journal of Business Research ♦ Vol. 3 ♦ No. 1 ♦2009
firms’ IEs than of large firms’ IEs. A given level of disclosure should have a bigger impact on small firms than on large firms. Prior studies also fail to consider the costs associated with disclosure. Disclosure to investors may damage firms’ competitive position by releasing relevant information to competitors (i.e. proprietary costs, Verrecchia, 1983). Harris (1998) finds that firms in highly concentrated industries make less disclosure on their segment operations than firms in more competitive industries, suggesting that proprietary costs associated with disclosure increase with industry concentration. These costs offset the benefits from disclosure. Therefore, disclosure’s impacts on cost of capital vary with the degree of industry competition. This paper finds a significant negative association between disclosure quality and cost of capital for small firms. No significant relation is found for large firms. After controlling for the effect of information environment, industry competition has a marginally significant incremental impact on the relation between disclosure and cost of capital. These results suggest that the impact of disclosure on cost of capital varies with firms’ information environment and industry competition. Financial reporting disclosure is more effective at reducing small firms’ cost of capital than large firms’ cost of capital. Therefore, by pooling firms of all sizes in the sample, prior studies may get biased results about the effect of disclosure quality on cost of capital. The findings of this paper suggest that difference in firm sizes of their samples may account for the inconsistent findings in prior disclosure studies. The above findings provide supporting evidence for Zhang (2001), who posits that the relation between disclosure and cost of capital depends on certain firm characteristics such as private information production costs and proprietary costs. This paper also extends Atiase (1985, 1987) and Bamber (1986, 1987). While they find that stock price and volume reactions to small firms’ earnings releases are larger than to those of large firms, this study investigates how the impact of disclosure on cost of capital varies with firm size and industry concentration. The paper proceeds as follows. Section II develops hypotheses. Section III contains data selection criteria and sample description. Section IV presents research design and test results. Section V concludes the paper with discussions on limitations and implications. LITERATURE REVIEW Extant research provides both theoretical modeling and empirical evidence on the relationship between disclosure and cost of capital. Theoretical research models the potential impacts of disclosure on cost of capital in two different dimensions (Botosan, 1997). On the one hand, prior research (Barry and Brown, 1985; Clarkson et al., 1996) suggest that disclosure reduces the information asymmetry between managers and investors and thus help investors better estimate stock returns through more accurate assessment of the business’ true performance. On the other hand, disclosure may also increase stock liquidity, thereby reducing stock transaction costs and increasing demand for a firm’s stock (Amihud and Mendelson, 1986; Diamond and Verrecchia, 1991). There is mixed empirical evidence on the relationship between cost of capital and disclosure. Welker (1995) finds that higher levels of disclosure levels lead to lower bid-ask spreads. Botosan (1997) find a significant negative association between firms’ disclosure level and cost of capital for a sample of manufacturing firms. Francis et al. (2005) provide international evidence that disclosure reduces cost of external financing. On the other hand, Botosan and Plumlee (2002) find no significant relation between AIMR (Association of Investment Management and Research) rankings of firms’ overall corporate disclosure and cost of capital. Cheng et al. (2006) find a significant positive relation between Standard & Poor’s Transparency & Disclosure rankings and cost of capital for S&P 500 firms.
16

GLOBAL JOURNAL OF BUSINESS RESEARCH ♦ Volume 3 ♦ Number 1 ♦2009
Hypothesis Development The Role of Information Environments as Proxied by Firm Size : A firm’s information environment (IE) consists of the aggregate information about the firm from all sources, including firms’ disclosure, public media coverage, and private information production activities by sophisticated investors and financial analysts. Empirical evidence shows that there are systematic differences between small and large firms’ IEs. Large firms generally have richer IEs than small firms. Public media tend to focus on large firms, thus providing more information on large firms than on small firms. Atiase (1980) provides evidence that the Wall Street Journal publishes fewer items concerning small firms than large firms. Grant (1980) finds that there are fewer WSJ articles about OTC firms than NYSE firms. Private information production activities by investors and financial analysts increase with firm size. Arbel et al (1983) and Bhushan (1989) report that financial analysts, whose primary customers are institutional investors, concentrate their activities on large firms. Investors can potentially earn greater trading profits by engaging in private information acquisition activities on a large firm than on a small firm (Atiase 1980). Large firms tend to make more disclosure than small firms because of higher public demand for information on large firms, lower information processing costs and higher litigation costs. Lev and Penman (1990) indicate that the financial press reports more earnings forecasts for large firms than for small firms. Skinner (1992) finds that the management tends to make preemptive disclosure to avoid legal liabilities. Chow and Wong-Boren (1987) find that the extent of voluntary financial disclosure of Mexican corporations is positively related to firm size. The SEC also advocates that large firms have richer information than small firms. The SEC notes that those largest firms provide a steady stream of high quality information to the marketplace. Investors and analysts are constantly uncovering and digesting information regarding the large firms, and information about those firms is broadly disseminated on a timely basis by the financial press and other participants in the market. Thus, the SEC allows only the largest firms to make shelf registrations of new stock issuances. The structure of the IEs of small and large firms is also different. The SEC requires all public firms to file a whole set of financial reports and forms, thus ensuring that firms provide at least certain levels of disclosure to investors. Due to the lack of attention from public media and financial analysts on small firms, disclosure constitutes a bigger component of small firms’ IEs than large firms’ IEs. Therefore, firm size serves as a valid proxy for the different IEs of small and large firms. Empirical evidence shows that large firms’ disclosure has less information content and less impact on stock prices than small firms’ disclosure. Zeghal (1984) provides evidence that because of less information available on small firms, small firms’ financial statements have more information content than those of large firms. Freeman (1987) finds that security prices start to anticipate large firms’ earnings at an earlier time than small firms’ earnings. A given level of unexpected earnings induces higher cumulative abnormal returns for small firms than for large firms. Bamber (1987) finds that trading volume reactions to small firms’ quarterly earnings announcements are greater and last longer than the reactions to large firms’ earnings announcements. Kross and Schroeder (1989) find that price reactions to a firm’ earnings announcements are inversely related with the amount of pre-announcement coverage on the firm in the Wall Street Journal. Their findings suggest that the marginal effect of disclosure on
17

R.Z. Xu| Global Journal of Business Research ♦ Vol. 3 ♦ No. 1 ♦2009
investors’ estimation of stock returns decreases with the amount of predisclosure information from other sources. Finance theories suggest that disclosure can lower firms’ cost of capital by providing information to reduce information asymmetry (i.e. the asymmetric information possessed by the management and by the outside investors) and help investors to estimate firms’ future prospects. Because of the lack of attention from public media and financial analysts on small firms, small firms’ disclosure is expected to play a more significant role in helping investors to estimate firms’ future performance and return distributions. The impact of large firms’ disclosure is mitigated by large firms’ rich IEs. Therefore, the inverse association between disclosure and cost of capital predicted by disclosure theories is expected to be significant only for small firms. Ho1: The relationship between disclosure quality and cost of capital does not vary with firm size. Ha1: Disclosure quality has a significant inverse association with cost of capital for small firms. Disclosure quality does not have a significant association with cost of capital for large firms. Industry Competition Fields et al (2001) suggest that research on the relation between disclosure and cost of capital should consider not only the benefits, but also the cost associated with disclosure. Without considering costs associated with disclosure, we cannot explain why not all firms select the highest possible disclosure level if higher disclosure results in lower cost of capital. Zhang (2001) suggests that corporate disclosure could have either a positive or a negative impact on cost of capital depending on firm characteristics such as proprietary costs. Proprietary costs refer to that disclosure to investors may damage firms’ competitive position by revealing relevant information to competitors (Verrecchia, 1983). Core (2001) suggests that firms optimize their disclosure policy by trading off the benefits in reducing information asymmetry component of cost of capital against the proprietary costs. Prior research shows that proprietary costs are associated with industry competition. Darrough and Stoughton (1990) theoretically demonstrate that firms in highly concentrated industries have less incentive to make informative disclosure for fear of attracting competition and regulators’ attention, while firms in more competitive industries tend to provide more informative disclosure to discourage new entry. Empirically, Harris (1998) finds that firms in more concentrated industries generally enjoy abnormal profits and large market shares. As a result, they are reluctant to reveal information about their operations for fear of attracting competitors and regulations. Harris’ findings suggest that proprietary and political costs increase with industry concentration. Those costs offset the potential benefits of disclosure. Therefore, it would be more likely to find a significant negative relation between disclosure and cost of capital in less concentrated industries than in more concentrated ones. Ho2: The relationship between disclosure quality and cost of capital does not vary with industry concentration. Ha2: Disclosure quality has a significant inverse association with cost of capital for firms in less concentrated industries. Disclosure quality does not have a significant association with cost of capital for firms in more concentrated industries.
18
GLOBAL JOURNAL OF BUSINESS RESEARCH ♦ Volume 3 ♦ Number 1 ♦2009
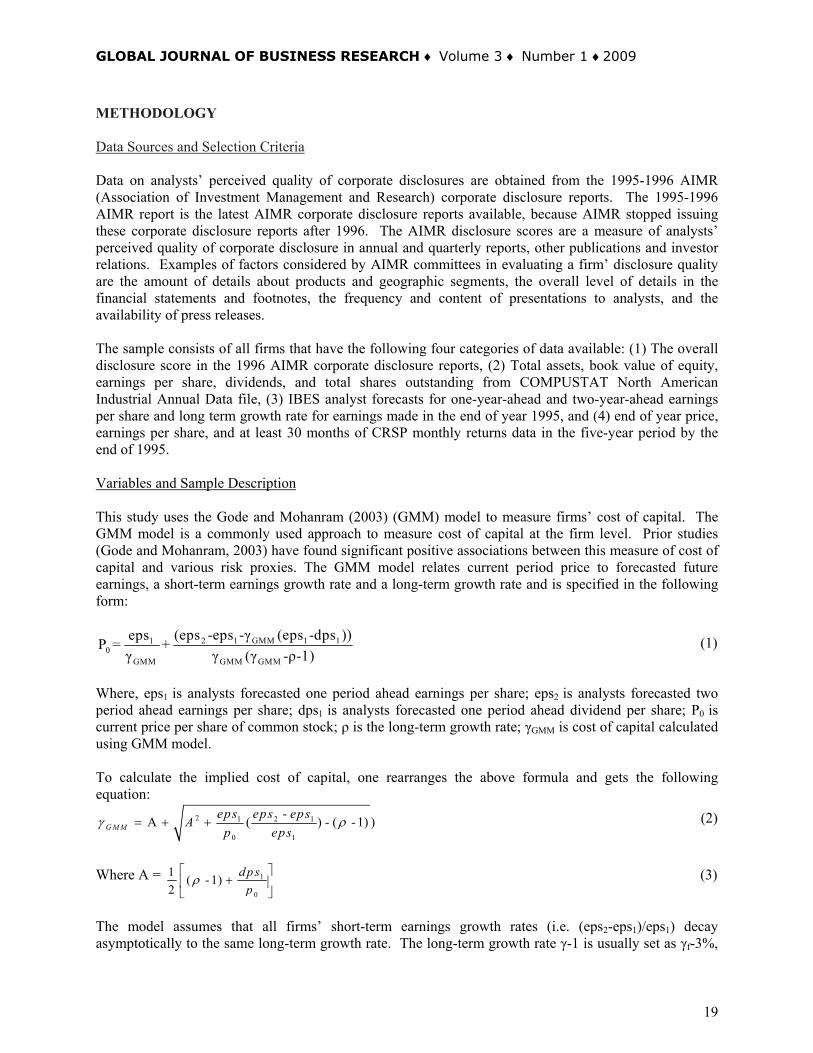
METHODOLOGY Data Sources and Selection Criteria Data on analysts’ perceived quality of corporate disclosures are obtained from the 1995-1996 AIMR (Association of Investment Management and Research) corporate disclosure reports. The 1995-1996 AIMR report is the latest AIMR corporate disclosure reports available, because AIMR stopped issuing these corporate disclosure reports after 1996. The AIMR disclosure scores are a measure of analysts’ perceived quality of corporate disclosure in annual and quarterly reports, other publications and investor relations. Examples of factors considered by AIMR committees in evaluating a firm’ disclosure quality are the amount of details about products and geographic segments, the overall level of details in the financial statements and footnotes, the frequency and content of presentations to analysts, and the availability of press releases. The sample consists of all firms that have the following four categories of data available: (1) The overall disclosure score in the 1996 AIMR corporate disclosure reports, (2) Total assets, book value of equity, earnings per share, dividends, and total shares outstanding from COMPUSTAT North American Industrial Annual Data file, (3) IBES analyst forecasts for one-year-ahead and two-year-ahead earnings per share and long term growth rate for earnings made in the end of year 1995, and (4) end of year price, earnings per share, and at least 30 months of CRSP monthly returns data in the five-year period by the end of 1995. Variables and Sample Description This study uses the Gode and Mohanram (2003) (GMM) model to measure firms’ cost of capital. The GMM model is a commonly used approach to measure cost of capital at the firm level. Prior studies (Gode and Mohanram, 2003) have found significant positive associations between this measure of cost of capital and various risk proxies. The GMM model relates current period price to forecasted future earnings, a short-term earnings growth rate and a long-term growth rate and is specified in the following form:
2 1 GMM 1 110
GMM GMM GMM
(eps -eps -γ (eps -dps ))epsP = +γ γ (γ -ρ-1)
(1)
Where, eps1 is analysts forecasted one period ahead earnings per share; eps2 is analysts forecasted two period ahead earnings per share; dps1 is analysts forecasted one period ahead dividend per share; P0 is current price per share of common stock; ρ is the long-term growth rate; γGMM is cost of capital calculated using GMM model.
To calculate the implied cost of capital, one rearranges the above formula and gets the following equation:
2 1 2 1
0 1
-( ) - (G M Meps eps epsA
p epsγ = Α + + -1) )ρ (2)
Where A = 1
0
1 ( - 1)2
d p sp
ρ⎡
+⎢⎣ ⎦
⎤⎥ (3)
The model assumes that all firms’ short-term earnings growth rates (i.e. (eps2-eps1)/eps1) decay asymptotically to the same long-term growth rate. The long-term growth rate γ-1 is usually set as γf-3%,
19

R.Z. Xu| Global Journal of Business Research ♦ Vol. 3 ♦ No. 1 ♦2009
where γf is the current yield on 10-year treasury notes. Following Harris (1998), industry concentration is proxied by four-firm concentration ratio, which is defined as the ratio of the sum of the top four firms’ sales over the total sales in an industry. The concentration ratio captures the degree of competition for market share among all firms in an industry. Industry is identified using the four-digit SIC code. As shown in Table 1, Panel A, there are 262 firms in the 1996 AIMR reports. All 6 Canadian banking firms are deleted from the sample, because this study concentrates on US firms. 5 firms are deleted for lack of IBES earnings and long-term growth rate forecasts, and 9 firms for lack of at least 30 months of CRSP monthly stock returns data. 28 firms are deleted because the GMM model either yields a negative cost of capital or no solution. One firm with an extremely high estimated cost of capital of 46% is deleted. All other firms have cost of capital lower than 30%. One firm is deleted as an outlier. The final sample consists of 212 firms. The 212 firms are distributed across 16 industries. Food Beverage and Tobacco, Insurance and Retail Trade industries have over 24 firms, twice as many as the other industries have. Table 1: Sample Selection Procedures
Sample Selection Procedures
Number of firms with 1996 AIMR disclosure scores 262 Less: Firms in Canadian Banking industry 6 Firms missing IBES EPS forecast data 5 Firms with fewer than 30 months of stock returns available in CRSP 9 Firms with negative GMM model cost of capital 28 Firms with GMM model cost of capital higher than 40% 1 Firms with too much influence on the regression results (outliers) 1 Number of firms available for analysis 212
This table shows the sample selection procedures. Table 2 provides descriptive statistics for the main variables used in the study. The GMM measure of cost of capital rGMM has a mean of 12.72%, similar to the estimated cost of capital in Gode and Mohanram 2003. Four-firm concentration ratio CONCEN has a mean of 0.85 and a range of 0.52 to 0.99. The disclosure score TSCORE has a mean of 72.12. It ranges from 30.0 to 96.30, indicating variation in firms’ disclosure policies. The mean (median) market value of the sample firms is $10570 MM ($3945 MM). The minimum and maximum market values are $103 MM and $119989 MM, respectively. COMPUSTAT firms have an average market value of $1026 MM in 1995. Therefore, firms covered by AIMR reports are generally large ones in the industries. Theoretically, the difference in the information environments of large firms should not be as big as that between large and small firms. The absence of really small firms in the sample may decrease the power of the test to detect the variation of disclosure’s impact on cost of capital with firm size.
Table 2: Descriptive Statistics for Variables in the Study
Variable Mean Standard Deviation Minimum Quartile 1 Median Quartile 3 Maximum rGMM 12.72 3.66 6.72 10.50 11.79 13.85 29.63 BETA 1.01 0.49 -0.40 0.72 0.95 1.28 3.17 CONCEN 0.85 0.12 0.52 0.85 0.86 0.93 0.99 TSCORE 72.12 13.67 30.00 62.05 73.00 82.00 96.30 MKTVAL 10,570 17,804 103 1,525 3,945 10,396 119,989 This table shows that descriptive statistics of key variables. The variables are defined as follows: rGMM is implied cost of capital calculated following the GMM (Gode and Mohanram 2003) approach. The unit is in the number of percentage points. BETA: The coefficient of the market model regression of firm returns on value weighted NYSE/AMEX market index returns, using at least 30 monthly returns over the 60 months prior to the end of 1995. CONCEN: The four firm concentration ratio calculated as the ratio of the sales of the top four firms over total sales of the industry. TSCORE: The AIMR (Association of Investment Management and Research) score on firms' overall disclosure. MKTVAL: Firms' market values of common equity in million dollars at the end of 1995.
20

GLOBAL JOURNAL OF BUSINESS RESEARCH ♦ Volume 3 ♦ Number 1 ♦2009
Correlations between the Variables Table 3 presents the correlation coefficients among the variables with Pearson correlation coefficients in the upper right corner and Spearman correlation coefficients in the lower left corner. Consistent with the predictions of finance theories, the GMM measures of cost of capital, rGMM, has significant positive correlations with BETA and negative correlation with MKTVAL. There is no significant correlations between cost of capital measures and disclosure score TSCORE, implying that the relation between disclosure and cost of capital may be affected by some confounding factors.
Table 3: Pearson (above diagonal)/ Spearman (below diagonal) Correlation Coefficients
rGMM BETA CONCEN TSCORE MKTVAL rGMM 0.23 -0.11 -0.03 -0.19
0.00 0.12 0.66 0.00 BETA 0.29 -0.03 0.06 -0.01
0.00 0.65 0.37 0.94 CONCEN -0.15 -0.06 -0.08 0.32
0.03 0.38 0.25 0.00 TSCORE -0.02 0.07 -0.04 0.17
0.76 0.31 0.53 0.02 MKTVAL -0.30 0.07 0.47 0.20 0.00 0.32 0.00 0.00
This table shows that descriptive statistics of key variables. The variables are defined as follows: rGMM is implied cost of capital calculated following the GMM (Gode and Mohanram 2003) approach. The unit is in the number of percentage points. BETA: The coefficient of the market model regression of firm returns on value weighted NYSE/AMEX market index returns, using at least 30 monthly returns over the 60 months prior to the end of 1995. CONCEN: The four firm concentration ratio calculated as the ratio of the sales of the top four firms over total sales of the industry. TSCORE: The AIMR (Association of Investment Management and Research) score on firms' overall disclosure. MKTVAL: Firms' market values of common equity in million dollars at the end of 1995. Tests on Hypothesis 1 The estimated coefficient 1β
) in the following OLS linear regression model represents the association
between cost of capital and disclosure:
CCi = β0 + β1 DISCLOSUREi + εi (4)
If both variables CC and DISCLOSURE were scaled to have a zero mean, the coefficient 1β)
would be:
1 2i i i
ii i
C C D IS C L O S U R E C CwD IS C L O S U R E D IS C L O S U R E
β = =∑ ∑∑) (5)
Where, wi=DISCLOSUREi
2/ΣDISCLOSUREi2 and Σwi=1 can be interpreted as a weight. The above
formula shows that the coefficient 1β)
is a weighted average of firm specific cost of capital-to-disclosure ratios. The disclosure score DISCLOSURE drives up the weight wi at an accelerating rate. Since large firms generally have higher disclosure scores, the coefficient 1β
) estimated with a pooled sample of firms
of all sizes would be mainly driven by large firms. Hypothesis 1 predicts that the association between cost of capital and disclosure should be different for small firms and for large firms. Therefore, in order to test hypothesis 1, the smallest and largest 25% firms in the sample in terms of market value are identified with dummy variables D1 and D2, respectively.
21

R.Z. Xu| Global Journal of Business Research ♦ Vol. 3 ♦ No. 1 ♦2009
Large firms generally are less risky than small firms. As a result, large firms on a whole have a lower cost of capital than small firms (Fama and French, 1992). On the other hand, large firms tend to disclose more than small firms (Lang and Lundholm, 1993). If large firms and small firms were put together, disclosure would likely exhibit an inverse association with cost of capital, regardless of the true underlying relation between disclosure and cost of capital. Using dummy variables to separate large and small firms into different groups would help disentangle the variation of intrinsic risk from the effect of disclosure.
The AIMR appoints a subcommittee of analysts with industry expertise to evaluate selected firms in each industry. Although AIMR provides a general guideline to the subcommittees for the evaluation, the subcommittees often deviate from them and develop their own indices tailored to industry specific practices (Botosan and Plumlee 2002). Therefore, hypothesis 1 is tested using the industry adjusted disclosure score in order to control for potential measurement errors in the AIMR scores. The industry adjusted disclosure score is computed by first taking the difference between the original disclosure score with the industry/year mean disclosure score and then rescaling it to the 100 scale.
Hypothesis 1 is tested with equation 6, where the GMM measure of cost of capital is regressed on the dummy variables D1 and D2, the industry adjusted disclosure score ADJTSOCRE, and the interaction terms D1ADJTSCORE and D2ADJTSCORE, controlling for Beta. The model is consistent with the models in Botosan (1997) and Botosan and Plumlee (2002).
rGMM i=α0+a1D1+a2D2+α3ADJTSCOREi+α4D1ADJTSCOREi+α5D2ADJTSCOREi+α6BETAi+εi (6)
Where, rGMM is GMM measure of cost of capital; ADJTSCORE is industry adjusted AIMR overall disclosure score; D1 (D2) is dummy variable representing the smallest (largest) 25% firms in the sample in term of market value of equity; D1ADJTSCORE: (D2ADJTSCORE) is interaction term between the dummy variable D1 (D2) with ADJTSCORE; BETA is the market beta calculated as the coefficient of the market model regression of firm returns on value weighted NYSE/AMEX market index returns, using a minimum of 30 monthly returns over the 60 months by the end of 1995. BETA is included in the models as a control for systematic risk; i is a specific firm; ε is the random error term in the model. The sum of the coefficients a 3 and a4 represents the coefficient for disclosure of the smallest firms in the sample, while the sum of the coefficients a 3 and a5 represents the coefficient for disclosure of the largest firms. Hypothesis 1 predicts that there exists a significant negative association between disclosure and cost of capital only for small firms. Consequently, a3+a4 is expected to be significantly negative, while a3+a5 is expected to be insignificant.
Table 4 reports the test results for hypothesis 1. The sum of the coefficients a3 and a4, which represents the slope for disclosure of the smallest firms in the sample, is negative at the 0.01 significance level. As predicted, the sum of the coefficient a 3 and a5, which represents the slope for disclosure of the largest firms, is insignificant. The test results support hypothesis 1. Tests on Hypothesis 2 Hypothesis 2 is tested using equation 7 as shown below: rGMMi=α0+a1D1+a2D2+α3ADJTSCOREi+α4D1ADJTSCOREi+α5D2ADJTSCOREi+α6BETAi+α7DUM+ α8DUMADJTSCOREi+εi (7)
22

GLOBAL JOURNAL OF BUSINESS RESEARCH ♦ Volume 3 ♦ Number 1 ♦2009
Where, D1 (D2): dummy variable representing the 25% firms in industries with the lowest (highest) four-firm concentration ratios in the sample; D1ADJTSCORE (D1ADJTSCORE): interaction term between the dummy variable D1 (D2) with ADJTSCORE; DUM: dummy variable representing the smallest 25% firms in the sample; DUMADJTSCORE: interaction term between dummy variable DUM and ADJTSCORE; All other variables are the same as in Equation 1. DUM and DUMADJTSCORE are added to the model to control for the effect of firm size (i.e. information environments). EMPIRICAL RESULTS Table 4: Test Results on Hypothesis One
αo α1 α2 α3 α4 α5 α6 α3+α4 α3+α5 adj R2 N
10.56 1.81 -1.45 0.02 -0.19 0.02 1.87 -0.17 0.04 0.212 212 18.45*** 3.25*** -2.71*** 0.54 -2.99*** 0.39 4.14*** -10.63*** 0.74
This table reports the test results on hypothesis one. Model: rGMM=αo+a1D1+a2D2+α3ADJTSCORE+α4D1ADJTSCORE+α5D2ADJTSCORE+α6BETA+ε The variables are defined as follows: rGMM is implied cost of capital calculated following the GMM (Gode and Mohanram 2003) approach. The unit is in the number of percentage points. ADJTSCORE: The industry adjusted AIMR (Association of Investment Management and Research) score on firms' overall disclosure. BETA: The coefficient of the market model regression of firm returns on value weighted NYSE/AMEX market index returns, using at least 30 monthly returns over the 60 months prior to the end of 1995. D1: The smallest 25% firms in the sample in terms of market value. D2: The largest 25% firms in the sample in terms of market value. D1ADJTSCORE (D2ADJTSCORE): Product of D1 (D2) with ADJTSCORE. Coefficients on top of test-statistics. The symbols ***, **, and * represent p-values significant at the 0.01, 0.05 and 0.1 levels respectively. N refers to the number of observations used in the test. The sum of the coefficients a3 and a4 represents the slope for disclosure of the group of firms in the least concentrated industries, while the sum of the coefficients a3 and a5 represents the slope for disclosure of the group of firms in the most concentrated industries. Hypothesis 2 predicts a significant negative association between disclosure and cost of capital only for firms in competitive industries. Therefore, the sum of a3 and a4 is expected to be significantly negative, while a3 and a5 is expected to be insignificant. Tables 5 reports the test results for hypothesis 2. The coefficient for disclosure of the firms in the least concentrated industries, a3+a4, is marginally significant. The coefficient for disclosure of the firms in the most concentrated industries, a3+a5, is also insignificant. The results provide weak evidence in support of hypothesis 2. Table 5: Test Results of Hypothesis Two
αo α1 α2 α3 α4 α5 α6 α7 α8 α3+α4 α3+α5 α4--α5 adjR2 N
9.79 0.02 -0.04 0.03 -0.15 -0.02 1.84 1.94 -0.02 -0.12 0.01 -0.13 0.14 212 14.77*** 0.03 -0.08 0.63 -2.03** -0.40 3.87*** 3.77*** -0.35 -2.00* 0.04 -2.21**
This table reports the test results of hypothesis two. The equation estimated is given by the following formula: rGMM=αo+a1D1+a2D2+α3ADJTSCORE+α4D1ADJTSCORE+α5D2ADJTSCORE+α6BETA+a7DUM+a8DUMADJTSCORE+ε Coefficients on top of test-statistics. The symbols ***, **, and * represent p-values significant at the 0.01, 0.05 and 0.1 levels respectively. rGMM: Implied cost of capital calculated following the GMM (Gode and Mohanram 2003) approach. The unit is in the number of percentage points. ADJTSCORE: The industry adjusted AIMR (Association of Investment Management and Research) score on firms' overall disclosure. D1: The bottom 25% firms in the sample in terms of industry concentration ratio. D2: The top 25% firms in the sample in terms of industry concentration ratio. D1ADJTSCORE (D2ADJTSCORE): Product of D1 (D2) with ADJTSCORE. BETA: The coefficient of the market model regression of firm returns on value weighted NYSE/AMEX market index returns, using at least 30 monthly returns over the 60 months prior to the end of 1995. LOGMKTVAL: Natural log of firms' market values of common equity in million dollars at the end of 1995. DUM: A dummy variable representing the smallest 25% firms in the sample. DUMADJTSCORE: Product of DUM with ADJTSCORE. N refers to the number of observations used in the test.
23
R.Z. Xu| Global Journal of Business Research ♦ Vol. 3 ♦ No. 1 ♦2009
Sensitivity Test Because the risk free rate in 1995 as measured by the 10-year Treasury Bill yield is 5.2%, observations with estimated cost of capital lower than 5% are deleted from the sample to repeat the tests, because firms are unlikely to have cost of capital lower than risk-free rate. Deleting low cost of capital observations does not qualitatively change the test results. Moreover, varying the percentages of firms represented by the dummy variables to 30%, 35%, or 40% does not qualitatively affect the results, either. CONCLUSIONS This paper examines whether information environment and industry competition affect the relation between disclosure and cost of capital. The test results suggest that the impact of disclosure on cost of capital varies with firm size and industry concentration. The evidence implies that disclosure is more effective in reducing the cost of capital of small firms and firms in more concentrated industries. There are a few limitations with this study. First, this study uses only one year (1995-1996)’s data in the sample, because AIMR stopped issuing corporate disclosure reports after 1996. Although there is no prior evidence that suggests that the relation between disclosure and cost of capital varies over time, the findings of the paper should be generalized to the current period with caution. Second, the AIMR analyst committees tend to focus on 15 to 20 large firms in an industry. This selection criterion limits the cross sectional variation in disclosure quality and firm size of the sample. The power of the study to detect the differential effects of the variation in disclosure quality on firms’ cost of capital is decreased by the reduced heterogeneity of the sample. The study has some implications on future research and business managers. The study improves our understanding of the relation between cost of capital and disclosure quality. Whereas previous studies treat disclosing firms as a homogenous group, this paper shows that the relation between disclosure and cost of capital varies with some firm characteristics such as firm size and industry affiliation. The findings in this paper suggest that managers of small firms should recognize the significant role of disclosure in reducing cost of capital and increase their financial disclosure to enhance firm value. REFERENCES
Amihud, Y. & Mendelson, H (1986). “Asset Pricing and the Bid-Ask Spread,” Journal of Financial Economics, vol. 17(2), December, p. 223-249 Atiase, R.K (1980). “Predisclosure Information Asymmetries, Firm Capitalization, Earnings Reports, and Securities Price Behavior,” Unpublished PhD. Thesis, University of California, Berkeley Atiase, R.K (1985). “Predisclosure Information, Firm Capitalization, and Security Price Behavior around Earnings Announcements,” Journal of Accounting Research, vol. 23(1), Spring, p. 21-36 Atiase, R.K (1987). “Market Implications of Predisclosure Information: Size and Exchange Effects,” Journal of Accounting Research, vol. 25(1), Spring, p. 168-176 Atiase, R.K., Bamber, L. & Freeman, R.N (1988). “Accounting Disclosures Based on Company Size: Regulation and Capital Markets Evidence,” The Accounting Horizons, vol. 2(1), March, p. 18-26 Bamber, L.S (1986). “The Information Content of Annual Earnings Release: A Trading Volume Approach,” Journal of Accounting Research, vol. 24(1), Spring, p. 40-56
24

GLOBAL JOURNAL OF BUSINESS RESEARCH ♦ Volume 3 ♦ Number 1 ♦2009
Bamber, L.S (1987). “Unexpected Earnings, Availability of Predisclosure Information and Trading Volume around Quarterly Earnings Announcements,” The Accounting Review, vol. 62(3), July, p. 510-532 Barry, C. & Brown, S (1985). “Differential Information and Security Market Equilibrium,” Journal of Financial and Quantitative Analysis, vol. 20(4), December, p. 407-422 Bhushan, R (1989). “Firm Characteristics and Analyst Following,” Journal of Accounting and Economics, 11(2), July, p. 255-274 Botosan, C. A (1997). “Disclosure Level and the Cost of Equity Capital,” The Accounting Review, vol. 72(3), July, p. 323-349 Botosan, C.A. & Plumlee, M (2002). “A Re-Examination of Disclosure Level and the Expected Cost of Equity capital,” Journal of Accounting Research, vol. 40(1), March, p. 21-40 Cheng, C.S.A., Collins, D. & Huang, H (2006). “Shareholder Rights, Financial Disclosure and the Cost of Equity Capital,” Review of Quantitative Finance and Accounting, vol. 27(2), September, p. 175-204 Clarkson, P., Guesde, J. & Thompson, R (1996). “On the Diversification, Observability, and Measurement of Estimation Risk,” Journal of Financial and Quantitative Analysis, vol. 31(1), March, p. 69-84 Chow, C.W. & Wang-Boren, A (1987). “Voluntary Financial Disclosure by Mexican Corporations,” The Accounting Review, vol. 62(3), July, p. 533-561 Coles, J., Loewenstein, U. & Suay, J (1995). “On Equilibrium Pricing under Parameter Uncertainty,” Journal of Financial and Quantitative Analysis, vol. 30(3), September, p. 347-364 Core, J (2001). “A Review of the empirical disclosure literature: Discussion,” Journal of Accounting and Economics 31(1), September, p. 441-456 Darrough, M. & Stoughton, N (1990). “Financial Disclosure Policy in an Entry Game,” Journal of Accounting and Economics, vol. 12(1), January, p. 219-243 Diamond, D.W. & Verrecchia, R. E (1991). “Disclosure, Liquidity, and the Cost of Capital,” Journal of Finance, vol. 46(4), September, P. 1325-1359 Fama, E. & French, K (1992). “The Cross-Section of Expected Stock Returns,” Journal of Finance, vol. 47(2), June, p. 427-466 Fields, T., Lys T. & Vincent, L (2001). “Empirical Research on Accounting Choices,” Journal of Accounting and Economics, vol. 31(1), September, p. 255-307 Freeman, R.N (1987). “The Association between Accounting Earnings and Securities Returns for Large and Small Firms,” Journal of Accounting and Economics, vol. 9(2), July, p. 195-228 Gode, D. & Mohanram, P (2003). “Inferring the Cost of Capital Using the Ohlson-Juettner Model,” Review of Accounting Study, vol. 8(4), December, p. 399-431
25

R.Z. Xu| Global Journal of Business Research ♦ Vol. 3 ♦ No. 1 ♦2009
Grant, E.B (1980). “Market Implications of Differential Amounts of Interim Information,” Journal of Accounting Research, vol. 18(1), Spring, p. 255-269 Harris, M (1998). “The Association between Competition and Managers' Business Segment Reporting Decisions,” Journal of Accounting Research, vol. 36(1), Spring, p. 111-128 Francis, J. R., Khurana, I. K. and Pereira, R (2005). “Disclosure Incentives and Effects on Cost of Capital around the World,” The Accounting Review, vol. 80(4), p. 1125-1162 Kross, W. & Schroeder, D.A (1989). “Firm Prominence and The Differential Information Context of Quarterly Earnings Announcements,” Journal of Business Finance and Accounting, vol. 16(1), Spring, p. 55-74 Lang, M. & Lundholm, R (1993). “Cross-Sectional Determinants of Analyst Rating of Corporate Disclosures,” Journal of Accounting Research, vol. 31(2), Autumn, p. 246-271 Lang, M. & Lundholm, R (1996). “Corporate Disclosure Policy and Analyst Behavior,” The Accounting Review, vol. 71(4), October, p. 467-492 Lev, B. & Penman, S.H (1990). “Voluntary Forecast Disclosure, Nondisclosure, And Stock Prices,” Journal of Accounting Research, vol. 28(1), Spring, p. 49-76 Merton, R. C (1987). “A Simple Model of Capital Market Equilibrium with Incomplete Information,” Journal of Finance, vol. 42(3), July, p. 483-510 Patel, S. & Dallas, G (2002). “Transparency and Disclosure: Overview of Methodology and Study Results – United States,” Working Paper, Standard & Poor and European Corporate Governance Institute Skinner, D (1994). “Why Firms Voluntarily Disclose Bad News,” Journal of Accounting Research, vol. 32(1), Spring, p. 38-61 Verrecchia, R (1983). “Discretionary Disclosure,” Journal of Accounting and Economics, vol. 5, p. 179-194 Welker, M (1995). “Disclosure Policy, Information Asymmetry and Liquidity in Equity Markets,” Contemporary Accounting Research, vol. 12(1), Spring, p. 801-27 Zhang, G (2001). “Private Information Production, Public Disclosure, and the Cost of Capital: Theory and Implications,” Contemporary Accounting Research, vol. 18(2), Summer, p. 363-384 Zeghal, D (1984). “Firm size and the Information Content of Financial Statements,” Journal of Financial and Quantitative Analysis, vol. 19(3), September, p. 299-310
26