reevaluating the modernization hypothesis the modernization hypothesis 3 to conclude that the...
TRANSCRIPT
Reevaluating the Modernization HypothesisDaron Acemoglua, Simon Johnsonb, James A. Robinsonc, and Pierre Yaredd�y
a MIT; b MIT; c Harvard; d ColumbiaReceived Date; Received in Revised Form Date; Accepted Date
Abstract
We revisit and critically reevaluate the widely accepted modernization hypothesis which claims that per capita income causesthe creation and the consolidation of democracy. Existing studies �nd support for this hypothesis because they fail to controlfor the presence of omitted variables. Controlling for these factors either by including country �xed e¤ects in a linear model orby including parameterized random e¤ects in a non-linear double hazard model removes the correlation between income and thelikelihood of transitions to and from democratic regimes. In addition, the estimated �xed e¤ects from the linear model are relatedto historical factors that a¤ect both the level of income per capita and the likelihood of democracy in a country. This evidenceis consistent with the idea that events during critical historical junctures can lead to divergent political-economic developmentpaths, some leading to prosperity and democracy, others to relative poverty and non-democracy.Keywords: Democracy, Economic Growth, Institutions, Political Development.
JEL classi�cation: P16, O10
�Corresponding author: Pierre Yared, Columbia University, Graduate School of Business, 3022 Broadway Ave, New York, NY 10027.Phone: 212-854-9670. Fax: 212-662-8474. Email: [email protected].
yWe are grateful for the comments and suggestions of José Antionio Cheibub, Jorge Dominguez, Peter Hall, and Susan Stokes.

Reevaluating the Modernization Hypothesis 2
1. Introduction
According to Seymour Martin Lipset�s (1959) modernization hypothesis, the level of economic development drivesthe creation and consolidation of democracy. This contrasts with another approach in political economy which is thecritical junctures hypothesis. According to this hypothesis, institutional change which a¤ects both economic and politicaldevelopment is initiated by di¤erences during a certain critical historical juncture.1
The modernization hypothesis has been much more in�uential than the critical junctures hypothesis in social sci-ences.2 This paper demonstrates that the evidence supporting the modernization hypothesis is much weaker than theprevious work has found. Instead, it presents evidence consistent with the existence and importance of critical junctures.Most previous work on the determinants of democracy uses cross-sectional regression analysis to investigate the causal
relationship between income and democracy (in particular, democratic transitions). However, it is important to controlfor common variables a¤ecting income and democracy. The simplest way of accomplishing this is to investigate therelationship between income and democracy in a panel of countries and to control for country �xed e¤ects. Controllingfor �xed e¤ects is not only a simple and transparent strategy, but is also in the spirit of the critical junctures hypothesis,since it takes out the e¤ect of constant, potentially historical, factors.This paper shows that once �xed e¤ects are introduced into standard regressions of democracy, the positive relation-
ship between income per capita and both the level of, and more importantly transitions to and from, democracy disap-pears.3 More speci�cally, high levels of income per capita do not promote transitions to democracy from non-democracy,nor do they forestall transitions to non-democracy from democracy. These �ndings are robust across di¤erent measuresof democracy, the use of additional covariates, econometric speci�cations and estimation techniques. They hold notonly in the most-commonly used sample period of 1960-2000; they also hold for a balanced sample during the period1875-2000.In addition to linear speci�cations, this paper develops and implements a double hazard model for the simultaneous
estimation of transitions to democracy and transitions away from democracy. Though the study of transitions to andaway from democracy is of important interest, the econometrics of transition models is not entirely straightforward.Speci�cally, one cannot look at transitions to democracy or away from democracy as separate events because whether ornot an observation is in the at-risk sample is endogenously determined. We develop a simple framework to deal with thisselection issue in the presence of �xed e¤ects. Using this approach, income per capita conditional on the �xed e¤ectsdoes not predict either transitions to democracy or transitions away from democracy.The �nding that income per capita causes transitions to democracy and prevents transitions away from democracy
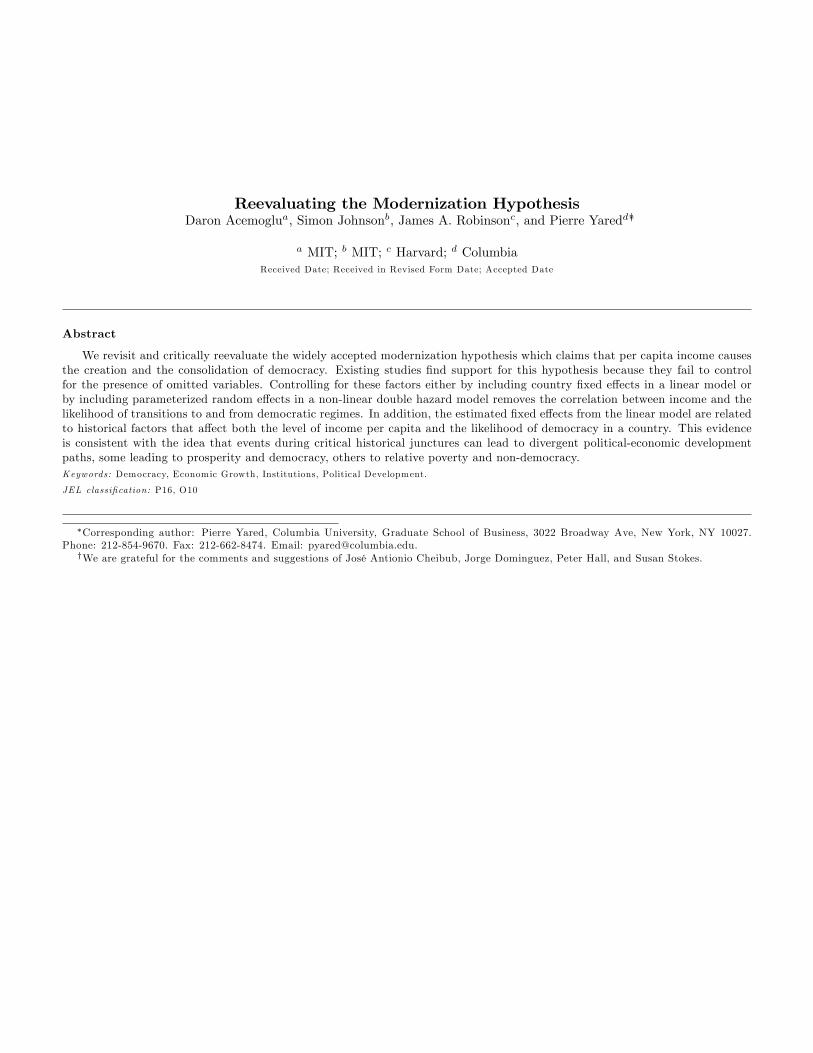
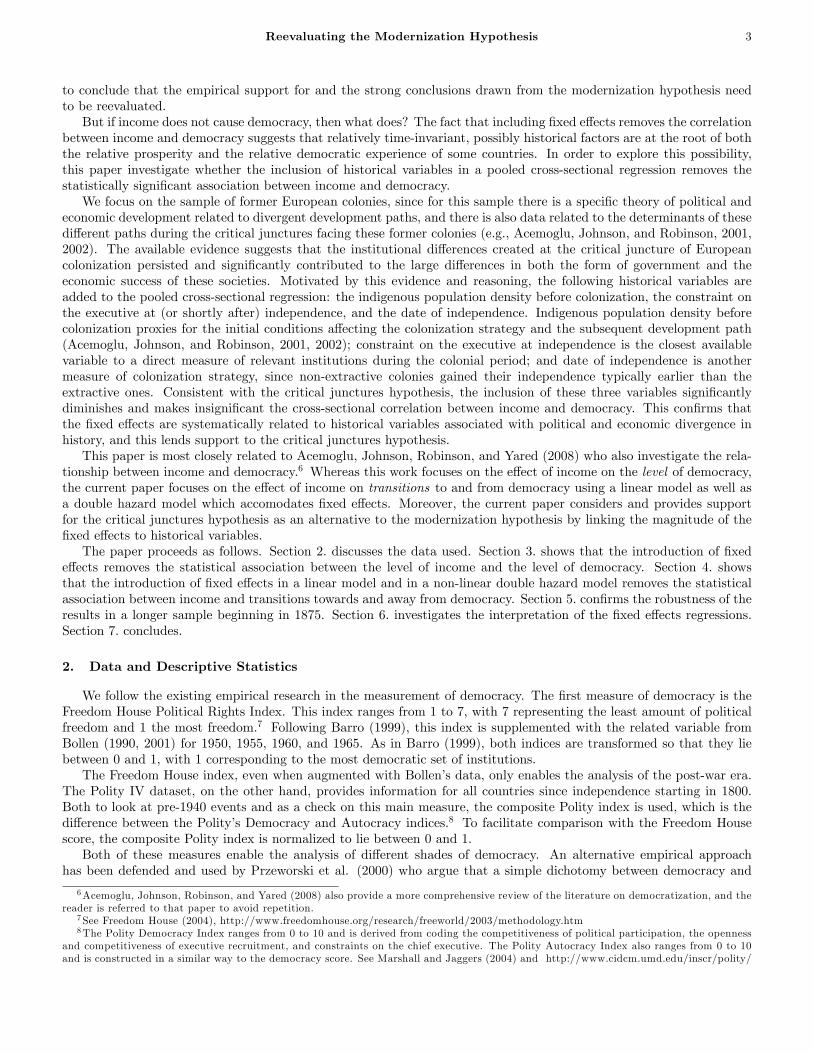
comes only from the cross-sectional variation in the data. Figure 1-4 provide a simple diagrammatic illustration of thispoint.4 Figures 1 and 2 focus on the sample of non-democracies in every �ve year interval between 1955 and 1990.They count which non-democracies experience democratization �ve years later. In Figure 1, observations are groupeddepending on whether log income per capita is above or below the average log income per capita in the world for theobservation year, and the �gure displays the fraction of non-democracies in each group which experienced a democratictransition. This �gure corresponds to regressions without controlling for �xed e¤ects, and it is consistent with the ideathat non-democracies with high income per capita are more likely to experience democratization than non-democracieswith low income per capita. Figure 2, on the other hand, provides a visual representation of the patterns once someof the time-invariant omitted variables are taken out. To do this, observations are grouped depending on whether logincome per capita is above or below the average log income per capita for that country between 1955 and 1990.5 Incontrast to Figure 1, Figure 2 shows that non-democracies that are richer than usual are not more likely to experiencedemocratization. Figures 3 and 4 are analogous to Figures 1 and 2 for the sample of democracies, and these �gurescalculate the fraction of democracies which experience coups. Like Figure 1, Figure 3 corresponds to regressions withoutcontrolling for �xed e¤ects, and it is consistent with the idea that democracies with low income per capita are more likelyto experience coups than democracies with high income per capita. Figure 4, on the other hand, shows that democraciesthat are poorer than usual are not more likely to experience coups. These �gures therefore provide a preview of how theresults are likely to change once one controls for omitted variables a¤ecting both income and democracy. This leads us
1This hypothesis is exempli�ed by Barrington Moore�s famous (1966) thesis that the reasons why Britain moved gradually to democracy,Germany to fascism, and Russia to communist revolution are to be found in the di¤erential organization of agriculture and the di¤erentialintensities of feudal legacies. Other studies which share a similar methodological approach include Engerman and Sokolo¤ (1997) andAcemoglu, Johnson, and Robinson (2001,2002), among others.
2Also see, among others, Londregan and Poole (1996), Przeworski and Limongi (1997), Barro (1999), Przeworski, Alvarez, Cheibub, andLimongi (2000), and Papaioannou and Siourounis (2006).
3For similar results focusing on the relationship between income and the level of democracy, see Acemoglu, Johnson, Robinson, and Yared(2008).
4All �gures use the Przeworski index of democracy which categorizes countries as being either a democracy or a non-democracy.5Both of these values are demeaned from the world average to account for time trends.
Reevaluating the Modernization Hypothesis 3
to conclude that the empirical support for and the strong conclusions drawn from the modernization hypothesis needto be reevaluated.But if income does not cause democracy, then what does? The fact that including �xed e¤ects removes the correlation
between income and democracy suggests that relatively time-invariant, possibly historical factors are at the root of boththe relative prosperity and the relative democratic experience of some countries. In order to explore this possibility,this paper investigate whether the inclusion of historical variables in a pooled cross-sectional regression removes thestatistically signi�cant association between income and democracy.We focus on the sample of former European colonies, since for this sample there is a speci�c theory of political and
economic development related to divergent development paths, and there is also data related to the determinants of thesedi¤erent paths during the critical junctures facing these former colonies (e.g., Acemoglu, Johnson, and Robinson, 2001,2002). The available evidence suggests that the institutional di¤erences created at the critical juncture of Europeancolonization persisted and signi�cantly contributed to the large di¤erences in both the form of government and theeconomic success of these societies. Motivated by this evidence and reasoning, the following historical variables areadded to the pooled cross-sectional regression: the indigenous population density before colonization, the constraint onthe executive at (or shortly after) independence, and the date of independence. Indigenous population density beforecolonization proxies for the initial conditions a¤ecting the colonization strategy and the subsequent development path(Acemoglu, Johnson, and Robinson, 2001, 2002); constraint on the executive at independence is the closest availablevariable to a direct measure of relevant institutions during the colonial period; and date of independence is anothermeasure of colonization strategy, since non-extractive colonies gained their independence typically earlier than theextractive ones. Consistent with the critical junctures hypothesis, the inclusion of these three variables signi�cantlydiminishes and makes insigni�cant the cross-sectional correlation between income and democracy. This con�rms thatthe �xed e¤ects are systematically related to historical variables associated with political and economic divergence inhistory, and this lends support to the critical junctures hypothesis.This paper is most closely related to Acemoglu, Johnson, Robinson, and Yared (2008) who also investigate the rela-
tionship between income and democracy.6 Whereas this work focuses on the e¤ect of income on the level of democracy,the current paper focuses on the e¤ect of income on transitions to and from democracy using a linear model as well asa double hazard model which accomodates �xed e¤ects. Moreover, the current paper considers and provides supportfor the critical junctures hypothesis as an alternative to the modernization hypothesis by linking the magnitude of the�xed e¤ects to historical variables.The paper proceeds as follows. Section 2. discusses the data used. Section 3. shows that the introduction of �xed
e¤ects removes the statistical association between the level of income and the level of democracy. Section 4. showsthat the introduction of �xed e¤ects in a linear model and in a non-linear double hazard model removes the statisticalassociation between income and transitions towards and away from democracy. Section 5. con�rms the robustness of theresults in a longer sample beginning in 1875. Section 6. investigates the interpretation of the �xed e¤ects regressions.Section 7. concludes.
2. Data and Descriptive Statistics
We follow the existing empirical research in the measurement of democracy. The �rst measure of democracy is theFreedom House Political Rights Index. This index ranges from 1 to 7, with 7 representing the least amount of politicalfreedom and 1 the most freedom.7 Following Barro (1999), this index is supplemented with the related variable fromBollen (1990, 2001) for 1950, 1955, 1960, and 1965. As in Barro (1999), both indices are transformed so that they liebetween 0 and 1, with 1 corresponding to the most democratic set of institutions.The Freedom House index, even when augmented with Bollen�s data, only enables the analysis of the post-war era.
The Polity IV dataset, on the other hand, provides information for all countries since independence starting in 1800.Both to look at pre-1940 events and as a check on this main measure, the composite Polity index is used, which is thedi¤erence between the Polity�s Democracy and Autocracy indices.8 To facilitate comparison with the Freedom Housescore, the composite Polity index is normalized to lie between 0 and 1.Both of these measures enable the analysis of di¤erent shades of democracy. An alternative empirical approach
has been defended and used by Przeworski et al. (2000) who argue that a simple dichotomy between democracy and
6Acemoglu, Johnson, Robinson, and Yared (2008) also provide a more comprehensive review of the literature on democratization, and thereader is referred to that paper to avoid repetition.
7See Freedom House (2004), http://www.freedomhouse.org/research/freeworld/2003/methodology.htm8The Polity Democracy Index ranges from 0 to 10 and is derived from coding the competitiveness of political participation, the openness
and competitiveness of executive recruitment, and constraints on the chief executive. The Polity Autocracy Index also ranges from 0 to 10and is constructed in a similar way to the democracy score. See Marshall and Jaggers (2004) and http://www.cidcm.umd.edu/inscr/polity/

Reevaluating the Modernization Hypothesis 4
non-democracy is the most useful empirical de�nition. Dichotomous measures may also be better suited to analyses oftransitions from and to democracy. Therefore, results are presented using the Boix-Rosato dataset which extends thedata of Przeworski et al. (2000) in which the index equals 1 if a country is a democracy and equals 0 otherwise. Thispaper also develop a simple double hazard model to deal with the simultaneous modeling of transitions to and fromdemocracy. All of these exercises using the dichotomous measures give very similar results to those using the continuousmeasures. The analysis is performed on �ve-yearly and annual panels. For the �ve-year panels, the observation is takenevery �fth year.9
In addition, the analysis uses GDP per capita data from the Summers-Heston dataset for the post-war period (Heston,Summers, and Atten, 2002), GDP per capita data from Maddison (2003) for the prewar and long samples, a measureof educational attainment from the Barro-Lee dataset (average years of schooling for people in the population over theage of 25), and total population from the World Bank (2002).For the former European colonies sample, the additional variables which are used are the date of independence
from the CIA World Factbook and the constraint on the executive after independence from the Polity IV dataset.10
Population density in 1500 is calculated by dividing the historical measures of population from McEvedy and Jones(1975) by the area of arable land (see Acemoglu, Johnson, and Robinson, 2002).11
3. Levels of Democracy
We begin by considering the e¤ect of income on the level of democracy by estimating of the following simple linearregression model:
dit = �dit�1 + yit�1 + x0it�1� + �t + �i + uit; (1)
where dit is the democracy score of country i in period t. The lagged value of this variable on the right hand sideis included to capture persistence in democracy and also potentially mean-reverting dynamics. The main variable ofinterest is yit�1, the lagged value of log income per capita. The parameter therefore measures the impact of incomeper capita on democracy. Other covariates are captured by the vector x0it�1 with coe¢ cient vector �. In addition, the�t�s denote a full set of time e¤ects, which capture common shocks to (common trends in) the democracy score of allcountries.12 Importantly, the equation also includes a full set of country dummies, the �i�s. These country dummiescapture any time-invariant country characteristics that a¤ect the equilibrium level of democracy. vit is an error term,capturing all other omitted factors, with E (vit) = 0 for all i and t. The sample period is 1960-2000 and time periodscorrespond to �ve-year intervals.13
The most important bene�t of the �xed e¤ect estimator is that, as is well known, if the �i�s are correlated withyit�1 or xit�1, then pooled OLS estimates�which are standard in the literature and exclude �i from (1)�are biased and
inconsistent. In contrast, even if cov (yit�1; �i + uit) 6= 0 (or cov�xjit�1; �i + uit
�6= 0 where xjit�1 represents the j�th
component of the vector xit�1) but cov (yit�1; uit) = cov�xjit�1; uit
�= 0 for all j, then the �xed e¤ects estimator will be
consistent. This structure of correlation is particularly relevant in this context, because the critical junctures hypothesissuggests precisely the presence of historical factors a¤ecting both political and economic development.14
Column 1 presents pooled cross-sectional regressions of democracy on income which exclude country �xed e¤ectswhich replicate previous results of the literature. All panels pool the time-series and cross-sectional variation. Allstandard errors in the paper are robust against arbitrary heteroskedasticity in the variance-covariance matrix, and they
9This procedure is preferred to averaging the �ve-yearly data, since averaging introduces additional serial correlation, making inferenceand estimation more di¢ cult. For the Freedom House data which begins in 1972, the 1972 score is assigned to 1970 for the purpose of the�ve-year regressions as in Barro (1999). Moreover, the 1994 score in the Boix-Rosato data is assigned to 1995 for the purpose of the �ve-yearregressions.10The data on constraint on the executive from Polity begins in 1800 or at the date of independence. In the former colonies sample only
one country, the United States became independent before 1800 and its date of independence is coded as 1800.11Throughout the paper, the de�nition of former European colonies used in Acemoglu, Johnson, and Robinson (2001, 2002) is adopted. It
excludes the Middle Eastern countries that were brie�y colonized by European powers during the 20th century. This de�nition is motivatedby interest in former colonies as a sample in which the process of institutional development, in particular during the 19th century and earlier,was shaped by European intervention (see Acemoglu, Johnson, and Robinson, 2002).12Throughout the paper, all speci�cations include a full set of time dummies, the �t�s, since otherwise regression equations such as (1)
capture world-wide trends.13The fact that the democracy index takes discrete values induces a special type of heteroscedasticity, but creates no di¢ culty for inference
with OLS, as long as standard errors are corrected for heteroskedasticity (e.g., Wooldridge, 2002, Section 15.2).14Nevertheless, there should be no presumption that �xed e¤ects regressions will necessarily estimate the causal e¤ect of income on democ-
racy, for example because there are time varying omitted variables. See Acemoglu, Johnson, Robinson, and Yared (2008) for instrumentalvariable strategies designed to estimate the causal e¤ect of income on democracy.

Reevaluating the Modernization Hypothesis 5
allow for clustering at the country level.15 Panel A of Table 1 uses the Freedom House data, panel B uses the Polity data,and panel C uses the dichotomous Przeworski index. Lagged democracy is highly signi�cant and shows a considerabledegree of persistence in democracy. Log GDP per capita is also signi�cant and illustrates the well-documented positiverelationship between income and democracy. Though highly statistically signi�cant, the e¤ect of income is quantitativelysmall. For example, the coe¢ cient of 0.073 (standard error = 0.010) in column 1 of panel A implies that a temporary 10percent increase in GDP per capita is associated with an increase in the Freedom House score of 0.0073, and a permanentincrease in GDP per capita by 10 percent is associated with an increase in the (steady state) Freedom House score ofonly 0.0073/(1-.703)�0.025 (for comparison, the gap between the United States and Colombia today is 0.5). Overall,column 1 in Table 1 con�rms the main �nding of the existing literature of a positive association between income anddemocracy.While the earlier literature has typically interpreted this as the causal e¤ect of income on democracy, column 2 which
introduces country �xed e¤ects shows that such an interpretation may not be warranted. In none of the panels is incomeper capita signi�cant, and it typically has a very small coe¢ cient. With the Freedom House data the coe¢ cient in 0.008(for example, compared to 0.073 in column 1 of Table 1) with a standard error of 0.034. With the Polity data in panelB, the estimate is basically zero, -0.003 (standard error=0.038).16
Note that there is an econometric problem involved in the estimation of (1) as is done in column 2. The regressordit�1 is mechanically correlated with uis for s < t, so the standard �xed e¤ects estimation is not consistent (e.g.,Wooldridge, 2002, chapter 11). However, it can be shown that the �xed e¤ects OLS estimator becomes consistent asthe number of time periods in the sample increases. Columns 3 and 4 consider estimation strategies to deal with thisissue, while column 5 uses annual data which should reduce the extent of this bias considerably.The �rst strategy, adopted in column 3, is to use the Generalized Method-of-Moments Estimator (GMM) proposed
by Arellano and Bond (1991). This builds on the approach �rst suggested by Anderson and Hsiao (1982) and uses secondand higher order lags as instruments under the assumption of no serial correlation in the residual, uit, in equation (1).With the Arellano-Bond�s GMM estimator, the coe¢ cient on income per capita is now negative in all panels, thoughalso less precisely estimated.The second strategy, adopted in column 4, is to use the Griliches-Hausman (1986) long di¤erence estimator proposed
by Hahn, Hausman, and Kuersteiner (2007). This estimator shares features of the GMM estimator, though it arguablyreduces the small sample bias inherent in the GMM estimation. Again, the coe¢ cient on income per capita is negativein all panels.The third strategy, reproduced in column 5, estimates (1) with �xed e¤ects OLS using annual observations. This is
useful since the �xed e¤ects OLS estimator becomes consistent as the number of observations becomes large. With annualobservations, there is a reasonably large time dimension. However, estimating the same model on annual data with asingle lag would induce signi�cant serial correlation (since the results so far indicate that �ve-year lags of democracypredict changes in democracy). For this reason, �ve lags of both democracy and log GDP per capita are included inthese annual regressions. The table reports the p value of an F-test for the joint signi�cance of these variables. Theresults show no evidence of a signi�cant positive e¤ect of income on democracy in any of the panels (while democracyis strongly predicted by its lags, as was the case in earlier columns).A potential concern with �xed e¤ects regressions is lack of precision due to insu¢ cient residual variation in right-
hand side variables. The results in Table 1 show that this is not the case in this empirical investigation. The standarderrors of the estimates of the e¤ect of income on democracy are relatively small in most cases, and as a result, twostandard error bands typically exclude the pooled OLS estimate from column 1 (even though, as discussed above, theseare quantitatively small). For example, although the GMM estimates in column 3 are less precise than the �xed e¤ectsestimates in column 2, because the coe¢ cient estimates are negative, two standard error con�dence intervals excludethe pooled OLS estimate in panels A and B. The same is true, and more comfortably so, for the Griliches-Hausman longdi¤erence estimator in column 4, which leads to more precisely estimated e¤ects. In this case, the pooled OLS estimateis outside the two standard error con�dence intervals in all speci�cations. This shows that the lack of a positive e¤ectof income per capita on democracy when ones controls for time-invariant omitted variables is not driven by impreciseestimates. Instead, it is likely due to the fact that these omitted variables are responsible for the positive relationshipthat previous cross-sectional (or pooled cross-section and time-series) studies have found.In columns 5 and 6 of Table 1 average years of schooling and population are added as additional explanatory variables
to repeat the regressions reported in columns 2 and 3 with very similar results. In particular, income never has a positive
15Clustering is a simple strategy to correct the standard errors for potential correlation across observations both over time and within thesame time period. See for example Moulton (1986) or Bertrand, Du�o, and Mullainathan (2004).16Analysis not included here shows that the lack of a statistical association between income and democracy conditional on �xed e¤ects is
not driven by some outliers in the data.

Reevaluating the Modernization Hypothesis 6
e¤ect on democracy, and there is also no evidence of a positive relationship between education and democracy.17
Overall, the inclusion of �xed e¤ects proxying for time-invariant and country-speci�c characteristics removes theentire cross-country correlation between income and democracy (and education and democracy). These results shedconsiderable doubt on the conventional wisdom that income has a strong causal e¤ect on democracy.
4. Transitions to and from Democracy
The previous section focused attention on the level of democracy as the dependent variable. Much of the empiricalliterature since the work of Przeworski and Limongi (1997) and Przeworski et al. (2000) has instead focused on estimatingseparate models for transitions to and away from democracy. This section investigates whether the �ndings in thisliterature are robust to the inclusion of �xed e¤ects. This is �rst done using a linear model. We then develop andimplement a double hazard model for the simultaneous estimation of transitions to democracy and transitions awayfrom democracy. All of the various econometric strategies show that once �xed a¤ects are included to control for time-invariant omitted variables simultaneously a¤ecting both income and democracy, there is no evidence of an e¤ect ofincome per capita on transitions to or away from democracy.
4.1. Linear Model
Standard analyses of transitions to and from democracy use dichotomous measures such as the Przeworski/Boix-Rosato data. This section starts with a more straightforward approach which allows us to also use the continuousdemocracy scores in the Freedom House and Polity data. The strategy is to modify the model in equation (1) as follows:
dit = �dit�1 + posIit�1yit�1 + neg (1� Iit�1) yit�1 + x0it�1� + �t + �i + uit (2)
where Iit�1= f0; 1g is an indicator which equals 1 if dit�1 is below the sample mean and which equals 1 otherwise.18This procedure implies that pos represents the e¤ect of income on democracy conditional on a country starting from alow level of democracy, capturing the extent to which higher income may promote democratization. Analogously, neg
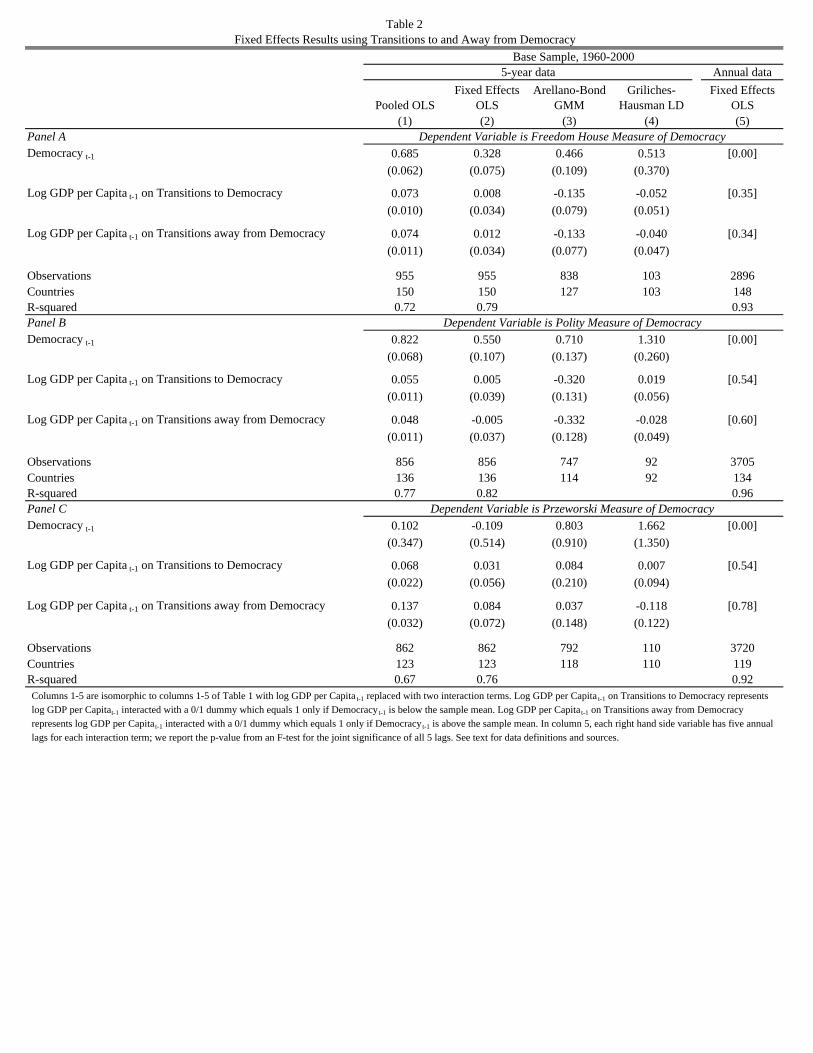
represents the e¤ect of income on democracy conditional on a country starting from a high level of democracy, capturingthe extent to which higher income may prevent coups.Table 2 reports estimates of (2), where panel A uses the Freedom House data, panel B uses the Polity data, and
panel C uses the dichotomous Przeworski index. Columns 1-5 of this table are analogous to columns 1-5 of Table 1 withthe only di¤erences being in the addition of the interaction terms for income on the right hand side of the equation.19
In the �rst columns of both tables begin with regressions without the �xed e¤ects, the �i�s, to replicate the resultsof the previous literature in our framework. The results in Table 2 using the pooled OLS approach show that there is astatistically signi�cant correlation between income and transitions to and away from democracy with all three types ofdata.Our main results, which add �xed e¤ects, are presented in column 2. The �ndings here are similar to those reported
in Table 1. Once �xed e¤ects are introduced, income per capita is never signi�cant for either transitions to or awayfrom democracy. Columns 3 and 4 turn to GMM and long di¤erence estimation of the models with �xed e¤ects. Theestimates again show no evidence of an e¤ect of income on either transitions to democracy or away from democracy.Column 5 turns to the alternative strategy of using annual data. This column reports the level of signi�cance of anF-test on the joint signi�cance of the lags of income per capita now interacted with the initial level of democracy, andit shows that income per capita is insigni�cant in all speci�cations.The results are thus consistent with those reported in Section 3.. With pooled OLS the coe¢ cient on income per
capita is signi�cant on transitions to and transitions away from democracy, but once �xed e¤ects are added, income isnever signi�cant in any speci�cation.
4.2. Nonlinear Model
The linear probability models of transitions to and away from democracy reported so far are relatively transparentand also ensure consistency under a relatively weak set of assumptions (see Wooldridge, 2002, chapter 15.2). In addition,linear probability models allow us to use standard panel data techniques for consistent estimation in the presence of�xed e¤ects (with large T ) by di¤erencing out the �xed e¤ects. Nevertheless, nonlinear models may be more appropriate
17Additional regressions not reported here also �nd no evidence of nonlinear interactions between income and other variables.18Although (2) is nonlinear in dit, it is linear in the parameters and in particular, in the �xed e¤ects, the �i�s. This implies that the �xed
e¤ects can be di¤erenced out to achieve consistent estimation (without creating an incidental parameters problem).19Analogous columns to columns 6 and 7 from Table 1 yield similar results and are available upon request.

Reevaluating the Modernization Hypothesis 7
for understanding transitions to and away from democracy. The di¢ culty with nonlinear models lies in the fact thatbecause the conditional mean function in such models is not linear in the parameters, consistent estimation with �xede¤ects is typically not possible (see, for example, Wooldridge, 2002, chapter 15.8, and footnote 23).We begin by developing and estimating a nonlinear double hazard model, which allows for cross-sectional correlation
between income and democracy without introducing �xed e¤ects. This allows us to relate the level of income totransitions to democracy and transitions away from democracy, without being subject to the same type of biases thatpooled OLS estimation is subject to. The use of the double hazard model is preferable to existing approaches relyingon probit or duration model analysis since the model takes into account that transitions to democracy or away fromdemocracy are jointly determined. In other words, transitions to and from democracy cannot be treated as separateevents because whether or not an observation is in the at-risk sample is endogenously determined (or samples areendogenously selected). The contribution here is to develop a framework for dealing with this issue which also allowsthe incorporation of �xed e¤ects in a straightforward manner.The double hazard model can be expressed in terms of two conditional mean functions for the probability of transi-
tioning to democracy and the probability of remaining in democracy:20
Pr (dit = 1 j dit�1 = 0; yit�1; t) = � ( posyit�1 + �post ) (3)
Pr (dit = 1 j dit�1 = 1; yit�1; t) = � ( negyit�1 + �negt ) , (4)
where � is an increasing function with a range between 0 and 1. Equation (3) describes the probability that a dictatorshipcollapses (transitions to democracy), and equation (4) describes the probability that a democracy survives, whichis negatively related to the probability of a coup (transitions away from democracy). Together, these two equationscharacterize the law of motion of democracy for a given country, so that one can think of these equations as constituting a�double hazard model�. The parameters pos and neg represent the e¤ect of income on positive and negative transitionsrespectively, and �post and �negt represent the time e¤ects on positive and negative transitions, respectively. Note thatequations (3) and (4) model the appropriate transitions to and away from democracy, but they do not yet introduce�xed country e¤ects.To make further progress, let us also assume that � (�) is the normal cumulative distribution function, so that the
system described by (3) and (4) is an exponential double hazard model. Since this system of equations characterizes theentire motion of democracy, it can easily be estimated by maximum likelihood.21
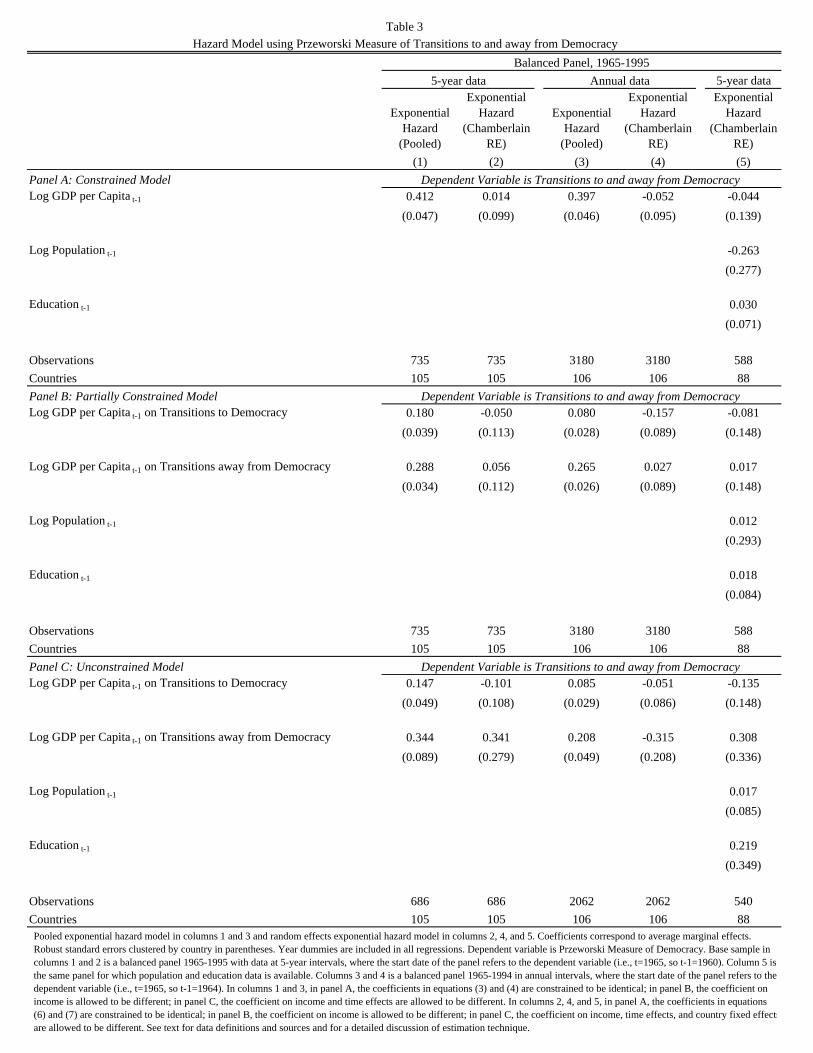
Table 3 reports estimates of (3) and (4) using the Przeworski/Boix-Rosato dichotomous measures of democracy.Column 1 of Table 3 estimates (3) and (4) simultaneously on a balanced panel and reports the estimates of the marginale¤ect of lagged income.22 In panel A, the constraint that pos = neg and �post = �negt is imposed. The estimatesshow a signi�cant (cumulative) e¤ect of income per capita on transitions to and away from democracy. In panel B, theconstraint that pos = neg is relaxed while the constraint that �post = �negt is maintained. This is useful as a checkof whether the impact of income di¤ers in the two equations as emphasized by Przeworski and Limongi (1997) andPrzeworski et al. (2000). Income per capita is signi�cant for both transitions to and transitions away from democracy,though the coe¢ cient on transitions away from democracy is higher and more signi�cant, which is in line with the basic�nding of these works. Panel C estimates the most �exible speci�cation which allows for pos 6= neg and �post 6= �negt .The estimates are again similar.The double hazard model, like all other models that are nonlinear in parameters, cannot accommodate �xed e¤ects.
For example, if �xed e¤ects are added, the right hand side of equation (3) changes to � ( posyit�1 + �post + �posi ), and the
right hand side of equation (4) changes to � ( negyit�1 + �negt + �negi ), where the �i�s are the �xed e¤ects for observation
i. This speci�cation creates an incidental parameters problem in the estimation of the �i�s, and thus by implications, inthe estimation of all of the parameters.23
We adopt the solution proposed by Mundlak (1978) and Chamberlain (1980), which involves imposing a functionalform on the �i�s. Speci�cally, Chamberlain (1980) posits that
Pr��ji = � j yi1; :::yiT
�= �
��j + yi�
j�, j = pos; neg (5)
20 Instead of (4), one could have alternatively written Pr (dit = 0 j dit�1 = 1; yit�1; t) = ��� negyit�1 + ��
negt
�, in which case one would have
Pr (dit = 1 j dit�1 = 1; yit�1; t) = 1���� negyit�1 + ��
negt
�. While these two speci�cations are econometrically equivalent, the interpretation
of the parameters � neg and ��negt is less intuitive, making preferable the system of equations given by (3) and (4).21The likelihood function is straightforward to compute. For example, for a given country i, it is the case that
Pr fdi1; :::; diT jyi0; :::; yiT�1g = Pr fdiT jdiT�1; yiT�1; Tg � Pr fdiT�1jdiT�2; yiT�2; T � 1g :::� Pr fdi1jdi0; yi0; 1g.22The results do not change if one instead modi�es the exercise to consider an unbalanced panel. Details available upon request.23 In particular, because the number of parameters to be estimated increases at the same rate as the number of observations in the cross-
section, the standard asymptotics do not guarantee consistency. This incidental parameters problem is avoided in linear models by di¤erencingout the �xed e¤ects, so that they do not have to be estimated. This then ensures consistent estimation of the remaining parameters.

Reevaluating the Modernization Hypothesis 8
where �j and �jare exogenous parameters, and yi is the average of yi��1 for � = 1; :::; T . The important assumption
is that the component of �ji which is uncorrelated with yi will be random in that it will not be correlated with dit. Asa consequence, one can write (incorporating the constant term �j into the time e¤ects �jt )
Pr (dit = 1 j dit�1 = 0; yit�1; t) = �� posyit�1 + �
post + yi�
pos�
(6)
Pr (dit = 1 j dit�1 = 1; yit�1; t) = �� negyit�1 + �
negt + yi�
neg�. (7)
Notably, this speci�cation is less �exible than including a full set of �xed e¤ects, which was the strategy in the linearmodels, because it imposes considerable amount of structure on how unobserved heterogeneity (omitted time-invariantfactors) a¤ects democratic transitions. Consequently, this speci�cation makes it less likely that one can fully controlfor the e¤ect of omitted variables simultaneously a¤ecting income and democracy, and thus more likely that one maystill �nd a spurious positive e¤ect of income on transitions to and away from democracy. Nevertheless, column 2 ofTable 3 shows that even with this more restrictive Chamberlain hazard model, there is no e¤ect of income per capita ontransitions to or away from democracy. Once again, panel A�s estimation imposes that pos = neg, �post = �negt , and�pos
= �neg. Panel B�s estimation allows for pos 6= neg but imposes �post = �negt and �
pos= �
neg. Panel C allows
for pos 6= neg, �post 6= �negt , and �pos 6= �
neg. In all of these panels, the e¤ect of income per capita is reduced and
becomes insigni�cant. Overall, there is no evidence that income per capita has a causal e¤ect on transitions to or awayfrom democracy once controls for omitted variables simultaneously a¤ecting the evolution of income and democracy areincluded.Columns 3 and 4 are analogous to columns 1 and 2 on an annual balanced sample, and achieve similar results.
Column 5 adds lagged population and lagged education to the sample of columns 1 and 2, where the averages of laggedpopulation and lagged education are used in the calculation of (5), and again, income per capita has no e¤ect ontransitions to democracy or transitions away from democracy.All in all, the results in the last two sections show that no matter what estimation approach one takes, controlling for
omitted variables simultaneously a¤ecting income and democracy�either by including a full set of �xed country e¤ectsor by using the parameterized approach of Chamberlain (1980)�removes the empirical relationship between income percapita and democracy.
5. Democracy and Income in the Long Run
The analysis so far followed much of the existing literature in focusing on the post-war period, where the democracyand income data are of higher quality. It is also important to investigate whether the relationship between income anddemocracy emerges over a longer period of time to take into account the development experiences of the late nineteenthand early twentieth centuries.Although historical data are typically less reliable, the Polity IV dataset extends back to the beginning of the
nineteenth century for all independent countries, as does the Boix-Rosato extension of Przeworski et al.�s dataset, andMaddison (2003) gives estimates of income per capita for many countries during this period. We therefore construct adata set starting from 1875 in 25-year intervals in order to maximize the cross-section of countries which can be observed.The data includes a balanced panel of countries for which democracy, lagged democracy (calculated 25 years earlier),and lagged income (calculated 25 years earlier) are available for every 25th year between 1875 and 2000.24 The resultis a sample of 25 countries for the regressions using the Polity measure and a sample of 30 countries for the regressionsusing the Przeworski/Boix-Rosato measure.25
Table 4 presents �xed e¤ects results with this long run panel. The speci�cations of columns 1-4 in Table 4 areidentical to the speci�cations of columns 1-4 of Table 1 over the long 25 year sample where the dependent variable isthe Polity index. In columns 5-8, the dependent variable is the Przeworski/Boix-Rosato index. The results in this tableare very similar with either measure of democracy. Columns 1 and 5 report the basic pooled OLS regressions without�xed e¤ects. These show the usual �ndings since income per capita has a positive coe¢ cient and is strongly signi�cant.Columns 2 and 6 then add the �xed e¤ects, and the introduction of �xed e¤ects makes income per capita insigni�cant.
24For reasons of data availability, income per capita in 1820 is assigned to 1850, income per capita in 1870 to 1875, and income per capitain 1929 to 1925. All results are robust to dropping the 1875 observation so as to not use the 1850 estimate of income per capita as thevalue of lagged income. For all observations, if income per capita is not available for a particular observation, it is estimated at the lowestaggregation level for which it is available, and the regressions are clustered by the highest aggregation level assigned to a particular country.Also, the 1994 Przeworski/Boix-Rosato democracy score is assigned to 2000.25Countries in both samples are Argentina, Austria, Belgium, Brazil, Chile, China, Colombia, Costa Rica, Denmark, El Salvador, Greece,
Guatemala, Honduras, Mexico, Netherlands, Nicaragua, Norway, Sweden, Switzerland, Thailand, Turkey, United Kingdom, United States,Uruguay, Venezuela. The sample with Przeworski/Boix-Rosato measure additionally includes France, Japan, Peru, Portugal, and Spain.

Reevaluating the Modernization Hypothesis 9
In columns 3 and 7, the use of the Arellano-Bond estimator causes income to have the wrong (negative) sign, and incolumns 4 and 8, the use of the long di¤erence estimator also causes income to have the wrong sign.Table 5 examines whether there is a relationship between transitions to democracy and transitions away from
democracy in this long run panel using the dichotomous Przeworski/Boix-Rosato measure of democracy. We againimplement the double hazard model introduced in Section 4.2.. As before, the three possible models with di¤eringdegrees of �exibility in cross-equation restrictions are presented.26 As in the post-war panel, without �xed e¤ects thee¤ect of income is large and signi�cant on transitions to democracy and transitions away from democracy. However,once again when �xed e¤ects to control for omitted variables simultaneously a¤ecting the evolution of income anddemocracy are included, the relationship between income per capita and transitions to and away from democracybecomes insigni�cant.The conclusion from this investigation is that the long run historical evolution of countries is similar to the evolution
of countries in the post-1960 sample. Once �xed e¤ects are controled for, there is no signi�cant relationship betweenincome per capita and democracy.
6. Interpreting the Fixed E¤ects Results
In the introduction, we argued that the �xed e¤ects results are consistent with the hypothesis that the (long run)political and economic development paths of societies are intimately linked. There is a natural complementarity betweenpolitical and economic institutions. Economies grow if their economic institutions encourage investment and innovation,for example, by providing secure property rights and equality before the law; but this can only happen when thosecontrolling political power (the political elites) are constrained. One should thus expect democracy to be associatedwith economic institutions that foster growth. This reasoning implies that if events at some critical juncture create adivergence in the political and economic institutions of a set of societies, these di¤erences should persist over time; someof these societies may embark on a path to high income and democracy, while others experience relative stagnation andnon-democracy.Thus, according to this theory, democracy and income evolve jointly. Nevertheless, conditional on a given devel-
opment path, economic growth does not necessarily lead to democratization.27 This reasoning suggests that the �xede¤ects estimated in the previous section should be closely linked to the underlying institutional development paths andto the factors a¤ecting what type of path a society has followed. This section investigates this question by seeing whetherthe presence of historical variables in the pooled cross-sectional regression can remove the statistical association betweenincome and democracy.Acemoglu, Johnson, and Robinson (2001, 2002) document that factors a¤ecting the pro�tability of di¤erent insti-
tutional structures for European colonizers had a major impact on early institutions and on subsequent political andeconomic development in former European colonies. One therefore expects former European colonies with higher in-digenous population density in 1500 to have experienced greater extraction of resources and repression by Europeans,and consequently to be less democratic today. However, population density in 1500 is subject to a large amount ofmeasurement error, and it is only one of the in�uences on the ultimate choice of development path. For example, forvarious reasons, Europeans opted for extractive institutions in many areas, such as Brazil, with low population density.A direct measure of institutions immediately after the end of the colonial period is thus also useful to gauge the e¤ectof the historical development paths on current outcomes. One such measure is the constraint on the executive from thePolity IV dataset right after independence for each former colony, measured as the average score during the �rst ten yearsafter independence. This is the closest available variable to a measure of institutions during colonialism. This score isnormalized to a 0 to 1 scale like democracy, with 1 representing the highest constraint on the executive.28 A �nal controlis the date of independence. This is useful because constraint on the executive at di¤erent dates of independence maymean di¤erent things. In addition and potentially more importantly, countries where Europeans settled and developedsecure property rights and more democratic institutions typically gained their independence earlier than colonies withextractive institutions. Another important e¤ect of the date of independence on political and economic developmentmight be that former colonies undergo a relatively lengthy period of instability after independence, adversely a¤ectingboth growth prospects and democracy.29
26Speci�cally, Columns 1 and 2 correspond to the speci�cations of columns 1 and 2 of panel A of Table 3; columns 3 and 4 correspond tothe speci�cations of columns 1 and 2 of panel B of Table 3; and columns 5 and 6 correspond to the speci�cations of columns 1 and 2 of panelC of Table 3.27Similarly, there is no natural presumption that, conditional on a particular development path, a temporary improvement in the democracy
score should lead to higher incomes.28For example, Peru had a constraint on the executive score equal to 0.33, while the United States�s score was 1 at independence. These
numbers are clearly indicative of the institutions that these countries had within the colonial period itself.29 If one also uses settler mortality, proposed and constructed in Acemoglu, Johnson and Robinson (2001), the results are similar, though

Reevaluating the Modernization Hypothesis 10
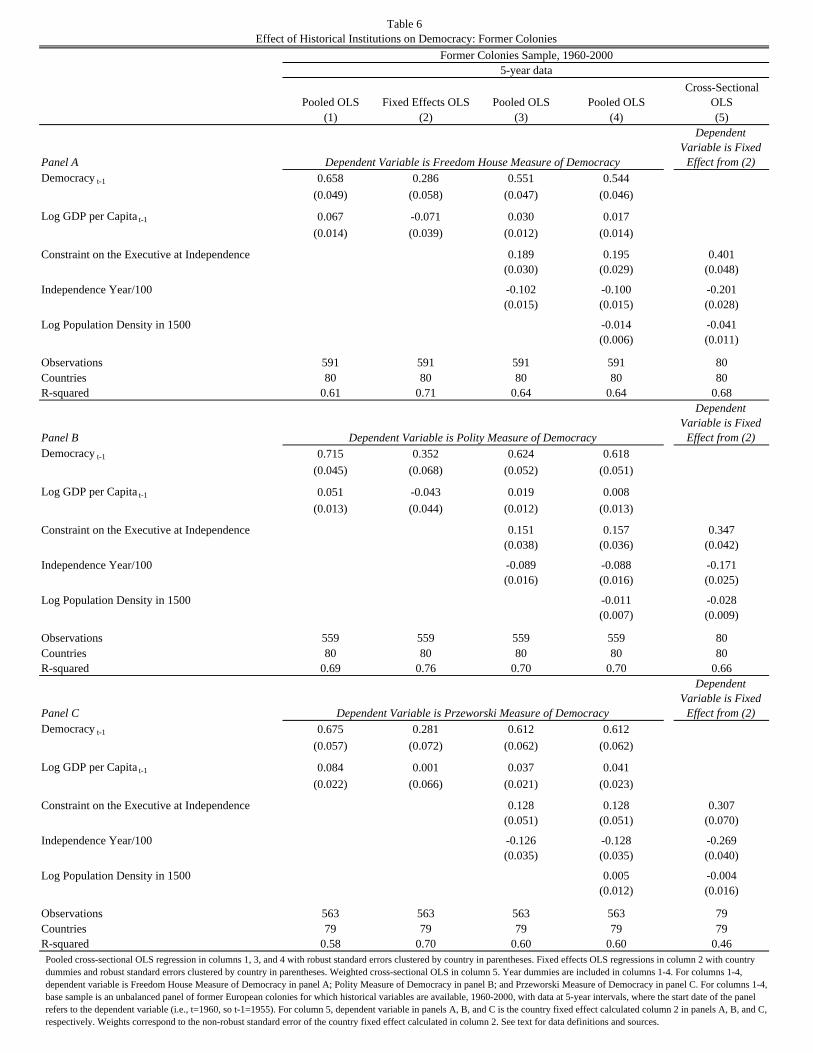
To explore the nature of the �xed e¤ects and the sources of the cross-sectional correlation between income anddemocracy in the former colonies sample, columns 1 and 2 of Table 6 document analogous results to columns 1 and2 of Table 1 for this sample. They show that the positive and signi�cant association between income and democracypresent in the pooled cross-sectional regression disappears once �xed e¤ects are introduced. To understand this result,we use two complementary strategies. First, columns 3 and 4 replace the �xed e¤ects on the right hand side of (1) withhistorical, time-invariant country-speci�c variables. Column 3 introduces constraint on the executive at independenceand the independence year of a country. The level of democracy is positively associated with constraint on the executiveat independence and negatively associated with independence year (i.e., younger countries are less democratic). Impor-tantly, the coe¢ cient on income is reduced, for example from 0.067 in column 1 to 0.030 in column 3 of panel A. Column4 introduces population density in 1500 to this speci�cation and shows that the coe¢ cient on population density in 1500is negative in panels A and B. In panel A, the coe¢ cient on income becomes 0.017 and is insigni�cant. These resultssuggest that the three historical variables are capturing (and removing) the same cross-sectional correlation betweenincome and democracy is the �xed e¤ects in column 2. The second strategy for understanding the �xed e¤ect is todirectly regress the �xed e¤ects from the speci�cation in column 2 on the three historical variables to highlight thecorrelation between these �xed e¤ects.30 This regression reported in column 5 shows a strong correlation between these�xed e¤ects and the historical variables. For example, the R2 is 0.68 in panel A.Overall, this section has provided evidence that is consistent with the interpretation of the �xed e¤ects results as
capturing the impact of time-invariant, historical variables simultaneously a¤ecting the evolution of income and democ-racy. It has documented that various historical variables that proxy for the factors in�uencing the subsequent evolutionof institutions in former European colonies are closely related to the �xed e¤ects from the democracy regressions. Thispattern is consistent with the general thrust of the critical junctures hypothesis.
7. Conclusion
There is a general consensus in the empirical literature that the modernization hypothesis holds and that thereis a causal e¤ect of per capita income on democracy. In this paper, we argue that, though income and democracyare positively correlated, there is no evidence of a signi�cant causal e¤ect of income on democracy. Instead, omittedand most probably historical factors appear to have shaped the divergent political and economic development paths ofvarious societies, leading to the positive association between economic performance and democracy. The analysis in thispaper provides an interpretation of these econometric results by considering the alternative critical junctures hypothesisand by linking the �xed e¤ects to historical variables in the sample of former European colonies. Fixed e¤ects indeedcapture the impact of historical di¤erences which researchers have shown can account for economic and institutionaldivergence.The main conclusion is that the relationship between income and democracy and the widely-accepted modernization
hypothesis need to be reevaluated, with much greater emphasis on the underlying factors a¤ecting both variables and thepolitical and economic development path of societies. These results should not be interpreted as implying that historicalfactors (or time-invariant factors captured by �xed e¤ects) are the only or the major determinant of democracy today.There is a large amount of variability in democracy across countries that is not explained by the historical variables inthis analysis and there is also a substantial amount of over-time variability in the democracy score of a country that stillneeds to be understood and accounted for.31 For example, it remains true that over time there is a general tendencytowards greater incomes and education, and increased political participation across the world. In the regressions ofthis paper, time e¤ects capture these general (world-wide) tendencies. The estimates of this paper suggest that theseworld-level movements in democracy are unlikely to be driven by the causal e¤ect of income and education on democracy.The causes of these world-wide trends are an interesting area for future research.
Bibliography
Acemoglu, D., Johnson, S., Robinson J.A., 2001. The Colonial Origins of Comparative Development: An EmpiricalInvestigation. American Economic Review 91, 1369-1401.Acemoglu, D., Johnson, S., Robinson, J.A., 2002. Reversal of Fortune: Geography and Institutions in the Making
of the Modern World Income Distribution. Quarterly Journal of Economics 118, 1231-1294.
the sample is smaller than the one used in Table 6. These results are available upon request.30This regression should be interpreted as illustrative, since �xed e¤ects in linear models, such as in the speci�cation in column 2, are not
estimated consistently for the reasons discussed in footnote 23.31 In previous working papers, it has been shown for example that the experience of an economic crisis is positively related to democracy
even when one controls for country �xed e¤ects.

Reevaluating the Modernization Hypothesis 11
Acemoglu, D., Johnson, S., Robinson, J.A., Yared, P., 2008. Income and Democracy. American Economic Review98, 808-842.Anderson, T.W., Hsiao, C., 1982. Formulation and Estimation of Dynamic Models using Panel Data. Journal of
Econometrics 18, 67-82.Arellano, M., Bond, S.R., 1991. Some Speci�cation Tests for Panel Data: Monte Carlo Evidence and an Application
to Employment Equations. Review of Economic Studies 58, 277-298.Barro, R.J., 1999. The Determinants of Democracy. Journal of Political Economy 107, S158-S183.Barro, R.J., Lee, J., 2000. International Data on Educational Attainment: Updates and Implications. CID Working
Paper #42.Bertrand, M., Du�o, E., Mullainathan, S., 2004. How Much Should We Trust Di¤erences-in-Di¤erences Estimates?.
Quarterly Journal of Economics 119, 249-275.Boix, C., Rosato, S., 2001. A Complete Data Set of Political Regimes, 1800-1999. Unpublished, Department of
Political Science, University of Chicago.Bollen, K.A., 1990. Political Democracy: Conceptual and Measurement Traps. Studies in Comparative International
Development 25, 7-24.Bollen, K.A., 2001.Cross-National Indicators of Liberal Democracy, 1950-1990. [Computer �le]. 2nd ICPSR version.
Chapel Hill, NC: University of North Carolina [producer], 1998. Inter-university Consortium for Political and SocialResearch [distributor].Central Intelligence Agency, 2004. CIA World Factbook, Website and Book. Washington, DC.Chamberlain, G., 1980. Analysis of Covariance with Qualitative Data. Review of Economic Studies 47, 225-238.Engerman, S.L., Sokolo¤, K.L., 1997. Factor Endowments, Institutions, and Di¤erential Paths of Growth among
New World Economies. In: Haber, S.H. (Ed.), How Latin America Fell Behind. Stanford University Press, Stanford.Freedom House, 2004. Freedom in the World, Website and Book. Washington, DC.Griliches, Z., Hausman, J., 1986. Errors in Variables in Panel Data. Journal of Econometrics 31, 93�118.Hahn, J., Hausman, J., Kuersteiner, G., 2007. Long Di¤erence Instrumental Variable Estimation for Dynamic Panel
Models with Fixed E¤ects. Journal of Econometrics 140, 574-617.Heston, A., Summers, R., Atten, B., 2002. Penn World Tables Version 6.1. Center for International Comparisons at
the University of Pennsylvania (CICUP).Lipset, S.M., 1959. Some Social Requisites of Democracy: Economic Development and Political Legitimacy. American
Political Science Review 53, 69-105.Londregan, J.B., Poole, K.T., 1996. Does High Income Promote Democracy?. World Politics 49, 1-30.Maddison, A., 2003. The World Economy: Historical Statistics. Development Centre of the Organization for
Economic Cooperation and Development. Paris, France.Marshall, M.G., Jaggers, K., 2004. Political Regime Characteristics and Transitions, 1800-2002. Polity IV Project.
University of Maryland.McEvedy, C., Jones, R., 1975. Atlas of World Population History. Facts on File, New York.Moore, B., 1966. Social Origins of Dictatorship and Democracy. Beacon Press, Boston.Moulton, B.R., 1986. Random Group E¤ects and the Precision of Regression Estimates. Journal of Econometrics
32, 385-397.Mundlak, Y., 1978. On the Pooling of Time Series and Cross Section Data. Econometrica 46, 69-85.Papaioannou, E., Siourounis, G., 2004. Economic and Social Factors Driving the Third Wave of Democratization.
Unpublished, London Business School.Przeworski, A., Alvarez, M., Cheibub, J.A., Limongi, F., 2000. Democracy and Development: Political Institutions
and Material Well-being in the World, 1950-1990. Cambridge University Press, New York.Przeworski, A., Limongi, F., 1997. Modernization: Theory and Facts. World Politics 49, 155-183.Wooldridge, J.M., 2002. Econometric Analysis of Cross Section and Panel Data. MIT Press, Cambridge.World Bank, 2002. World Development Indicators. CD-ROM and Book. Washington, DC.

Sample includes all countries in five year intervals between 1955 and 1990 which are non-democratic according to the Przeworski Measure of Democracy for which at least two observations are available. Observations are grouped depending on whether log income per capita is above or below the average log income per capita in the world for the observation year. Each column measures the fraction of observations within each group which experience a transition to democracy five years later. See text for data definitions and sources.
05
1015
% T
rans
ition
to D
emoc
racy
Log GDP per Capita (Penn World Tables)Below World Mean Above World Mean
Transition to Democracy and Income Level, 1960-1995Figure 1

Sample is the same as in Figure 1. Log income per capita for every observation is demeaned from the average log income per capita in the world for the observation year. Observations are grouped depending on whether demeaned log income per capita is above or below the average demeaned log income per capita in the country between 1955 and 1990. Each column measures the fraction of observations within each group which experience a transition to democracy five years later. See text for data definitions and sources.
02
46
810
% T
rans
ition
to D
emoc
racy
Log GDP per Capita (Penn World Tables)Below Country Mean Above Country Mean
Transition to Democracy and Income Level, 1960-1995Figure 2
Sample includes all countries in five year intervals between 1955 and 1990 which are democratic according to the Przeworski Measure of Democracy for which at least two observations are available. Observations are grouped depending on whether log income per capita is above or below the average log income per capita in the world for the observation year. Each column measures the fraction of observations within each group which experience a transition to non-democracy five years later. See text for data definitions and sources.
05
1015
20%
Tra
nsiti
on to
Non
-Dem
ocra
cy
Log GDP per Capita (Penn World Tables)Below World Mean Above World Mean
Transition to Non-Democracy and Income Level, 1960-1995Figure 3
Sample is the same as in Figure 3. Log income per capita for every observation is demeaned from the average log income per capita in the world for the observation year. Observations are grouped depending on whether demeaned log income per capita is above or below the average demeaned log income per capita in the country between 1955 and 1990. Each column measures the fraction of observations within each group which experience a transition to non-democracy five years later. See text for data definitions and sources.
02
46
8%
Tra
nsiti
on to
Non
-Dem
ocra
cy
Log GDP per Capita (Penn World Tables)Below Country Mean Above Country Mean
Transition to Non-Democracy and Income Level, 1960-1995Figure 4

Annual data
Pooled OLSFixed Effects
OLSArellano-Bond
GMMGriliches-
Hausman LDFixed Effects
OLSFixed Effects
OLSArellano-Bond
GMM(1) (2) (3) (4) (5) (6) (7)
Panel ADemocracy t-1 0.703 0.377 0.489 0.636 [0.00] 0.362 0.508
(0.036) (0.052) (0.085) (0.135) (0.056) (0.093)
Log GDP per Capita t-1 0.073 0.008 -0.129 -0.043 [0.33] -0.038 -0.153(0.010) (0.034) (0.076) (0.046) (0.042) (0.133)
Log Population t-1 -0.019 0.016(0.083) (0.119)
Education t-1 -0.012 -0.025(0.019) (0.024)
Observations 955 955 838 103 2896 685 589Countries 150 150 127 103 148 96 92R-squared 0.72 0.79 0.93 0.76Panel BDemocracy t-1 0.748 0.447 0.590 0.920 [0.00] 0.453 0.633
(0.034) (0.063) (0.106) (0.122) (0.068) (0.112)
Log GDP per Capita t-1 0.053 -0.003 -0.351 -0.016 [0.53] -0.006 -0.229(0.010) (0.038) (0.127) (0.049) (0.044) (0.186)
Log Population t-1 0.160 0.156(0.081) (0.106)
Education t-1 -0.028 -0.027(0.021) (0.028)
Observations 856 856 747 92 3705 643 541Countries 136 136 114 92 134 93 91R-squared 0.77 0.82 0.96 0.80Panel CDemocracy t-1 0.679 0.318 0.457 0.754 [0.00] 0.293 0.389
(0.046) (0.058) (0.092) (0.198) (0.062) (0.106)
Log GDP per Capita t-1 0.097 0.051 -0.017 -0.040 [0.77] 0.052 0.107(0.018) (0.055) (0.138) (0.070) (0.088) (0.233)
Log Population t-1 0.066 0.301(0.144) (0.206)
Education t-1 -0.012 -0.045(0.045) (0.040)
Observations 862 862 792 110 3720 619 524Countries 123 123 118 110 119 95 93R-squared 0.67 0.76 0.92 0.75
Table 1Fixed Effects Results using Democracy
Dependent Variable is Freedom House Measure of Democracy
Dependent Variable is Przeworski Measure of Democracy
Base Sample, 1960-2000
Dependent Variable is Polity Measure of Democracy
5-year data 5-year data
Pooled cross-sectional OLS regression in column 1, with robust standard errors clustered by country in parentheses. Fixed effects OLS regressions in columns 2, 5, and 6, with country dummies and robust standard errors clustered by country in parentheses. Columns 3 and 7 use GMM of Arellano and Bond (1991), with robust standard errors; in both columns we instrument for income using a double lag. In column 4, we use the Griliches-Hausman (1986) long difference estimator with the lagged level of democracy as an instrument and with robust standard errors. Year dummies are included in all regressions. Dependent variable is Freedom House Measure of Democracy in panel A; Polity Measureof Democracy in panel B; and Przeworski Measure of Democracy in panel C. Base sample in columns 1, 2, 3, 4, 6, and 7 is an unbalanced panel, with data at 5-year intervals; the sample is 1960-2000 for columns 1, 2, 3, 6, and 7 and 1975-2000 for column 4 where the start date of the panel refers to the dependent variable (i.e., t=1960, so t-1=1955); column 5 uses annual data from the 1960-2000 unbalanced panel. In column 5, each right hand side variable has five annual lags; we report the p-value from an F-test for the joint significance of all 5 lags. See text for data definitions and sources.
Annual data
Pooled OLSFixed Effects
OLSArellano-Bond
GMMGriliches-
Hausman LDFixed Effects
OLS(1) (2) (3) (4) (5)
Panel ADemocracy t-1 0.685 0.328 0.466 0.513 [0.00]
(0.062) (0.075) (0.109) (0.370)
Log GDP per Capita t-1 on Transitions to Democracy 0.073 0.008 -0.135 -0.052 [0.35](0.010) (0.034) (0.079) (0.051)
Log GDP per Capita t-1 on Transitions away from Democracy 0.074 0.012 -0.133 -0.040 [0.34](0.011) (0.034) (0.077) (0.047)
Observations 955 955 838 103 2896Countries 150 150 127 103 148R-squared 0.72 0.79 0.93Panel BDemocracy t-1 0.822 0.550 0.710 1.310 [0.00]
(0.068) (0.107) (0.137) (0.260)
Log GDP per Capita t-1 on Transitions to Democracy 0.055 0.005 -0.320 0.019 [0.54](0.011) (0.039) (0.131) (0.056)
Log GDP per Capita t-1 on Transitions away from Democracy 0.048 -0.005 -0.332 -0.028 [0.60](0.011) (0.037) (0.128) (0.049)
Observations 856 856 747 92 3705Countries 136 136 114 92 134R-squared 0.77 0.82 0.96Panel CDemocracy t-1 0.102 -0.109 0.803 1.662 [0.00]
(0.347) (0.514) (0.910) (1.350)
Log GDP per Capita t-1 on Transitions to Democracy 0.068 0.031 0.084 0.007 [0.54](0.022) (0.056) (0.210) (0.094)
Log GDP per Capita t-1 on Transitions away from Democracy 0.137 0.084 0.037 -0.118 [0.78](0.032) (0.072) (0.148) (0.122)
Observations 862 862 792 110 3720Countries 123 123 118 110 119R-squared 0.67 0.76 0.92
Table 2Fixed Effects Results using Transitions to and Away from Democracy
Dependent Variable is Freedom House Measure of Democracy
Dependent Variable is Przeworski Measure of Democracy
Base Sample, 1960-2000
Dependent Variable is Polity Measure of Democracy
5-year data
Columns 1-5 are isomorphic to columns 1-5 of Table 1 with log GDP per Capita t-1 replaced with two interaction terms. Log GDP per Capita t-1 on Transitions to Democracy represents log GDP per Capitat-1 interacted with a 0/1 dummy which equals 1 only if Democracyt-1 is below the sample mean. Log GDP per Capitat-1 on Transitions away from Democracy represents log GDP per Capitat-1 interacted with a 0/1 dummy which equals 1 only if Democracyt-1 is above the sample mean. In column 5, each right hand side variable has five annual lags for each interaction term; we report the p-value from an F-test for the joint significance of all 5 lags. See text for data definitions and sources.
5-year data
Exponential Hazard
(Pooled)
Exponential Hazard
(Chamberlain RE)
Exponential Hazard
(Pooled)
Exponential Hazard
(Chamberlain RE)
Exponential Hazard
(Chamberlain RE)
(1) (2) (3) (4) (5)Panel A: Constrained ModelLog GDP per Capita t-1 0.412 0.014 0.397 -0.052 -0.044
(0.047) (0.099) (0.046) (0.095) (0.139)
Log Population t-1 -0.263(0.277)
Education t-1 0.030(0.071)
Observations 735 735 3180 3180 588Countries 105 105 106 106 88Panel B: Partially Constrained ModelLog GDP per Capita t-1 on Transitions to Democracy 0.180 -0.050 0.080 -0.157 -0.081
(0.039) (0.113) (0.028) (0.089) (0.148)
Log GDP per Capita t-1 on Transitions away from Democracy 0.288 0.056 0.265 0.027 0.017(0.034) (0.112) (0.026) (0.089) (0.148)
Log Population t-1 0.012(0.293)
Education t-1 0.018(0.084)
Observations 735 735 3180 3180 588Countries 105 105 106 106 88Panel C: Unconstrained ModelLog GDP per Capita t-1 on Transitions to Democracy 0.147 -0.101 0.085 -0.051 -0.135
(0.049) (0.108) (0.029) (0.086) (0.148)
Log GDP per Capita t-1 on Transitions away from Democracy 0.344 0.341 0.208 -0.315 0.308(0.089) (0.279) (0.049) (0.208) (0.336)
Log Population t-1 0.017(0.085)
Education t-1 0.219(0.349)
Observations 686 686 2062 2062 540Countries 105 105 106 106 88
Table 3Hazard Model using Przeworski Measure of Transitions to and away from Democracy
Dependent Variable is Transitions to and away from Democracy
Dependent Variable is Transitions to and away from Democracy
Balanced Panel, 1965-19955-year data
Dependent Variable is Transitions to and away from Democracy
Annual data
Pooled exponential hazard model in columns 1 and 3 and random effects exponential hazard model in columns 2, 4, and 5. Coefficients correspond to average marginal effects. Robust standard errors clustered by country in parentheses. Year dummies are included in all regressions. Dependent variable is Przeworski Measure of Democracy. Base sample in columns 1 and 2 is a balanced panel 1965-1995 with data at 5-year intervals, where the start date of the panel refers to the dependent variable (i.e., t=1965, so t-1=1960). Column 5 is the same panel for which population and education data is available. Columns 3 and 4 is a balanced panel 1965-1994 in annual intervals, where the start date of the panel refers to the dependent variable (i.e., t=1965, so t-1=1964). In columns 1 and 3, in panel A, the coefficients in equations (3) and (4) are constrained to be identical; in panel B, the coefficient on income is allowed to be different; in panel C, the coefficient on income and time effects are allowed to be different. In columns 2, 4, and 5, in panel A, the coefficients in equations (6) and (7) are constrained to be identical; in panel B, the coefficient on income is allowed to be different; in panel C, the coefficient on income, time effects, and country fixed effectsare allowed to be different. See text for data definitions and sources and for a detailed discussion of estimation technique.

Pooled OLSFixed Effects
OLSArellano-Bond
GMMGriliches-
Hausman LD Pooled OLSFixed Effects
OLSArellano-Bond
GMMGriliches-
Hausman LD(1) (2) (3) (4) (5) (6) (7) (8)
Democracy t-1 0.487 0.192 0.439 0.924 0.311 0.042 0.215 1.067(0.085) (0.119) (0.143) (0.211) (0.102) (0.119) (0.143) (0.176)
Log GDP per Capita t-1 0.116 -0.020 -0.495 -0.247 0.259 0.163 -0.692 -0.328(0.034) (0.093) (0.266) (0.123) (0.048) (0.104) (0.198) (0.157)
Observations 150 150 125 25 180 180 150 30Countries 25 25 25 25 30 30 30 30R-squared 0.55 0.65 0.53 0.63
Dependent Variable is Polity Measure of Democracy Dependent Variable is Przeworski Measure of Democracy
Table 4Fixed Effects Results using Democracy in the Long Run
25-year dataBalanced Panel, 1875-2000
Pooled cross-sectional OLS regression in columns 1 and 5, with robust standard errors clustered by highest level of aggregation for income data in parentheses. Fixed effects OLS regressions in columns 2, and 6, with country dummies and robust standard errors clustered by highest level of aggregation for income data in parentheses. Columns 3 and 7 use GMM of Arellano and Bond (1991), with robust standard errors; we instrument for income using a double lag. Columns 4 and 8 use the Griliches-Hausman (1986) long difference estimator with the lagged level of democracy as an instrument and with robust standard errors. Year dummies are included in all regressions. Dependent variable is Polity Measure of Democracy in columns 1-4 and Przeworski Measure of Democracy in columns 5-8. Base sample is a balanced panel 1875-2000. All columns use 25-year data where the start date of the panel refers to the dependent variable (i.e., t=1875, so t-1=1850). GDP per capita is from Maddison (2003). See text for data definitions and sources.

Exponential Hazard (Pooled)
Exponential Hazard
(Chamberlain RE)
Exponential Hazard (Pooled)
Exponential Hazard
(Chamberlain RE)
Exponential Hazard (Pooled)
Exponential Hazard
(Chamberlain RE)
(1) (2) (3) (4) (5) (6)
Log GDP per Capita t-1 0.612 0.035(0.082) (0.159)
Log GDP per Capita t-1 on Transitions to Democracy 0.455 0.056 0.474 0.281(0.066) (0.146) (0.071) (0.173)
Log GDP per Capita t-1 on Transitions away from Democracy 0.509 0.103 0.576 -0.908(0.064) (0.145) (0.255) (0.717)
Observations 180 180 180 180 154 154Countries 30 30 30 30 30 30
Dependent Variable is Transitions to and away from Democracy
Table 5Hazard Model using Transitions to and away from Democracy in the Long Run
25-year dataBalanced Panel, 1875-2000
Pooled exponential hazard model in columns 1, 3, and 5, and random effects exponential hazard model in columns 2, 4, and 6. Robust standard errors clustered by highest level of aggregation for income data in parentheses. Year dummies are included in all regressions. Dependent variable is Przeworski Measure of Democracy. Base sample is a balanced panel 1875-2000. All columns use 25-year data where the start date of the panel refers to the dependent variable (i.e., t=1875, so t-1=1850). In column 1 the coefficients in equations (3) and (4) are constrained to be identical; in column 3, the coefficient on income is allowed to be different; in column 5, the coefficient on income and time effects are allowed to be different. In column 2 the coefficients in equations (6) and (7) are constrained to be identical; in column 4, the coefficient on income is allowed to be different; in column 6, the coefficient on income, time effects, and country fixed effects are allowed to be different. GDP per capita is from Maddison (2003). See text for data definitions and sources.
Pooled OLS Fixed Effects OLS Pooled OLS Pooled OLSCross-Sectional
OLS(1) (2) (3) (4) (5)
Panel A
Dependent Variable is Fixed
Effect from (2)Democracy t-1 0.658 0.286 0.551 0.544
(0.049) (0.058) (0.047) (0.046)
Log GDP per Capita t-1 0.067 -0.071 0.030 0.017(0.014) (0.039) (0.012) (0.014)
Constraint on the Executive at Independence 0.189 0.195 0.401(0.030) (0.029) (0.048)
Independence Year/100 -0.102 -0.100 -0.201(0.015) (0.015) (0.028)
Log Population Density in 1500 -0.014 -0.041(0.006) (0.011)
Observations 591 591 591 591 80Countries 80 80 80 80 80R-squared 0.61 0.71 0.64 0.64 0.68
Panel B
Dependent Variable is Fixed
Effect from (2)Democracy t-1 0.715 0.352 0.624 0.618
(0.045) (0.068) (0.052) (0.051)
Log GDP per Capita t-1 0.051 -0.043 0.019 0.008(0.013) (0.044) (0.012) (0.013)
Constraint on the Executive at Independence 0.151 0.157 0.347(0.038) (0.036) (0.042)
Independence Year/100 -0.089 -0.088 -0.171(0.016) (0.016) (0.025)
Log Population Density in 1500 -0.011 -0.028(0.007) (0.009)
Observations 559 559 559 559 80Countries 80 80 80 80 80R-squared 0.69 0.76 0.70 0.70 0.66
Panel C
Dependent Variable is Fixed
Effect from (2)Democracy t-1 0.675 0.281 0.612 0.612
(0.057) (0.072) (0.062) (0.062)
Log GDP per Capita t-1 0.084 0.001 0.037 0.041(0.022) (0.066) (0.021) (0.023)
Constraint on the Executive at Independence 0.128 0.128 0.307(0.051) (0.051) (0.070)
Independence Year/100 -0.126 -0.128 -0.269(0.035) (0.035) (0.040)
Log Population Density in 1500 0.005 -0.004(0.012) (0.016)
Observations 563 563 563 563 79Countries 79 79 79 79 79R-squared 0.58 0.70 0.60 0.60 0.46
Dependent Variable is Freedom House Measure of Democracy
Dependent Variable is Polity Measure of Democracy
Dependent Variable is Przeworski Measure of Democracy
Table 6Effect of Historical Institutions on Democracy: Former Colonies
Former Colonies Sample, 1960-20005-year data
Pooled cross-sectional OLS regression in columns 1, 3, and 4 with robust standard errors clustered by country in parentheses. Fixed effects OLS regressions in column 2 with country dummies and robust standard errors clustered by country in parentheses. Weighted cross-sectional OLS in column 5. Year dummies are included in columns 1-4. For columns 1-4, dependent variable is Freedom House Measure of Democracy in panel A; Polity Measure of Democracy in panel B; and Przeworski Measure of Democracy in panel C. For columns 1-4, base sample is an unbalanced panel of former European colonies for which historical variables are available, 1960-2000, with data at 5-year intervals, where the start date of the panel refers to the dependent variable (i.e., t=1960, so t-1=1955). For column 5, dependent variable in panels A, B, and C is the country fixed effect calculated column 2 in panels A, B, and C, respectively. Weights correspond to the non-robust standard error of the country fixed effect calculated in column 2. See text for data definitions and sources.