reef-top sediment bodies: windward o‘ahu,...
TRANSCRIPT

61
Reef-Top Sediment Bodies: Windward O‘ahu, Hawai‘i1
Christopher Bochicchio,2,4 Charles Fletcher,2 Matthew Dyer,2 and Thomas Smith3
Abstract: Hawaiian fringing reefs display sand bodies on their surfaces that arepotentially important components of littoral sediment budgets. This work pro-vides a regional survey of modern reef-top sediment storage and investigatedgeologic controls on sediment storage potential. Sand bodies are formed whensediment accumulates in topographic depressions that are the result of meteoricwater eroding the emerged carbonate reef platform during periods of lower sealevel. The relief of some depressions may be modified by Holocene reef accre-tion. Depression morphology exerts a strong control on volume and internaldistribution of sediment. In this study a total of 205 jet probe thickness mea-surements was collected from 54 major sand bodies on the fringing reef (0–20m depth) adjacent to 22 km of Southeast O‘ahu coastline (Kailua, Lanikai, andWaimanalo). Volumes were determined and synthesized with previous volumeestimates of coastal subaerial and deeper submarine sediment bodies (20–200m depth), giving the total sediment storage within the coastal system. Sandbodies range from 50 to 2,800 m from shore. Measured thickness varied from0 to greater than 3.0 m with a mean of 0.95 m. For this study sand bodieswere classified into three dominate morphologies: channel, field, and karstdepression. The volume of sediment stored in channels was 58;253G 618�103 m3, fields contained 171G 6� 103 m3, and karst depressions contained1;332G 248� 103 m3. Correlation of sediment body distribution with reefand coastal plain morphology revealed potential geologic controls on sandbody formation in this region. Meteoric runoff and reef slope are importantcontrols on spatial distribution of sand bodies.
Erosion of Hawaiian sandy beachesthreatens important aspects of Hawaiianculture, economy, and ecology. Recreation,sense of identity, ecological stability, and eco-nomic prosperity are all closely tied to the ex-istence or perception of pristine white sandybeaches rimming the shoreline. To ensurethe longevity and sustainability of Hawaiianbeaches, we must recognize carbonate sedi-
ment in the coastal zone as an importantnatural resource to be managed from an in-formed scientific perspective. In an effort tocontribute to management and scientific un-derstanding of sediment flux and storage,this research has three primary objectives:
1. Survey major sediment bodies to iden-tify potential sources of shallow (<20m depth) beach replenishment material
2. Establish a total storage value for theregional sediment budget
3. Correlate sediment distribution withregional morphology and sea level his-tory to identify potential geologic con-trols on sediment storage
These goals were applied to a nearshorefringing reef on windward O‘ahu, Hawai‘i,occupying 22 km of coastline in Kailua, Lani-kai, and Waimanalo (Figure 1).
Unconsolidated sediment accumulatesacross the reef surface as it is created eitherby erosion of reef framework or directly de-
Pacific Science (2009), vol. 63, no. 1:61–82: 2009 by University of Hawai‘i PressAll rights reserved
1Manuscript accepted 18 February 2008.2 Department of Geology and Geophysics, University
of Hawai‘i at Manoa—Coastal Geology, 1680 East-WestRoad, Post 721a, Honolulu, Hawai‘i 96822.
3 U.S. Army Corps of Engineers, Pacific Ocean Divi-sion, Honolulu District, Building T233, Fort Shafter,Hawai‘i 96858.
4 Corresponding author (e-mail: [email protected]).
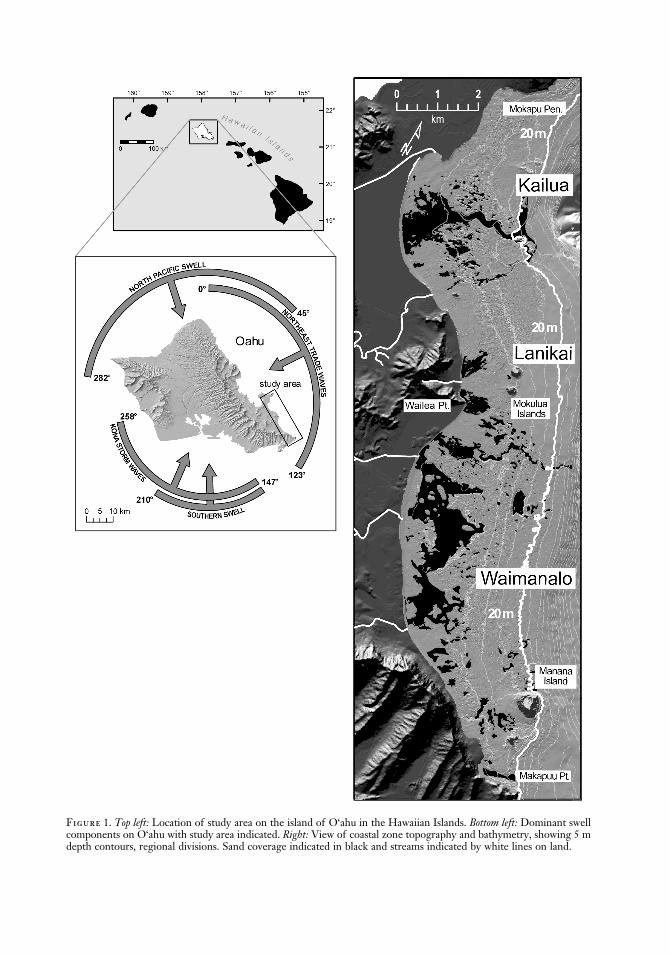
Figure 1. Top left: Location of study area on the island of O‘ahu in the Hawaiian Islands. Bottom left: Dominant swellcomponents on O‘ahu with study area indicated. Right: View of coastal zone topography and bathymetry, showing 5 mdepth contours, regional divisions. Sand coverage indicated in black and streams indicated by white lines on land.

posited as skeletal components (Harney andFletcher 2003). In many cases this sedimentfills reef-top depressions, creating discreteisolated sediment bodies. Sediment bodiesare conspicuous features on reef flats, display-ing large variation in size, shape, and locationand easily recognized in remotely sensed im-agery (Conger et al. 2005). Sediment bodiesalso represent a prominent component ofthe geologic framework of insular shelvesand potentially play an active role in littoralsediment budgets. Sediment exchange be-tween sand bodies and the beach face couldbe an important component of shoreline sta-bility and in some cases can provide quantitiesof affordable sand for beach replenishment(Moberly and Chamberlain 1964, Cascianoand Palmer 1969, Moberly et al. 1975). How-ever, their role in littoral processes needs tobe better understood to define best manage-ment practices.
The majority of reef-top depressions arerelict features incised into the surface of Ha-waiian reef platforms via dissolution or fluvialerosion during periods of lower sea levelwhen subaerially exposed limestone is incontact with meteoric waters (Purdy 1974).The resulting channel and karst-doline land-scape is drowned by rising sea level andsubsequently filled with sediment, unless de-pressions are closed by new reef accretion(Conger 2005).
Sediment trapping on the reef surfacekeeps sand potentially available for circulationwithin a littoral cell rather than lost to off-shore sites (Grossman et al. 2006). Most sedi-ment in reef systems is produced on theshallow nearshore platform where carbonateproductivity and erosion are the highest. Sed-iment will remain on the reef platform instorage or as part of the active littoral systemunless it is transported seaward of the reefcrest and insular shelf (Harney and Fletcher2003). Once sediment crosses this threshold,the comparatively steep angle of the forereef slope likely prevents most shorewardtransport, effectively removing sediment fromlittoral circulation. On many islands steepsubmarine terraces at >20 m depth exacer-bate sediment loss by presenting a seaward-facing sharp break in topography (Coulbourn
et al. 1974). In some cases large channels areincised, perpendicular to the shoreline andthrough the reef crest, creating a potentialpathway for sediment exchange between in-ner and outer portions of the reef platform(Grossman et al. 2006).
In this paper, we report findings from205 jet probe thicknesses from 54 reef-topsediment bodies in shallow (0–20 m) depths(Bochicchio et al. 2006). The study regionencompassed 22 km of O‘ahu’s windwardcoast between Makapu‘u Point and MokapuPoint, including Kailua Bay, Lanikai, andWaimanalo Bay. Volume estimates and un-certainties were extrapolated from thicknessdata for each sediment body. A synthesisof previously measured subaerial, reef-front(20–200 m depth), and unsampled sedimentbodies defined total sediment storage in thestudy area. Sediment body morphology andspatial distribution were examined in thecontext of geologic processes to determinepotential environmental factors influencingsediment storage potential on the reef plat-form.
Study Area
A relatively deep fringing reef platform in thestudy area extends 3–3.5 km from the shore-line to a depth of approximately 20 m where asteeply dipping fore reef slope descends to alower terrace at approximately 30 m depth.The reef crest shallows to between 0 and 5m depth at 0.3–1.0 km from shore along70% of the study region.
Kailua Bay supports a 12 km2 fringing reefplatform that extends from a carbonate sandbeach to approximately 20 m water depth.The reef platform is bisected by a sinuous200 m wide sediment-floored channel, whichis likely the extension of drainage from theKailua watershed during lowered Pleistocenesea level. The channel widens landward into abroad triangular sand body in approximately5 m depth terminating at Kailua Beach; a sim-ilar body is present at the offshore mouth in20–35 m water depth (Hampton et al. 2004).Sand-filled, reef-top karst depressions of var-ious sizes are present to the north and southof the channel. The fragmented remains of a
Reef-Top Sediment Bodies: O‘ahu, Hawai‘i . Bochicchio et al. 63

smaller channel system extend over the reefplatform in the southern region of the bay.Holocene reef accretion is likely responsiblefor closing and fragmentation of the channel.Kailua Beach has shown a trend of accretion(0.5 m/yr) over the last 70 yr (Norcross et al.2002).
The Lanikai region is a slightly embayedheadland with southerly Wailea Point the far-thest seaward point and the twin MokuluaIslands located immediately offshore. Threelarge sand fields, separated by a shallowpatchwork of coral heads, extend seawardfrom shore, diminishing toward a prominentreef crest. South of the Mokulua Islands, acomplex of steeply bounded sand-filled de-pressions and a portion of a channel are in-cised across the shallow (<2 m depth) backreef.
Waimanalo Bay’s reef flat supports a large(@2.9 km2), steep-walled (@10% slope) basinwith a sandy bottom 3–5 m below the reefsurface. Within the basin are circular to ovalelevated outcrops resembling patch reef, ris-ing from the sandy seafloor. A shallow reefcrest occurs 1.5–0.3 km from shore; it is far-thest from shore in the northern part of thebay and gradually trends closer to shore tothe south, where it is most prominent. Twovolcanic islands are present in the southernportion of the bay; Manana Island is thelargest.
Wave Environment
Wave energy influences coastline stability,nearshore sediment transport, and mechani-cal abrasion on the reef. Hawai‘i’s regionalwave climate was described in four compo-nents by Bodge and Sullivan (1999):
1. High-energy swell is created during thewinter by storms north of Hawai‘i.Waves are incident on west-northwestto north-northeast shorelines with typi-cal heights of 1.5–4.5 m and periods of12–20 sec.
2. Lower-energy south swell occurs be-tween the months of April and Octo-ber. Waves are incident on mostsouth-facing shorelines and have typical
heights of 0.3–1.8 m and periods of12–20 sec.
3. Kona storms infrequently produce fromthe south and west wave heights of 3–4.5 m and periods of 6–10 sec.
4. Trade wind waves consistently ap-proach from the general east to north-east quadrant for 90% of summermonths and 55–65% of winter months(Grigg 1998). Trade wind wave heightsare 1.2–3 m with periods of 4–10 sec.
In addition, large but infrequent hurricanewaves can have considerable impact on thereef (Fletcher et al. 2002).
The primary wave regime for our wind-ward study area is governed by the consistentfull strength of trade wind swell. This swell ismodified by annual and decadal wave eventsfrom the north and south that refract intothe study area. Large south swell is less dom-inant than north swell in this regard. Easterlystorms may also impact the study area withhigh winds and/or high waves approachingon an interannual basis from the northeast,east, or southeast. Calmest conditions in thestudy area occur during Kona wind condi-tions as trade winds diminish, frequently pro-ducing offshore airflow.
Shelf Geology and Reef Accretion
The underlying carbonate framework of thestudy area is the product of reef accretionover recent interglacial cycles. Specifically,the primary structural unit of the shallowO‘ahu shelf is a fossil reef complex datingfrom Marine Isotope Stage (MIS) 7 (ca.190,000–210,000 yr before the present [B.P.][Sherman et al. 1999, Grossman and Fletcher2004]). The front of this shelf accreted sepa-rately during MIS 5a–d (ca. 80,000–110,000yr B.P.). Eolianites of late last interglacialage (ca. 80,000 yr B.P. [Fletcher et al. 2005])are found on the nearshore and coastal plainregions of the study area and greater wind-ward O‘ahu.
Holocene accretion is a subject of consid-erable research. Grigg (1998) showed thathigh wave stress in Hawai‘i has generally lim-ited large regional Holocene reef accretion to
64 PACIFIC SCIENCE . January 2009
sheltered embayments, such as Kane‘ohe andHanauma Bay. Grossman and Fletcher (2004)showed that in addition to the regional ef-fects of shoreline orientation relative to oceanswell, Holocene reef accretion is controlledby the more spatially and temporally specificinteractions of sea level history, antecedenttopography, and wave energy. They showedthat Holocene accretion tends to occur attopographic depressions on the reef whereshelter from wave energy increases accommo-dation space above or below wave base on thefore reef slope. Grossman et al. (2006) pre-sented high-resolution subbottom seismic re-flection data correlated with drill cores thatshow a distinct erosional boundary markingthe beginning of Holocene reef frameworkgrowth. From this they confirmed Holocenereef accretion to be a complex and patchyunit emplaced during the period of 8,000 to3,000 yr B.P. Rooney et al. (2004) demon-strated that Holocene accretion in regionsexposed to north swell largely terminatedca. 5,000 yr B.P. They hypothesized that thisis related to increased storminess associatedwith enhanced El Nino–Southern Oscillationdynamics in the middle Holocene.
Much of the sediment in the study area isstored within relic erosional depressions ofpre-Holocene age incised during low sea levelstands. Once reinundated, these depressionsprovide accommodation space and shelterfrom wave energy for reef accretion (Gross-man and Fletcher 2004, Grossman et al.2006). This accretion could potentially re-duce available space for sediment storage onthe reef (Conger et al. 2005).
General Sediment Characteristics
Moberly and Chamberlain (1964) character-ized Kailua Bay, Lanikai, and WaimanaloBay as having very poorly sorted highly cal-careous beach sands and large but thinpatches of offshore sediments. Kailua andLanikai sediments are described as poorlysorted, with Kailua tending toward bimo-dality (two dominant size classes). Waima-nalo sediments are described as coarse- tomedium-grained and vary from well sortedto poorly sorted with high Foraminifera frac-
tions. Landward of Kailua and Waimanalobeaches are modern vegetated dunes andolder lithified eolianites, consisting of coarsewell-sorted sand, in which Foraminifera con-stitute the highest compositional fraction.
Sediment Production
Harney et al. (2000) analyzed sediment com-position collected from beach, channel, andreef-top sand bodies in Kailua Bay. Harneydetermined that >90% of sediments werebiogenic carbonate, dominated by coralline(red) algal fragments. Framework sediments(coral and coralline algae) are produced off-shore, and direct sediment production (Hali-meda, mollusks, and benthic Foraminifera)occurred largely nearshore. Radiometric dat-ing shows most surficial sediments to bemiddle to late Holocene in age, suggestingrelatively long storage times and weak short-term sediment production. Harney et al.(2000) concluded that sand stored in KailuaBay represents production under a higher sealevel stand (þ2 m [Grossman and Fletcher1998]) that retreated during the late Holo-cene.
Grossman and Fletcher (2004) speculatedthat a middle Holocene shift in sediment pro-duction occurred, caused by movement of thezone of most prolific coral growth from theshallow reef flat to the deeper fore reef. Sed-iment produced on the fore reef is more like-ly to move into deeper water, where it is lostto the littoral sediment system. This raisesthe possibility that sediment stored in manyreef-top sediment bodies is a remnant of amore productive sediment system that hasbeen preserved by karst and channel depres-sions.
Previous Sediment Investigations
Moberly et al. (1975) completed the first in-tensive survey of offshore sand resourcesaround O‘ahu. Spatial extents of offshoresand fields were roughly mapped by aerialsurveys. Major sand bodies from 0 to 18 mdepth were mapped for the Kailua and Wai-manalo areas; however the survey of deeper
Reef-Top Sediment Bodies: O‘ahu, Hawai‘i . Bochicchio et al. 65
sand bodies (18–90 m depth) excluded thisstudy region.
Ocean Innovators, Inc. (1978, unpubl. re-port prepared for U.S. Army Engineer PacificOcean Divison; 1979, unpubl. report pre-pared for Hawai‘i Marine Affairs Coordi-nator, Office of the Governor, State ofHawai‘i, Order No. 163) completed a jetprobe survey of the deep (10–20 m depth)Kailua channel and an adjacent sedimentbody for the U.S. Army Corps of Engineersin 1978. Minimum volumes estimated for thedeep channel were 3;700� 103 m3, and for anadjacent sand body, 208� 103 m3.
Harney and Fletcher (2003) estimated to-tal sediment volume in Kailua Bay from 0 to40 m of water to be 5;425G 289� 103 m3
and 16;749G 1;809� 103 m3 in the coastalplain deposited during a 5,000 yr þ2 m sealevel high stand (Kraft 1982, 1984, Athensand Ward 1991, Fletcher and Jones 1996,Grossman and Fletcher 1998). Hamptonet al. (2004) mapped sediment thicknessnear the seaward mouth (20–35 m depth) ofthe Kailua channel using a tunable, swept-frequency (0.6–3 kHz) acoustic profiler (seeBarry et al. 1997 and Sea Engineering, Inc.1993, Beach nourishment viability study, un-publ. report prepared for the Office of StatePlanning, Coastal Zone Management Pro-gram, Honolulu, Hawai‘i) supplemented byanalysis of sediment recovered from 14 vibra-cores in 1997 and 13 vibracores in 2000. Thetotal volume calculated for the reef-front de-posit is 53;000� 103 m3.
Beach face profile data collected by Nor-cross et al. (2002) gives a volume for Kailuabeach of 600G 30� 103 m3. No volumeanalysis in Lanikai or Waimanalo Bay hasever been reported; this study is the first toprovide submarine thickness data for thesetwo regions.
materials and methods
A total of 54 sand bodies was selected tobe representative in terms of size, morphol-ogy, and location on the reef. Selection alsoincluded bodies that could potentially be con-venient source locations for beach replenish-
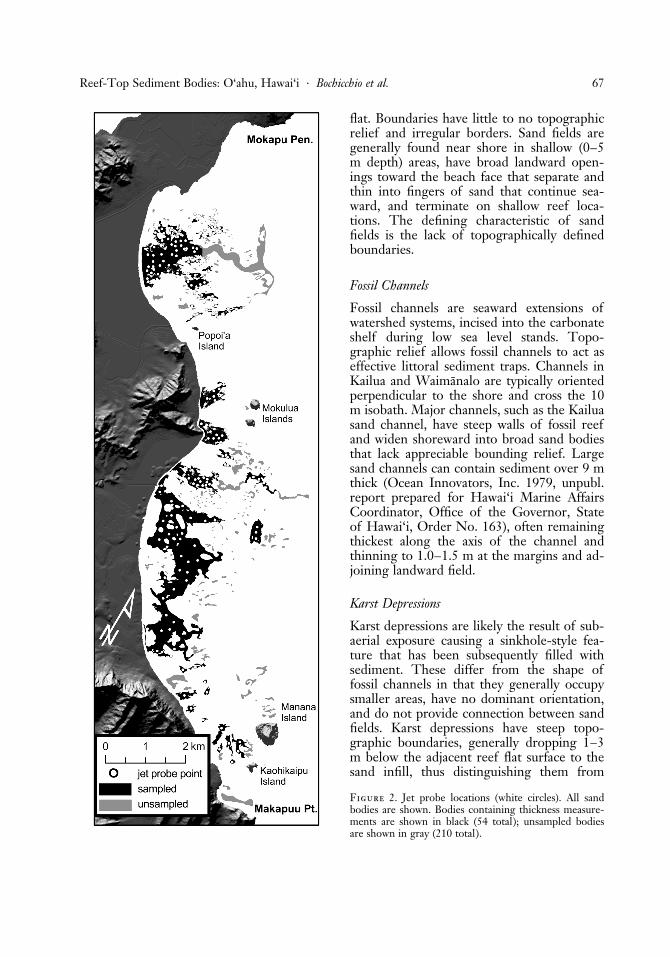
ment. Boundaries of all 54 sand bodies weredelineated using high-resolution (2.4 m)Quick Bird imagery, recent aerial photogra-phy, LIDAR bathymetry, NOAA benthichabitat maps (Coyne et al. 2003), sand classi-fication maps produced by Conger (2005),mapping and benthic zonation from Harneyand Fletcher (2003), as well as field observa-tions (Figure 2). All sand bodies were classi-fied by a morphology scheme adapted fromConger (2005) (described in the next section).Sampling with a jet probe provided a total of205 measurements of sediment thickness.Thickness interpolation of point data wasaccomplished using Kriging and Voronoimethods. Volume estimates calculated fromsampled fields were used to approximate vol-ume in adjacent fields of similar morphology.
Sand Body Morphology
Following the work of Conger (2005), a gen-eralized classification for sand bodies hasbeen created for this study. This classificationwas applied to all 54 sand bodies sampled, 210not sampled, and two previously sampled (thedeeper portions of the Kailua channel). Sandbodies are classified as one of three morphol-ogies (Conger 2005): (1) sand field, (2) fossilchannel, or (3) karst depression. Variance intopographic relief, sediment thickness, andshape were used as distinguishing factors toclassify sand bodies. Segregating sand bodiesin this manner adds a morphology compo-nent to the process of interpolating measuredthicknesses, thereby increasing confidence inthe relationship of volume estimates to sedi-ment body distribution.
In addition to field observations, slopemaps generated from LIDAR bathymetrywere used to evaluate topographic relief be-tween the adjacent reef flat and surface ofthe sand body. Table 1 summarizes sandbody morphology classifications and location.
Sand Fields
Sand fields are defined here as areas of con-tinuous sand cover deposited over a broadtopographic depression in the fringing reef
66 PACIFIC SCIENCE . January 2009
flat. Boundaries have little to no topographicrelief and irregular borders. Sand fields aregenerally found near shore in shallow (0–5m depth) areas, have broad landward open-ings toward the beach face that separate andthin into fingers of sand that continue sea-ward, and terminate on shallow reef loca-tions. The defining characteristic of sandfields is the lack of topographically definedboundaries.
Fossil Channels
Fossil channels are seaward extensions ofwatershed systems, incised into the carbonateshelf during low sea level stands. Topo-graphic relief allows fossil channels to act aseffective littoral sediment traps. Channels inKailua and Waimanalo are typically orientedperpendicular to the shore and cross the 10m isobath. Major channels, such as the Kailuasand channel, have steep walls of fossil reefand widen shoreward into broad sand bodiesthat lack appreciable bounding relief. Largesand channels can contain sediment over 9 mthick (Ocean Innovators, Inc. 1979, unpubl.report prepared for Hawai‘i Marine AffairsCoordinator, Office of the Governor, Stateof Hawai‘i, Order No. 163), often remainingthickest along the axis of the channel andthinning to 1.0–1.5 m at the margins and ad-joining landward field.
Karst Depressions
Karst depressions are likely the result of sub-aerial exposure causing a sinkhole-style fea-ture that has been subsequently filled withsediment. These differ from the shape offossil channels in that they generally occupysmaller areas, have no dominant orientation,and do not provide connection between sandfields. Karst depressions have steep topo-graphic boundaries, generally dropping 1–3m below the adjacent reef flat surface to thesand infill, thus distinguishing them from
Figure 2. Jet probe locations (white circles). All sandbodies are shown. Bodies containing thickness measure-ments are shown in black (54 total); unsampled bodiesare shown in gray (210 total).
Reef-Top Sediment Bodies: O‘ahu, Hawai‘i . Bochicchio et al. 67

sand fields. The measured surface area of allsand bodies is summarized in Table 2.
Thickness Measurements
Sediment thickness measurements were ob-tained with a jet probe deployed from a smallboat and operated by a researcher usingSCUBA. The jet probe is built from a small-diameter pipe connected to a shipboard waterpump via fire hose. High-pressure water ispumped out of the pipe to displace sedimentas the diver pushes it into sandy substrate. Avolume of sediment is washed out of thehole by water pressure (called ‘‘outwash’’)affording observations of buried sedimenttexture, composition, and color. The probe
stops penetrating when it contacts a boundarywith bedrock or an impenetrable layer ofconsolidated sediment. Depth of penetrationprovides a measure of unconsolidated sedi-ment thickness. The probe length is 3.0 m;if sand body thickness exceeds 3.0 m, a valueof 3.1 m is recorded. Only 8% of thicknessmeasurements exceeded the 3.0 m length ofthe probe. These sand bodies could be con-siderably thicker and contain more volumethan reported here, so all thickness interpola-tion exceeding 3.0 m are labeled as þ3.0 mand should be considered a minimum esti-mate.
At each sample location three thicknessmeasurements were taken within a 20 m ra-dius of the anchored boat and the average
TABLE 1
Number of Sand Bodies Organized by Morphology (Columns) and Region (Rows)
Region Fossil Channel Karst Depression Sand Field Total
Kailua Bay Directa 7 26 0 102Indirectb 2 67 0
Lanikai Direct 1 3 4 88Indirect 2 77 1
Waimanalo Bay Direct 0 5 8 74Indirect 1 51 9
Total Direct 8 34 12 264Indirect 5 195 10Combined 13 229 22
a Volume calculation made from thickness measurements.b Volume estimated from known values at adjacent sediment bodies.
TABLE 2
Measured Sand Body Surface Area Presented as Morphology Class (Column) and Region (Row)
Fossil Channel Karst Depression Sand Field TotalRegion (�103 m2) (�103 m2) (�103 m2) (�103 m2)
Kailua Bay Directa 8,939 290 0 9,433Indirectb 8 196 0
Lanikai Direct 88 177 754 1,364Indirect 117 223 5
Waimanalo Bay Direct 0 2,986 235 3,697Indirect 85 234 157
Total (m2) Direct 9,027 3,453 989 14,493Indirect 209 652 163Combined 9,236 4,105 1,152
a Volume calculation made from thickness measurements.b Volume estimated from known values at adjacent sediment bodies.
68 PACIFIC SCIENCE . January 2009

thickness recorded for that site. Variation(one standard deviation) between the threemeasurements is <0.1 m for 75% and <0.5m for 95% of the sample sites. Variation inthe remaining 5% of sample sites showedranges of 0.7 to 1.2 m, indicating low consis-tency. Variability in the 0.7–1.2 m range isthe result of unconsolidated sediment overly-ing partially consolidated layers of predomi-nately coral, shell, and Halimeda that theprobe intermittently penetrates. Thicknessof the overlying unconsolidated sediment lay-er was determined by observing sharp con-trasts in jet probe resistance and outwashsediment type. At these sites only the uncon-solidated thickness is used in volume calcula-tions.
Sample Locations
Water depth at sample locations was recordedfrom a hull-mounted fathometer at an accu-racy of G0.5 m. Water depth at sampled sed-iment bodies varied from 1.5 to 16.8 m, withan average of 5.2 m. General sediment char-acteristics were noted at each site. The probewas completely removed and inserted multi-ple times with each measurement to ensurerepeatable results. All sample locations werepredetermined by examining aerial photosand bathymetry in conjunction with NOAAbenthic habitat maps (Coyne et al. 2003) andprevious substrate studies in the region (SeaEngineering, Inc. 1993, Beach nourishmentviability study, unpubl. report prepared forthe Office of State Planning, Coastal ZoneManagement Program, Honolulu, Hawai‘i;Conger 2005). Survey points were locatedwith a global positioning system (GPS) re-ceiver at an accuracy of G5 m. Once an-chored, drift of the boat was adjusted tomatch sample location so that a diver coulduse the boat as a reference point for sampling.
Volume Calculations
Estimates of sand volume were obtained foreach sediment body by using one of twomethodologies: (1) Kriging (Burrough 1986)or (2) Voronoi (Webster and Oliver 2001)with a volume correction factor. The selec-
tion of either methodology was based on thespatial density of available thickness measure-ments as well as the size and complexity ofthe given sand body. In instances of gooddata coverage Kriging was used. Voronoi wasused for sand bodies with sparse coverage,where a single measurement must be repre-sentative of a large area, because it does notrequire high data density. Of the 54 sandbodies analyzed, Kriging was applied to ninebodies, and Voronoi was applied to the re-maining 45 bodies.
kriging method. Kriging is a more stat-ically robust method of estimation than theVoronoi method and is used whenever datadensity is suitable (Burrough 1986). Bounda-ries of sand bodies are assumed to be zerothickness and were represented by points ofzero thickness generated at 1 m spacingaround each sand body. Modeling the varia-tion between measurement points and theedges was accomplished with a semivariogramgenerated with ArcGIS. A semivariogrammodel quantifies the relationship betweenvariability of a native data set and spatial loca-tion as an equation for a line. The equationfor each semivariogram model is used tomodel the rate of change between pointswhere thickness is known, in this case at thejet probe thickness measurements and edges(Webster and Oliver 2001). A separate vario-gram equation was produced for each sandbody so that the thickness model would be in-dividualized to the unique variability of eachbody. A spherical semivariogram model wasused in all cases. Points of zero thicknessalong the edge were included when produc-ing a semivariogram. Rasterized thickness es-timation maps were gridded at a resolution of1 m and volume calculated.
voronoi method. The Voronoi method(Webster and Oliver 2001) assumes that sandthickness is perfectly uniform extending tothe edge of the sand body. Perimeters ofeach sand body and thickness measurementswere mapped and entered into ArcGIS. AnArcGIS Voronoi function was used to subseteach sand body into a series of smaller ad-joining polygons or subpolygons; each sub-polygon formed around a single thicknessmeasurement. The Voronoi function draws
Reef-Top Sediment Bodies: O‘ahu, Hawai‘i . Bochicchio et al. 69

subpolygon boundaries so that any locationwithin a given subpolygon is closer to itsassociated measurement point than to themeasurement point of any other subpolygon(Webster and Oliver 2001).
Sediment thickness within each subpoly-gon is assumed to be the same as the thick-ness measurement it contains. Volume ofsediment is calculated for each subpolygon asthe product of the area and thickness. Thevolumes for all subpolygons within a singlesand body are summed to calculate a totalsediment volume for the entire sand field.
Voronoi Volume Correction
A major source of uncertainty with the Voro-noi model is the assumption that the walls of
reef-top depressions are at right angles to thebase of the depression. A transect of thick-ness measurements (transect A–A0 in Figure3) from Kailua Bay suggests that sand bodiesare thickest in the center and gradually thintoward the edges.
Given the high range of variability in sandbody thickness, failing to account for sandbody morphology likely produces an over-estimate of sand volume. Correction of over-estimated sand volumes is accomplished bycalculating an empirically derived reductionfactor. Reduction factors are calculated as theaverage percentage difference between Krig-ing and Voronoi estimations performed onthe same set of sand bodies. Results fromcomparative volume estimations of 10 sandbodies are segregated by sand body morphol-ogy and averaged so as to calculate reductionfactors that are morphology-specific to eachclass. Of the 10 bodies used, four were classi-fied as sand fields, and the remaining six wereclassified as karst depressions.
The reduction factor calculated for sandfields is 88%G 8% (i.e., Voronoi estima-tions are reduced by 88%G 8%), whereas64%G 23% is used for karst and channelmorphologies. These reduction factors causedramatic decreases when applied to theVoronoi-based volume estimates but providea more informed and realistic estimate.
Prediction Uncertainty
Measurement uncertainties are G5 cm verti-cal uncertainty associated with jet probe mea-surement andG5 m of horizontal uncertaintyassociated with accuracy of the GPS receiver.Mean measurement variation of sample siteswithin each sand body is used to quantify thedegree of natural variability in thickness.These uncertainties are taken into accountduring the Kriging process as a nugget vari-able (Burrough 1986) and thus are propa-gated through the interpolation process as apixel-by-pixel error value. Therefore, everymap of estimated volume created via Krigingalso has a map of the pixel-by-pixel estima-tion uncertainty in meters of thickness. Areasdefined for volume estimations are used with
Figure 3. Top: Aerial photo of seafloor with jet probe lo-cations. Transect A–A0 correlates to graph below. Bottom:Cross section showing sand thickness along profile A–A0,illustrating sand thickness variability. See Figure 4 for lo-cation.
70 PACIFIC SCIENCE . January 2009

error maps to calculate the error in volumeestimation for each area.
Percentage difference between estimatedvolume and estimated error was calculatedfor each sand body. These percentage differ-ences were averaged simultaneously with val-ues used for calculating the reduction factors,resulting in the uncertainty values reportedfor Voronoi estimates.
Indirect Estimation of Sediment Bodies
Volume-to-area ratios and errors were calcu-lated for the 54 measured sand bodies andapplied to 210 adjacent unsampled bodiesof similar morphology and size. Volumes forunsampled bodies were determined by mul-tiplying the sand body area by a volume-to-area ratio assumed from adjacent sand bodiesof similar morphology and depth on the reef.Errors were propagated into unsampledbodies in a similar manner. The estimatedvolume of each unsampled body was multi-plied by an error volume-to-area ratio deter-mined by averaging error volume-to-arearatio values of the adjacent representativesediment bodies.
results
This study calculated volumes for 54 majorsediment bodies from direct measurements
of thickness. Volume was also calculated for210 unmeasured bodies using volume-to-area ratios from adjacent measured bodies ofthe same morphology class, referred to hereas ‘‘indirect’’ measurements. The landwardmouth of the Kailua channel was measuredin this study, but two previous measurements,the deeper channelized section (Ocean Inno-vators, Inc. 1979, unpubl. report prepared forHawai‘i Marine Affairs Coordinator, Officeof the Governor, State of Hawai‘i, OrderNo. 163) and seaward mouth (Hampton et al.2004), are used for a complete volume of thefeature. Combined submarine sediment vol-umes are summarized by morphology in Ta-ble 3 and by specific sand body formation inTable 4. Note that volume-to-area ratios donot approximate thickness of the sand bodyat any given point because a majority of thesand body will be either thicker or thinnerthan the ratio. The volume-to-area ratio pro-vides an indication of the concentration ofthe deposit and thus partly gauges the useful-ness of the body as source material for beachreplenishment. A more detailed presentationof the data is published in a technical reportprepared for the U.S. Army Corps of Engi-neers (Bochicchio et al. 2006). ArcGIS shape-files containing the individual results for sandbodies are available online via the Uni-veristy of Hawai‘i—Coastal Geology Website (http://www.soest.hawaii.edu/coasts/data/oahu/sandbodies.html).
TABLE 3
Sediment Volume Organized by Morphology
Area Volume Volume/Area Ratio TotalMorphology (�103 m2) (�103 m3) (meanG 1s) (�103 m3)
Karst Directa 3,453 1;150G 206 0:31G 0:22 1;332G 248Indirectb 652 182G 42 0:30G 0:12
Channels Direct 9,027 58;179G 601 0:47G 0:39 58;252G 618Indirect 209 74G 17 0:36G 0:12
Fields Direct 989 150G 5 0:10G 0:07 171G 6Indirect 163 21G 2 0:13G 0:00
Total (m2) Direct 13,469 59;479G 813 0:29G 0:23 59;756G 873Indirect 1,024 277G 60 0:26G 0:08Combined 14,493 59;756G 873 0:28G 0:15
a Volume calculation made from thickness measurements.b Volume estimated from known values at adjacent sediment bodies.
Reef-Top Sediment Bodies: O‘ahu, Hawai‘i . Bochicchio et al. 71

Fossil Channels
Including all unsampled and previously sam-pled bodies, 13 were classified as fossil chan-nels. The large Kailua sand channel (Figure4) is the dominant channel feature in thestudy area. We divided the channel into threesections: (1) Kailua channel mouth (land-ward), 0–10 m depth; (2) Kailua channel,10–20 m depth; and (3) Kailua channelmouth (seaward), 20–35 m depth. Previousvolume studies on the deep channel (OceanInnovators, Inc. 1979, unpubl. report pre-pared for Hawai‘i Marine Affairs Coordi-nator, Office of the Governor, State ofHawai‘i, Order No. 163; Hampton et al.2004) have shown the sediment to be thicker
than the maximum probing depth of ourequipment (3 m). For this reason, the deepchannel and seaward channel mouth werenot probed in this study. The preexisting vol-ume measurements used for the deep channelare listed as the Kailua Channel and KailuaChannel Mouth (seaward) in Table 4. Insouthern Kailua, a group of smaller channelsegments form the fragmented remnants of achannel closed by reef growth. Another intactchannel exists in northern Waimanalo.
Including all unsampled and previouslysampled bodies, fossil channels contain58;253G 618� 103 m3 of sediment andcover an area of 9;236� 103 m2. The averagevolume-to-surface area ratio is 2.33 m3/m2,with 1 standard deviation (SD) of 3.9 m3/m2,
TABLE 4
Summary of Submarine Sediment Volumes Calculated from Thickness Measurements (Direct) and Inferred fromNeighboring Data (Indirect); Organized by Region
Volume Area Volume/Area Ratio Total VolumeSubmarine Storage (�103 m3) (�103 m2) (meanG 1s) na (�103 m3)
N. Kailua Karst Direct 19G 4 72 0:26G 0:21 16 36G 8Indirect 17G 4 56 0:29G 0:21 31
Kailua ChannelMouth (landward)
Direct 1;436G 406 1,169 1:23G 0:00 1 1;436G 406Indirect — — — —
Kailua Channelb Direct 3;700G 185 300 12:34G 0:00 1 3;700G 185Indirect — — — —
Kailua ChannelMouth (seaward)c
Direct 53,000 7,400 7:16G 0:00 1 53,000Indirect — — — —
S. Kailua Channel Karst Direct 152G 15 288 0:39G 0:26 16 201G 27Indirect 50G 11 144 0:40G 0:14 38
Lanikai Sand Fields Direct 130G 3 754 0:13G 0:09 4 131G 3:15Indirect 0:70G 0:06 5 0:13G 0:00 1
Lanikai Channeland Karst
Direct 67G 15 265 0:17G 0:12 4 172G 39Indirect 105G 24 431 0:26G 0:06 117
Waimanalo Karst Basin Direct 911G 171 2,871 0:32G 0:00 1 911G 171Indirect — — — —
S. Waimanalo Fieldand Karst
Direct 64G 12 350 0:20G 0:21 12 168G 33Indirect 104G 21 384 0:26G 0:08 23
Total Direct 59;479G 813 13,469 2:47G 0:10d 56 59;755G 873Indirect 277G 60 1,024 0:27G 0:10 210Combined 59;755G 873 14,493 1:68G 0:10 266
Note: Each region is subdivided into groups of sand bodies by ‘‘direct’’ and ‘‘indirect’’ results. ‘‘Direct’’ refers to volume estimatesbased on thickness measurements from this or other studies. ‘‘Indirect’’ refers to volume estimates extrapolated from measurements ofsimilar adjacent sampled bodies. Mean and standard deviation of volume/area ratios refer to their respective subdivided sand bodygroups.
a n, Number of sand bodies used in each row calculation.b Ocean Innovators Inc. (1979).c Hampton et al. (2004).d Column total is an average, not a sum.
72 PACIFIC SCIENCE . January 2009

the highest ratio in the study area. If thedeeper Kailua Channel and Kailua ChannelMouth (offshore) portions are excluded, thevolume-to-surface area ratio drops to 0.47m3/m2 (SD 0.39 m3/m2). Thickness measure-ments collected for this study in fossil chan-nels had a mean of 1.1 m with 1 standarddeviation of 0.9 m and ranged from 0 toover 3.0 m.
Defining a specific morphology for theKailua Channel Mouth (landward) is difficultbecause the channel widens landward, losesdistinct boundaries, and transitions into anapparent sand field–type morphology with
indistinct topographic boundaries. However,a linear trace of high thickness seen in Figure4 continues landward through the sand fieldalong the central axis of the channel. Thisindicates that the shoreward portion of thechannel has been filled and overtopped bysand, producing a sand body that qualifies asboth a channel and a field. For the purposeof estimating sand volume the Kailua sandchannel is considered a member of the chan-nel morphology class.
Sand deposits in fossil channels tend tobe consistently thick and yellow to white incolor. Surface sediments in these channels
Figure 4. Kailua Bay sand body thickness. Bathymetry contours in �5 m intervals. Kailua 1: volume ¼ 103,000 m3,area ¼ 125,000 m2, volume/area ratio ¼ 0.82 m3/m2. Dashed box and solid line indicate extent of Figure 3.
Reef-Top Sediment Bodies: O‘ahu, Hawai‘i . Bochicchio et al. 73

appear medium- to coarse-grained; howeversubsurface sampling in the Kailua channelhas shown significant fine-grained sediment(U.S. Army Engineer District 1978).
Sand Fields
Including all unsampled bodies, 24 sandbodies were classified as sand fields. Sandfields are estimated to contain 171G 6� 103
m3 of sediment and cover an area of about1;152� 103 m2. The average volume-to-surface area ratio is 0.10 m3/m2 SD 0.07 m3/m2, the lowest ratio in the study area.
Sediment bodies have a mean thickness of0.96 m with 1 standard deviation of 0.86 m.The largest sand fields in the study area areconnected to the shoreline in the vicinity ofWailea Point, visible near the upper portionof Figure 5. Thickness measurements acrossthese fields generally range from 0.2 to 0.8m; measurements within zones of high thick-ness range 1.7–>3.0 m. Sediments are fineto medium sand with a mixture of sandy andgravelly substrata. Nearshore sand fields aregenerally connected to the adjacent beach,where they potentially function as sedimentstorage and source locales participating involume fluctuations on the beach.
Karst Depressions
Including unsampled bodies, 229 bodies wereclassified as karst depressions. Thirty-foursand bodies are classified as karst depressions.Karst depressions are estimated to contain1;332G 6� 103 m3 of sediment in an areaof 4;105� 103 m2. The average volume-to-surface area ratio is 0.31 m3/m2 SD 0.22 m3/m2, the midrange ratio in the study area.Measurements in karst bodies are generallythick with a mean measurement of 0.87 m, 1standard deviation of 0.73 m. Thick and thinkarst bodies show little spatial grouping.
Sediments in karst depressions areobserved to contain one or both of two char-acteristic strata: (1) medium to coarse light-colored sand, and (2) coral gravel of varioussizes between 5 cm fragments and hand-sizedbranches of coral. Sediment bodies in karstdepressions consist of either 1.0–2.0 m thick
deposits of sand, 0.5–1.0 m sand overlayingcoral rubble, or an absence of sand with coralrubble outcropping on the surface. Coral rub-ble deposits were not included in thicknessand volume calculations. Sand bodies withoutcoral rubble tend to lie directly on fossilizedreef platform.
An expansive system of interconnected,sand-filled karst depressions dominates thetopography of the central-South Waimanaloarea (Figure 5). This feature, referred to asthe Waimanalo Karst Basin in Table 4, re-sembles a sandy lagoon that runs parallel toshore between a fringing reef and outcrop-ping back reef in 4–7 m of water. Sedimentthickness is greatest in two isolated semi-circular areas. Thickness measurements nearthe edge of this feature are <0.5 m. Twoareas show a progressive thickening towardthe interior of the feature, forming semicir-cular ‘‘bull’s-eye’’ thickness patterns increas-ing to >3.0 m thick near the center. Thelack of any linear zones of thickness excludethis feature from consideration as a channelfeature.
discussion
New data acquired in this study provide, forthe first time, a regional volume estimate tobe made for the Kailua-Waimanalo region.Conger (2005) showed that a majority ofsand body surficial coverage is in <10 m ofwater depth. Volume data can be used to testwhether this relationship holds true for thevolume as well. Figure 6 divides total vol-ume by depth zones; 0–10 m, 10–20 m, and20–>30 m. Because the Kailua channel is sin-gularly responsible for contributing a major-ity of the sediment volume in the deeper twozones, a second set of bars in Figure 6 dis-plays total volume minus contribution fromthe Kailua channel. The Kailua channel rep-resents an increasingly large faction of sedi-ment storage at greater depths. If the Kailuachannel is included, the deepest zone containsmore sediment than the shallower two zones.If the channel is excluded as an unusuallythick outlier, Conger’s relationship holds,with most of the sediment residing in theshallow 0–10 m zone.
74 PACIFIC SCIENCE . January 2009

Figure 5. Sand thickness, Lanikai and North Waimanalo. Bathymetry contours in �5 m intervals. Waimanalo1: volume ¼ 174,000 m3, area ¼ 241,000 m2, volume/area ratio ¼ 0.72 m3/m2. Waimanalo 2: volume ¼ 243,000 m3,area ¼ 221,000 m2, volume/area ratio ¼ 1.10 m3/m2.

Comparison with Previous Volume Estimates
This study updates volume data for sandbodies previously sampled by Harney andFletcher (2003). Volume predictions made forHarney’s sediment budget were based on 14
jet probe measurements. More detailed jetprobing presented in this paper increased theestimated volume for the shallow Kailua chan-nel mouth (landward) section from 475G29� 103 m3 to 1;436G 406� 103 m3. Thischange likely results from a more detailed
Figure 6. Volume of sediment by depth zone. Dark bar shows all sediment. Light bar excludes the Kailua channel.
TABLE 5
Comparison of Kailua Volume Predictions Made in This Study and by Harney (2004)
This Study Harney (2004)
Area Volume Area VolumeFeature (�103 m2) (�103 m3) (�103 m2) (�103 m3)
North Kailua Karst 128 35G 8 132 242G 15Kailua Channel Mouth (landward) 1,169 1;436G 406 1,000 475G 29South Kailua Channel Karst Complex 432 201G 22 295 1;007G 60Total 1,730 1;672G 437 1,427 1;724G 104
Note: Addition of a larger data set significantly increases the volume predication for the Kailua channel mouth, suggesting abroader subsurface channelized zone than previously assumed.
76 PACIFIC SCIENCE . January 2009
subsurface delineation of the thick channelaxis within the nearshore mouth. Table 5compares results of this study calculated aspart of Harney’s sediment budget.
Norcross et al. (2002) estimated the vol-ume of sediment stored in Kailua beach tobe 600G 30� 103 m3 of sediment. The do-main for beach volume data in Norcross etal. was the berm crest to 40–80 m offshore;this study calculated volume 65–80 m fromshoreline. Predictions for sediment volumein the shallow sand bodies of Kailua Bay areestimated here to be 1;672G 437� 103 m3,over 1;000� 103 m3 greater than the totalvolume predicted for Kailua Beach by Nor-cross et al. (2002). The large volume of sandresiding offshore indicates that the subaerialbeach is not the primary storage site forcarbonate sediment, and a majority of thesediment storage exists in the nearshore sub-marine region.
Combining the total submarine volume es-timates made in this study (3;055G 688� 103
m3) with previous estimates of the deep Kai-lua channel (56;700G 185� 103 m3), esti-mated volume of Kailua beach (600G 30�103 m3), and estimated volume of the Kailuacoastal plain (16;749G 1;809� 103 m3) givesa total system storage of 77;104G 2;712�103 m3. This estimate does not include thecurrently undetermined volumes of subaerialsediment in Lanikai and Waimanalo.
Four sites of notable sediment volume areidentified as reasonably compact and accessi-ble sources of beach sand that could warrantfurther investigation as beach sand sources. InKailua Bay, the most voluminous source ofisolated sand is the largest karst depression la-beled Kailua 1 on Figure 4. The WaimanaloKarst Basin contains two zones of high thick-ness that warrant attention; they are labeledWaimanalo 1 and 2 in Figure 5. Lanikai con-tains a large deposit directly off Wailea Pointthat could potentially be used for nourish-ment. However, proximity to the shorelineand previous studies (Noda and Associates,Inc. 1989, Lipp 1995) suggest that the sedi-ment not be moved out of the Lanikai littoralzone because it potentially exchanges sedi-ment with adjacent beaches. However, this
study has only provided a reconnaissance ofthese sites and a more focused study must becompleted before they can be considered formining.
Geologic Controls on Sediment Distribution
Our results indicate that a majority of theshallow reef-top sediment storage occurs indepressions likely eroded during periodicsubaerial exposures of fossilized reefal lime-stone. Therefore, the potential for modernsediment storage is, to some degree, a func-tion of pre-Holocene erosion (increasingstorage space) and post-Holocene reef accre-tion infilling of eroded features (reducingstorage space). Controls on post-Holoceneaccretion in Hawai‘i have been thoroughlystudied (Grigg 1998, Grossman and Fletcher2004, Rooney et al. 2004, Grossman et al.2006). To better understand sand body distri-butions, we speculate as to factors controllingthe pre-Holocene karst and fluvial erosionthat formed the reef-top depressions.
To date, only one study has examinedO‘ahu reef-top sediment distribution in con-text of reef morphology and wave energy.Conger (2005) correlated regional variationsin sand bodies (number, shape, and size) withregional geomorphic settings (deep versuswide reef ) and wave climate (high, medium,or low energy). Conger concluded that dis-tribution of reef-top sediment is strongly in-fluenced by large-scale reef geomorphologyand, to a lesser extent, wave energy, with thehighest sand cover being ‘‘wide low-energyreef’’ and the lowest being ‘‘narrow high-energy.’’
In this study we can suggest two addi-tional environmental controls on sedimentdistribution: (1) availability of freshwaterdrainage, and (2) topographic slope of thereef.
Our observations imply that proximity toan onshore watershed is a major control ondepression formation and consequently off-shore sand storage. Figure 7 shows the studyarea with sediment bodies and stream outletsidentified. Black dashed lines in Figure 7 de-lineate the Lanikai offshore region with a
Reef-Top Sediment Bodies: O‘ahu, Hawai‘i . Bochicchio et al. 77

conspicuous lack of sand bodies. The lack ofsand bodies correlates with the presence ofthe Ka‘iwa Ridge, which divides Kailua andWaimanalo watersheds. Diversion of surfacerunoff would have created an arid region ofthe reef associated with the onshore inter-fluve where exposure to meteoric waters wasreduced or less concentrated. Reduced mete-oric water on the reef would lead to reducedkarst and fluvial erosion in the region, result-ing in reduced sediment storage.
Extending this effect seaward, consider therelative convex offshore shape of the Lanikaireef, which would have acted as a seaward ex-tension of the Lanikai headland by divertingwater to the north and south at times of sub-aerial exposure. These combined effects canin part account for the dearth of sedimentstorage in the Lanikai region.
A majority of the karst depression com-plexes occur in areas with a relatively lowslope or ‘‘reef platforms.’’ Comparison ofprofiles AB and CD on Figures 8 and 9 showscentral Kailua Bay to have a reef platformthat is not present in northern Kailua Bay(feature 1). Similarly, karst complexes are lim-ited to reef platforms in Lanikai (profile GH;feature 6) and Waimanalo (profile IJ; features11, 12, 13, and 14). The occurrence of these‘‘platform karst’’ complexes suggests thatplatforms are more susceptible to karstifica-tion than areas with higher slope. There isone low-slope platform that lacks any karsti-fied features (profile EF; ‘‘vacant platform’’).This platform illustrates the aforemen-tioned effect of the Lanikai ‘‘arid’’ reef zone.Though a reef platform is present, it is possi-ble that a lack of freshwater runoff has pre-
Figure 7. Shaded relief topography and bathymetry.Sand bodies are shown in black on seafloor. Bathymetrycontours are in �5 m intervals. Streams are shown aslines over topography. Stream outlet location is repre-sented by white arrows on shoreline. Ka‘iwa Ridge(labeled) divides the Kailua and Waimanalo valley water-sheds, approximated by ‘‘Valley’’ and ‘‘Ridge’’ bar onright of figure. Dashed black lines illustrate diversion ofmeteoric waters by the ridge, creating two different typesof karst topography on the reef: arid (minimal karst) ad-jacent to the ridge, and humid (extensive karst) adjacentto the valley.
78 PACIFIC SCIENCE . January 2009

vented karstification on this reef surface andthus reduced its sediment storage potential.
Karst complexes on high-slope reef areasare visible in two locations: the seaward por-
tion of the feature labeled ‘‘Lanikai highslope karst’’ (profile GH; seaward portion offeature 6) and the feature labeled ‘‘Deep highslope karst’’ in northern Waimanalo (profileGH; feature 8). It is likely that adjacent Mo-kulua and Waimanalo streams contributed tothe creation of the high-slope karst depres-sions.
In Lanikai, the sand field directly offshoreof Wailea Point is thicker than adjacent sandfields to the north and south (Figure 5). Thiscould be the result of Mokulua Stream pass-ing through this sand field and either incisinga channel or leaching a cave system with acollapsed roof, thus creating the high-slopekarst depressions in feature 6, and possiblyconverging with the Lanikai channel (feature7). The elongated shape of the larger karstdepressions in feature 6 suggests that theymight be channel fragments. Modern reef inthe vicinity of feature 6 has accreted unusu-ally high (<1 m water depth), further sug-gesting that feature 6 has been closed byHolocene accretion. It is feasible that theMokulua Islands to the north of feature 6have shielded the area from strong northernswell, allowing more reef accretion.
Similarly, in Waimanalo, the deep high-slope karst complex (feature 8) could be theresult of enhanced freshwater flow from Wai-manalo Stream. Upslope from the high-slopecomplex is a linear extension of the Waima-nalo Karst Basin (feature 11) that resembles atruncated channel (feature 10). Freshwaterflowing from Waimanalo Stream couldhave incised a partial channel (feature 10) be-fore percolating through the reef, eventuallycreating the large karst depressions (feature8).
Though strictly circumstantial, these ob-servations imply that the distribution of sedi-ment storage is controlled to some degree byvariation in the onshore supply of meteoricwaters and the slope of the fringing reef.Another factor to consider is the enhancedorographic effect during periods of loweredsea level, which could increase the amountof freshwater available to drive the karstifica-tion process (Gavenda 1992, Fletcher et al.2005).
Figure 8. Shaded relief topography and bathymetry.Sand bodies are shown in black on seafloor. Bathymetrycontours are in 5 m intervals. Streams are shown as whitelines over topography. Sand body features (some de-lineated with black dashed lines) are labeled with num-bers corresponding to the index on right side andreferred to in the text. Profile lines correlate with graphin Figure 9.
Reef-Top Sediment Bodies: O‘ahu, Hawai‘i . Bochicchio et al. 79

acknowledgments
We thank the U.S. Army Corps. of Engi-neers, U.S. Geological Survey, and the Ha-wai‘i Department of Land and NaturalResources for providing funding for this proj-ect.
Literature Cited
Athens, J. S., and J. V. Ward. 1991. Paleo-environmental and archaeological investi-gations, Kawainui Marsh flood control
project, Oahu Island, Hawaii. Interna-tional Archaeological Research Institute,Inc., Honolulu, Hawai‘i. Prepared forU.S. Army Engineering Division, PacificOcean. Contract No. DACW83-90-C-0050. Available at University of Hawai‘iLibrary, Honolulu.
Barry, J., S. Schock, and M. Ericksen. 1997.A new broad band frequency modulatedsubbottom profiling developed for Hawaii.Pages 120–128 in Proceedings, 7th AnnualInternational Offshore and Polar Engi-neering Conference, Honolulu, Hawai‘i.
Figure 9. Bathymetric profiles corresponding to lines indicated in Figure 8. Gray boxes show location on profileof adjacent sand body features referred to in text and Figure 8. Lines are displayed in different thickness to enhancevisibility. Vertical exaggeration ¼ 50.
80 PACIFIC SCIENCE . January 2009

International Society of Offshore and Po-lar Engineers, Golden, Colorado.
Bochicchio, C., C. Fletcher, and T. Smith.2006. A reconnaissance of reef top sedi-ment bodies in windward Oahu, Hawaii.Southeast Oahu regional sediment man-agement demonstrations project: Regionalmanagement plan. Report prepared byU.S. Army Corps of Engineers PacificOcean Division, Honolulu, Hawai‘i, andHawai‘i Department of Land and NaturalResources, Honolulu. Available from U.S.Army Corps of Engineers.
Bodge, K., and S. Sullivan. 1999. Hawaii pilotbeach restoration project: Coastal engi-neering investigation. Report prepared forState of Hawai‘i Department of Land andNatural Resources, Honolulu. Availablefrom Department of Land and NaturalResources.
Burrough, P. 1986. Principles of geographi-cal information systems for land resourcesassessment. Oxford University Press, NewYork.
Casciano, F., and R. Palmer. 1969. Potentialof offshore sand as an exploitable resourcein Hawaii. University of Hawaii Sea GrantProgram, no. 69-4.
Conger, C. 2005. Identification and charac-terization of sand deposit distribution onOahu fringing reefs. Hawai‘i Geology andGeophysics, University of Hawai‘i, Hono-lulu.
Conger, C., C. Fletcher, and M. Barbee.2005. Artificial neural network classifica-tion of sand in all visible submarine andsubaerial regions of a digital image. J.Coastal Res. 21:1173–1177.
Coulbourn, W. T., J. F. Campbell, and R.Moberly. 1974. Hawaiian submarine ter-races, canyons, and quaternary historyevaluated by seismic-reflection profiling.Mar. Geol. (17): 215–234.
Coyne, M., T. Battista, M. Anderson, J.Waddell, W. Smith, P. Jokiel, M. Kendall,and M. Monaco. 2003. Benthic habitatsof the main Hawaiian Islands. NOAATech. Memo. NOS NCCOS CCMA 152.URL: http://biogeo.nos.noaa.gov/projects/mapping/pacific.
Fletcher, C. H., E. Grossman, B. M. Rich-
mond, and A. Gibbs. 2002. Atlas of naturalhazards on the Hawaiian coasts. U.S. Geo-logical Survey, Geologic Investigations Se-ries I-2761. Denver, Colorado.
Fletcher, C. H., and A. T. Jones. 1996. Sea-level highstand recorded in Holoceneshoreline deposits on Oahu. J. Sediment.Res. 66:623–641.
Fletcher, C. H., C. Murray-Wallace, C.Glenn, B. Popp, and C. E. Sherman.2005. Age and origin of Late QuaternaryEolinanite, Kaiehu Point (Moomomi),Hawaii. J. Coastal Res. SI 42:92–112.
Gavenda, R. T. 1992. Hawaiian Quaternarypaleoenvironments: A review of geologi-cal, pedological, and botanical evidence.Pac. Sci. 46:295–307.
Grigg, R. W. 1998. Holocene coral reef ac-cretion in Hawaii: A function of wave ex-posure and sea level history. Coral Reefs17:263–272.
Grossman, E. E., P. H. Barnhardt, B. M.Richmand, and M. Field. 2006. Shelf stra-tigraphy and the influence of antecedentsubstrate on Holocene reef development,south Oahu, Hawaii. Mar. Geol. 226:97–114.
Grossman, E., and C. Fletcher. 1998. Sealevel higher than present 3500 years agoon the northern main Hawaiian Islands.Geology 26:363–366.
———. 2004. Holocene reef developmentwhere wave energy reduces accommoda-tion space. Kailua Bay, Windward Oahu,Hawaii, USA. J. Sediment. Res. 74:49–63.
Hampton, M. A., C. T. Blay, and C. Murray.2004. Carbonate sediment deposits on thereef front around Oahu, Hawaii. Mar.Georesourc. Geotechnol. 22:65–102.
Harney, J. 2004. Carbonate sedimentology ofa windward shoreface: Kailua Bay, O‘ahu,Hawaiian Islands. Ph.D. diss., Universityof Hawai‘i at Manoa, Honolulu.
Harney, J. N., and C. H. Fletcher. 2003. Abudget of carbonate framework and sedi-ment production, Kailua Bay, Oahu, Ha-waii. J. Sediment. Res. 73:856–868.
Harney, J. N., E. C. Grossman, B. R. Rich-mond, and C. H. Fletcher. 2000. Age andcomposition of carbonate shoreface sedi-
Reef-Top Sediment Bodies: O‘ahu, Hawai‘i . Bochicchio et al. 81
ments, Kailua Bay, Oahu, Hawaii. CoralReefs 19:141–154.
Kraft, J. 1982. Terrigenous and carbonateclastic facies in a transgressive sequenceover volcanic terrain. Am. Assoc. Pet.Geol. Bull. 66:589.
———. 1984. Local relative sea level changesand the evolution of coastal environments,windward Oahu, Hawaii. IGCP Proj. No.061. Sea-Level 5:5–6.
Lipp, D. 1995. Changes in beach profiles dueto wave reflections off seawalls at Lanikai,Hawaii. M.S. thesis, University of Hawai‘iat Manoa, Honolulu.
Moberly, R., J. Campbell, and W. Coul-bourn. 1975. Offshore and other sandresources for Oahu, Hawaii. UNIHI-SEAGRANT-TR-75-03, University ofHawai‘i, Honolulu.
Moberly, R., Jr, and T. Chamberlain. 1964.Hawaiian beach systems. Hawai‘i Instituteof Geophysics Report 64-2, University ofHawaii, Honolulu.
Noda and Associates, Inc. 1989. Hawaiishoreline erosion management study. Vol.1. Prepared for Hawaii Coastal Zone Man-agement Program, Office of State Plan-ning, Honolulu. Available at University ofHawai‘i Library, Honolulu.
Norcross, Z. M., C. H. Fletcher, and M.Merrifield. 2002. Annual and interannualchanges on a reef-fringed pocket beach:Kailua Bay, Hawaii. Mar. Geol. 190:553–580.
Purdy, E. G. 1974. Reef configurations:Cause and effect. Pages 9–76 in L. Laporteand F. Tusla, eds. Reefs in time and space:Selected examples from the recent and an-cient. Society of Economic Paleontologistsand Mineralogists Special Publication No.18.
Rooney, J., C. Fletcher, E. Grossman, M.Engels, and M. Field. 2004. El Nino influ-ence on Holocene reef accretion in Ha-wai‘i. Pac. Sci. 58:305–324.
Sherman, C. E., C. H. Fletcher, and K. H.Rubin. 1999. Marine and meteoric diagen-esis of Pleistocene carbonates from a near-shore submarine terrace, Oahu, Hawaii. J.Sediment. Res. 69 (5): 1083–1097.
U.S. Army Engineer District. 1978. Detailedproject report and final environmentalstatement, Kailua Beach Park erosion con-trol, Kailua, O‘ahu, Hawai‘i. Available atUniversity of Hawai‘i Library, Honolulu.
Webster, R., and M. Oliver. 2001. Geostatis-tics for environmental scientists. Statisticsin practice. Wiley & Sons, West Sussex.
82 PACIFIC SCIENCE . January 2009