ree mineral dissolution cape cod
TRANSCRIPT
7/30/2019 REE mineral dissolution Cape Cod
http://slidepdf.com/reader/full/ree-mineral-dissolution-cape-cod 1/18
doi:10.1016/j.gca.2003.08.015
Mineral dissolution in the Cape Cod aquifer, Massachusetts, USA: I. Reaction
stoichiometry and impact of accessory feldspar and glauconite on strontium
isotopes, solute concentrations, and REY distribution
MICHAEL BAU,1,2,*,† BRIAN ALEXANDER,1,† JOHN T. CHESLEY,3 PETER DULSKI,4 and SUSAN L. BRANTLEY1
1Department of Geosciences, The Pennsylvania State University, University Park, Pennsylvania 16802 USA2Penn State Astrobiology Research Center, The Pennsylvania State University, University Park, Pennsylvania 16802 USA
3Department of Geological Sciences, The University of Arizona, Tucson, Arizona 85721 USA4GeoForschungsZentrum Potsdam, Telegrafenberg, D-14473 Potsdam, Germany
( Received July 19, 2002; accepted in revised form August 8, 2003)
Abstract—To compare relative reaction rates of mineral dissolution in a mineralogically simple groundwateraquifer, we studied the controls on solute concentrations, Sr isotopes, and rare earth element and yttrium(REY) systematics in the Cape Cod aquifer. This aquifer comprises mostly carbonate-free Pleistocenesediments that are about 90% quartz with minor K-feldspar, plagioclase, glauconite, and Fe-oxides. Silicaconcentrations and pH in the groundwater increase systematically with increasing depth, while Sr isotopic
ratios decrease. No clear relationship between87
Sr/ 86
Sr and Sr concentration is observed. At all depths, the87Sr/ 86Sr ratio of the groundwater is considerably lower than the Sr isotopic ratio of the bulk sediment or itsK-feldspar component, but similar to that of a plagioclase-rich accessory separate obtained from the sediment.The Si-87Sr/ 86Sr-depth relationships are consistent with dissolution of accessory plagioclase. In addition,solutes such as Sr, Ca, and particularly K show concentration spikes superimposed on their respective generaltrends. The K-Sr-87Sr/ 86Sr systematics suggests that accessory glauconite is another major solute source toCape Cod groundwater. Although the authigenic glauconite in the Cape Cod sediment is rich in Rb, it is lowin in-grown radiogenic 87Sr because of its young Pleistocene age. The low 87Sr/ 86Sr ratios are consistent withequilibration of glauconite with seawater. The impact of glauconite is inferred to vary due to its variableabundance in the sediments. In the Cape Cod groundwater, the variation of REY concentrations with samplingdepth resembles that of K and Rb, but differs from that of Ca and Sr. Shale-normalized REY patterns are lightREY depleted, show negative Ce anomalies and super-chondritic Y/Ho ratios, but no Eu anomalies. REYinput from feldspar, therefore, is insignificant compared to input from a K-Rb-bearing phase, inferred to beglauconite. These results emphasize that interpretation of groundwater chemistry, even in relatively simpleaquifers, may be complicated by solute contributions from “exotic” accessory minerals such as glauconite. To
detect such peculiarities, groundwater studies should combine the study of elemental concentration andisotopic composition of several solutes that show different geochemical behavior. Copyright © 2004 Elsevier Ltd
1. INTRODUCTION
Radiogenic isotope ratios, particularly those of Sr, have been
used to determine groundwater flow paths, weathering rates,
mixing relationships, groundwater ages, and other aspects of
water-rock interaction (e.g., Aberg et al., 1989; Blum et al.,
1993; Miller et al., 1993; Bullen et al., 1996; Bullen et al.,
1997; Clow et al., 1997; Johnson and DePaolo, 1997; Johnson
et al., 2000; Probst et al., 2000; Aubert et al., 2001; Millot et al.,
2002, and references therein). In groundwater studies, Sr iso-
topic data are often preferred over Sr concentration data. Stron-tium concentrations are controlled by Sr input via dissolution,
desorption or ion exchange, and Sr loss resulting from precip-
itation and sorption. In contrast, Sr isotopic ratios are only
affected by Sr input, because there is no fractionation of 87Sr
from 86Sr during Sr removal processes. Hence, the 87Sr/ 86Sr
ratio of groundwater largely reflects that of the minerals from
which the Sr originates. Since 87Sr forms by radioactive decay
of 87Rb, the 87Sr/ 86Sr ratio of Rb-bearing minerals in a rock,
sediment or soil increases with time at a rate that depends on
the initial 87Rb/ 86Sr ratio. Strontium released from different
minerals during weathering is, therefore, characterized by a
mineral-specific isotopic composition. Early studies often re-
lated the 87Sr/ 86Sr ratio in groundwaters (and river waters) to
silicate-weathering (e.g., Blum et al., 1993) with emphasis on
biotite or feldspar weathering. Recent investigations have high-
lighted Sr contributions from (accessory) carbonates (e.g.,Clow et al., 1997; Quade et al., 1997; Blum et al., 1998;
English et al., 2000; Jacobson and Blum, 2000).
Over the recent years, rare earth element (REE) studies or
combined rare earth yttrium (REY) studies of groundwater
have similarly gained momentum (e.g., Johannesson and Hen-
dry, 2000, and references therein). However, most studies are
qualitative except for recent work such as the utilization of
anthropogenic Gd anomalies in REE patterns as a hydrochemi-
cal tracer (Moller et al., 2000). Extending REY groundwater
studies to include Nd isotopes is promising (e.g., Moller et al.,
1998; Tricca et al., 1999; Negrel et al., 2000; Aubert et al.,
2001), but compared to Nd isotopic data for hydrothermal
* Address reprint requests to Michael Bau, Geosciences and Astro-physics, International University Bremen, P.O. Box 750561, D-28725Bremen, Germany ([email protected]).† present address: Geosciences and Astrophysics, International Univer-sity Bremen, P.O. Box 750561, D-28725 Bremen, Germany
Pergamon
Geochimica et Cosmochimica Acta, Vol. 68, No. 6, pp. 1199–1216, 2004Copyright © 2004 Elsevier Ltd
Printed in the USA. All rights reserved0016-7037/04 $30.00 ϩ .00
1199
7/30/2019 REE mineral dissolution Cape Cod
http://slidepdf.com/reader/full/ree-mineral-dissolution-cape-cod 2/18
fluids, such data are rare. Hence, little is known about which
minerals are the main source of REY in groundwater and about
the relative importance of input mechanisms, such as desorp-
tion, mineral dissolution, and ion exchange. The trivalent REY
show coherent behavior during geochemical processes due to
their identical valencies and the systematic decrease of ionic
radii with increasing atomic number, leading to predictable
fractionation trends. Radius-dependent fractionation of light
from heavy REE (LREE and HREE, respectively) may occurduring incorporation into crystal lattices and during sorption.
Fractionation of the only redox-sensitive REY, Ce and Eu,
from the non-redox sensitive REY may result from the forma-
tion of Ce(IV) or Eu(II) compounds, and solution- and surface-
complexation may cause fractionation of Y from Ho, and of La,
Gd and possibly Lu from their respective neighbors in the REY
series. In contrast to “conservative” Sr, the REY are particle-
reactive and their residence times in groundwater, like those in
seawater, should be considerably shorter than that of Sr. This
suggests that the information gleaned from the REY may
complement information from Sr.
Here, we report results of a study of the controls on solute
concentrations and on the isotopic composition of Sr in ground-
water from a shallow aquifer with unconsolidated, glaciogenic
Pleistocene sediment on the Cape Cod peninsula, Mass., USA.
Such unconsolidated glacial aquifers are widespread and of
great importance, because water supplies for many metropoli-
tan areas are derived from such aquifers. In addition, the
groundwater flow, the groundwater chemistry, and also the
sediment mineralogy at Cape Cod have been thoroughly and
extensively investigated (e.g., Barber, 1985; LeBlanc et al.,
1991; Barber et al., 1992; Coston et al., 1995; Masterson et al.,
1996; DeSimone et al., 1997; Savoie and LeBlanc, 1998; Yau,
1999, Shapiro et al., 1999; and references therein). This site
represents a relatively simple aquifer –a best case aquifer
wherein analysis of mineral dissolution was anticipated to be
unequivocal and where the hydrology was well-understood.
Specifically, it was anticipated that, since the aquifer is sand
and gravel consisting of 95% (wt.) quartz and feldspar (Barber
et al., 1992; Coston et al., 1995), and less than 1% silt and clay
and less than 0.1% organic carbon (Barber et al., 1992), disso-
lution reactions could be easily interpreted.
However, we will show that interpretation of mineral reac-
tions is only possible using a combination of major and trace
elements and Sr isotopes. We show for the Cape Cod aquiferthat dissolution of accessory plagioclase controls Si release and
exerts an important control on 87Sr/ 86Sr while dissolution of
K-feldspar is insignificant. This simple picture is complicated,
however, by the additional release of Sr and K (and other
solutes) via Si-conservative alteration of authigenic glauconite
that occurs as an accessory component in the sediment. Glau-
conite dissolution particularly impacts groundwater composi-
tion in the shallow part of the aquifer. However, this Sr input is
only apparent in solute concentrations, but is not observed in
the Sr isotopic data, presumably because the Sr released from
glauconite is isotopically similar to the plagioclase Sr. The
REY distribution in Cape Cod groundwater suggests that the
REY are derived from glauconite or other accessory minerals
and that feldspar dissolution is insignificant for the REY budget
and does not affect the REY patterns of this groundwater. The
complicated path of release in this simple aquifer points to the
fact that interpretation of water-rock interaction must rely on
multiple geochemical tracers to elucidate mineral reactivity.
2. STUDY SITE AND METHODS
2.1. Study Site
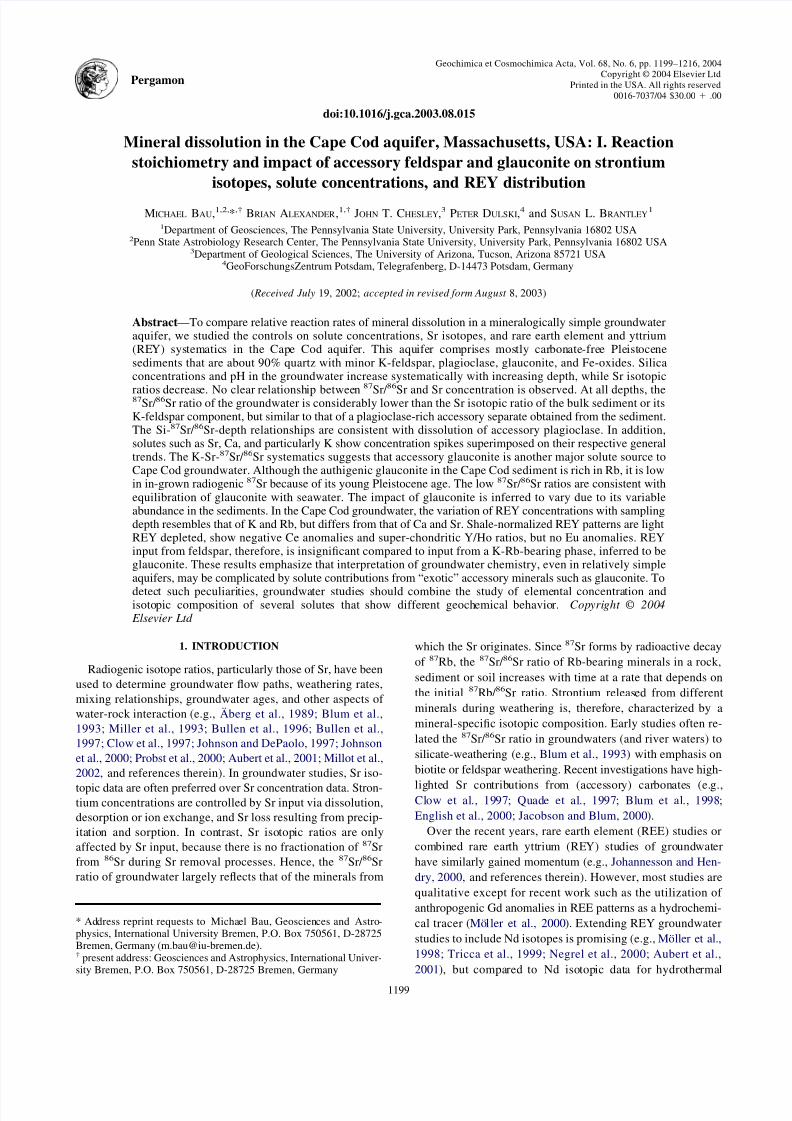
The study site is located in the Ashumet Valley, northeastern Fal-mouth, Cape Cod, Massachusetts, USA (Fig. 1). Operations at Cape
Cod’s Massachusetts Military Reservation (MMR) resulted in severecontamination of the groundwater via infiltration beds into the under-
lying aquifer from the MMR towards Vineyard Sound. To determine
Fig. 1. Location of study area and cross-section of Cape Cod aquifer showing sediment type, contaminant plume, and anapproximate transect of MLS wells sampled for this study (modified after LeBlanc, 1984).
1200 M. Bau et al.

7/30/2019 REE mineral dissolution Cape Cod
http://slidepdf.com/reader/full/ree-mineral-dissolution-cape-cod 3/18
the nature and extent of the contaminant plume, the United States
Geological Survey (USGS) installed 315 observation wells and 31multi-level sampling wells (Savoie and LeBlanc, 1998). Hence, thispart of the Cape Cod aquifer has become one of the best-described
aquifers in the world.
2.2. Water Samples
Forty-six groundwater samples were collected on June 5th
and 6th
,1997, from eight multilevel sampling (MLS) wells installed by the
USGS (using hollow-stem-auger drilling and allowing natural c ollapseof the aquifer material around 1.25-inch diameter PVC casing, Savoieand LeBlanc, 1998). Each MLS well consists of 15 polyethylene tubes
(0.25-inch outer diameter) that extend from the land surface into theaquifer material through holes drilled in the well casing at various
depths. The open bottom end of each polyethylene tube (the samplingport) is screened with nylon fabric.
The eight MLS wells (262, 508, 373, 168, 442, 471, 472, 350) were
chosen because they form a ϳ900 m long transect (Fig. 1) that roughlyparallels the groundwater flow path. Based on published information
about specific conductance and concentrations of MBAS (methyleneblue active substance) and boron (LeBlanc, 1984; Thurman et al., 1986;Savoie and LeBlanc, 1998), we designed our sampling strategy to
ensure that our samples originate from above the contaminant plume.
This was later tested and verified by data for specific conductance andboron concentration in our groundwater samples (Appendix 1), that are
well below the high values typical of the plume. Due to the almosthorizontal groundwater flow (e.g., LeBlanc et al., 1991) the age of the
groundwater increases with sampling depth. This has recently beenre-confirmed by 3H-3He dating (Shapiro et al., 1999), indicating that inwell #350, for example, the groundwater age above the contaminant
plume increases downward over a vertical distance of ϳ12 m from 0.6
Ϯ 0.7 yrs close to the surface of the water table to 14.8 Ϯ 0.6 yrs. The
average interstitial velocity of the groundwater flow within the plumeis as high as 126 m yr-1 due to the point-source recharge from theinfiltration beds (Shapiro et al., 1999). Without this additional recharge,
the velocity above the plume (where our samples derive) is consider-ably slower and probably similar to the 20 to 90 m yr-1 flow ratedetermined for a nearby site with similar sediment that receives uni-
form areal recharge (Solomon et al., 1995).Samples were extracted from the wells with a GeoPump2 peristaltic
suction pump connected directly to polyethylene tubes with Norprenetubing. A minimum of three tubing volumes were withdrawn (ϳ 1.5 L)before sample collection. A 0.45 m filter was connected to the tubing
and acid-cleaned sample bottles were filled after rinsing twice. Samplesfor cation analyses were acidified in the lab with 1 mL concentrated
ultrapure nitric acid/100 mL sample.Alkalinity was measured in the field during sample collection, using
a Hach digital titrator model 16900. Anion concentrations (NO3- , SO4
2-,
and Cl-) were determined with a Dionex DX-100 ion-chromatograph.Groundwater samples were analyzed for Na, K, Ca, Mg, Si, Al, Fe,
and Mn using a Leeman Labs PS3000UV inductively coupled plasma
spectrophotometer (ICP-AES) in the Materials Characterization Labo-ratory (MCL) at Penn State. Boron analyses were conducted at the
MCL using a Finnigan Element 1 High Resolution Magnetic SectorICP-MS. Strontium concentrations were determined with a TurnerScientific quadrupole TS-Sola ICP-MS at University of Arizona. For
six samples from well #373, Rb, Sr, Y, Ba, and U concentrations weremeasured with a Perkin-Elmer Elan 5000 ICP-MS at GFZ Potsdam,
Germany. Concentrations of Y and REE in these samples were alsodetermined by ICP-MS at GFZ Potsdam, Germany, but required aseparation and preconcentration procedure (for methodical details in-
cluding precision and accuracy see Bau and Dulski (1996)). The REYdistribution patterns are presented normalized to C1-chondrite (sub-script ‘CN’, chondrite from Anders and Grevesse (1989)) or post-
Archean Australian Shale, PAAS (subscript ‘SN’, PAAS from McLen-nan (1989)). REY data for Cape Cod groundwater has also been
normalized to bulk aquifer sediment. In all REY patterns, Y is insertedbetween Dy and Ho according to its ionic radius. Normalized Ce andEu anomalies are quantified as CeN /Ce*
Nϭ CeN /(0.5LaNϩ 0.5PrN) and
EuN /Eu*N ϭ EuN /(0.5SmN ϩ 0.5GdN), respectively.
Strontium isotopic ratios of groundwater samples and of solutions
from sequential leaching of aquifer sediment were analyzed at Univer-
sity of Arizona with a Fisons Sector 54 multi-collector thermal ioniza-
tion mass spectrometer (TIMS) in multi dynamic mode. All isotopiccomposition and concentration measurements were determined on
spiked aliquots of sample using a 99.9% 84Sr spike. Leachates andwaters were spiked and allowed to equilibrate for 24 h. Mineralseparates were spiked and dissolved in HFϩHNO3 for 24 h, then dried
in a HEPA-filtered environment. The sample was then dissolved in 6mol/L HCl for 24 h, dried, and redissolved in 8 mol/L HNO3. Sr was
separated utilizing Sr Spec resin (Eichrome Industries). Samples wereloaded on tantalum filaments with Ta gel to enhance ionization (R. A.Creaser, private communication). Analyses of NBS-987 performed
during the study yielded a reproducibility of 0.710251 Ϯ 0.000004 (n
ϭ 4). The 87Sr/ 88Sr ratio is corrected for fractionation using an 88Sr/ 86Sr ratio of 0.1194.
2.3. Sediment SamplesThe Cape Cod aquifer sediments have been meticulously investi-
gated by many authors in the past (e.g., Barber, 1985; Barber et al.,
1992; Coston et al., 1995; DeSimone et al., 1997) and hence, we did notre-do this extensive analysis.
The Cape Cod aquifer consists of boulders, gravel, sand, silt, andclay deposited during the retreat of Pleistocene ice sheets (Oldale,1969). Sediments were deposited as moraines, basal till, and pro-glacial
lake deposits. The sediment within the study area is stratified glacialoutwash consisting primarily of unconsolidated medium-coarse sandwith some gravel and underlain by fine sand and silt (Barber, 1985;
Coston et al., 1995; Masterson et al., 1996). Median grain size (byweight) is approximately 0.5 mm, silt-sized and clay-sized particles
comprise less than 1 wt.% of the sediment, and sedimentary organiccarbon represents Ͻ0.1 wt.% (Barber et al., 1992). Quartz dominates(90 –95 wt.%) the Ͻ1 mm fraction, while feldspar represents ϳ5%
(wt.) of the Ͻ1mm size fraction (Coston et al., 1995). Plagioclasepredominates the feldspar fraction (Barber, 1985) and DeSimone et al.
(1997) report a plagioclase/K-feldspar weight ratio of 1.5 for the sandand silt-sized fraction of the aquifer sediment.
For this study several mineral separates were prepared for major and
trace element and isotope analysis (Fig. 2). The aquifer sedimentsamples were collected with a wireline piston coring device by theUSGS in 1988 from the uncontaminated part of the aquifer at a depth
of 13 m above mean sea level, and were frozen for storage. Thesampling site was 2 m east of of row 12 indicated in Figure 2 of Kent
et al. (1994). Sampling location lies between Ashumet pond and theOtis air base sewage infiltration beds. Thawed samples were air-driedin a laminar flow hood and sieved with a 1 mm polyethylene screen
(bulk sediment sample, 1 in Table 1).From 50 g of the Ͻ1 mm fraction, three subfractions were separated
by heavy liquid separation using bromoform and acetone: a quartz
Fig. 2. Flow chart diagram illustrating relationships between bulk aquifer sample and mineral separates obtained from it.
1201Mineral dissolution in the Cape Cod aquifer
7/30/2019 REE mineral dissolution Cape Cod
http://slidepdf.com/reader/full/ree-mineral-dissolution-cape-cod 4/18
fraction (not discussed further), a “K-feldspar separate” (2 in Table 1),
and an “accessories separate” fraction (3 in Table 1). Major element
concentrations were determined on these fractions using X-ray fluo-rescence (XRF, Table 1) and individual mineral grains from separates
were studied in polished grain mounts using a Cameca SX-50 electronmicroprobe. Trace element concentrations in mineral separates andbulk sediment were determined by ICP-MS at GFZ Potsdam, Germany,
following decomposition in HFϩHClO4 and HCl in pressure vessels(precision and accuracy are considerably better than Ϯ10%; for details
see Dulski (1994)).Sequential leaching (following the approach of Tessier et al. (1979))
was conducted on the Ͻ1 mm fraction of the aquifer sediment (bulk
sediment, Table 1) to determine the isotopic composition of the “ex-changeable” Sr, the “carbonate” Sr, and the “Fe-Mn oxide-bound” Sr.
Here, “exchangeable” Sr was leached from the aquifer sediment usinga 1 mol/L sodium acetate (NaOAc) solution of pH 8.86 at roomtemperature. After agitating the sediment and NaOAc for 1 h, the
sample was centrifuged for 30 min at 4200 rpm and the supernatant was
decanted. Between each successive extraction deionized water wasadded to the sample and the sediment was centrifuged for 30 min (4200
rpm), after which this supernatant was discarded. The “carbonateextraction” was performed with 1 mol/L NaOAc titrated to a pH of 5.01
with acetic acid (HOAc). The sediment was agitated for 3 h at roomtemperature, and a supernatant was collected following the procedurefor the exchangeable fraction. Strontium bound to Fe-Mn oxides was
leached from the sediment with 0.04 mol/L hydroxylamine hydrochlo-ride in 25% (v/v) acetic acid. This extraction was performed at ϳ96oC
with occasional agitation for four hours, and the supernatant wascollected as above. Note that the terms “exchangeable” and “carbonate”are used following Tessier et al. (1979) and do not necessarily imply
that only exchangeable and carbonate bound elements were dissolved.
3. RESULTS
3.1. Groundwater
Considering that groundwater flow in the Ashumet Valley is
almost horizontal and that it is dif ficult to assess accurate flow
lines, we attempted in earlier work (Yau, 1999) to calculate
flow lines and determine changes in Si concentration along
flow paths based upon different assumptions and using a larger
dataset of wells. For all flow paths, slight increases in Si
concentration were observed. However, hydraulic conductivity
in the aquifer ranges over one order of magnitude (LeBlanc et
al., 1991) and the horizontal/vertical conductivity ratio varies
between 2 and 5 (Masterson et al., 1996) due to lenses and
layers of coarse grained sediment. Hence, actual groundwater
pathways in the upper part of the Cape Cod aquifer we sampled
show relatively wide small-scale variability. Therefore, inac-
curacy in designation of flow path and lack of concentration
data for all of the wells lead us to follow mineral reaction
utilizing a different approach. Shapiro et al. (1999) used tritium
ages to document that the age of groundwater increases with
depth in the Cape Cod aquifer. The change in concentration as
a function of age (or time in the subsurface) is therefore best
assessed by analyzing change in concentration as a function of
depth. Thus, we combined data for all samples from all wells
and calculated 3-point moving averages to quantify variation of
solute concentrations with depth (Fig. 3). “Depth” in this paperrefers to the depth relative to average sea level (ASL).
Solute concentrations reported here are similar to values
reported by the USGS (Savoie and LeBlanc, 1998) for the same
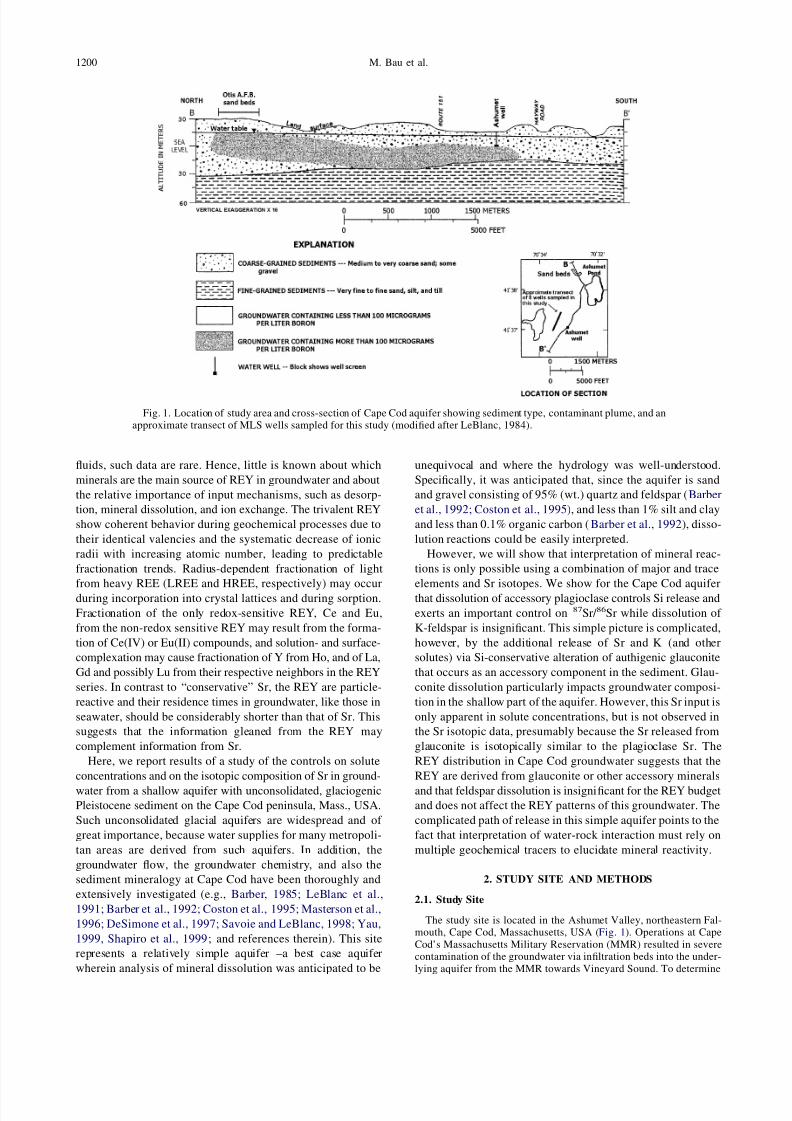
wells and generally increase with depth. For example, Si con-
centrations increase with depth from 95.4 to 182 M (Fig. 4a).
Concentrations of Na, K, Ca, and Sr also increase with depth
(Figs. 3 and 4). For most solutes (with the notable exception of
Si and to some extent Na) the increase of concentration with
depth is more pronounced in the shallow than the deeper part of
the aquifer (Fig. 4). A spike of Sr, Ca, and K concentration
(Figs. 3 and 4) is particularly noticeable at ca. ϩ3 m depth; this
spike does not show up in the Si and Na profiles (Figs. 3 and
4). The size of this spike varies between individual wells.
However, concentration data for groundwater sampled by the
USGS in December 1994 at the same ports from the same wells
show similar trends including the ϩ3 m spike (Savoie and
LeBlanc, 1998).
We emphasize that because of the near horizontal ground-
water flow, a decreasing solute concentration with increasing
depth does not necessarily indicate loss of that solute (due to
precipitation or sorption, for example) but rather indicates flow
paths with variable sources of that cation.
Sr concentrations correlate positively with K concentrations
(Fig. 5) and this trend is somewhat clearer in the shallow than
in the deeper part of the aquifer. Ca/Sr molar ratios increase
with depth (Fig. 4c).
Table 1. XRF analyses (wt%) of bulk aquifer sediment and selected
mineral separates (analyses performed by XRAL Laboratories, AnnArbor, MI).
Bulk sediment(1)
“K-feldspar”separate (2)
“Accessories”separate (3)
SiO2 95.5 72.7 59.7
Al2O3 1.90 14.3 18.4CaO 0.06 0.09 1.37MgO Ͻ0.01 Ͻ0.01 1.74
Na2O 0.26 2.47 2.14K2O 0.61 8.42 2.60Fe2O3 0.62 0.43 9.60
MnO Ͻ0.01 0.01 0.14TiO2 0.11 0.06 0.89P2O5 0.02 0.04 0.18
LOI 0.38 0.55 3.23
XRF ϭ X-ray fluorescenceFig. 3. Graphs of dissolved solute concentrations vs. depth for
groundwater from Cape Cod. The trend lines are 3-point moving
averages of groundwater concentrations determined from 46 samplesfrom 8 wells (Appendix 2); “depth” is depth relative to average sea
level (ASL). Note systematic increase of [Si] and concentration spikes
of Sr, K, Mg, and Ca, at about ϩ3 m depth.
1202 M. Bau et al.
7/30/2019 REE mineral dissolution Cape Cod
http://slidepdf.com/reader/full/ree-mineral-dissolution-cape-cod 5/18
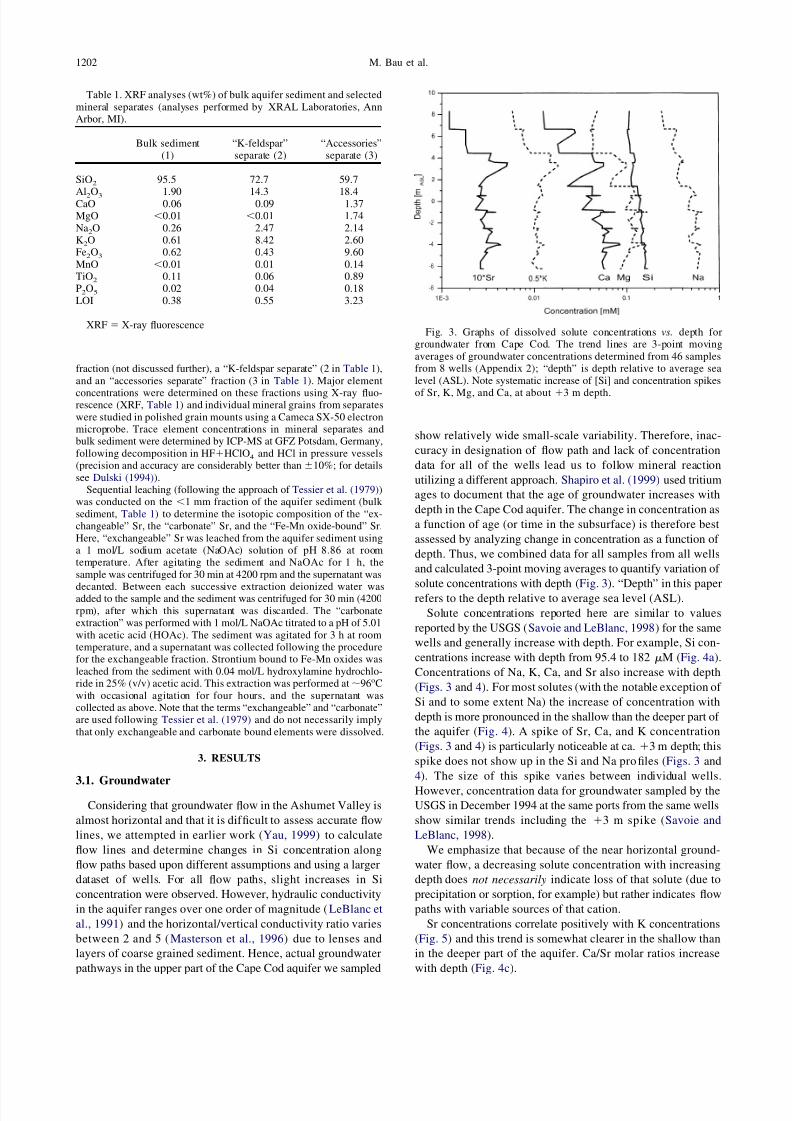
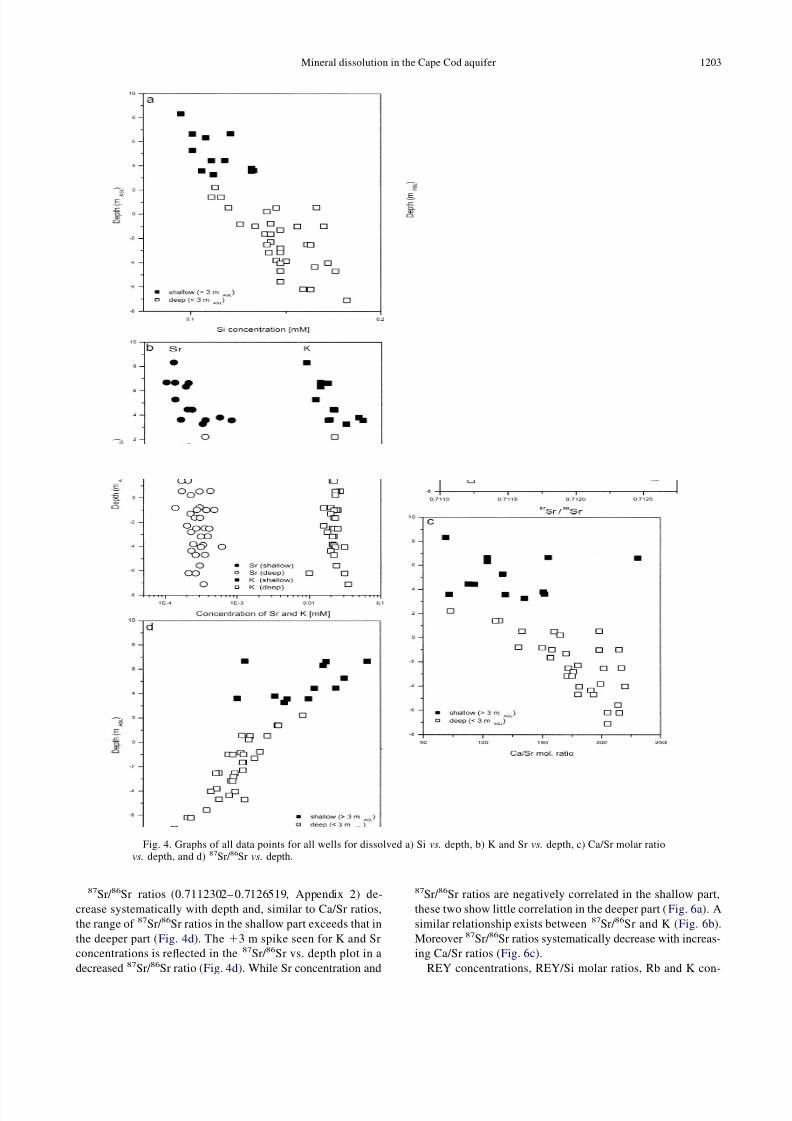
87Sr/ 86Sr ratios (0.7112302– 0.7126519, Appendix 2) de-
crease systematically with depth and, similar to Ca/Sr ratios,
the range of 87Sr/ 86Sr ratios in the shallow part exceeds that in
the deeper part (Fig. 4d). The ϩ3 m spike seen for K and Sr
concentrations is reflected in the 87Sr/ 86Sr vs. depth plot in a
decreased 87Sr/ 86Sr ratio (Fig. 4d). While Sr concentration and
87Sr/ 86Sr ratios are negatively correlated in the shallow part,
these two show little correlation in the deeper part (Fig. 6a). A
similar relationship exists between 87Sr/ 86Sr and K (Fig. 6b).
Moreover 87Sr/ 86Sr ratios systematically decrease with increas-
ing Ca/Sr ratios (Fig. 6c).
REY concentrations, REY/Si molar ratios, Rb and K con-
Fig. 4. Graphs of all data points for all wells for dissolved a) Si vs. depth, b) K and Sr vs. depth, c) Ca/Sr molar ratio
vs. depth, and d) 87Sr/ 86Sr vs. depth.
1203Mineral dissolution in the Cape Cod aquifer

7/30/2019 REE mineral dissolution Cape Cod
http://slidepdf.com/reader/full/ree-mineral-dissolution-cape-cod 6/18
centrations, and Rb/Si and K/Si molar ratios in well #373
(Appendix 3) increase with increasing depth but show a max-
imum at ϳ0 m (Fig. 7). This trend is different from that of Sr
(and Ca; not shown) concentrations, and Sr/Si and Ca/Si molar
ratios (Fig. 7).
REYSN patterns are subparallel for all six groundwater sam-
ples (Fig. 8a), increase from the LREE to the HREE (NdSN /
YbSN ϭ 0.190.33), and are characterized by positive Y anom-alies (YSN /HoSN ϭ 1.29 - 1.50) and negative Ce anomalies
(CeSN /Ce*SN ϭ 0.53 - 0.73). The small positive GdSN anomaly
in Figure 8a may indicate the presence of minor amounts of
anthropogenic Gd in the groundwater (Bau and Dulski, 1996);
however, it does not show up in sediment-normalized REY
patterns (Fig. 8b) and we did not investigate this feature any
further.
3.2. Bulk Sediment and Mineral Separates
Major and trace element data for the bulk sediment and for
the mineral separates are given in Tables 1, 2, and 3; Figure 9
illustrates typical grain shapes and mineral association. Due to
its high quartz content, the bulk sediment sample is chemically
composed of 95.5% wt. % SiO2 with minor Al, Fe, K, Na, Ca,
and Ti. This suggests a normative mineralogical composition
(CIPW-norm calculated following Best, 1982) of quartz
(91.6%), K-feldspar (3.6%), albite (2.2%), and rare anorthite
(0.18%). The Rb/Sr and the Sr/Eu weight ratio is 1.3 and 118,
respectively. The REYCN pattern is close to that of average
shale, showing LREE enrichment and a negative EuCN anom-
aly (Fig. 10). This chemical composition is in close agreement
with the actual mineralogical composition reported for this
glaciogenic sediment: 90% quartz, minor plagioclase (5%), and
(amongst others) accessory orthoclase, microcline, glauconite,
Fe oxides, and mica (e.g., Barber, 1985; Barber et al., 1992;
Fig. 5. Graph of dissolved Sr concentration vs. dissolved K concen-
tration in groundwater samples from Cape Cod. Note the positivecorrelation between Sr and K.
Fig. 6. Graphs of a) 87Sr/ 86Sr vs. 1/[Sr], b) 87Sr/ 86Sr vs. 1/[K], and c)87Sr/ 86Sr vs. Ca/Sr mol. ratio. Note the strong trend of decreasing87Sr/ 86Sr86 with increasing Ca/Sr molar ratio.
1204 M. Bau et al.

7/30/2019 REE mineral dissolution Cape Cod
http://slidepdf.com/reader/full/ree-mineral-dissolution-cape-cod 7/18
Coston et al., 1995). In a study of nineteen sediment samples
from Cape Cod (for which sampling locations and depths are
not reported), DeSimone et al. (1997) found somewhat lower
quartz (62 Ϯ 14%) and higher feldspar contents (18 Ϯ 5%)
than other investigators. Amphibole, glauconite, siderite, and
very minor calcite (the latter less than 1% in only half of the
Fig. 7. Graphs of a) dissolved solute concentrations vs. depth in Cape Cod groundwater from well #373, and b) graph of
dissolved solute/Si molar ratios normalized to the respective ratio in the uppermost sample (ϩ 7 m) vs. depth forgroundwater from well #373. Note that trends for Y/Si and La/Si are similar to K/Si and Rb/Si, whereas the trends for Ca/Siand Sr/Si are different.
Fig. 8. REY distribution in groundwater from well #373 normalized to a) shale and (b) bulk aquifer sediment. Yttriumis inserted between Dy and Ho according to its effective ionic radius. Note that all patterns are subparallel to each other and
show LREE depletion, negative Ce anomalies and positive Y anomalies, but no Eu and La anoma lies. The small positiveGd anomalies in the shale-normalized patterns may indicate minor anthropogenic Gd contamination (Bau and Dulski, 1996),
but more likely reflect a similar small Gd enrichment in the aquifer sediment.
1205Mineral dissolution in the Cape Cod aquifer
7/30/2019 REE mineral dissolution Cape Cod
http://slidepdf.com/reader/full/ree-mineral-dissolution-cape-cod 8/18
samples) were also reported as accessory minerals. Following
DeSimone et al. (1997), the clay-sized fraction is composed of
illite/mica (49%), kaolinite (26%), mixed-layer illite-smectite
(12%), and chlorite (11%). These results (DeSimone et al.,
1997) are in broad agreement with those of the previous studies
already mentioned, although they document more variability
and higher abundance of non-quartz minerals.
The “K-feldspar separate” (2 in Tables 1 and 4) is rich in Si,
Al, K, and Na, and its normative mineralogy indicates the
presence of quartz, K-feldspar, and minor albite. The “acces-
sories separate” (3 in Table 4) is considerably higher in Al, Fe,
Ca, Na, K and Ti, and its normative mineralogy is dominated
by quartz and perthite. Microprobe analyses of the “accessories
separate” (Table 3) indicate a K-feldspar composition of
Ab9An0Or91 and an albite composition of Ab98An2Or0 (com-
position calculated following Deer et al. (1992)).
The Sr isotopic composition (Fig. 11) of the bulk sediment
(Table 4) falls between that of the “K-feldspar separate” (2) andthat of the “accessories” separate (3). To elucidate the 87Sr/ 86Sr
ratios of the K-feldspar and the accessories (Table 4), another
fraction of predominantly K-feldspar (4 in Table 4) was hand-
picked under the microscope. The 87Sr/ 86Sr ratio of this sepa-
rate 4 documents that K-feldspar dominates the radiogenic Sr
component (Fig. 11, Table 4). Two more accessory separates
(separates 5 and 6 in Table 4) were also hand-picked and
separated using heavy liquids to further concentrate the more
mafic minerals. Specifically, in separating these last two frac-
tions, two separate samples of bulk sediment were used and all
light colored grains were removed by hand. Bromoform was
then used to remove minerals with density Ͼ2.8 g cm-3. One
more hand-picking step was used to remove anomalous grains,
leaving homogeneous samples that were not combined together
but were analyzed separately. Before analysis both samples
were thought to be identical and because of lack of sample
material only one of these separates (5 in Table 4) was analyzed
for Sr isotopes, while both were analyzed for trace elements
(Table 2).
Microprobe data (not shown) indicate that separate 5 con-
tains albite (Ab97An03Or0) and small amounts of partly hy-
drated mica. We did not observe any carbonate minerals. A high
abundance of plagioclase in this separate is documented by low
Rb and high Sr concentration (115 ppm and 508 ppm, respec-
tively), low Rb/Sr weight ratio (0.23), and, most significant, a
positive EuCN anomaly (EuCN /Eu*CN ϭ 2.06, Fig. 10). The Sr
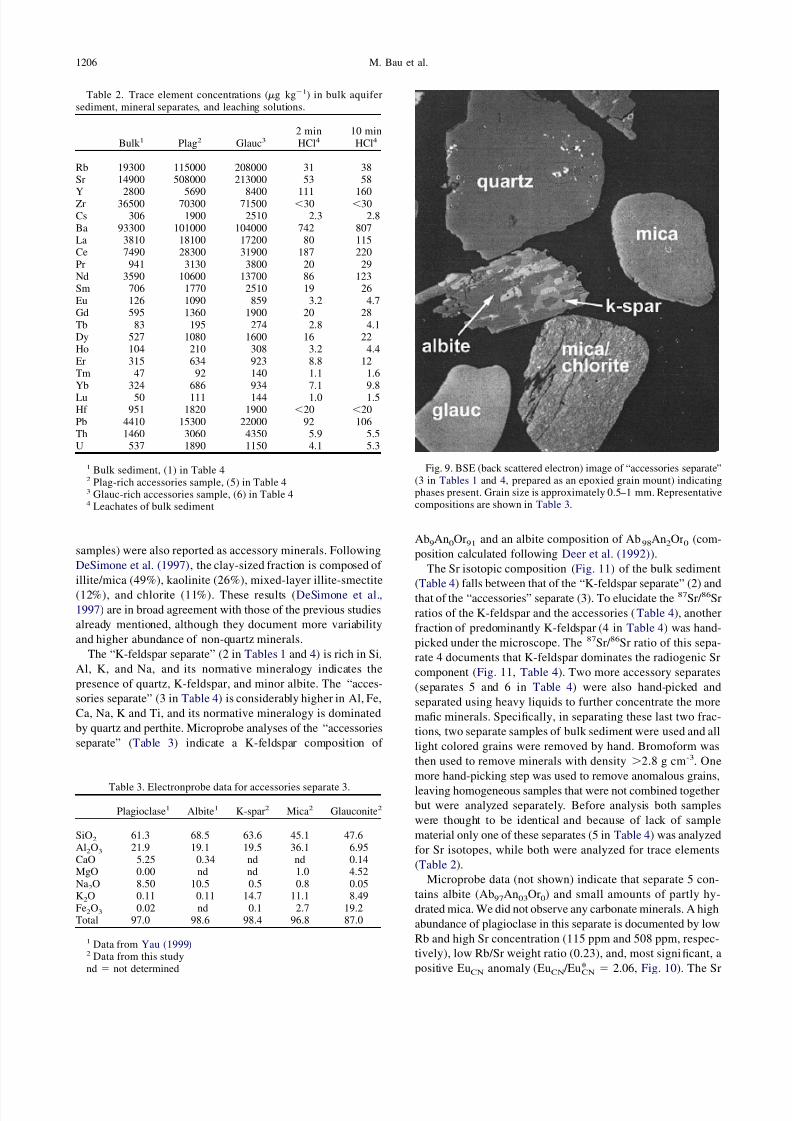
Table 2. Trace element concentrations (g kgϪ1) in bulk aquifer
sediment, mineral separates, and leaching solutions.
Bulk 1 Plag2 Glauc32 min
HCl410 min
HCl4
Rb 19300 115000 208000 31 38Sr 14900 508000 213000 53 58
Y 2800 5690 8400 111 160Zr 36500 70300 71500 Ͻ30 Ͻ30Cs 306 1900 2510 2.3 2.8
Ba 93300 101000 104000 742 807La 3810 18100 17200 80 115Ce 7490 28300 31900 187 220
Pr 941 3130 3800 20 29Nd 3590 10600 13700 86 123Sm 706 1770 2510 19 26
Eu 126 1090 859 3.2 4.7Gd 595 1360 1900 20 28
Tb 83 195 274 2.8 4.1Dy 527 1080 1600 16 22Ho 104 210 308 3.2 4.4
Er 315 634 923 8.8 12Tm 47 92 140 1.1 1.6
Yb 324 686 934 7.1 9.8Lu 50 111 144 1.0 1.5Hf 951 1820 1900 Ͻ20 Ͻ20
Pb 4410 15300 22000 92 106Th 1460 3060 4350 5.9 5.5U 537 1890 1150 4.1 5.3
1 Bulk sediment, (1) in Table 42 Plag-rich accessories sample, (5) in Table 43 Glauc-rich accessories sample, (6) in Table 44 Leachates of bulk sediment
Table 3. Electronprobe data for accessories separate 3.
Plagioclase1 Albite1 K-spar2 Mica2 Glauconite2
SiO2 61.3 68.5 63.6 45.1 47.6
Al2O3 21.9 19.1 19.5 36.1 6.95CaO 5.25 0.34 nd nd 0.14MgO 0.00 nd nd 1.0 4.52
Na2O 8.50 10.5 0.5 0.8 0.05K2O 0.11 0.11 14.7 11.1 8.49
Fe2O3 0.02 nd 0.1 2.7 19.2Total 97.0 98.6 98.4 96.8 87.0
1 Data from Yau (1999)2 Data from this study
nd ϭ not determined
Fig. 9. BSE (back scattered electron) image of “accessories separate”(3 in Tables 1 and 4, prepared as an epoxied grain mount) indicatingphases present. Grain size is approximately 0.5–1 mm. Representativecompositions are shown in Table 3.
1206 M. Bau et al.
7/30/2019 REE mineral dissolution Cape Cod
http://slidepdf.com/reader/full/ree-mineral-dissolution-cape-cod 9/18
isotope ratio in this plagioclase-rich accessories separate is very
similar to that in the groundwater (Fig. 11).
Separate 6, separated identically as separate 5 but using a
different bulk sediment source, shows higher Rb (208 ppm) and
lower Sr (213 ppm) concentration than separate 5, a higher
Rb/Sr weight ratio (0.98), and only a very small positive EuCN
anomaly (EuCN /Eu*CN ϭ 1.15, Fig. 10), suggesting that in this
separate, Rb-K-bearing minerals such as glauconite are more
abundant and that plagioclase is less abundant than in the more
plagioclase-rich separate 5. Differences between separates 5
and 6 can be attributed to slight differences in the separation
procedure or to the mineral abundances in bulk aquifer sam-
ples; in the following, these separates are referred to as the
“plagioclase-rich accessories” and the “glauconite-rich acces-
sories” separates (5 and 6, respectively, in Table 4). We em-
phasize that we did not find any carbonate minerals in any of
the separates.
3.3. Sequential Extraction and HCl Leaching
All sequential extractions yielded Sr that is more radiogenic
than that in the groundwater (Fig. 11). The “exchangeable Sr”
is the least radiogenic, whereas the “carbonate extraction”
produced the highest 87Sr/ 86Sr ratio; the latter, however, is still
less radiogenic than the “handpicked K-feldspar” separate (Fig.
11, Table 4). Since carbonate is absent from the aquifer sedi-
ment, the radiogenic Sr leached during the carbonate extraction
step may originate from the detrital K-feldspar, K-Rb-rich mica
and/or weathering products of K-feldspar and mica, which are
the most radiogenic components in the sediment due to their
high Rb content. This documents an easily accessible Sr source
in the sediment that may release radiogenic Sr even though the
host minerals are not dissolved. Preferential release from min-
erals with more radiogenic 87Sr/ 86Sr compared to less radio-
genic 87Sr/ 86Sr is common (Brantley et al., 1998) and well-
known from Rb-Sr geochronology (Irber, 1996). Leaching with
dilute HCl mobilized only small amounts of Rb and Sr from the
sediment (Table 2). Sr is more easily accessible than Rb as
shown by the lower Rb/Sr wgt. ratio of 0.6 for the leachates
compared to 1.3 for the bulk sediment. These values are con-
siderably higher than the Rb/Sr ratio of the water (0.05 to 0.31).
The REYCN patterns of the leachates show the same negative
EuCN anomaly as the bulk sediment, but are somewhat less
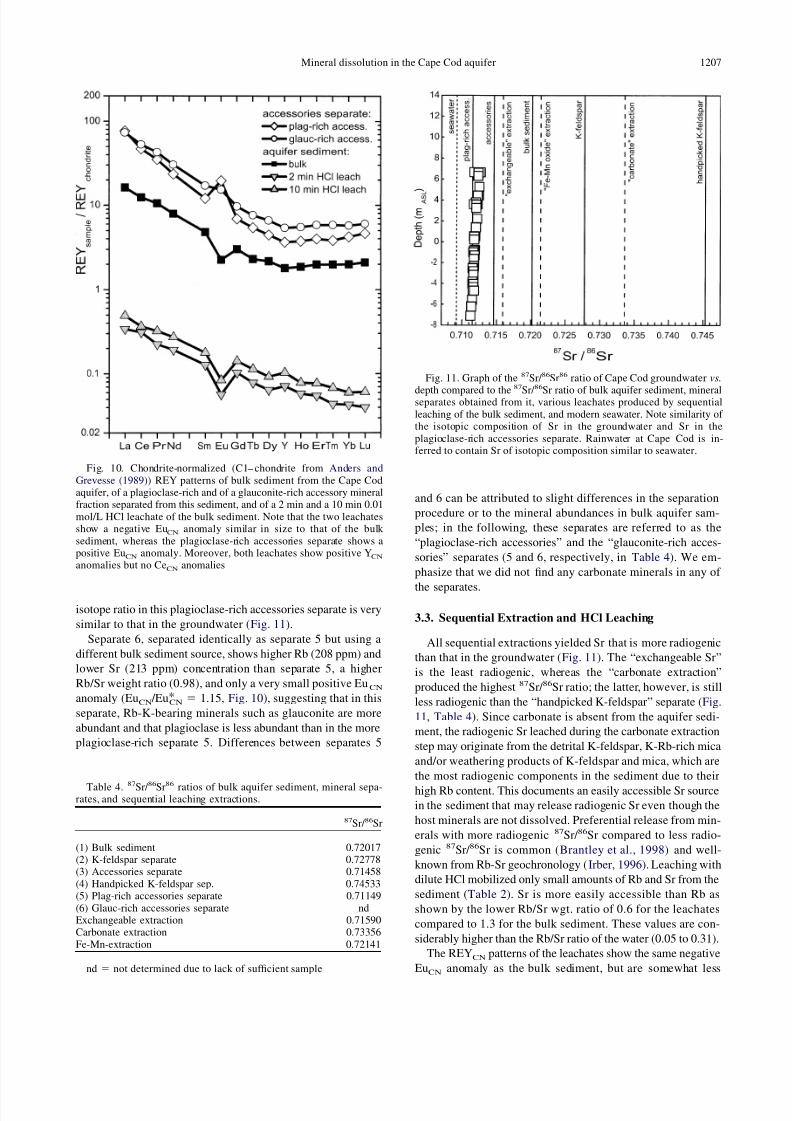
Fig. 10. Chondrite-normalized (C1– chondrite from Anders and
Grevesse (1989)) REY patterns of bulk sediment from the Cape Codaquifer, of a plagioclase-rich and of a glauconite-rich accessory mineralfraction separated from this sediment, and of a 2 min and a 10 min 0.01
mol/L HCl leachate of the bulk sediment. Note that the two leachatesshow a negative EuCN anomaly similar in size to that of the bulk
sediment, whereas the plagioclase-rich accessories separate shows apositive EuCN anomaly. Moreover, both leachates show positive YCN
anomalies but no CeCN anomalies
Table 4. 87Sr/ 86Sr86 ratios of bulk aquifer sediment, mineral sepa-rates, and sequential leaching extractions.
87Sr/ 86Sr
(1) Bulk sediment 0.72017(2) K-feldspar separate 0.72778(3) Accessories separate 0.71458
(4) Handpicked K-feldspar sep. 0.74533(5) Plag-rich accessories separate 0.71149
(6) Glauc-rich accessories separate ndExchangeable extraction 0.71590Carbonate extraction 0.73356
Fe-Mn-extraction 0.72141
nd ϭ not determined due to lack of suf ficient sample
Fig. 11. Graph of the 87Sr/ 86Sr86 ratio of Cape Cod groundwater vs.
depth compared to the87
Sr/ 86
Sr ratio of bulk aquifer sediment, mineralseparates obtained from it, various leachates produced by sequential
leaching of the bulk sediment, and modern seawater. Note similarity of the isotopic composition of Sr in the groundwater and Sr in the
plagioclase-rich accessories separate. Rainwater at Cape Cod is in-ferred to contain Sr of isotopic composition similar to seawater.
1207Mineral dissolution in the Cape Cod aquifer
7/30/2019 REE mineral dissolution Cape Cod
http://slidepdf.com/reader/full/ree-mineral-dissolution-cape-cod 10/18
enriched in LREE and depleted in HREE (Fig. 10). The 2 min
and 10 min leaching solutions do not show negative CeCNanomalies, but display small positive YCN anomalies and show
super-chondritic Y/Ho weight ratios of 34.2 and 36.7. In con-
trast, the bulk sediment shows the “normal” Y/Ho weight ratio
of 28.5, which is typical of chondrites, shales, and most igneous
rocks (Bau, 1996).
4. DISCUSSION
4.1. Major Cations, Sr and 87Sr/ 86Sr
Geochemical modeling using Geochemist’s Workbench
(Bethke, 2002) indicates Cape Cod groundwater sampled for
this study is supersaturated with respect to quartz and kaolinite
and undersaturated with respect to K-feldspar, albite, and an-
orthite (thermodynamic dataset based on SUPCRT92 data com-
pilation (Johnson et al., 1991). Quartz remains supersaturated
with respect to the groundwater samples even when a higher
quartz solubility (Rimstidt, 1997) is used in the model.The increase of Si, Ca, and Na concentration with depth
(Appendix 4) suggests that progressive dissolution of Ca- and
Na-bearing silicate minerals exerts an important control on the
groundwater composition. The variations of other solute con-
centrations, such as K, Sr, and Mg (and to some degree Ca)
with depth, that do not closely correlate with Si, indicate that
ions are exchanging on mineral surfaces, non-silicate phases
are dissolving, or Si-conservative alteration reactions are oc-
curring. The latter reactions are most prominently documented
in the strong increase of Sr, K, Ca, and Mg concentrations in
the shallow part of the aquifer and the concentration spike at
ϩ3 m depth (Figs. 3 and 4).
The low
87
Sr/
86
Sr ratio of the groundwater contrasts with thehigh 87Sr/ 86Sr ratio of the aquifer sediment (Fig. 11), which is
not unusual. While the bulk sediment shows high 87Sr/ 86Sr due
to the high Sr isotopic ratio of the Rb-rich detrital K-feldspar
component, the low 87Sr/ 86Sr ratios of the “accessories sepa-
rate” 3 and, in particular, of the “plagioclase-rich accessories”
5 separate are related to Rb-poor detrital plagioclase and au-
thigenic glauconite. Plagioclase and glauconite are the most
abundant Sr-bearing minerals in these separates and progres-
sive dissolution of these accessory minerals appears to control
the 87Sr/ 86Sr signature of the Cape Cod groundwater. This is
corroborated by the positive correlation between Sr and K (Fig.
5), and between 87Sr/ 86Sr and Sr and K in the shallow part of
the aquifer in particular (Fig. 6a and b). All of the above
features indicate that plagioclase dissolution alone cannot ex-
plain the chemical composition of Cape Cod groundwater.
The decreasing 87Sr/ 86Sr ratio of Cape Cod groundwater
with depth clearly shows that plagioclase dissolution is signif-
icantly more important in this aquifer than K-feldspar dissolu-
tion. This appears to contradict the observation of similar
abundance of K-feldspar and plagioclase in the sediments we
analyzed. However, many other researchers (e.g., Banfield and
Eggleton, 1990; Nesbitt et al., 1997; White et al., 2001 ) have
also observed that, in natural environments even where K-
feldspar is more abundant than plagioclase, plagioclase disso-
lution is faster than that of K-feldspar (for a recent compilation
of dissolution rates see, e.g., White et al. (2001)).
The large variation of, for example, K in cation concentra-
tion vs. depth plots (Fig. 4) suggests that at least one solute
source is inhomogeneously distributed in layers or lenses, par-
ticularly in the shallow part of the aquifer. Considering that the
solute spike at ϩ3 m depth documents local input of Sr, K, Ca,
and Mg, but not of Si (Figs. 3 and 4), congruent dissolution of
a silicate phase can be excluded. However, since carbonate
minerals are largely absent from the aquifer sediment (Barber
et al., 1992; Coston et al., 1995; this study) and dissolution of
marine carbonate would not release K to the groundwater, this
suggests that the additional solute input exhibited by the spike
is accomplished via Si-conservative mineral alteration rather
than congruent mineral dissolution. Ion exchange is also an
unlikely mechanism, because we see no evidence for loss of
ions from solution, but only for gain of ions. Furthermore, the
decrease of 87Sr/ 86Sr that accompanies the Sr spike at ϩ3 m
depth (Fig. 4b and d) requires that the Sr-contributing mineral
be low in radiogenic 87Sr, i.e., it is either low in Rb (and K), or
it is too young to have accumulated significant radiogenic 87Sr
from the decay of 87Rb. Since “anomalously” high Sr concen-
trations are accompanied by high K concentrations (Figs. 4b
and 5), Sr release from a Rb-K-poor mineral is unlikely. This
points to a “young” Rb-K-bearing mineral as solute source,
effectively ruling out detrital minerals such as mica or amphi-
bole.
These inferences point toward the accessory authigenic glau-
conite as an important solute source in the shallow part of the
aquifer in addition to plagioclase. Upon weathering, glauconite
forms Fe-hydroxides, kaolinite, and mixed-layer clays or smec-
tite (Wolff, 1967; Courbe et al., 1981), which all have been
observed within the clay-sized fraction of Cape Cod sediment
(Barber, 1985; Yau, 1999). Moreover, during weathering of
glauconite, K tends to partition into the solution, producing
K-depleted weathering products (Courbe et al., 1981) and K-enriched groundwaters (Wolff, 1967). Weathering of plagio-
clase also often produces secondary clay minerals (smectites)
and/or kaolinite (Proust and Velde, 1978; Rodgers and Holland,
1979; Huang, 1989; Banfield and Eggleton, 1990; Taboada and
Garcia, 1999), which also occur in the Cape Cod sediments.
Considering that the Sr in rainwater on Cape Cod should
primarily originate from seawater-derived aerosols (Herut et
al., 1993; Miller et al., 1993) its isotopic composition should
reflect the low 87Sr/ 86Sr ratio of seawater Sr (Fig. 11). The
significantly higher 87Sr/ 86Sr ratio of groundwater samples
from the uppermost sample ports (Fig. 4d), therefore, indicates
that Sr with high 87Sr/ 86Sr ratio is rapidly mobilized as soon as
rainwater interacts with the aquifer sediment. This easily ac-cessible Sr is presumed equivalent to the Sr mobilized during
the first steps of the sequential leaching experiment, including
either or both the “exchangeable Sr” and “carbonate Sr” (Fig.
11). The negative linear correlation between 87Sr/ 86Sr and 1/Sr
and 1/K in the shallow part of the aquifer ( Fig. 6) may result
from mixing between this easily accessible Sr and the Sr (and
K) with low 87Sr/ 86Sr ratio derived from dissolving glauconite
and plagioclase.
Assuming that glauconite and plagioclase are the sole
sources of cations at depth in the Cape Cod groundwater, cation
release observed as a function of depth in the groundwater can
constrain model dissolution reactions (Table 5). A general
1208 M. Bau et al.
7/30/2019 REE mineral dissolution Cape Cod
http://slidepdf.com/reader/full/ree-mineral-dissolution-cape-cod 11/18
incongruent dissolution reaction consistent with sediment anal-
yses and groundwater chemistry can be written:
glauconite ϩ plagioclase ϩ Hϩ ϩ H2O ϩ CO2 3
glaucWP ϩ plagWP ϩ goethite ϩ kaolinite ϩ SiO2(aq)
ϩ HCO3Ϫ ϩ cations (1)
where glaucWP and plagWP refer to a glauconite and a pla-
gioclase weathering product, respectively. Consistent with this
reaction, all groundwater samples lie within the kaolinite sta-bility field and goethite and kaolinite have been identified in the
aquifer (Barber, 1985; Coston et al., 1995; Yau, 1999). We
therefore assume that both phases will precipitate regardless of
the nature of the glaucWP and plagWP.
Importantly, since release with depth of Na, Ca, Mg, and K
are all significant, neither dissolution of glauconite nor plagio-
clase alone can explain the evolution of the groundwater chem-
istry. Glauconite and plagioclase cannot yield Ca and K, re-
spectively, during dissolution (Table 3). To constrain reaction
(1), release rates (RR) and release rate ratios (RRR) can be
calculated for Cape Cod groundwater (Table 5):
RR iϭ
d i
dz (a)
and
RR Ri / jϭ
RR i
RR j
(b)
where [i] and [ j] represent the dissolved concentrations of
components i and j at depth z.
The glaucWP is probably represented by an Fe-rich illite,
consistent with weathering products observed by Courbe et al.
(1981). The plagWP is inferred to be a smectite, which is
consistent with smectite, illite, and kaolinite identified within
the clay-sized fraction (Ͻ38 m) of crushed Cape Cod felds-
par. Incorporating these weathering products into reaction (2)
predicts cation release consistent with observed RRR (Table 5)
over the entire sampled depth:
1.05 K0.8(Mg1.0Fe2.4Al0.9)[Si7.3Al0.7]O20(OH)4
ϩ 0.9 Na0.75Ca0.25Al1.25Si2.75O8
ϩ 1.23 CO2 ϩ 1.88 H2O ϩ 0.03 Hϩ3
1.05 K0.53Mg0.65Fe1.09Al2.3[Si8O20](OH)4 ϩ 1.18 FeOOH
ϩ 0.40 K0.7Ca0.3Mg0.52Fe0.5Al0.75[Al0.1Si3.9O10](OH)2
ϩ 0.02 Al2Si2O5(OH)4 ϩ 0.13 H4SiO4 ϩ 0.67 Na
ϩ 0.004 K ϩ 0.10 Ca ϩ 0.16 Mg ϩ 1.23 HCO3Ϫ (2)
Assuming total Sr released from glauconite and plagioclase
goes into solution, Sr/Si ratios (Table 5) can be determined
from an inferred Ca/Sr molar ratio in glauconite of 310 (Courbe
et al., 1981; Harris, 1982) and a Ca/Sr molar ratio in plagioclase
from felsic source rocks of 300 (Brantley et al., 1998; Jang and
Naslund, 2001; White et al., 2001). Based upon these calcula-
tions, the proportion of Sr released by dissolution of glauconite
and plagioclase integrated from depth ϭ 8.3 m to Ϫ7.1 m
(ASL) is 36 and 64%, respectively (Table 5), and is consistent
with extent of dissolution in aquifer water increasing at the rate
of 0.06 mol of plagioclase and 0.07 mol of glauconite/m depth.
However, a more careful inspection of Figure 3 reveals that
release rate ratios are not constant as a function of depth within
the aquifer. RRR are generally higher above ϩ3 m depth; e.g.,
note the strong increase of dissolved K concentrations in the
shallow part compared to the deeper part (Figs. 3 and 4). We
infer that the relative contribution of glauconite and plagioclase
weathering to cation concentrations in the groundwater changes
at about ϩ3 m depth. The following dissolution reaction (3a,
with a plagioclase/glauconite molar dissolution ratio of 0.95)
produces cation/Si release ratios as a function of depth within
error of those observed in the shallow part of the aquifer:
Table 5. Cation release rate ratios (RRR) for Cape Cod groundwater.
RRRi/j
Calculated from all samplesover all depths: moles
plag/glauc ϭ 0.86
Calculated from shallowsamples (Ͼ3m depths): moles
plag/glauc ϭ 0.95
Calculated from deep samples(Ͻ3m depth): moles plag/glauc
ϭ 4.5
Observed1 Predicted2 Observed1 Predicted3 Observed1 Predicted4
Hϩ
5
/Si 0.2 Ϯ 0.2 0.3 0.5 Ϯ 0.7 0.58 0.1 Ϯ 0.2 0.12K/Si 0.04 Ϯ 1.1 0.03 1.1 Ϯ 0.3 0.92 Ϫ0.1 Ϯ 0.4 0.003Na/Si 5.40 Ϯ 0.1 5.30 6.2 Ϯ 0.3 6.14 3.8 Ϯ 0.3 3.80
Ca/Si 0.70 Ϯ 0.1 0.79 1.8 Ϯ 0.3 1.79 0.7 Ϯ 0.3 0.60Mg/Si 1.30 Ϯ 0.2 1.27 2.8 Ϯ 0.3 2.59 0.1 Ϯ 3.3 0.01Sr/Si 0.002 Ϯ 0.4 0.01 0.02 Ϯ 0.3 0.01 0.001 Ϯ 0.6 0.005
%[Sr]glau.6 36% 34% 10%
%[Sr]plag.7 64% 66% 90%
1 Ratios of observed cation release rates where cation release rate equals slope of regression: all depths (n ϭ 46), shallow (n ϭ deep (n ϭ 33).2 Ratios of cation release rates predicted from model dissolution reaction (2).3 Ratios of cation release rates predicted from model dissolution reaction (3).4 Ratios of cation release rates predicted from model dissolution reaction (4).5 Hϩ data collected by USGS from same wells and depths sampled in this study (Savoie and LeBlanc, 1998).6 Calculated percentage of moles Sr released from glauconite dissolution in reactions (2), (3), and (4) based upon an assumed glauconite Ca/Sr molar
ratio of 312 (Harris, 1982; Courbe et al., 1981).7 Calculated percentage of moles Sr released from plagioclase dissolution in reactions (2), (3), and (4) based upon an assumed plagioclase Ca/Sr
molar ratio of 300 (Brantley et al., 1998; Jang and Naslund, 2001; White et al., 2001).
1209Mineral dissolution in the Cape Cod aquifer
7/30/2019 REE mineral dissolution Cape Cod
http://slidepdf.com/reader/full/ree-mineral-dissolution-cape-cod 12/18
1.05 K0.8(Mg1.0Fe2.4Al0.9)[Si7.3Al0.7]O20(OH)4
ϩ 1.0 Na0.75Ca0.25Al1.25Si2.75O8
ϩ 1.88 CO2 ϩ 2.15 H2O ϩ 0.07 Hϩ3
1.24 K0.53Mg0.55Fe1.16Al2.3[Si8O20](OH)4
ϩ 0.10 K0.7Ca0.3Mg0.52Fe0.5Al0.75[Al0.1Si3.9O10](OH)2
ϩ 1.03 FeOOH ϩ 0.002 Al2Si2O5(OH)4
ϩ 0.12 H4SiO4 ϩ 0.75 Naϩϩ 0.11 Kϩ ϩ 0.22 Ca2ϩ
ϩ 0.32 Mg2ϩϩ 1.88 HCO3Ϫ (3a)
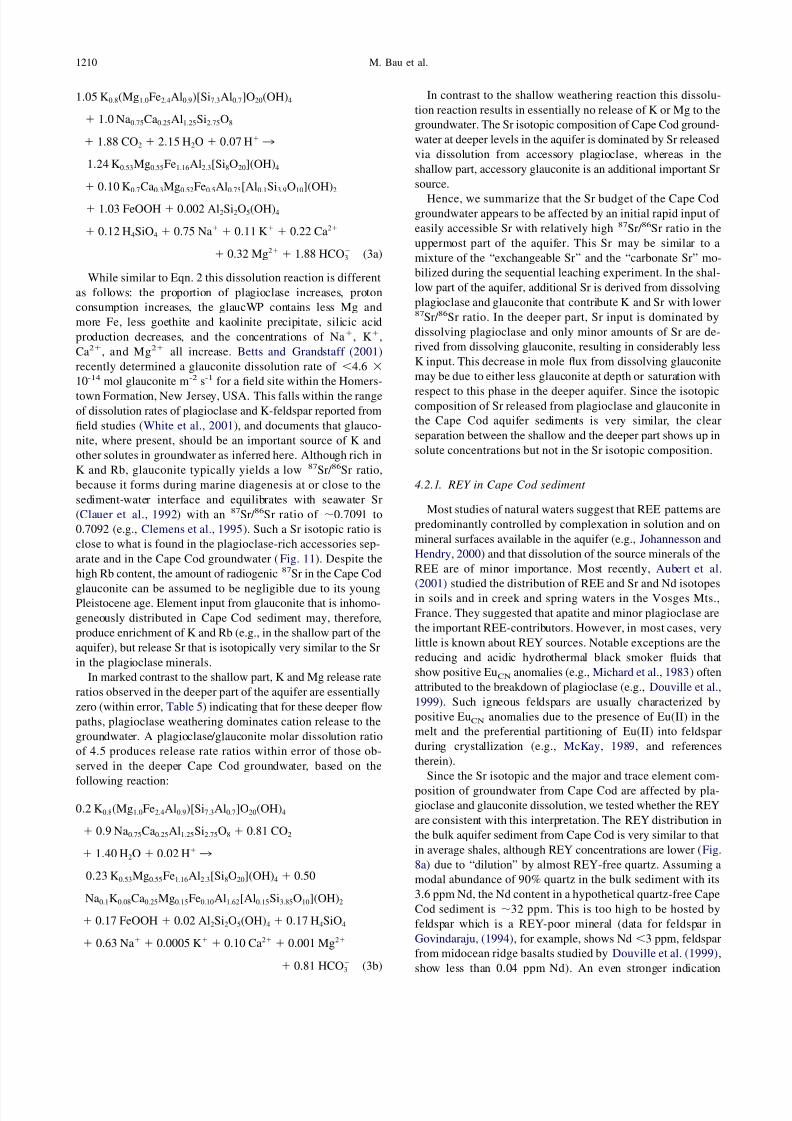
While similar to Eqn. 2 this dissolution reaction is different
as follows: the proportion of plagioclase increases, proton
consumption increases, the glaucWP contains less Mg and
more Fe, less goethite and kaolinite precipitate, silicic acid
production decreases, and the concentrations of Naϩ, Kϩ,
Ca2ϩ, and Mg2ϩ all increase. Betts and Grandstaff (2001)
recently determined a glauconite dissolution rate of Ͻ4.6 ϫ
10-14 mol glauconite m-2 s-1 for a field site within the Homers-
town Formation, New Jersey, USA. This falls within the rangeof dissolution rates of plagioclase and K-feldspar reported from
field studies (White et al., 2001), and documents that glauco-
nite, where present, should be an important source of K and
other solutes in groundwater as inferred here. Although rich in
K and Rb, glauconite typically yields a low 87Sr/ 86Sr ratio,
because it forms during marine diagenesis at or close to the
sediment-water interface and equilibrates with seawater Sr
(Clauer et al., 1992) with an 87Sr/ 86Sr ratio of ϳ0.7091 to
0.7092 (e.g., Clemens et al., 1995). Such a Sr isotopic ratio is
close to what is found in the plagioclase-rich accessories sep-
arate and in the Cape Cod groundwater (Fig. 11). Despite the
high Rb content, the amount of radiogenic 87Sr in the Cape Cod
glauconite can be assumed to be negligible due to its youngPleistocene age. Element input from glauconite that is inhomo-
geneously distributed in Cape Cod sediment may, therefore,
produce enrichment of K and Rb (e.g., in the shallow part of the
aquifer), but release Sr that is isotopically very similar to the Sr
in the plagioclase minerals.
In marked contrast to the shallow part, K and Mg release rate
ratios observed in the deeper part of the aquifer are essentially
zero (within error, Table 5) indicating that for these deeper flow
paths, plagioclase weathering dominates cation release to the
groundwater. A plagioclase/glauconite molar dissolution ratio
of 4.5 produces release rate ratios within error of those ob-
served in the deeper Cape Cod groundwater, based on the
following reaction:
0.2 K0.8(Mg1.0Fe2.4Al0.9)[Si7.3Al0.7]O20(OH)4
ϩ 0.9 Na0.75Ca0.25Al1.25Si2.75O8 ϩ 0.81 CO2
ϩ 1.40 H2O ϩ 0.02 Hϩ3
0.23 K0.53Mg0.55Fe1.16Al2.3[Si8O20](OH)4 ϩ 0.50
Na0.1K0.08Ca0.25Mg0.15Fe0.10Al1.62[Al0.15Si3.85O10](OH)2
ϩ 0.17 FeOOH ϩ 0.02 Al2Si2O5(OH)4 ϩ 0.17 H4SiO4
ϩ 0.63 Naϩ ϩ 0.0005 Kϩ ϩ 0.10 Ca2ϩϩ 0.001 Mg2ϩ
ϩ 0.81 HCO3Ϫ (3b)
In contrast to the shallow weathering reaction this dissolu-
tion reaction results in essentially no release of K or Mg to the
groundwater. The Sr isotopic composition of Cape Cod ground-
water at deeper levels in the aquifer is dominated by Sr released
via dissolution from accessory plagioclase, whereas in the
shallow part, accessory glauconite is an additional important Sr
source.
Hence, we summarize that the Sr budget of the Cape Codgroundwater appears to be affected by an initial rapid input of
easily accessible Sr with relatively high 87Sr/ 86Sr ratio in the
uppermost part of the aquifer. This Sr may be similar to a
mixture of the “exchangeable Sr” and the “carbonate Sr” mo-
bilized during the sequential leaching experiment. In the shal-
low part of the aquifer, additional Sr is derived from dissolving
plagioclase and glauconite that contribute K and Sr with lower87Sr/ 86Sr ratio. In the deeper part, Sr input is dominated by
dissolving plagioclase and only minor amounts of Sr are de-
rived from dissolving glauconite, resulting in considerably less
K input. This decrease in mole flux from dissolving glauconite
may be due to either less glauconite at depth or saturation with
respect to this phase in the deeper aquifer. Since the isotopiccomposition of Sr released from plagioclase and glauconite in
the Cape Cod aquifer sediments is very similar, the clear
separation between the shallow and the deeper part shows up in
solute concentrations but not in the Sr isotopic composition.
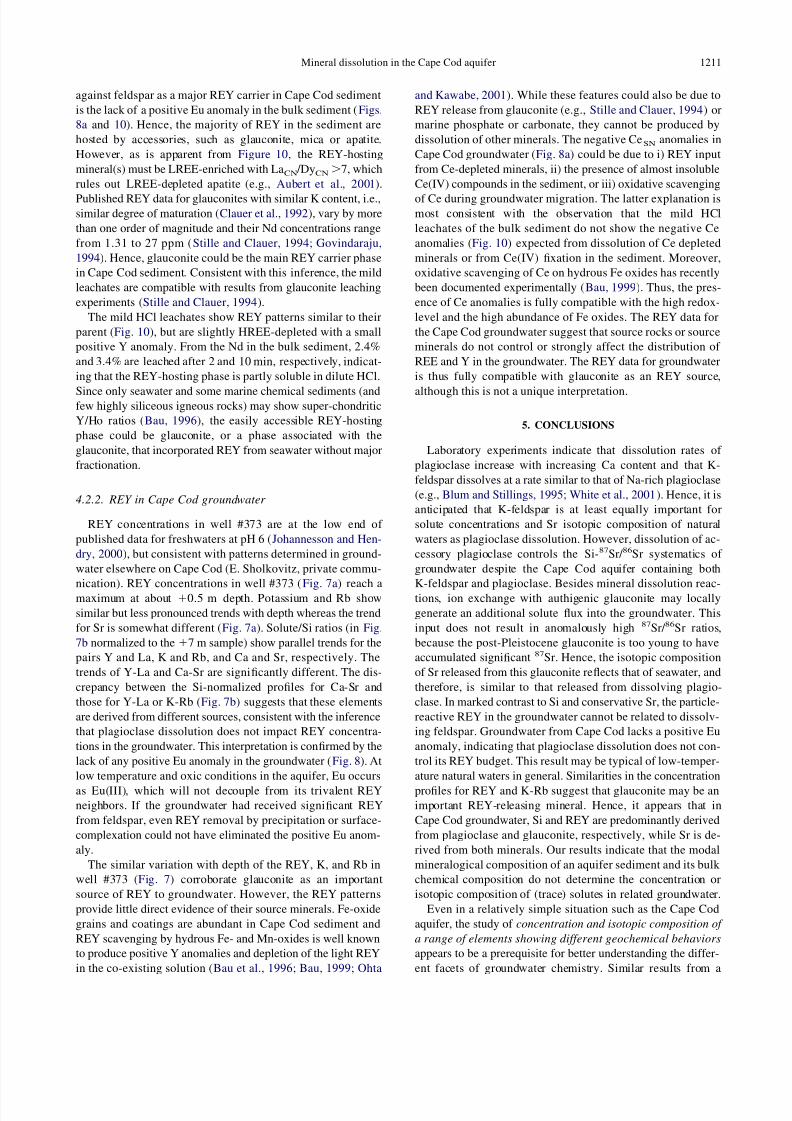
4.2.1. REY in Cape Cod sediment
Most studies of natural waters suggest that REE patterns are
predominantly controlled by complexation in solution and on
mineral surfaces available in the aquifer (e.g., Johannesson and
Hendry, 2000) and that dissolution of the source minerals of the
REE are of minor importance. Most recently, Aubert et al.
(2001) studied the distribution of REE and Sr and Nd isotopesin soils and in creek and spring waters in the Vosges Mts.,
France. They suggested that apatite and minor plagioclase are
the important REE-contributors. However, in most cases, very
little is known about REY sources. Notable exceptions are the
reducing and acidic hydrothermal black smoker fluids that
show positive EuCN anomalies (e.g., Michard et al., 1983) often
attributed to the breakdown of plagioclase (e.g., Douville et al.,
1999). Such igneous feldspars are usually characterized by
positive EuCN anomalies due to the presence of Eu(II) in the
melt and the preferential partitioning of Eu(II) into feldspar
during crystallization (e.g., McKay, 1989, and references
therein).
Since the Sr isotopic and the major and trace element com-
position of groundwater from Cape Cod are affected by pla-
gioclase and glauconite dissolution, we tested whether the REY
are consistent with this interpretation. The REY distribution in
the bulk aquifer sediment from Cape Cod is very similar to that
in average shales, although REY concentrations are lower (Fig.
8a) due to “dilution” by almost REY-free quartz. Assuming a
modal abundance of 90% quartz in the bulk sediment with its
3.6 ppm Nd, the Nd content in a hypothetical quartz-free Cape
Cod sediment is ϳ32 ppm. This is too high to be hosted by
feldspar which is a REY-poor mineral (data for feldspar in
Govindaraju, (1994), for example, shows Nd Ͻ3 ppm, feldspar
from midocean ridge basalts studied by Douville et al. (1999),
show less than 0.04 ppm Nd). An even stronger indication
1210 M. Bau et al.
7/30/2019 REE mineral dissolution Cape Cod
http://slidepdf.com/reader/full/ree-mineral-dissolution-cape-cod 13/18
against feldspar as a major REY carrier in Cape Cod sediment
is the lack of a positive Eu anomaly in the bulk sediment (Figs.
8a and 10). Hence, the majority of REY in the sediment are
hosted by accessories, such as glauconite, mica or apatite.
However, as is apparent from Figure 10, the REY-hosting
mineral(s) must be LREE-enriched with LaCN /DyCNϾ7, which
rules out LREE-depleted apatite (e.g., Aubert et al., 2001).
Published REY data for glauconites with similar K content, i.e.,similar degree of maturation (Clauer et al., 1992), vary by more
than one order of magnitude and their Nd concentrations range
from 1.31 to 27 ppm (Stille and Clauer, 1994; Govindaraju,
1994). Hence, glauconite could be the main REY carrier phase
in Cape Cod sediment. Consistent with this inference, the mild
leachates are compatible with results from glauconite leaching
experiments (Stille and Clauer, 1994).
The mild HCl leachates show REY patterns similar to their
parent (Fig. 10), but are slightly HREE-depleted with a small
positive Y anomaly. From the Nd in the bulk sediment, 2.4%
and 3.4% are leached after 2 and 10 min, respectively, indicat-
ing that the REY-hosting phase is partly soluble in dilute HCl.
Since only seawater and some marine chemical sediments (andfew highly siliceous igneous rocks) may show super-chondritic
Y/Ho ratios (Bau, 1996), the easily accessible REY-hosting
phase could be glauconite, or a phase associated with the
glauconite, that incorporated REY from seawater without major
fractionation.
4.2.2. REY in Cape Cod groundwater
REY concentrations in well #373 are at the low end of
published data for freshwaters at pH 6 (Johannesson and Hen-
dry, 2000), but consistent with patterns determined in ground-
water elsewhere on Cape Cod (E. Sholkovitz, private commu-
nication). REY concentrations in well #373 (Fig. 7a) reach amaximum at about ϩ0.5 m depth. Potassium and Rb show
similar but less pronounced trends with depth whereas the trend
for Sr is somewhat different (Fig. 7a). Solute/Si ratios (in Fig.
7b normalized to the ϩ7 m sample) show parallel trends for the
pairs Y and La, K and Rb, and Ca and Sr, respectively. The
trends of Y-La and Ca-Sr are significantly different. The dis-
crepancy between the Si-normalized profiles for Ca-Sr and
those for Y-La or K-Rb (Fig. 7b) suggests that these elements
are derived from different sources, consistent with the inference
that plagioclase dissolution does not impact REY concentra-
tions in the groundwater. This interpretation is confirmed by the
lack of any positive Eu anomaly in the groundwater (Fig. 8). At
low temperature and oxic conditions in the aquifer, Eu occurs
as Eu(III), which will not decouple from its trivalent REY
neighbors. If the groundwater had received significant REY
from feldspar, even REY removal by precipitation or surface-
complexation could not have eliminated the positive Eu anom-
aly.
The similar variation with depth of the REY, K, and Rb in
well #373 (Fig. 7) corroborate glauconite as an important
source of REY to groundwater. However, the REY patterns
provide little direct evidence of their source minerals. Fe-oxide
grains and coatings are abundant in Cape Cod sediment and
REY scavenging by hydrous Fe- and Mn-oxides is well known
to produce positive Y anomalies and depletion of the light REY
in the co-existing solution (Bau et al., 1996; Bau, 1999; Ohta
and Kawabe, 2001). While these features could also be due to
REY release from glauconite (e.g., Stille and Clauer, 1994) or
marine phosphate or carbonate, they cannot be produced by
dissolution of other minerals. The negative CeSN anomalies in
Cape Cod groundwater (Fig. 8a) could be due to i) REY input
from Ce-depleted minerals, ii) the presence of almost insoluble
Ce(IV) compounds in the sediment, or iii) oxidative scavenging
of Ce during groundwater migration. The latter explanation ismost consistent with the observation that the mild HCl
leachates of the bulk sediment do not show the negative Ce
anomalies (Fig. 10) expected from dissolution of Ce depleted
minerals or from Ce(IV) fixation in the sediment. Moreover,
oxidative scavenging of Ce on hydrous Fe oxides has recently
been documented experimentally (Bau, 1999). Thus, the pres-
ence of Ce anomalies is fully compatible with the high redox-
level and the high abundance of Fe oxides. The REY data for
the Cape Cod groundwater suggest that source rocks or source
minerals do not control or strongly affect the distribution of
REE and Y in the groundwater. The REY data for groundwater
is thus fully compatible with glauconite as an REY source,
although this is not a unique interpretation.
5. CONCLUSIONS
Laboratory experiments indicate that dissolution rates of
plagioclase increase with increasing Ca content and that K-
feldspar dissolves at a rate similar to that of Na-rich plagioclase
(e.g., Blum and Stillings, 1995; White et al., 2001). Hence, it is
anticipated that K-feldspar is at least equally important for
solute concentrations and Sr isotopic composition of natural
waters as plagioclase dissolution. However, dissolution of ac-
cessory plagioclase controls the Si-87Sr/ 86Sr systematics of
groundwater despite the Cape Cod aquifer containing both
K-feldspar and plagioclase. Besides mineral dissolution reac-tions, ion exchange with authigenic glauconite may locally
generate an additional solute flux into the groundwater. This
input does not result in anomalously high 87Sr/ 86Sr ratios,
because the post-Pleistocene glauconite is too young to have
accumulated significant 87Sr. Hence, the isotopic composition
of Sr released from this glauconite reflects that of seawater, and
therefore, is similar to that released from dissolving plagio-
clase. In marked contrast to Si and conservative Sr, the particle-
reactive REY in the groundwater cannot be related to dissolv-
ing feldspar. Groundwater from Cape Cod lacks a positive Eu
anomaly, indicating that plagioclase dissolution does not con-
trol its REY budget. This result may be typical of low-temper-
ature natural waters in general. Similarities in the concentration
profiles for REY and K-Rb suggest that glauconite may be an
important REY-releasing mineral. Hence, it appears that in
Cape Cod groundwater, Si and REY are predominantly derived
from plagioclase and glauconite, respectively, while Sr is de-
rived from both minerals. Our results indicate that the modal
mineralogical composition of an aquifer sediment and its bulk
chemical composition do not determine the concentration or
isotopic composition of (trace) solutes in related groundwater.
Even in a relatively simple situation such as the Cape Cod
aquifer, the study of concentration and isotopic composition of
a range of elements showing different geochemical behaviors
appears to be a prerequisite for better understanding the differ-
ent facets of groundwater chemistry. Similar results from a
1211Mineral dissolution in the Cape Cod aquifer
7/30/2019 REE mineral dissolution Cape Cod
http://slidepdf.com/reader/full/ree-mineral-dissolution-cape-cod 14/18
study of fossil hydrothermal systems that produced economic
mineral deposits (Bau et al., 2003) suggest that this may be true
for water-rock interaction in general.
Acknowledgments—Doug Kent, Jennifer Coston, Denis LeBlanc, Jen-nifer Savoie, Kim Bussey, and Matt Gamache of the USGS are ac-
knowledged for data, suggestions, and coordination of field work. The
following people are acknowledged for contributions: Simmy Yau(collected MLS waters), Don Voigt (general discussion), and Jim Davis
(introduction to the problem). Henry Gong, Shaole Wu, and Mark Angelone of the Materials Characterization Lab (Penn State) helpedwith ICP-AES, ICP-MS, and electron microprobe analyses respec-
tively. Thanks to J. Ruiz at the University of Arizona for support andaccess to the W.M. Keck Foundation analytical facility. We thank M.
Baker for help in keeping this facility running. Special thanks to theGCA reviewers for their valuable comments and suggestions. Thiswork was funded by Department of Energy grant DE-FG02–95ER14547 to Susan L. Brantley and Carlo G. Pantano, and a Geo-logical Society of America grant to Simmy Yau.
Associate Editor: L. M. Walter
REFERENCES
Aberg G., Jacks G., and Hamilton P. J. (1989) Weathering rates and87Sr/ 86 Sr ratios: an isotopic approach. Journal of Hydrology 109,65–78.
Anders E. and Grevesse N. (1989) Abundances of the elements: me-
teoritic and solar. Geochim. Cosmochim. Acta 53, 197–214.Aubert D., Stille P., and Probst A. (2001) REE fractionation during
granite weathering and removal by waters and suspended loads: Srand Nd isotopic evidence. Geochim. Cosmochim. Acta 65, 387– 406.
Banfield J. F. and Eggleton R. A. (1990) Analytical transmission
electron microscope studies of plagioclase, muscovite, and K-felds-par weathering. Clays and Clay Minerals 38, 77– 89.
Barber L. B. II (1985) Geochemistry of organic and inorganic com-
pounds in a sewage contaminated aquifer, Cape Cod, Massachusetts.Ph.D dissertation, University of Colorado.
Barber L. B., II, Thurman E. M., and Runnells D. D. (1992) Geochemi-cal heterogeneity in a sand and gravel aquifer: Effect of sedimentmineralogy and particle size on the sorption of chlorobenzenes.
Journal of Contaminant Hydrology 9, 35–54.Bau M. (1996) Controls on the fractionation of isovalent trace elements
in magmatic and aqueous systems: evidence from Y/Ho, Zr/Hf, andlanthanide tetrad effect. Contributions to Mineralogy and Petrology
123, 323–333.
Bau M. (1999) Scavenging of dissolved yttrium and rare earths byprecipitating iron oxyhydroxide: experimental evidence for Ce oxi-dation, Y-Ho fractionation, and lanthanide tetrad effect. Geochim.
Cosmochim. Acta 63, 67–77.Bau M. and Dulski P. (1996) Distribution of yttrium and rare-earth
elements in the Penge and Kuruman iron-formations, TransvaalSupergroup, South Africa. Precambrian Research 79, 37–55.
Bau M., Koschinsky A., Dulski P., and Hein J. R. (1996) Comparison
of the partitioning behaviours of yttrium, rare earth elements, andtitanium between hydrogenetic marine ferromanganese crusts and
seawater. Geochim. Cosmochim. Acta 60, 1709 –1725.Bau M., Romer R. L., Luders V., and Dulski P. (2003) Tracing element
sources of hydrothermal mineral deposits: REE and Y distribution
and Sr-Nd-Pb isotopes in fluorite from MVT deposits in the PennineOrefield, England. Mineralium Deposita 38, 992–1008.
Bethke C. M. (2002) The Geochemist ’s Workbench. University of
Illinois at Urbana-Champaign.Betts J. and Grandstaff D. E. (2001) Glauconite dissolution rates and
the chemical evolution of vadose waters in the Hornerstown Forma-tion, Hornerstown, New Jersey. Water-Rock Interaction 2001 363–366. Abstract Volume.
Blum A. E. and Stillings L. L. (1995) Feldspar dissolution kinetics. In Reviews in Mineralogy (ed. P. H. Ribbe), Vol. 31, pp. 291–351.
Mineralogical Society of America.
Blum J. D., Erel Y., and Brown K. (1993) 87Sr/ 86 Sr ratios of Sierra
Nevada stream waters: implications for relative mineral weatheringrates. Geochim. Cosmochim. Acta 57, 5019 –5025.
Blum J. D., Gazis C. A., Jacobson A. D., and Chamberlain C. P. (1998)
Carbonate versus silicate weathering in the Raikhot watershed withinthe High Himalayan Crystalline Series. Geology 26, 411– 414.
Brantley S. L., Chesley J. T., and Stillings L. L. (1998) Isotopic ratiosand release rates of strontium measured from weathering feldspars.
Geochim. Cosmochim. Acta 62, 1493–1500.Bullen T. D., Krabbenhoft D. P., and Kendall C. (1996) Kinetic and
mineralogic controls on the evolution of groundwater chemistry and87Sr/ 86Sr in a sandy silicate aquifer, northern Wisconsin, USA.
Geochim. Cosmochim. Acta 60, 1807–1821.
Bullen T. D., White A. F., Blum A. E., Harden J. W., and Schulz M. S.(1997) Chemical weathering of a soil chronosequence on granitoid
alluvium: II. Mineralogic and isotopic constraints on the behavior of strontium. Geochim. Cosmochim. Acta 61, 291–306.
Clauer N., Keppens E., and Stille P. (1992) Sr isotopic constraints onthe process of glauconitization. Geology 20, 133–136.
Clemens S. C., Gromet L. P., and Farrell J. W. (1995) Artefacts in Srisotope records. Nature 373, 201.
Clow D. W., Mast M. A., Bullen T. D., and Turk J. T. (1997) Strontium
87/strontium 86 as a tracer of mineral weathering reactions andcalcium sources in an alpine/subalpine watershed, Loch Vale, Col-
orado. Water Resources Research 33, 1335–1351.Coston J. A., Fuller C. C., and Davis J. A. (1995) Pb2ϩ and Zn2ϩ
adsorption by a natural aluminum-bearing and iron-bearing surfacecoating on an aquifer sand. Geochim. Cosmochim. Acta 59, 3535–3547.
Courbe C., Velde B., and Meunier A. (1981) Weathering of glauco-nites: reversal of the glauconitization process in a soil profile in
western France. Clay Minerals 16, 231–243.Deer W. A., Howie R. A., and Zussman J. (1992) An Introduction to the
Rock-Forming Minerals. John Wiley & Sons, Inc, New York.DeSimone L. A., Howes B. L., and Barlow P. M. (1997) Mass-balance
analysis of reactive transport and cation exchange in a plume of wastewater-contaminated groundwater. Journal of Hydrology 203,228 –249.
Douville E., Bienvenu P., Charlou J. L., Donval J. P., Fouquet Y.,Appriou P., and Gamo T. (1999) Yttrium and rare earth elements in
fluids from various deep-sea hydrothermal systems. Geochim. Cos-
mochim. Acta 63, 627– 643.Dulski P. (1994) Interferences of oxide, hydroxide and chloride analyte
species in the determination of rare earth elements in geological
samples by inductively coupled plasma-mass spectrometry. Frese-
nius J. Anal. Chem. 350, 194 –203.
English N. B., Quade J., DeCelles P. G., and Garzione C. N. (2000)
Geologic control of Sr and major element chemistry in Himalayanrivers, Nepal. Geochim. Cosmochim. Acta 64, 2549 –2566.
Govindaraju K. (1994) Compilation of working values and sampledescription for 383 geostandards. Geostandards Newsletter 18, 158.
Harris W. B. (1982) Rubidium-strontium glaucony ages, southeasternAtlantic Coastal Plain, USA. In Numerical Dating in Stratigraphy
(ed. G. S. Odin), pp. 593– 606. John Wiley & Sons.Herut B., Starinsky A., and Katz A. (1993) Strontium in rainwater from
Israel: sources, isotopes and chemistry. Earth and Planetary Science
Letters 120, 77– 84.
Huang P. M. (1989) Feldspars, olivines, pyroxenes, and amphiboles. In Minerals in Soil Environments (Soil Science Society of America
Book Series) (eds. J. B. Dixon and S. B. Weed), pp. 975 –1050. Soil
Science Society of Amer.Irber W. (1996) Laugungsexperimente an peraluminischen Graniten
als Sonde fu r Alterationsprozesse im finalen Stadium der Granitkri-
stallisation mit Anwendung auf das Rb-Sr-Isotopensystem. Ph.D
dissertation, Free University of Berlin.Jacobson A. D. and Blum J. D. (2000) Ca/Sr and 87Sr/ 86Sr geochem-
istry of disseminated calcite in Himalayan silicate rocks from NangaParbat: Influence on river-water chemistry. Geology 28, 463– 466.
Jang Y. D. and Naslund H. R. (2001) Major and trace element com-position of Skaergaard plagioclase; geochemical evidence for
changes in magma dynamics during the final stage of crystallizationof the Skaergaard intrusion. Contributions to Mineralogy and Pe-
trology 140, 441– 457.
1212 M. Bau et al.
7/30/2019 REE mineral dissolution Cape Cod
http://slidepdf.com/reader/full/ree-mineral-dissolution-cape-cod 15/18
Johannesson K. H. and Hendry M. J. (2000) Rare earth element
geochemistry of groundwaters from a thick till and clay-rich aquitardsequence, Saskatchewan, Canada. Geochim. Cosmochim. Acta 64,1493–1509.
Johnson J. W., Oelkers E. H. and Helgeson H. C. (1991) SUPCRT92:A software package for calculating the standard molal thermody-
namic properties of minerals, gases, aqueous species and reactionsfrom 1 to 5000 bar and 0o to 1000o C. Earth Sciences Dept.,
Lawrence Livermore Laboratory, 101 p.Johnson T. M. and DePaolo D. J. (1997) Rapid exchange effects onisotope ratios in groundwater systems, 2, Flow investigation using Sr
isotope ratios. Water Resources Research 33, 197–209.Johnson T. M., Roback R. C., McLing T. L., Bullen T. D., DePaolo
D. J., Doughty C., Hunt R. J., Smith R. W., Cecil L. D., and Murrell
M. T. (2000) Groundwater “fast paths” in the Snake River Plainaquifer: Radiogenic isotope ratios as natural groundwater tracers.
Geology 28, 871– 874.
Kent D. B., Davis J. A., Anderson L. C. D., Rea B. A. and Waite, T. D.(1994) Transport of chromium and selenium in the suboxic zone of
a shallow aquifer: Influence of redox and adsorption reactions. Water Resources Research 30, 1099 –1114.
LeBlanc D. R. (1984) Sewage plume in a sand and gravel aquifer, Cape
Cod, Massachusetts. In U.S. Geological Survey Water-Supply Paper Report 2218, 28.
LeBlanc D. R., Garabedian S. P., Hess K. M., Gelhar L. W., QuadriR. D., Stollenwerk K. G., and Wood W. W. (1991) Large-scalenatural gradient tracer test in sand and gravel, Cape Cod, Massachu-
setts, 1, Experimental design and observed tracer movement. Water Resources Research 27, 895–910.
Masterson J. P., Walter D. A. and Savoie J. (1996) Use of particle
tracking to improve numerical model calibration and to analyzeground-water flow and contaminant migration, Massachusetts Mili-
tary Reservation, western Cape Cod, Massachusetts. U. S. Geologi-cal Survey Water-Supply Paper Report 2482, 50.
McKay G. A. (1989) Partitioning of rare earth elements between major
silicate minerals and basaltic melts. In Reviews in Mineralogy (ed.P. H. Ribbe), Vol. 21, pp. 45–77. Mineralogical Society of America.
McLennan S. M. (1989) Rare earth elements in sedimentary rocks;influence of provenance and sedimentary processes. In Reviews in Mineralogy (ed. P. H. Ribbe), Vol. 21, pp. 169 –200. Mineralogical
Society of America.
Michard A., Albarede F., Michard G., Minster J. F., and Charlou J. L.(1983) Rare-earth elements and uranium in high-temperature solu-
tions from East Pacific Rise hydrothermal vent field (13 degrees N).
Nature 303, 795–797.
Miller E. K., Blum J. D., and Friedland A. J. (1993) Determination of soil exchangeable-cation loss and weathering rates using Sr isotopes.
Nature 362, 438 – 441.
Millot R., Gaillardet J., Dupre B., and Allegre C. J. (2002) The globalcontrol of silicate weathering rates and the coupling with physical
erosion; new insights from rivers of the Canadian Shield. Earth and Planetary Science Letters 196, 83–98.
Moller P., Dulski P., Gerstenberger H., Morteani G., and Fuganti A.
(1998) Rare earth elements, yttrium and H, O, C, Sr, Nd and Pbisotope studies in mineral waters and corresponding rocks fromNW-Bohemia, Czech Republic. Applied Geochemistry 13, 975–994.
Moller P., Dulski P., Bau M., Knappe A., Pekdeger A. and Sommer-
von Jarmersted C. (2000) Anthropogenic gadolinium as a conserva-tive tracer in hydrology. In Proceedings of Geo fl uids III; Third International Conference on Fluid Evolution, Migration and Inter-action in Sedimentary Basins and Orogenic Belts (ed. J. J. Pueyo, E.
Cardellach, K. Bitzer and C. Taberner), pp. 409 – 414, Elsevier.Negrel P., Guerrot C., Cocherie A., Azaroual M., Brach M., and
Fouillac C. (2000) Rare earth elements, neodymium and strontium
isotopic systematics in mineral waters; evidence from the Massif
Central, France. Applied Geochemistry 15, 1345–1367.Nesbitt H. W., Fedo C. M., and Young G. M. (1997) Quartz and
feldspar stability, steady and non-steady-state weathering, and petro-
genesis of siliciclastic sands and muds. Journal of Geology 105,173–191.
Ohta A. and Kawabe I. (2001) REE(III) adsorption onto Mn dioxide(␦-MnO2) and Fe oxyhydroxide: Ce(III) oxidation by ␦-MnO2.
Geochim. Cosmochim. Acta 65, 695–703.Oldale R. N. (1969) Seismic investigations on Cape Cod, Martha’sVineyard and Nantucket, Massachusetts and a topographic map of
the basement surface from Cape Cod Bay to the islands. GeologicalSurvey Research 1969 Chap. B, U. S. Geological Survey. Prof. Pap.,Report: P0650-B, pp. B122–B127.
Probst A., El Gh’mari A., Aubert D., Fritz B., and McNutt R. (2000)Strontium as a tracer of weathering processes in a silicate catchmentpolluted by acid atmospheric inputs, Strengbach, France. Chem.Geol 170, 203–219.
Proust D. and Velde B. (1978) Beidellite crystallization from plagio-
clase and amphibole precursors; local and long-range equilibriumduring weathering. Clay Minerals 13, 199 –209.
Quade J., Roe L., DeCelles P. G., and Ojha T. P. (1997) The late
Neogene 87Sr/ 86Sr record of lowland Himalayan rivers. Science 276,1828 –1831.
Rimstidt J. D. (1997) Quartz solubility at low temperatures. Geochim.Cosmochim. Acta 61, 2553–2558.
Rodgers G. P. and Holland H. D. (1979) Weathering products within
microcracks in feldspars. Geology 7, 278 –280.Savoie J. and LeBlanc D. R. (1998) Water-quality data and methods of
analysis for samples collected near a plume of sewage-contaminated
ground water, Ashumet Valley, Cape Cod, Massachusetts, 1993–94.
U. S. Geological Survey, pp. 208. Report: WRI97-4269.
Shapiro S. D., LeBlanc D., Schlosser P., and Ludin A. (1999) Charac-terizing a sewage plume using the 3H-3He dating technique. Ground Water 37, 861– 878.
Solomon D. K., Poreda R. J., Cook P. G., and Hunt A. (1995) Sitecharacterization using 3H/ 3He ground-water ages, Cape Cod, MA.
Ground Water 33, 988 –996.Stille P. and Clauer N. (1994) The process of glauconitization; chem-
ical and isotopic evidence. Contributions to Mineralogy and Petrol-
ogy 117, 253–262.
Taboada T. and Garcia C. (1999) Smectite formation produced byweathering in a coarse granite saprolite in Galicia (NW Spain). In
Developments in Micromorphology (ed. J. J. M. van der Meer andH. J. Muecher), Vol. 35, pp. 281–290, Catena-Verlag Rohdenburg.
Tessier A., Campbell P. G. C., and Bisson M. (1979) Sequentialextraction procedure for the speciation of particulate trace metals.
Analytical Chemistry 51, 844 – 850.
Thurman E. M., Barber L. B., Jr, and LeBlanc D. R. (1986) Movementand fate of detergents in groundwater: a field study. Journal of
Contaminant Hydrology 1, 143–161.Tricca A., Stille P., Steinmann M., Kiefel B., Samuel J., and Eikenberg
J. (1999) Rare earth elements and Sr and Nd isotopic compositions
of dissolved and suspended loads from small river systems in theVosges Mountains (France), the river Rhine and groundwater. Chem.
Geol. 160, 139 –158.
White A. F., Bullen T. D., Schulz M. S., Blum A. E., Huntington T. G.,
and Peters N. E. (2001) Differential rates of feldspar weathering ingranitic regoliths. Geochim. Cosmochim. Acta 65, 847– 869.
Wolff R. G. (1967) X-ray and chemical study of weathering glauconite.
American Mineralogist 52, 1129 –1138.
Yau S. (1999) Dissolution kinetics of feldspar in the Cape Cod Aquifer,Massachusetts; calculations of ground water residence times. Mas-
ter’s thesis, The Pennsylvania State University.
1213Mineral dissolution in the Cape Cod aquifer
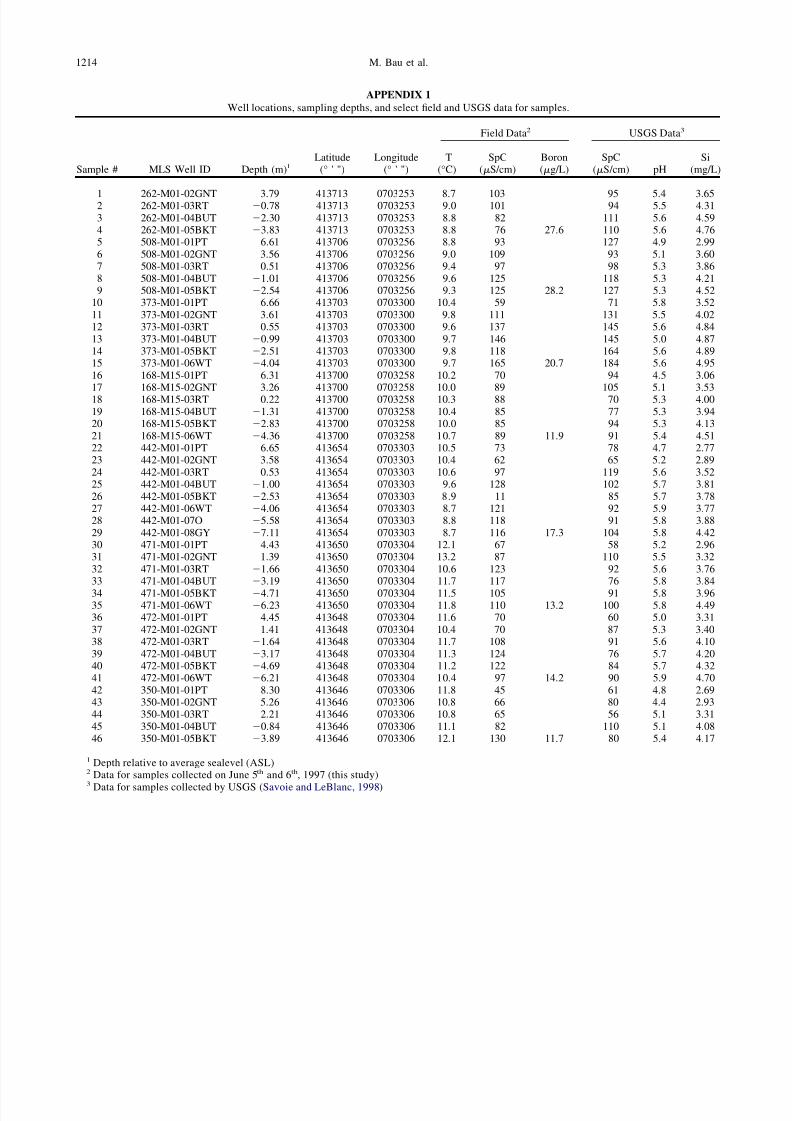
7/30/2019 REE mineral dissolution Cape Cod
http://slidepdf.com/reader/full/ree-mineral-dissolution-cape-cod 16/18
APPENDIX 1
Well locations, sampling depths, and select field and USGS data for samples.
Sample # MLS Well ID Depth (m)1Latitude
(° ' ")Longitude
(° ' ")
Field Data2 USGS Data3
T(°C)
SpC(S/cm)
Boron(g/L)
SpC(S/cm) pH
Si(mg/L)
1 262-M01-02GNT 3.79 413713 0703253 8.7 103 95 5.4 3.652 262-M01-03RT Ϫ0.78 413713 0703253 9.0 101 94 5.5 4.31
3 262-M01-04BUT Ϫ2.30 413713 0703253 8.8 82 111 5.6 4.594 262-M01-05BKT Ϫ3.83 413713 0703253 8.8 76 27.6 110 5.6 4.765 508-M01-01PT 6.61 413706 0703256 8.8 93 127 4.9 2.99
6 508-M01-02GNT 3.56 413706 0703256 9.0 109 93 5.1 3.607 508-M01-03RT 0.51 413706 0703256 9.4 97 98 5.3 3.86
8 508-M01-04BUT Ϫ1.01 413706 0703256 9.6 125 118 5.3 4.219 508-M01-05BKT Ϫ2.54 413706 0703256 9.3 125 28.2 127 5.3 4.52
10 373-M01-01PT 6.66 413703 0703300 10.4 59 71 5.8 3.52
11 373-M01-02GNT 3.61 413703 0703300 9.8 111 131 5.5 4.0212 373-M01-03RT 0.55 413703 0703300 9.6 137 145 5.6 4.84
13 373-M01-04BUT Ϫ0.99 413703 0703300 9.7 146 145 5.0 4.8714 373-M01-05BKT Ϫ2.51 413703 0703300 9.8 118 164 5.6 4.8915 373-M01-06WT Ϫ4.04 413703 0703300 9.7 165 20.7 184 5.6 4.95
16 168-M15-01PT 6.31 413700 0703258 10.2 70 94 4.5 3.06
17 168-M15-02GNT 3.26 413700 0703258 10.0 89 105 5.1 3.5318 168-M15-03RT 0.22 413700 0703258 10.3 88 70 5.3 4.00
19 168-M15-04BUT Ϫ1.31 413700 0703258 10.4 85 77 5.3 3.9420 168-M15-05BKT Ϫ2.83 413700 0703258 10.0 85 94 5.3 4.13
21 168-M15-06WT Ϫ4.36 413700 0703258 10.7 89 11.9 91 5.4 4.5122 442-M01-01PT 6.65 413654 0703303 10.5 73 78 4.7 2.7723 442-M01-02GNT 3.58 413654 0703303 10.4 62 65 5.2 2.89
24 442-M01-03RT 0.53 413654 0703303 10.6 97 119 5.6 3.5225 442-M01-04BUT Ϫ1.00 413654 0703303 9.6 128 102 5.7 3.81
26 442-M01-05BKT Ϫ2.53 413654 0703303 8.9 11 85 5.7 3.7827 442-M01-06WT Ϫ4.06 413654 0703303 8.7 121 92 5.9 3.7728 442-M01-07O Ϫ5.58 413654 0703303 8.8 118 91 5.8 3.88
29 442-M01-08GY Ϫ7.11 413654 0703303 8.7 116 17.3 104 5.8 4.4230 471-M01-01PT 4.43 413650 0703304 12.1 67 58 5.2 2.9631 471-M01-02GNT 1.39 413650 0703304 13.2 87 110 5.5 3.32
32 471-M01-03RT Ϫ1.66 413650 0703304 10.6 123 92 5.6 3.7633 471-M01-04BUT Ϫ3.19 413650 0703304 11.7 117 76 5.8 3.84
34 471-M01-05BKT Ϫ4.71 413650 0703304 11.5 105 91 5.8 3.9635 471-M01-06WT Ϫ6.23 413650 0703304 11.8 110 13.2 100 5.8 4.4936 472-M01-01PT 4.45 413648 0703304 11.6 70 60 5.0 3.31
37 472-M01-02GNT 1.41 413648 0703304 10.4 70 87 5.3 3.4038 472-M01-03RT Ϫ1.64 413648 0703304 11.7 108 91 5.6 4.10
39 472-M01-04BUT Ϫ3.17 413648 0703304 11.3 124 76 5.7 4.2040 472-M01-05BKT Ϫ4.69 413648 0703304 11.2 122 84 5.7 4.3241 472-M01-06WT Ϫ6.21 413648 0703304 10.4 97 14.2 90 5.9 4.70
42 350-M01-01PT 8.30 413646 0703306 11.8 45 61 4.8 2.6943 350-M01-02GNT 5.26 413646 0703306 10.8 66 80 4.4 2.9344 350-M01-03RT 2.21 413646 0703306 10.8 65 56 5.1 3.31
45 350-M01-04BUT Ϫ0.84 413646 0703306 11.1 82 110 5.1 4.0846 350-M01-05BKT Ϫ3.89 413646 0703306 12.1 130 11.7 80 5.4 4.17
1 Depth relative to average sealevel (ASL)2 Data for samples collected on June 5th and 6th, 1997 (this study)
3 Data for samples collected by USGS (Savoie and LeBlanc, 1998)
1214 M. Bau et al.
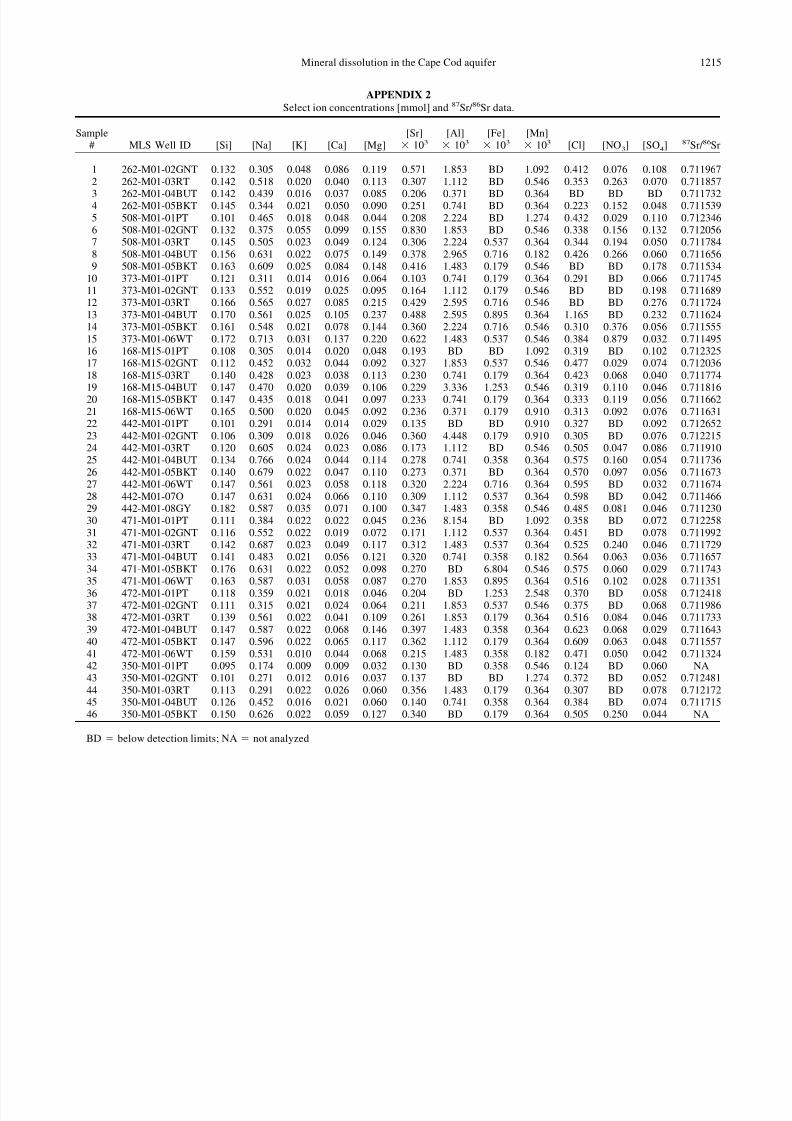
7/30/2019 REE mineral dissolution Cape Cod
http://slidepdf.com/reader/full/ree-mineral-dissolution-cape-cod 17/18
APPENDIX 2
Select ion concentrations [mmol] and 87Sr/ 86Sr data.
Sample# MLS Well ID [Si] [Na] [K] [Ca] [Mg]
[Sr]
ϫ 103[Al]
ϫ 103[Fe]
ϫ 103[Mn]
ϫ 103 [Cl] [NO3] [SO4] 87Sr/ 86Sr
1 262-M01-02GNT 0.132 0.305 0.048 0.086 0.119 0.571 1.853 BD 1.092 0.412 0.076 0.108 0.711967
2 262-M01-03RT 0.142 0.518 0.020 0.040 0.113 0.307 1.112 BD 0.546 0.353 0.263 0.070 0.711857
3 262-M01-04BUT 0.142 0.439 0.016 0.037 0.085 0.206 0.371 BD 0.364 BD BD BD 0.7117324 262-M01-05BKT 0.145 0.344 0.021 0.050 0.090 0.251 0.741 BD 0.364 0.223 0.152 0.048 0.711539
5 508-M01-01PT 0.101 0.465 0.018 0.048 0.044 0.208 2.224 BD 1.274 0.432 0.029 0.110 0.7123466 508-M01-02GNT 0.132 0.375 0.055 0.099 0.155 0.830 1.853 BD 0.546 0.338 0.156 0.132 0.7120567 508-M01-03RT 0.145 0.505 0.023 0.049 0.124 0.306 2.224 0.537 0.364 0.344 0.194 0.050 0.711784
8 508-M01-04BUT 0.156 0.631 0.022 0.075 0.149 0.378 2.965 0.716 0.182 0.426 0.266 0.060 0.7116569 508-M01-05BKT 0.163 0.609 0.025 0.084 0.148 0.416 1.483 0.179 0.546 BD BD 0.178 0.711534
10 373-M01-01PT 0.121 0.311 0.014 0.016 0.064 0.103 0.741 0.179 0.364 0.291 BD 0.066 0.71174511 373-M01-02GNT 0.133 0.552 0.019 0.025 0.095 0.164 1.112 0.179 0.546 BD BD 0.198 0.71168912 373-M01-03RT 0.166 0.565 0.027 0.085 0.215 0.429 2.595 0.716 0.546 BD BD 0.276 0.711724
13 373-M01-04BUT 0.170 0.561 0.025 0.105 0.237 0.488 2.595 0.895 0.364 1.165 BD 0.232 0.71162414 373-M01-05BKT 0.161 0.548 0.021 0.078 0.144 0.360 2.224 0.716 0.546 0.310 0.376 0.056 0.711555
15 373-M01-06WT 0.172 0.713 0.031 0.137 0.220 0.622 1.483 0.537 0.546 0.384 0.879 0.032 0.71149516 168-M15-01PT 0.108 0.305 0.014 0.020 0.048 0.193 BD BD 1.092 0.319 BD 0.102 0.71232517 168-M15-02GNT 0.112 0.452 0.032 0.044 0.092 0.327 1.853 0.537 0.546 0.477 0.029 0.074 0.712036
18 168-M15-03RT 0.140 0.428 0.023 0.038 0.113 0.230 0.741 0.179 0.364 0.423 0.068 0.040 0.711774
19 168-M15-04BUT 0.147 0.470 0.020 0.039 0.106 0.229 3.336 1.253 0.546 0.319 0.110 0.046 0.71181620 168-M15-05BKT 0.147 0.435 0.018 0.041 0.097 0.233 0.741 0.179 0.364 0.333 0.119 0.056 0.711662
21 168-M15-06WT 0.165 0.500 0.020 0.045 0.092 0.236 0.371 0.179 0.910 0.313 0.092 0.076 0.71163122 442-M01-01PT 0.101 0.291 0.014 0.014 0.029 0.135 BD BD 0.910 0.327 BD 0.092 0.712652
23 442-M01-02GNT 0.106 0.309 0.018 0.026 0.046 0.360 4.448 0.179 0.910 0.305 BD 0.076 0.71221524 442-M01-03RT 0.120 0.605 0.024 0.023 0.086 0.173 1.112 BD 0.546 0.505 0.047 0.086 0.71191025 442-M01-04BUT 0.134 0.766 0.024 0.044 0.114 0.278 0.741 0.358 0.364 0.575 0.160 0.054 0.711736
26 442-M01-05BKT 0.140 0.679 0.022 0.047 0.110 0.273 0.371 BD 0.364 0.570 0.097 0.056 0.71167327 442-M01-06WT 0.147 0.561 0.023 0.058 0.118 0.320 2.224 0.716 0.364 0.595 BD 0.032 0.711674
28 442-M01-07O 0.147 0.631 0.024 0.066 0.110 0.309 1.112 0.537 0.364 0.598 BD 0.042 0.71146629 442-M01-08GY 0.182 0.587 0.035 0.071 0.100 0.347 1.483 0.358 0.546 0.485 0.081 0.046 0.71123030 471-M01-01PT 0.111 0.384 0.022 0.022 0.045 0.236 8.154 BD 1.092 0.358 BD 0.072 0.712258
31 471-M01-02GNT 0.116 0.552 0.022 0.019 0.072 0.171 1.112 0.537 0.364 0.451 BD 0.078 0.71199232 471-M01-03RT 0.142 0.687 0.023 0.049 0.117 0.312 1.483 0.537 0.364 0.525 0.240 0.046 0.71172933 471-M01-04BUT 0.141 0.483 0.021 0.056 0.121 0.320 0.741 0.358 0.182 0.564 0.063 0.036 0.711657
34 471-M01-05BKT 0.176 0.631 0.022 0.052 0.098 0.270 BD 6.804 0.546 0.575 0.060 0.029 0.71174335 471-M01-06WT 0.163 0.587 0.031 0.058 0.087 0.270 1.853 0.895 0.364 0.516 0.102 0.028 0.711351
36 472-M01-01PT 0.118 0.359 0.021 0.018 0.046 0.204 BD 1.253 2.548 0.370 BD 0.058 0.71241837 472-M01-02GNT 0.111 0.315 0.021 0.024 0.064 0.211 1.853 0.537 0.546 0.375 BD 0.068 0.71198638 472-M01-03RT 0.139 0.561 0.022 0.041 0.109 0.261 1.853 0.179 0.364 0.516 0.084 0.046 0.711733
39 472-M01-04BUT 0.147 0.587 0.022 0.068 0.146 0.397 1.483 0.358 0.364 0.623 0.068 0.029 0.71164340 472-M01-05BKT 0.147 0.596 0.022 0.065 0.117 0.362 1.112 0.179 0.364 0.609 0.063 0.048 0.711557
41 472-M01-06WT 0.159 0.531 0.010 0.044 0.068 0.215 1.483 0.358 0.182 0.471 0.050 0.042 0.71132442 350-M01-01PT 0.095 0.174 0.009 0.009 0.032 0.130 BD 0.358 0.546 0.124 BD 0.060 NA43 350-M01-02GNT 0.101 0.271 0.012 0.016 0.037 0.137 BD BD 1.274 0.372 BD 0.052 0.712481
44 350-M01-03RT 0.113 0.291 0.022 0.026 0.060 0.356 1.483 0.179 0.364 0.307 BD 0.078 0.71217245 350-M01-04BUT 0.126 0.452 0.016 0.021 0.060 0.140 0.741 0.358 0.364 0.384 BD 0.074 0.71171546 350-M01-05BKT 0.150 0.626 0.022 0.059 0.127 0.340 BD 0.179 0.364 0.505 0.250 0.044 NA
BD ϭ below detection limits; NA ϭ not analyzed
1215Mineral dissolution in the Cape Cod aquifer
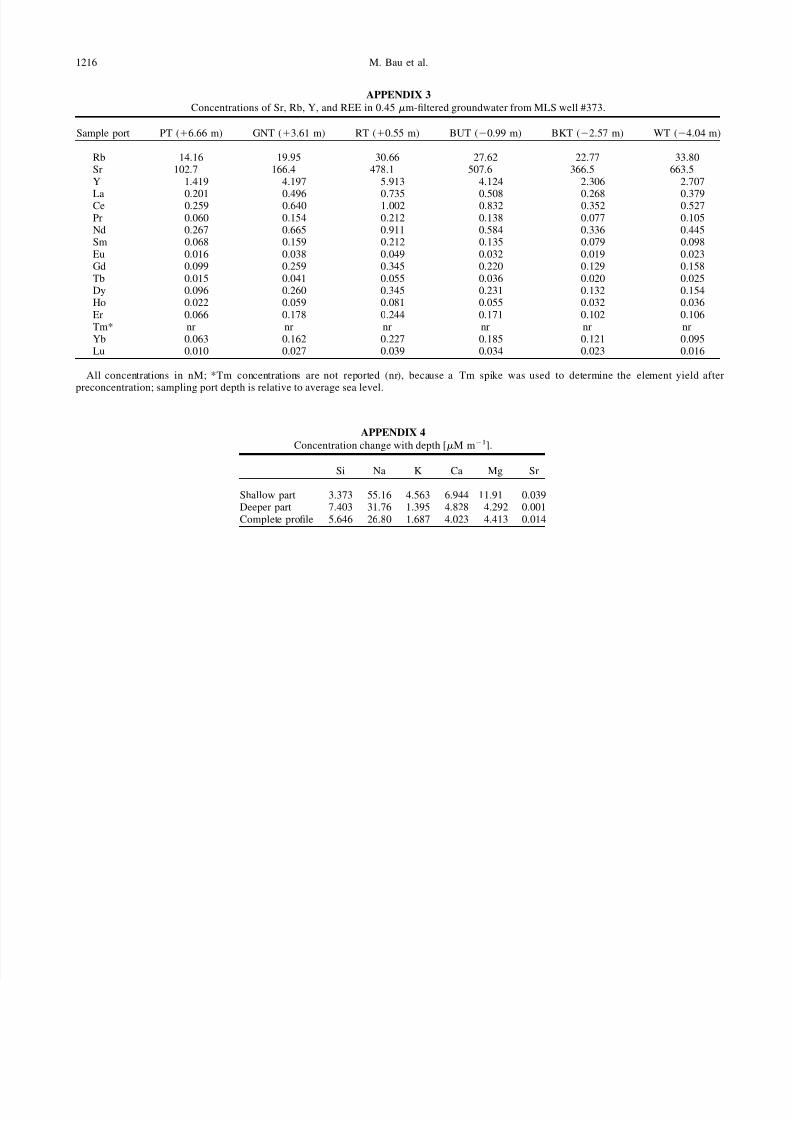
7/30/2019 REE mineral dissolution Cape Cod
http://slidepdf.com/reader/full/ree-mineral-dissolution-cape-cod 18/18
APPENDIX 3
Concentrations of Sr, Rb, Y, and REE in 0.45 m-filtered groundwater from MLS well #373.
Sample port PT (ϩ6.66 m) GNT (ϩ3.61 m) RT (ϩ0.55 m) BUT (Ϫ0.99 m) BKT (Ϫ2.57 m) WT (Ϫ4.04 m)
Rb 14.16 19.95 30.66 27.62 22.77 33.80Sr 102.7 166.4 478.1 507.6 366.5 663.5
Y 1.419 4.197 5.913 4.124 2.306 2.707
La 0.201 0.496 0.735 0.508 0.268 0.379Ce 0.259 0.640 1.002 0.832 0.352 0.527
Pr 0.060 0.154 0.212 0.138 0.077 0.105Nd 0.267 0.665 0.911 0.584 0.336 0.445Sm 0.068 0.159 0.212 0.135 0.079 0.098
Eu 0.016 0.038 0.049 0.032 0.019 0.023Gd 0.099 0.259 0.345 0.220 0.129 0.158
Tb 0.015 0.041 0.055 0.036 0.020 0.025Dy 0.096 0.260 0.345 0.231 0.132 0.154Ho 0.022 0.059 0.081 0.055 0.032 0.036
Er 0.066 0.178 0.244 0.171 0.102 0.106Tm* nr nr nr nr nr nr
Yb 0.063 0.162 0.227 0.185 0.121 0.095Lu 0.010 0.027 0.039 0.034 0.023 0.016
All concentrations in nM; *Tm concentrations are not reported (nr), because a Tm spike was used to determine the element yield after
preconcentration; sampling port depth is relative to average sea level.
APPENDIX 4
Concentration change with depth [M mϪ1].
Si Na K Ca Mg Sr
Shallow part 3.373 55.16 4.563 6.944 11.91 0.039Deeper part 7.403 31.76 1.395 4.828 4.292 0.001
Complete profile 5.646 26.80 1.687 4.023 4.413 0.014
1216 M. Bau et al.