reduction and speciation of monoglycerides to produce · pdf filereduction and speciation of...
TRANSCRIPT
i
Reduction and Speciation of Monoglycerides to produce high
quality biodiesel
Srikanth Rapaka
Thesis submitted to the
Faculty of Graduate and Post Doctoral Studies
In partial fulfillment of the requirements for the degree of
Master of Applied Science
In
Chemical Engineering
Department of Chemical and Biological Engineering
Faculty of Engineering
University of Ottawa
© Srikanth Rapaka, Ottawa, Canada 2012
ii
Abstract
Biodiesel is rapidly growing as a fuel of interest due to the various advantages it has over
conventional diesel fuel. While the pros – non-toxic, biodegradable, low green house gas
emissions seem advantageous, the major issue that plagues the use of biodiesel is its cold
weather operability. Biodiesel can present challenges in cold-weather operation, because
certain of its constituent compounds can form precipitates in the fuel. These precipitates can
cause undesired effects like plugging of fuel filters and deposits. This issue has been
attributed to the presence of impurities (mostly saturated monoglycerides, di-glycerides,
soap etc) in biodiesel and has been discussed in the literature. There is a move by users
and standards associations to implement more stringent norms and quality control to avoid
problems in the widespread use of biodiesel. This study involves ways to reduce MG’s in
biodiesel by mitigating to a greater extent the possibility of side reactions (formation of
soap). The effect of selective transesterification of oil as a function of alcohol, temperature
and catalyst concentration was also studied. Although saturated MG’s with high melting
points are a greater source of deposits, it can be hypothesized that the polymorphic nature
of unsaturated Monoglycerides could also be contributing to cold flow issues. It is hence
vital to make sure the biodiesel is free from all forms of monoglycerides. It was also seen
that there is very little specificity of selection of fatty acid types in the transesterification
reaction and that the amount and type of MGs present in the biodiesel is reflected by the
relative amount of fatty acids types present in the oil. In biodiesel derived from Canola oil, a
preponderance of monoolein was found for all runs. The initial runs carried out as a two
stage process using the membrane followed by batch reactor gave very low MG
concentrations, well below ASTM standards.
iii
Résumé
Le biodiesel se développe rapidement comme un carburant renouvelable en raison des
divers avantages qu'il a au-dessus du carburant diesel conventionnel. Les avantages de ce
carburant renouvelable- non-toxique, réduction d’émissions de particules et de gaz d’effet
de serre, semblent avantageux, ses performances réduites par temps froid limitent son
utilisation. Le biodiesel peut présenter des défis d'opération par temps-froid, parce qu'un
certain nombre de ses composés constitutifs peuvent former des précipités dans le
carburant. Ces précipités peuvent causer des effets peu désirés comme le colmatage de
filtres à essence. Cette issue a été attribuée à la présence des impuretés (la plupart du
temps monoglycérides saturés, diglycérides et savons) présentes dans le biodiesel. Il y a un
mouvement par des utilisateurs et des associations de normes pour mettre en application
des normes et un contrôle de qualité plus rigoureux pour éviter ces problèmes d'utilisation
par temps froid. Cette étude traite de façons d’éliminer ces impuretés dans le biodiesel en
atténuant dans une large mesure la possibilité des réactions secondaires (formation de
savon). L'effet de la transestérification sélective d'huile en fonction de la concentration
d’alcool, la température et de la concentration en catalyseur a été également étudié. Bien
que les monoglycérides saturés avec les points de fusion élevés soient une plus grande
source des dépôts, on peut présumer que la nature polymorphique des certains
monoglycérides insaturés pourrait également contribuer aux propriétés réduites par temps
froid. Il est par conséquent essentiel de s'assurer que le biodiesel est exempt de toutes les
formes de monoglycérides. On a également observé très peu de spécificité evers les
acides gras des glycérides dans la réaction de transestérification et que la quantité et le
type de monoglycérides dans le biodiesel est reflétée par la quantité relative de types
d'acides gras présents dans l'huile. Dans le biodiesel dérivé de l'huile de Canola, une
prépondérance de monooléine a été trouvée pour toutes les essais. Les essais initiaux

iv
effectués en deux stages utilisant un réacteur à membrane continu suivi d’un réacteur
discontinu ont donné des concentrations très basses en monglycérides, bien inférieures aux
normes d'ASTM.

v
Statement of Contributions of Collaborators
I hereby declare that I am the sole author of this thesis. I performed all the experiments and
the data analysis. I have written all the chapters contained in this thesis.
Dr. Andre Y. Tremblay supervised this thesis project and provided continual guidance and
support. He also made editorial comments and corrections to the written work presented.
His day-to-day supervisions, discussions and never ending support have resulted in
tremendous improvements of the thesis.

vi
To my parents

vii
Acknowledgements
I wish to express my deepest gratitude and sincere appreciation to my research supervisor,
Dr. Andre Tremblay for his continuous guidance in completion of this thesis. I am indebted
to him for the help he extended during my tough times over the two years of my program. I
enjoyed a great deal of freedom and it was a pleasure to work under him. Undoubtedly, I
consider myself lucky to work under a professor like him. I will always remember the support
he rendered, which was way far beyond the requirements of an academic supervisor.
I would also wish to thank the support staff within the department of Chemical and Biological
Engineering, Louis Tremblay, Gerard Nina and Franco Ziroldo, for their outstanding support
whenever I was faced with technical difficulties.
Finally, I wish to thank my parents, Ramesh Rapaka and Vijayalakshimi Rapaka, for their
constant support and encouragement during my tough times. I greatly acknowledge the
support extended by them financially but for which this program would have been a distant
dream. I would also want to thank my brother and sister-in-law for constant support in the
times of need. I am really thankful and consider myself fortunate to work and share thoughts
with such wonderful people.

viii
Table of Contents
Abstract ............................................................................................................................. ii
Résumé. ............................................................................................................................. iii
Statement of contributions of collaborators .......................................................................... v
Acknowledgments ............................................................................................................ vii
Table of contents .............................................................................................................. viii
List of Tables ......................................................................................................................xii
List of Figures .................................................................................................................. .xiii
Nomenclature .................................................................................................................... xv
Chapter 1 Introduction ..................................................................................................... 1
1.1 Introduction .................................................................................................................... 2
1.2 Objective ...................................................................................................................... 3
1.3 Thesis Structure ........................................................................................................... 5
Chapter 2 Overview of Biodiesel History ........................................................................ 6
2.1 Introduction .................................................................................................................. 7
2.2 History of biofuels. ........................................................................................................ 7
2.3 Diesel Engine. .............................................................................................................. 9
2.4 Diesel Combustion......................................................................................................... 9
2.5 Diesel Fuel .................................................................................................................. 10
2.6 Fuel Characteristics ..................................................................................................... 11
2.6.1 Soot formation .......................................................................................................... 11
2.6.2 Cetane number ......................................................................................................... 11
2.6.3 Emissions ................................................................................................................. 12
2.6.4 Viscosity ................................................................................................................... 12
2.6.5 Low temperature operation ........... ........................................................................... 14
ix
2.7 Summary............... .........................................................................................................14
Chapter 3 Transesterification Mechanisms and Biodiesel Production ........................ 15
3.1 Transesterification ....................................................................................................... 16
3.2 Feed Stocks................................................................................................................. 17
3.3 Alcohols and Catalyst .................................................................................................. 19
3.3.1 Alcohols .................................................................................................................... 19
3.3.2 Catalyst .................................................................................................................... 20
3.4 Reaction Mechanisms ................................................................................................. 22
3.4.1 Alkali Catalysed Transesterification .......................................................................... 22
3.4.2 Acid Catalysed Transesterification ............................................................................ 22
3.5 Saponification .............................................................................................................. 25
3.6 Biodiesel Production Process ...................................................................................... 26
3.6.1 Alkali Catalysed Transesterification .......................................................................... 26
3.6.2 High FFA feedstock .................................................................................................. 27
3.7 Biodiesel Purification ................................................................................................... 28
3.8 Analysis and Gas Chromatography ............................................................................. 28
3.8.1 Analysis .................................................................................................................... 28
3.8.2 Gas Chromatography ............................................................................................... 29
Chapter 4 Study on transesterification kinetics through continuous elution reactions
in a membrane reactor for speciation of monoglycerides ........................................... 31
4.1 Introduction .................................................................................................................. 33
4.2 Objectives .................................................................................................................... 35
4.3 Approach ..................................................................................................................... 36
4.3.1 Understanding triglycerides, di-glycerides and monoglycerides ................................ 36
4.3.2 Triglyceride profile of fats and oils ............................................................................. 38
4.4 Experiment .................................................................................................................. 40

x
4.4.1 Feed stock and Reagents ...................................................................................... 40
4.4.2 Experimental Setup ............................................................................................... 40
4.4.3 Membrane ............................................................................................................. 41
4.5 Experimental Procedure and Analytical Method ........................................................... 42
4.5.1 Procedure .............................................................................................................. 42
4.5.2 Analysis ................................................................................................................. 43
4.5.3 Analytical Methods ................................................................................................. 43
4.6 Results and Discussion ............................................................................................... 44
4.6.1 Triglyceride as a function of time ........................................................................... 45
4.6.2 Diglycerides as a function of time .......................................................................... 46
4.6.3 Monoglycerides as a function of time ..................................................................... 47
4.6.4 Fatty acid methyl ester concentration as a function of time .................................... 48
4.6.5 Monoglyceride and Polymorphism ......................................................................... 50
4.7 Conclusions ................................................................................................................. 52
Chapter 5 Study of multi-stage transesterification reaction for production of high
quality biodiesel .............................................................................................................. 53
5.1 Introduction .................................................................................................................. 55
5.2 Objectives .................................................................................................................... 57
5.3 Methods ...................................................................................................................... 58
5.3.1 Feed stock and Reagents ......................................................................................... 58
5.4 Experimental Setup ..................................................................................................... 59
5.4.1 Membrane Reactor Setup ......................................................................................... 59
5.4.2 Membrane ................................................................................................................ 60
5.5 Batch Reactor .............................................................................................................. 61
5.6 Experimental procedure and Analytical Method ........................................................... 62
5.6.1 Procedure ................................................................................................................. 62
xi
5.6.2 Analysis .................................................................................................................... 64
5.6.3 Analytical Methods .................................................................................................... 65
5.6.4 Sample preparation for analysis ................................................................................ 65
5.7 Batch Reactions .......................................................................................................... 66
5.8 Reaction Stages .......................................................................................................... 66
5.8.1 Stage two reactions with polar phase removed ......................................................... 67
5.8.2 Stage two reactions with polar phase retained .......................................................... 67
5.8.3 Stage three reactions with polar phase removed post stage two ............................... 68
5.9 Results and Discussions .............................................................................................. 69
5.9.1 Effect of catalyst concentration, temperature and methanol to oil ratio on soap
formation ........................................................................................................................... 69
5.9.2 Effect of catalyst concentration, temperature and methanol to oil ratio on purity ....... 70
5.10 Conclusions ............................................................................................................... 72
6.0 Conclusions ............................................................................................................... 74
6.1 Overall Conclusions ..................................................................................................... 74
6.2 Recommendations ....................................................................................................... 77
7.0 References ................................................................................................................. 78
8.0 Appendix A................................................................................................................. 81
xii
List of Tables
Table 2.1 List of hydrocarbons in crude oil (ATSDR, 1995; OTM, 1999; Myint 2007) ......... 10
Table 2.2 Comparison of viscosities of petrodiesel, biodiesel and various feedstocks
(Knothe et al. 1997) ........................................................................................................... 13
Table 3.1 List of common fatty acids present in vegetable oils and animal fats
(Tyson et al. 2004) ............................................................................................................. 17
Table 3.2 Fatty acid profile of vegetable oils and animal fats (Knothe et al. 1997) ............. 18
Table 3.3 Properties of C1- C4 alcohols ............................................................................ 19
Table 3.4 Comparative study of heterogeneous and homogenous catalysts
(Hastie 2010) ..................................................................................................................... 21
Table 3.5 List of standards used for GC analysis ............................................................... 29
Table 4.1 Fatty acid composition of some common edible fats and oils
(Knothe et al. 1997) ........................................................................................................... 38
Table 4.2 Position modelling of commercial soy bean oil ................................................... 50
Table 4.3 Melting point of unsaturated monoglycerides and their possible polymorphic
crystal forms (Baldwin et al. 1944) ..................................................................................... 51
Table 5.1 Chemicals used to prepare biodiesel ................................................................. 58
Table 5.2 Membrane reactor reaction conditions ............................................................... 62

xiii
List of Figures
Figure 1.1 Work energy demand by fuel (IEA, 2010 b) ........................................................ 2
Figure 2.1 Life Cycle Emissions of Petro Diesel and Biodiesel (NR Raje, 2006) .................. 8
Figure 3.1 Transesterification reaction (Van Gerpen et al. 2005) ....................................... 17
Figure 3.2 Reaction showing the interaction of sodium hydroxide and Methanol ............... 21
Figure 3.3 Three Step Transesterification Reaction ........................................................... 23
Figure 3.4 Mechanism of alkali catalysed transesterification reaction ................................ 24
Figure 3.5 Molecular structure of Soap (Myint, 2007) ....................................................... 25
Figure 3.6 Emulsion of Biodiesel in the polar phase in the presence of soap ..................... 25
Figure 3.7 Acid esterified pre-treatment for high FFA feedstock ........................................ 27
Figure 4.1 An example of Tri, di-glyceride and monoglyceride molecules. ......................... 37
Figure 4.2 Schematic representation of membrane reactor setup for elution studies and first
stage reactions .................................................................................................................. 41
Figure 4.3 Triglyceride concentration as a function of time ................................................ 45
Figure 4.4(a) Diglyceride concentration as a function of time at 50C ................................. 46
Figure 4.4(b) Diglyceride concentration as a function of time at 60C ................................. 47
Figure 4.5 Saturated and Unsaturated monoglycerides of Soy ester as a function of time . 48
Figure 4.6 Fatty acid ester profile of soy oil as a function of time at 50 C, oil to methanol
volume ration of 60:40. ...................................................................................................... 49
Figure 5.1 Transesterification Reaction (Van Gerpan 2005) .............................................. 56
Figure 5.2 Saponification reaction ................................................................................... 56
Figure 5.3 Schematic representation of membrane reactor setup for elution studies and first
stage reactions .................................................................................................................. 60
Figure 5.4 Batch reactor setup for biodiesel production .................................................... 61
Figure 5.5 List of runs performed in a batch reactor ........................................................... 66
xiv
Figure 5.6 Aproach 1 for multistage reactions .................................................................... 67
Figure 5.7 Approach 2 for multistage reactions .................................................................. 68
Figure 5.8 Approach 3 for multistage reactions ................................................................ 68
Figure 5.9 Catalyst concentration vs soap at different temperatures – Stage 2 polar phase
removed (Approach 1) ....................................................................................................... 69
Figure 5.10 Catalyst concentration Vs Soap - Stage 2 with polar phase retained
(Approach 2) ...................................................................................................................... 70
Figure 5.11 Monoglyceride concentration as a function of Catalyst concentration ............ 71
xv
Nomenclature
This nomenclature lists some of the most frequently used abbreviations in this thesis. It is not
meant to be exhaustive. Other abbreviations used in tables and figures are explained in the
text as they appear.
List of abbreviations
ASTM – American Society for Testing and Materials
CP – Cloud Point
CFPP – Cold filter plugging point
PP – Pour Point
DG – Diglyceride
EN – European standard
FAAE – Fatty acid alkyl ester
FAME – Fatty acid methyl ester
FFA – Free fatty acid
FID – Flame ionization detector
GC – Gas chromatography
kD – kilo Dalton
KF – Karl Fisher
MG – Monoglyceride
MSTFA – N-methyl-N-(trimethylsilyl) trifluoroacetamide
ppm – Parts per million
TG – Triglyceride
TMP – Transmembrane Pressure

1
Chapter 1
Introduction

2
Chapter 1
1.1 Introduction
The world energy demand is steadily increasing with each passing year. The majority of this
increase is met by conventional sources which include crude oil, coal, and natural gas. This
dependence on non-renewable sources is even more obvious when considering the energy
used for transportation where 94% of the demand is supplied by crude oil. (IEA, 2010)
Figure 1.1 Work energy demand by fuel (IEA, 2010 b)
Carbon dioxide is known to be one of the main contributors to global warming. Currently,
the transportation sector accounts for about 25% of global CO2 emissions and roughly 50%
of global oil consumption (IEA, 2010). Climate change, a repercussion of global warming,
and along with the dwindling petroleum reserves has raised global concerns regarding
energy sustainability and security. To combat this issue, the scientific and the industrial

3
world are shifting to using more renewable and less toxic fuels. As a result, biofuels, which
are receiving more interest for use as transportation fuels.
Biodiesel is a renewable and biodegradable fuel used in diesel engines produced from
vegetable oils and animal fats via alcohol transesterification using, for example, methanol or
ethanol. It is comprised of fatty acid alkyl esters (FAAE). The similarities biodiesel shares
with diesel fuel make it an interesting replacement to conventional fuel sources (Demirbas,
2003; Jehad 2010).
However, the main drawback of biodiesel is its cold weather operability. The presence of
saturated monoglycerides is widely reported as the reason for high cloud point of fatty acid
esters and it is widely accepted as a global issue plaguing the biodiesel industry.
Monoglycerides are impurities present in biodiesel that result from incomplete reaction.
They cannot be easily washed as they are amphiphilic in nature. There has been not much
work reported on reducing the monoglycerides concentrations below 0.1 wt%. Reaction
kinetics still remains a topic of low understanding. Therefore, work on the reduction and
speciation of monoglycerides to a great extent would invite great deal of interest as it would
improve the cold flow properties of biodiesel.
1.2 Objective
In this thesis project, the main objective was to develop a membrane process, where
components of fatty acid methyl esters are separated based on the reactivity. This would
provide a continuous process to improve the operability of biodiesel by removing saturated
monoglycerides during the reaction. It was postulated that saturated fatty acids chains are
relatively slow in reacting in comparison with unsaturated fatty acid chains. The idea was to
perform continuous elusion reaction studies, to see if speciation of saturated

4
monoglycerides was occurring as a function of time. Therefore, the specific objectives of the
project where,
(a) To select feedstocks low in saturated fatty acids and investigate the effect of
continuous elusion reactions in a membrane reactor.
(b) To investigate the effect of temperature on speciation.
(c) To investigate the effect of methanol to oil ratio on speciation.
(d) To investigate the effect of catalyst concentration on speciation.
A secondary objective was to study ways to greatly reduce the monoglyceride concentration
in the biodiesel thus improving the cold flow characteristics. With this objective in mind, and
based on the results from the above mentioned approach, the following steps were
performed.
(a) A multi stage transesterification process was developed with membrane reactor in
the first stage followed by batch reactor in the second.
(b) The effect of initial catalyst concentration in the membrane reactor was analysed
over two different configurations.
(c) The effect of temperature, catalyst concentration and methanol to oil ratio on the
biodiesel yield and purity in the second reactor were analysed.
(d) The system was studied to achieve highest purity and lowest yield loss at the lowest
catalyst concentration, methanol to oil ratio and temperature.

5
1.3 Thesis Structure
This thesis is divided into of six chapters.
In chapter 2, an overview of biodiesel history, chemistry, production and purification are
given. A comparative study on the properties of diesel and biodiesel is also presented.
Chapter 3 covers the problem definition related to the reaction of specific fatty acid chains is
presented. A review on available transesterification techniques and mechanisms and a
background on the work carried out is presented.
Chapter 4 is a manuscript of experimental work carried out. This chapter also discusses the
materials and analytical techniques used for speciation studies. The effects of variables
such as alcohol ratio, catalyst concentration and temperature were also studied. An
explanation to the results of the elution studies is presented.
Chapter 5 covers the second stage of work carried as part of my thesis. The performance of
multi-stage membrane and batch reactors are discussed in detail. Most papers in the
literature are concerned with single stage processes. These are of limited value industrially
as few if any industrial processes are run in a single stage. The results of this work will
provide new information previously unavailable in the literature pertaining to two stage
reactions.
The conclusions and recommendations and scope for future work are covered in chapter 6.

6
Chapter 2
Overview of Biodiesel History

7
Chapter 2
Overview of Biodiesel History
2.1 Introduction
Definition
Biodiesel is a clean burning, non-toxic, biodegradable renewable fuel that is usually
produced from vegetable oils and animal fat by a process of transesterification. It comprises
of fatty acid alkyl esters, resulting from the reaction of a triglyceride molecule with an
alcohol. The nomenclature is based upon the type of alcohol used, for e.g. if methanol is
used, biodiesel is called Fatty Acid Methyl Ester and so on. Biodiesel can be used in its
natural form (B100) or can be blended in different proportions with conventional diesel fuel.
The similarities biodiesel shares with conventional diesel fuel have drawn interest worldwide
as a promising alternative to the dwindling fossil based fuels (Demirbas, 2003). Going
forward, we shall briefly look into the history of biofuels, understand how the diesel engine
works and the similarities between conventional diesel fuel and the diesel fuel derived from
vegetable oils and animal fat.
2.2 History of Biofuels
The advent of use of biofuels as a source of alternate fuel is not contemporary in its nature.
Over a century ago, Rudolf Diesel tested vegetable oil as a fuel for his internal combustion
engine. In the engineering society meeting of St.Louis in 1912, he quotes:
“The use of vegetable oils for engine fuels may seem insignificant today. But such oils may
become in course of time as important as petroleum products of the present time”
8
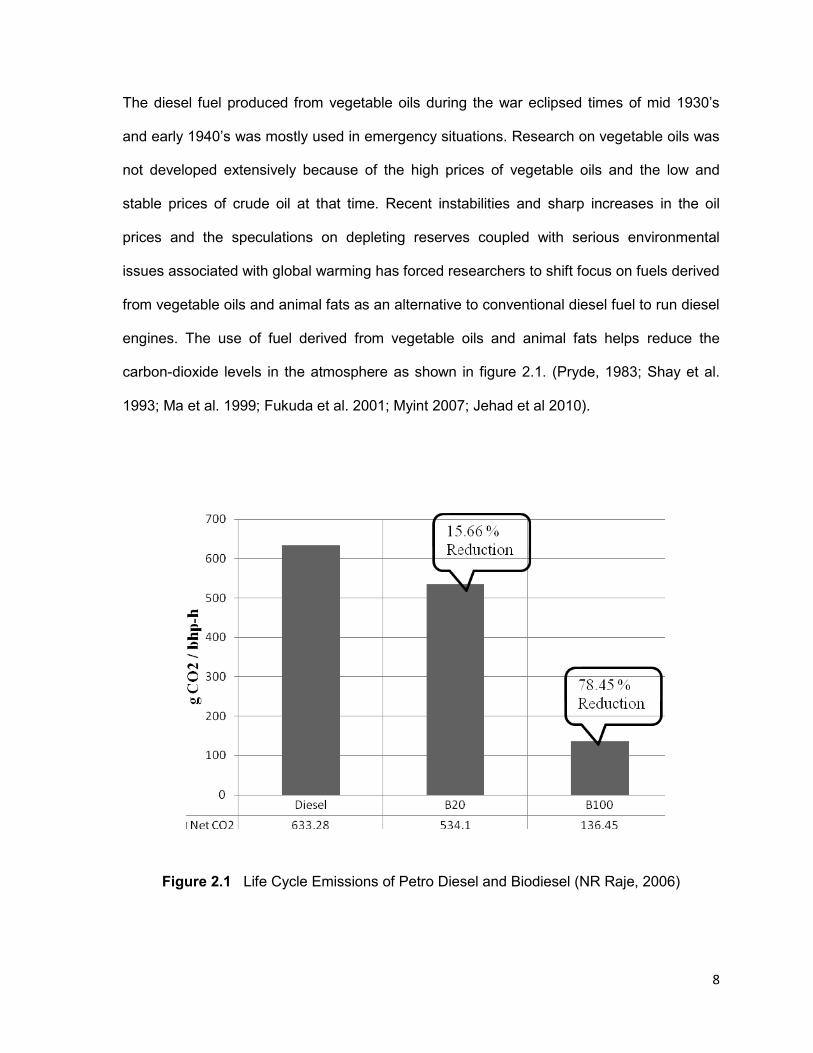
The diesel fuel produced from vegetable oils during the war eclipsed times of mid 1930’s
and early 1940’s was mostly used in emergency situations. Research on vegetable oils was
not developed extensively because of the high prices of vegetable oils and the low and
stable prices of crude oil at that time. Recent instabilities and sharp increases in the oil
prices and the speculations on depleting reserves coupled with serious environmental
issues associated with global warming has forced researchers to shift focus on fuels derived
from vegetable oils and animal fats as an alternative to conventional diesel fuel to run diesel
engines. The use of fuel derived from vegetable oils and animal fats helps reduce the
carbon-dioxide levels in the atmosphere as shown in figure 2.1. (Pryde, 1983; Shay et al.
1993; Ma et al. 1999; Fukuda et al. 2001; Myint 2007; Jehad et al 2010).
Figure 2.1 Life Cycle Emissions of Petro Diesel and Biodiesel (NR Raje, 2006)
9
2.3 Diesel Engine
Diesel engine has been the primary choice of engine for heavy duty applications ranging
from the agricultural industry to highway transport. The diesel’s durability, high torque
capacity and fuel efficiency could be attributed to its wide spread acceptance and use in
most demanding applications. Diesel engines in the United States consume more than 30
billion gallons of fuel every year and most of this fuel comes from conventional fossil based
sources. However, with dwindling petroleum reserves and with newer oil wells hard to
reach, biodiesel is fast growing as the fuel of replacement to fossil based diesel fuel. It is
important to understand the operating principles of a diesel engine to best understand the
fuel needs to consider biodiesel as a promising substitute. This chapter also looks at the
advantages and disadvantages biodiesel provides over fossil fuels. (Broge, J.L et al. 2002;
Van Gerpen et al. 2005)
2.4 Diesel Combustion
A diesel engine works significantly different from other internal combustion engines as it
does not require a spark plug for fuel ignition. The fuel is ignited by compression and that is
the reason they are also known as compression – ignited engines. In spark-ignited engines,
mostly used where the fuel is gasoline (petrol), fuel and air are compressed to stoichometric
proportions and then ignited by a spark. But, in the case of diesel engines, the air is
compressed to high temperature and pressure, and then fuel, finely atomised is sprayed in
the combustion chamber at high velocity causing auto ignition. The power of the engine is
basically controlled by varying the amount of fuel injected into the cylinder, thus ruling out
the necessity of a throttle (Van Gerpen et al. 2005).

10
2.5 Diesel Fuel
ATSDR (1995) reports that diesel fuel derived from petroleum is mainly composed of 64 %
aliphatic hydrocarbons, 35% aromatic hydrocarbons and approximately 1-2% olefinic
hydrocarbons. However, the composition is variable resulting from different refining and
blending processes. The hydrocarbons contained in crude oil can be divided into 5 groups,
of which 3 groups are predominant and 2 are minor. Table 2.1 shows the list of groups and
their properties (OTM, 1999; Myint. 2007)
Table 2.1 List of hydrocarbons in crude oil (ATSDR, 1995; OTM, 1999; Myint 2007)
Hydrocarbons General Formula Chain Type Physical State Examples
Paraffins CnH2n+2 Linear or
Branched
Gas or Liquid Methane,
Propane,
Hexane
Aromatic
One or more
benzene
rings with
long chain
hydrocarbons
Liquid Naphthalene
Naphtenes CnH2n-2 Polycyclic
aromatic
hydrocarbon
Liquid Cyclo hexane
Alkenes CnH2n Unsaturated
hydrocarbon
Gas or Liquid Butene
Ethene
Dienes and
Alkynes
CnHn Triple Bonds Gas or Liquid Acetylene
11
2.6 Fuel Characteristics
2.6.1 Soot Formation
In order to obtain optimum fuel efficiency and low emissions, it is necessary to control the
timing of the combustion process. The heterogeneous mixture of fuel and air in the cylinder
during combustion is the main contributing factor to soot particle formation. They are formed
in the high temperature regions of the combustion chamber and the poly cyclic aromatic
hydrocarbons in soot are known to be human carcinogens. Biodiesel on the other hand,
produces less soot as opposed to fossil based fuels and this can be associated to the bound
oxygen in the fuel. (Van Gerpen et al. 2005; IARC Summary and evaluation, 1985;
McCormick et al. 1987)
2.6.2 Cetane Number
The most important characteristic of a fuel, to be used in a diesel engine, is its ability to
auto-ignite readily with short delays. In other words, the fuel should have a high cetane
number. Fuels with high cetane numbers have shorter ignition delays and vice versa. Most
biodiesel fuels have a higher Cetane number than conventional diesel fuel. Biodiesel
derived from vegetable oils and animal fat high on saturated content have a higher cetane
number than the ones derived from oils rich in unsaturated content. For e.g. Soy bean oil,
high on unsaturated content has a cetane number of 48-52, whereas biodiesel from yellow
grease has a cetane number between 60 and 65. (Knothe et al. 1997; Van Gerpan et al.
1996)

12
2.6.3 Emissions
All carbon rich fuels burn to carbon-dioxide under ideal circumstances. However, if sulphur
is present, they can oxidise to form sulphur dioxide or sulphur trioxide which on interaction
with water vapour in the atmosphere will form sulphuric acid causing acid rain. According to
the US Environmental protection agency, the sulphur limit in diesel fuel should not exceed
500 ppm. Biodiesel from soy bean oil, on the other hand, is very low in sulphur and
contributes relatively less in sulphur dioxide emissions. Some feedstock’s like some animal
fat, high in sulphur content need to be pretreated to bring the levels down to Environmental
protection agency norms. (Van Gerpan et al. 2005)
2.6.4 Viscosity
Viscosity is a measure of resistance to the flow of a liquid. Higher viscosity is not desired as
it affects the atomisation of fuel upon injection in the combustion chamber. It is also an
important factor which determines the logistics and also storage conditions of the fuel. Some
of the most important issues related to high viscosity in an internal combustion engine can
be summarised by the following points.
(a) Carbon deposition
(b) Coking and trumpet formation
(c) Oil rink slicking and
(d) Lubricating issues
Vegetable oils and animal fats are generally characterised by high viscosity. Biodiesel,
transesterified oil, however has a lower viscosity than that of parent oil. The table below
compares viscosities of different vegetable oils, diesel fuel and biodiesel (Tyson et al. 2006).

13
There has been a considerable work carried out in predicting the viscosity of the fatty
materials and is reported by Van Gerpan et al. It is found that viscosity increases with
increase in degree of saturation. It also shows a positive trend with increase in chain length.
Factors like double bond configuration and type of alcohol used also impact viscosity. For
e.g. Ethyl esters have higher viscosity than the methyl esters and similarly cis configuration
gives a lower viscosity than the trans configuration. (De Filippis et al. 1995; Van Gerpan et
al. 1999; Allen et al. 1999)
Table 2.2 Comparison of viscosities of petrodiesel, biodiesel and various feedstocks
(Knothe et al. 1997)
Type Heat of Combustion
( MJ/Kg)
Kinematic Viscosity (mm2/sec)
Flash Point
(℃)
Iodine Value
Diesel 427 1-4 80 -
Biodiesel 372 4-6 100 <115
Palm Oil (Butter) - 29.4 267 34-61
Palm Oil (Fat) 355 21.5 - 14-22
Soy bean oil 371 63.5 350 114-138
Nut oil 372 71 340 103
Coconut oil 353 21.7 - -
Jatropha oil 396 757 340 13
Rapeseed Oil 376 74 317 94-110
Sunflower Oil 371 66 316 118-144
Olive Oil 378 83.8 - 76-90
Cottonseed Oil 368 89.40 320 90-117
14
2.6.5 Low Temperature Operation
The presence of long chain hydrocarbons in large amount is undesirable as they begin to
crystallise at low temperatures. If the temperatures go very low, these crystals start to
agglomerate and plug the filters thus preventing engine operation. This phenomenon is
predominantly found in biodiesel. The percent of saturated content in the feedstock has a
great impact on the low temperature operatability. For e.g. palm oil, high on saturated
content, starts to crystallise as high as 13-15℃, whereas soy bean oil, low on saturated
content begins to crystallise relatively at a much higher temperature. The most common way
to measure this phenomenon is to determine the cloud point and can be defined as the
temperature at which the dissolved solids are no longer soluble and form a separate phase
thus giving the fuel cloudy appearance. The more conventional way is to determine the pour
point which can be defined as the lowest temperature at which the fuel loses its flow
characteristics. ASTM D2500 and D97 are respectively used to determine the cloud and the
pour point. Biodiesel is widely blended with conventional diesel fuel to address this issue.
B5 is a widely used blend percent and has been reported to be working in cold climates
without problems. (Van Gerpan et al. 2004)
2.7 Summary
The dwindling fossil fuel reserves and increase prices of crude oil coupled with the need for
lower emissions has forced researchers to shift focus on vegetable oils as an alternative
source of fuel. Although, the advantages are numerous in the areas of low emission,
relatively low cost, low soot formation etc…, the disadvantages associated still hinder the
wide spread use of biodiesel. Low temperature operability, high viscosity and purity have
been two major issues that need to be address to facilitate wide spread use of fuels from
vegetable oils and animal fat.

15
Chapter 3
Transesterification Mechanisms and Biodiesel Production

16
Chapter 3 - Transesterification Mechanisms and Biodiesel Production
3.1 Transesterification
In order to use vegetable oils and animal fat in diesel engines, without causing issues
relating to oil ring sticking, coke deposition and lubrication it is necessary to reduce the
viscosity. The four common methods to reduce the viscosity are:
(a) Blending with petroleum diesel
(b) Pyrolysis
(c) Micro emulsification and
(d) Transesterification
Transesterification is by far the most commonly used method and the only method that
leads to the formation of products, we know as biodiesel (Van Gerpan et al. 2005).
Transesterification is a process where a triglyceride molecule reacts with an alcohol in the
presence of a catalyst to produce fatty acid alkyl esters and glycerol. The stoichometric
reaction is shown below in figure 3.1
O
CH2-O-C-R CH2-OH
O Catalyst O
CH2-O-C-R + 3 R’OH 3 R’-O-C-R + CH-OH
O
CH2-O-C-R CH2-OH
Triglyceride Alcohol Alkyl ester Glycerol
Figure 3.1 Transesterification reaction (Van Gerpen et al. 2005)

17
3.2 Feed Stocks
There are different types of vegetable oils and animals fats that can be used as feedstocks
for biodiesel production. The property of the biodiesel is a function of the type of feedstock
used. For example the biodiesel from soybean oil has a cloud point of 1 ℃, whereas
biodiesel derived from palm oil has a cloud point of 13℃. The table 3.1 below gives a list of
the types of fatty acids present in most of the vegetable oils and fats.
Table 3.1 List of common fatty acids present in vegetable oils and animal fats
(Tyson et al. 2004)
Name Component Acid Ester
Mystiric acid C 14:0 C14H28O2 C15H30O2
Palmatic acid C 16:0 C16H32O2 C17H34O2
Palmitoleic C 16:1 C16H30O2 C17H32O2
Stearic acid C 18:0 C18H36O2 C19H38O2
Oleic acid C 18:1 C18H34O2 C19H36O2
Linoleic acid C 18:2 C18H32O2 C19H34O2
Linolenic acid C 18:3 C14H30O2 C19H32O2
In the component section of the table, the number preceding the colon represents the total
number of carbons in the chain and the number succeeding the column represents the
number of double bonds. The higher the unsaturation in a molecule, the lower the melting
point, however they are also prone to oxidation. Table 3.2 below shows a list of vegetable
oils and animal fats and their fatty acid compositions.

18
Table 3.2 Fatty acid profile of vegetable oils and animal fats (Knothe et al. 1997)
Oil or Fat Fatty Acid [C-O-O-R] Composition (Wt %)
C14:0 C16:0 C18:0 C18:1 C18:2 C18:3 C20:1 C22:1
Canola 4-5 3.8-7 55-63 20-31 9-10 - -
Coconut 13-18.5 7.5-10.5 1-3 5-8.2 1.0-2.6 -
Corn 1-2 7-13 2.5-3 30.5-43 39-52 -
Palm 0.6-2.4 32-46.3 4-6.3 37-53 6-12 -
Soybean 2.3-11 2.4-6 22-30.8 49-53 2-10.5
Lard 1-2 28-30 12-18 40-50 7-13 0-1
Butter 7-10 24-26 10-13 28-31 1-2.5 0.2-0.5
Sunflower 3.5-6.5 1.3-5.6 14-43 44-68.7
Rapeseed - 4.0 1.5 17.0 13.0 9.0 14.5 41.0
Currently over 95% of commercial biodiesel is produced from soybean, rapeseed, sunflower
and palm oil (Balat, 2011). However, with high prices of virgin and refined oils, commercial
production is not a profitable venture without government subsidies (Demirbas and Balat,
2006). This problem can be addressed by employing waste materials and non-edible
triglycerides for biodiesel production. One way of making biodiesel production a profitable
venture is by using waster frying oils from restaurants and households. Waste frying oil is
relatively cheaper than the virgin and refined oils and is also a readily available source
(Kulkarni and Dalai, 2006; Hastie, 2011). However, the major disadvantage of using frying
oils is that they contain large amounts of free fatty acids that favour undesirable side
reactions and form soap. Higher FFA also means the need to add higher amounts of
catalyst owing to FFA neutralization costs. (Van Gerpan 2005; Encinar et al. 2005)
19
3.3 Alcohols and Catalysts
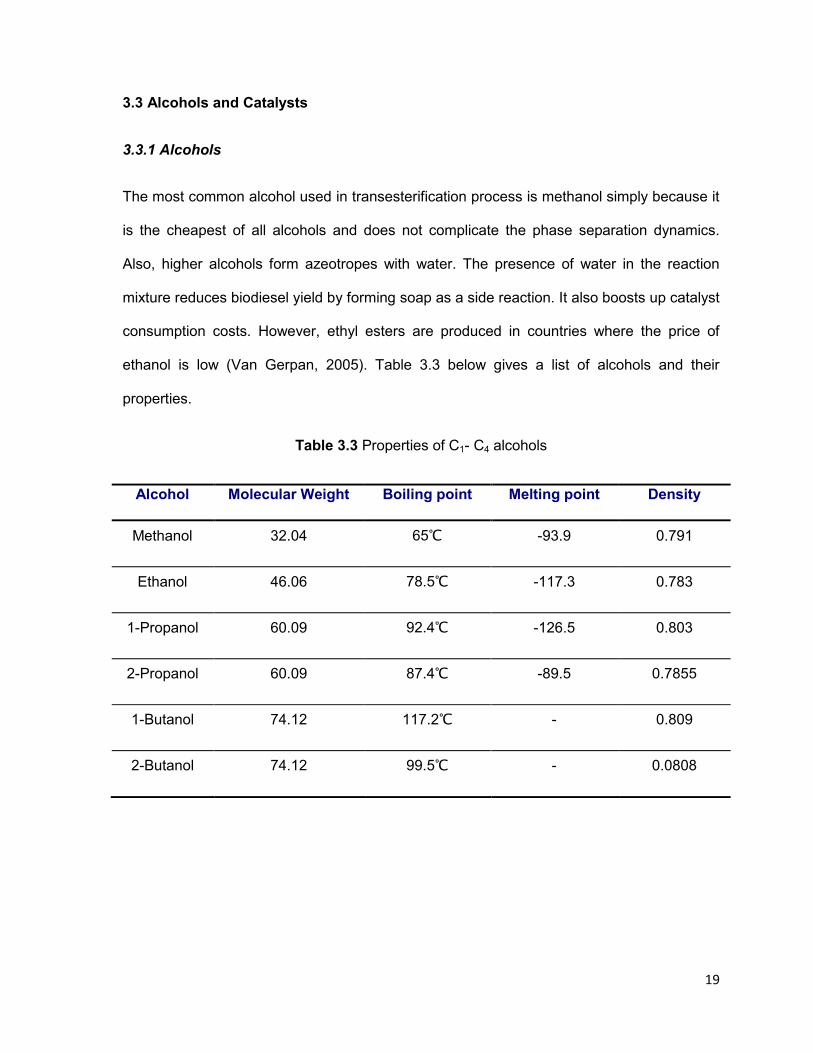
3.3.1 Alcohols
The most common alcohol used in transesterification process is methanol simply because it
is the cheapest of all alcohols and does not complicate the phase separation dynamics.
Also, higher alcohols form azeotropes with water. The presence of water in the reaction
mixture reduces biodiesel yield by forming soap as a side reaction. It also boosts up catalyst
consumption costs. However, ethyl esters are produced in countries where the price of
ethanol is low (Van Gerpan, 2005). Table 3.3 below gives a list of alcohols and their
properties.
Table 3.3 Properties of C1- C4 alcohols
Alcohol Molecular Weight Boiling point Melting point Density
Methanol 32.04 65℃ -93.9 0.791
Ethanol 46.06 78.5℃ -117.3 0.783
1-Propanol 60.09 92.4℃ -126.5 0.803
2-Propanol 60.09 87.4℃ -89.5 0.7855
1-Butanol 74.12 117.2℃ - 0.809
2-Butanol 74.12 99.5℃ - 0.0808
20
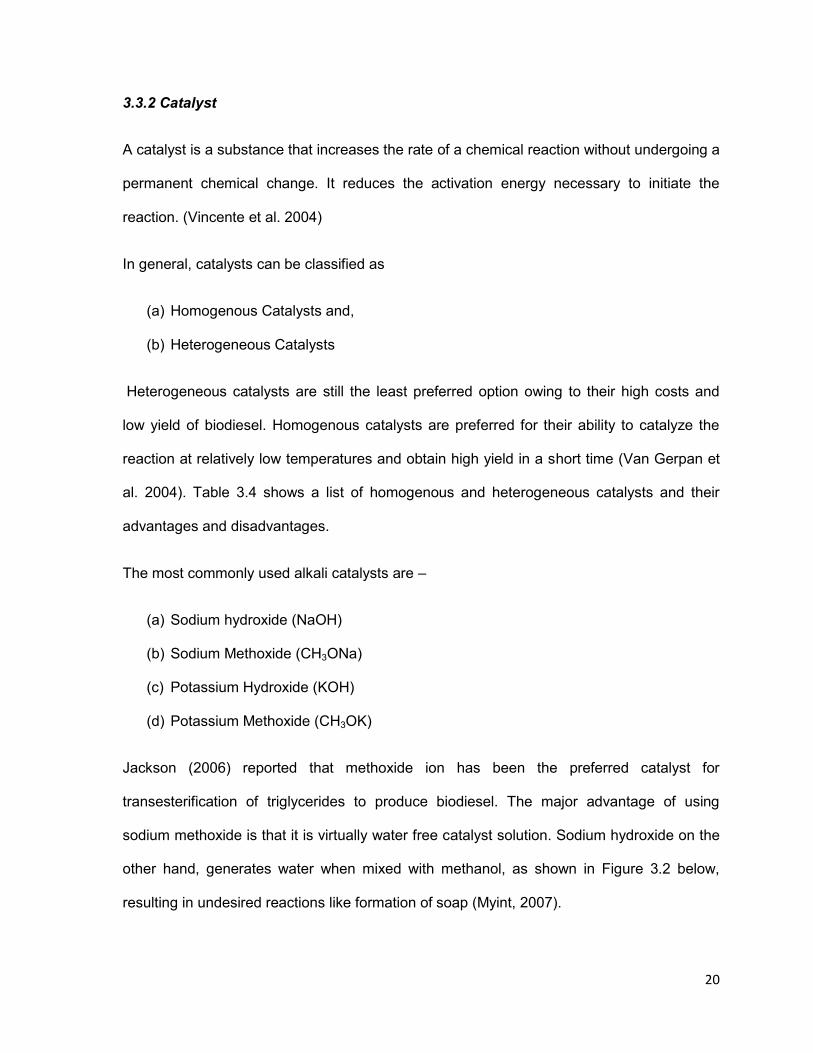
3.3.2 Catalyst
A catalyst is a substance that increases the rate of a chemical reaction without undergoing a
permanent chemical change. It reduces the activation energy necessary to initiate the
reaction. (Vincente et al. 2004)
In general, catalysts can be classified as
(a) Homogenous Catalysts and,
(b) Heterogeneous Catalysts
Heterogeneous catalysts are still the least preferred option owing to their high costs and
low yield of biodiesel. Homogenous catalysts are preferred for their ability to catalyze the
reaction at relatively low temperatures and obtain high yield in a short time (Van Gerpan et
al. 2004). Table 3.4 shows a list of homogenous and heterogeneous catalysts and their
advantages and disadvantages.
The most commonly used alkali catalysts are –
(a) Sodium hydroxide (NaOH)
(b) Sodium Methoxide (CH3ONa)
(c) Potassium Hydroxide (KOH)
(d) Potassium Methoxide (CH3OK)
Jackson (2006) reported that methoxide ion has been the preferred catalyst for
transesterification of triglycerides to produce biodiesel. The major advantage of using
sodium methoxide is that it is virtually water free catalyst solution. Sodium hydroxide on the
other hand, generates water when mixed with methanol, as shown in Figure 3.2 below,
resulting in undesired reactions like formation of soap (Myint, 2007).

21
NaOH + CH3OH CH3ONa + H2O
Sodium Hydroxide Methanol Sodium Methoxide Water
Figure 3.2 Reaction showing the interaction of sodium hydroxide and Methanol
Table 3.4 Comparative study of homogenous and heterogeneous catalysts (Hastie, 2011)
Catalyst Examples Advantages Disadvantages
Heterogeneous alkali Cao, Zeolites Mild reaction conditions
Sensitive to FFA and water content,
catalyst leaching, high alcohol and high
temperature and pressure
Heterogeneous acid Ion exchange resins and zirconium oxide
Insensitive to FFA, easy catalyst
separation, reusable
Slow reaction rate, high alcohol
requirement and high reaction temperature
Enzymes Lipases No by-product generation, mild
reaction conditions, insensitive to FFA
High cost, slow reaction rates, low yield and enzyme
deactivation
Homogenous alkali NaOH, KOH, NaOCH3
Mild reaction conditions, high conversion and
faster reaction rate
Sensitive to FFA and water content (soap formation), difficult catalyst separation
Homogenous acid H2SO4, HCl Insensitive to FFA Slow reaction rate, high alcohol
requirement and reaction
temperature, sensitive to water content, difficult
catalyst separation
Non- Catalytic Super critical methanol
Fast reaction rate, no catalyst separation
required
High temperature and pressure
required

22
3.4 Reaction Mechanisms The transesterification reaction involves a number of consecutive reversible reactions
(Freedman et al. 1986; Schwab et al. 1987) as shown in the figure 3.3. A mole of ester is
formed at each step in the three step process (Eckey, 1956).
3.4.1 Alkali catalysed Transesterification
Eckey (1956) reported that the alkali catalysed transesterification reaction as a three step
mechanism, where in the first step; the anion of the alcohol attacks the triglyceride molecule
to form a tetrahedral intermediate. This step is followed by the reaction of tetrahedral
intermediate with alcohol to regenerate the anion. In the final step, the intermediate
rearranges to form a mole of fatty acid ester and a di-glyceride. Figure 3.4 below shows the
schematic representation of alkali transesterified mechanism.
3.4.2 Acid Catalysed Transesterification
The acid catalysed transesterification reaction mechanism was reported by Meher et al.
(2006). The most common catalysts used are sulphuric or sulphuric acids. The reaction is a
three step mechanism, where the first step involves protonation of carbonyl groups. This
step is followed by nucleophilic attack of alcohol resulting in a tetrahedron intermediate. The
intermediate rearranges to release an ester and proton catalyst. The reaction with acids is
much slower than that of bases which explains why bases are preferred as industrial
catalysts in transesterification.

23
O
CH2-O-C-R CH2-OH
O Catalyst O O
CH2-O-C-R + R’OH 3 R’-O-C-R + CH2-O-C-R
O O
CH2-O-C-R CH2-O-C-R
Triglyceride Alcohol Alkyl ester Diglyceride
CH2-OH CH2-OH
O Catalyst O
CH2-O-C-R + R’OH 3 R’-O-C-R + CH-OH
O O
CH2-O-C-R CH2-O-C-R
Diglyceride Alcohol Alkyl ester Monoglyceride
CH2-OH CH2-OH
Catalyst O
CH -OH + 3 R’OH R’-O-C-R + CH-OH
O
CH2-O-C-R CH2-OH
Monoglyceride Alcohol Alkyl ester Glycerol
Figure 3.3 Three Step Transesterification Reaction

24
Figure 3.4 Mechanism of alkali catalysed transesterification reaction
(Eckey. 1956)
25
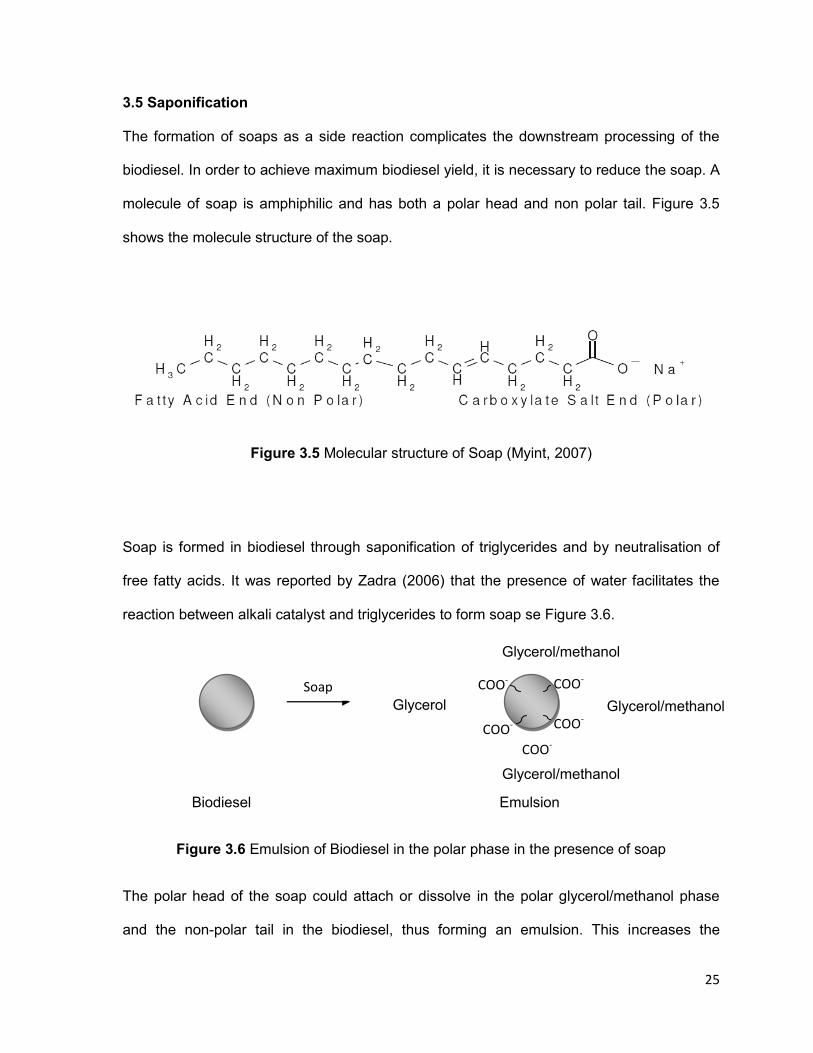
3.5 Saponification
The formation of soaps as a side reaction complicates the downstream processing of the
biodiesel. In order to achieve maximum biodiesel yield, it is necessary to reduce the soap. A
molecule of soap is amphiphilic and has both a polar head and non polar tail. Figure 3.5
shows the molecule structure of the soap.
Figure 3.5 Molecular structure of Soap (Myint, 2007)
Soap is formed in biodiesel through saponification of triglycerides and by neutralisation of
free fatty acids. It was reported by Zadra (2006) that the presence of water facilitates the
reaction between alkali catalyst and triglycerides to form soap se Figure 3.6.
Biodiesel Emulsion
Figure 3.6 Emulsion of Biodiesel in the polar phase in the presence of soap
The polar head of the soap could attach or dissolve in the polar glycerol/methanol phase
and the non-polar tail in the biodiesel, thus forming an emulsion. This increases the
COO-
COO- COO- COO-
COO- COO- Soap
Glycerol/methanol
Glycerol/methanol
Glycerol/methanol
Glycerol

26
solubility of FAME in the polar glycerol/methanol phase thus reducing the yield (Van Gerpan
et al. 2005; Vincente et al. 2007). In order to achieve highest biodiesel yield, it is necessarily
to have a very low FFA content in the feedstock.
3.6 Biodiesel Production Process
3.6.1 Alkali catalysed transesterification
A schematic diagram of alkali catalysed transesterification is shown in the figure 3.3. The
overall process includes the transesterification reaction, separation of glycerol from Fatty
acid alkyl esters, purification of fatty acid alkyl esters, recovery of methanol and finally
recovery of glycerol as a high grade by-product.
The reaction is usually carried out under constant agitation to facilitate greater contact
between the immiscible phases, oil and methanol (OS Stamenković, 2007). The alkali
catalyst in the form of methoxide ion is dissolved in the alcohol and the reaction is carried
out at mild temperature and pressure. The reaction is usually given a residence time of 1
hour before collecting the product stream and gravity settled to separate the heavier
fractions. Glycerol is usually collected at the bottom owing to the difference in the density
and is a characteristic of its low solubility in fatty acid alkyl esters. Amphiphilic impurities like
monoglyceride, di-glyceride can continue to be suspended in both the phases. Any
unreacted alcohol and catalyst is dispersed in both phases.
The bottom layer is removed and the separated fatty acid alkyl ester phase is then washed
with water to removed polar impurities like catalyst and glycerol. Finally, the methanol and
water are recovered by distillation and evaporation respectively (Jehad et al. 2010).
27
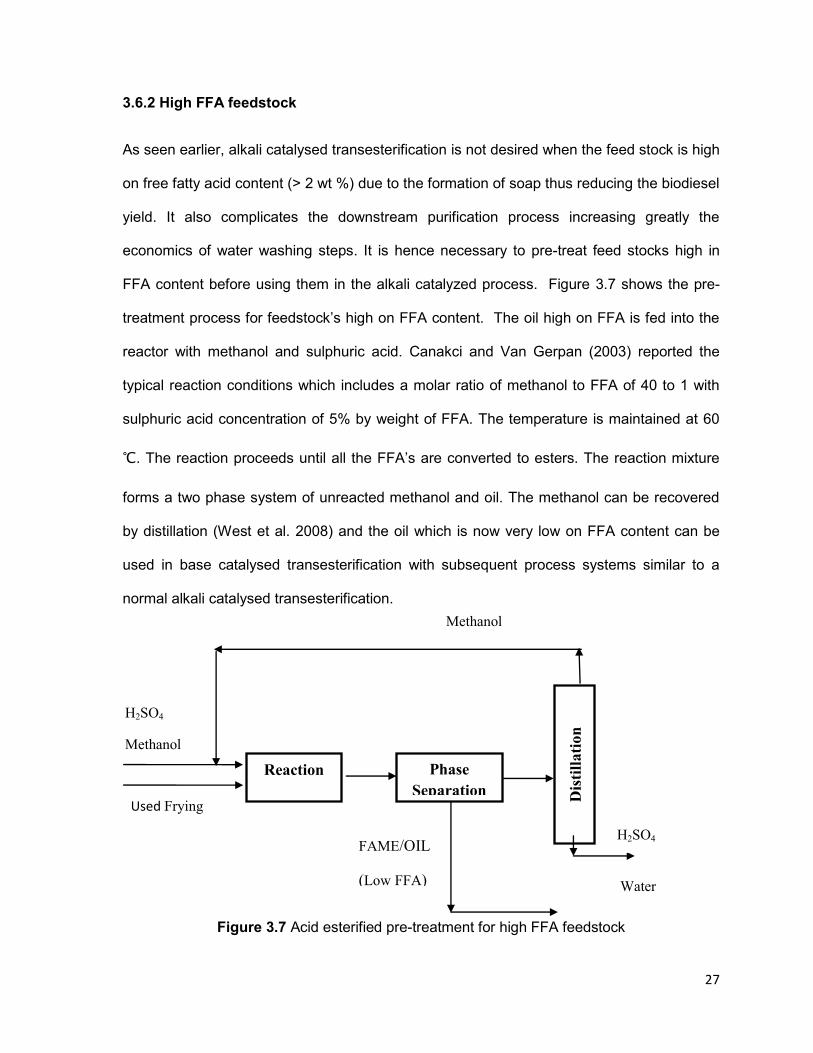
3.6.2 High FFA feedstock
As seen earlier, alkali catalysed transesterification is not desired when the feed stock is high
on free fatty acid content (> 2 wt %) due to the formation of soap thus reducing the biodiesel
yield. It also complicates the downstream purification process increasing greatly the
economics of water washing steps. It is hence necessary to pre-treat feed stocks high in
FFA content before using them in the alkali catalyzed process. Figure 3.7 shows the pre-
treatment process for feedstock’s high on FFA content. The oil high on FFA is fed into the
reactor with methanol and sulphuric acid. Canakci and Van Gerpan (2003) reported the
typical reaction conditions which includes a molar ratio of methanol to FFA of 40 to 1 with
sulphuric acid concentration of 5% by weight of FFA. The temperature is maintained at 60
℃. The reaction proceeds until all the FFA’s are converted to esters. The reaction mixture
forms a two phase system of unreacted methanol and oil. The methanol can be recovered
by distillation (West et al. 2008) and the oil which is now very low on FFA content can be
used in base catalysed transesterification with subsequent process systems similar to a
normal alkali catalysed transesterification.
Figure 3.7 Acid esterified pre-treatment for high FFA feedstock
Reaction Phase
Separation Dis
till
ati
on
Methanol
H2SO4
Used Frying
Oil
Methanol
FAME/OIL
(Low FFA)
H2SO4
Water

28
3.7 Biodiesel Purification
The purity of biodiesel is an important factor that affects the performance of a diesel engine.
Impurities like monoglycerides, sterols, diglycerides, soap, methanol and catalyst can have
adverse effects on the engine apart from affecting the properties of biodiesel. For instance,
biodiesel high on saturated monoglycerides can lead to significant increase in the cloud
point and contribute to filter plugging (Chupka et al. 2011). A high concentration of catalyst
in biodiesel may damage the injector pump and accelerate corrosion in the engine. High
levels of methanol lower the flash point and also deteriorate the rubber linings. The
presence of significant amounts of glycerol can cause problems during long term storage
(Jehad et al. 2010; Ma et al. 1998). In order to produce high quality biodiesel, a series of
purification steps are necessary which include – gravitational settling, centrifugation, water
washing, ion exchange and distillation.
Fatty acid alkyl esters are hydrophobic and can be separated from hydrophilic impurities by
water washing. This step allows the removal of soap, alkali catalyst and small amount of
mono and di-glycerides (Jehad et al. 2010; Becher 2001). Gravity settling is another way to
separating the polar and non-polar phases. The separation is based on density differences
and usually less effective when dealing with emulsions. Centrifugation is also used with
waster washing to accelerate the phase separation; however the major disadvantage is the
initial cost and the need for regular maintenance.
3.8 Gas Chromatography Analysis
3.8.1 Analysis
GC analysis is performed in order to determine the quantity of a class of contaminants in
methyl esters (Jehad et al. 2010). The sample mixture injected into the GC column eludes
mainly due to differences in boiling point and chemical structure. It was reported by Van
29
Gerpen (2004) that often it is the larger particles that have longer retention times in the GC.
The free hydroxyl group are of esters are silylated with N-methyl-N-(trimethylsilyl)
trifluoroacetamide (MSTFA) prior to analysis to increase their volatility (Jehad et al. 2010).
Two internal standards, butanetriol for the determination of free glycerol and tricaprin for the
determination of glycerides, are used in the calibration process as well as in the analysis.
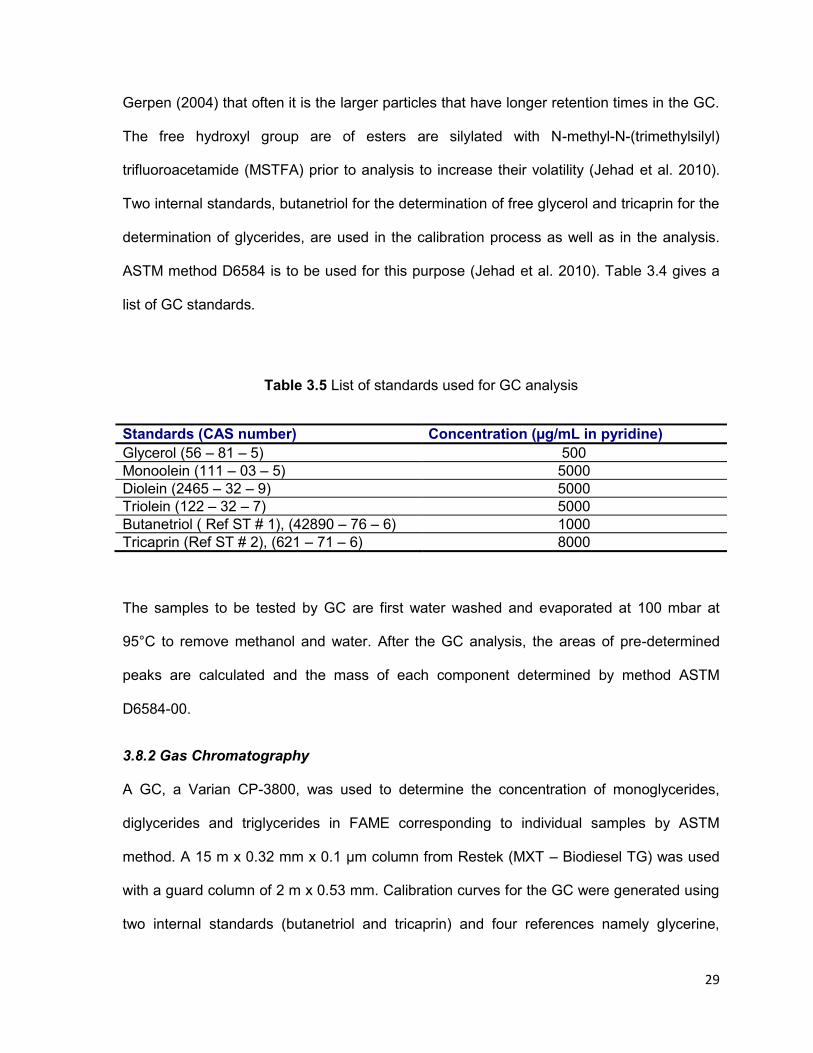
ASTM method D6584 is to be used for this purpose (Jehad et al. 2010). Table 3.4 gives a
list of GC standards.
Table 3.5 List of standards used for GC analysis
Standards (CAS number) Concentration (µg/mL in pyridine)
Glycerol (56 – 81 – 5) 500
Monoolein (111 – 03 – 5) 5000
Diolein (2465 – 32 – 9) 5000
Triolein (122 – 32 – 7) 5000
Butanetriol ( Ref ST # 1), (42890 – 76 – 6) 1000
Tricaprin (Ref ST # 2), (621 – 71 – 6) 8000
The samples to be tested by GC are first water washed and evaporated at 100 mbar at
95°C to remove methanol and water. After the GC analysis, the areas of pre-determined
peaks are calculated and the mass of each component determined by method ASTM
D6584-00.
3.8.2 Gas Chromatography
A GC, a Varian CP-3800, was used to determine the concentration of monoglycerides,
diglycerides and triglycerides in FAME corresponding to individual samples by ASTM
method. A 15 m x 0.32 mm x 0.1 μm column from Restek (MXT – Biodiesel TG) was used
with a guard column of 2 m x 0.53 mm. Calibration curves for the GC were generated using
two internal standards (butanetriol and tricaprin) and four references namely glycerine,

30
monoolein, diolein, and triolein. Three replicate injections at 5 separate concentrations were
performed to yield a glycerol calibration curve, R2 > 0.99 to meet the ASTM requirement
(Jehad et al. 2010).
The operating conditions for the column oven were 50°C for 1 min before ramping
15°C/min to 180°C, 7°C/min to 230°C and finally 30°C/min to 380°C. The oven was kept at
380°C for 10 min. The carrier gas, helium was held at a constant flow of 3.0 mL/min, flame
ionization detector (FID) was held at 380°C, Hydrogen flow was kept constant at 35 mL/min,
air flow rate was at 350 mL/min, and Helium flow rate was at 30 mL/min (Jehad et al. 2010).

31
Chapter 4
Study on transesterification kinetics through continuous elution reactions in a membrane
reactor for speciation of Saturated Monoglycerides

32
Chapter 4
Study on transesterification kinetics through continuous elution reactions in a membrane
reactor for speciation of Saturated Monoglycerides
Abstract
The addition of biodiesel to petro diesel can cause issues in cold-weather operations,
because certain of its constituent compounds can form precipitates in the fuel. This issue
has been attributed to the presence of impurities (mostly saturated monoglycerides,
diglycerides, soap etc) in biodiesel and has been discussed in the literature. In addition to
purity, the degree of saturation of the associated fatty acids in FAME affects the cloud point
and pour point of the resulting biodiesel. This was aimed at studying the possibility of using
the reaction kinetics of the transesterification to affect the continuous speciation of the
biodiesel produced in a membrane reactor. The effect of selective transesterification of oil
as a function of alcohol, temperature and catalyst concentration was investigated. At the
conditions tested, the results showed very little specificity in the selection of fatty acid types
in the transesterification reaction. We also found that the amount and type of
monoglycerides present in the biodiesel is reflected by the relative amount of fatty acids
types present in the oil. In biodiesel derived from Canola oil, a preponderance of monoolein
was found for all runs and monolinolein as in the case of Soy bean oil.
Keywords: Fatty acid profiles, saturated monoglycerides, membrane reactor, elution
studies
`
33
4.1 Introduction
The development of renewable energy sources to replace fossil fuels such as oil,
coal and natural gas can prevent depletion of the available energy resources and
environmental pollution. However, despite these advantages, the production and usage of
biodiesel has still not reached peak consumption as it is plagued with cold weather
operability issues. This necessitates the requirement to blend biodiesel with conventional
diesel fuel for better performance and to mitigate issues arising due to cold weather.
Blending petroleum diesel with biodiesel at concentrations of B20 or B5 has been
largely problem free, where B20 is a mixture of 20% biodiesel and 80% petroleum diesel
and B5 is a mixture of 5% biodiesel and 95% petroleum diesel (Chupka et al. 2011).
However, the presence of higher melting saturated fatty acid methyl esters (FAME) and
impurities mainly saturated monoglycerides in biodiesel still pose a threat of filter plugging in
cold weather. Van Gerpen et al. observed that the final melting temperature for biodiesel
spiked with saturated monoglycerides (SMGs), was 25 °C higher than the cloud point. (Van
Gerpen et al. 1997).
Biodiesel contains impurities such as mono- and diglycerides that result from
incomplete reactions. There is approximately 2% unsaponifiable matter in any feedstock.
Soy oil feedstock for example contains about 1.6 w/w % unsaponifiable matter (Pfalzgraf et
al. 2007).Unsaponifiable are non- lipid materials present in the oil feedstock and can include
plant sterols, tocopherols, hydrocarbons, pigments, and minerals (Alleman et al. 2008;
Chupka et al. 2010).
Total glycerin consists of bound and free glycerin. Bound glycerin is in the form of
mono-, di-, and triglycerides (Alleman et al. 2007). Mono- and diglycerides are limited in
ASTM D6751 by controlling the allowable level of 0.24 w/w %. It was reported by Van

34
Gerpen et al. (1997) that the fatty acid composition of the monoglycerides mirrors that of the
parent fat or oil. Thus, in the case of soybean oil, palmitic acid (C16:0) would make up
7−11% of the fatty acid chains, while stearic acid (C18:0) would make up 3−5% of the fatty
acid chains. Also, studies carried out on the saturated monoglyceride content of soy
biodiesel observed that the concentrations of monopalmitin and monostearin to be about
11% and 5% of the total monoglyceride concentration. On the basis of this information,
Chupka et al reports that the concentration of monopalmitin in soy biodiesel meeting ASTM
standards would typically be about 0.026 w/w % and the concentration of monostearin about
0.01 w/w % (Chupka et al. 2010). Also it can be seen that, oil high on saturated fatty acid
content would contain high amount of saturated monoglycerides. For example, Palm oil
biodiesel could contain up to 45% palmitic acid chains and 4% stearic acid and thus might
contain 0.108 w/w % monopalmitin and 0.01 w/w % monostearin.
Filter plugging issues have been a source of several studies. Although, the saturated
content in the FAME is cited as one of the main reasons for poor weather operatability,
study on the effect of other impurities like monoglyceride, soap, tocopherols etc also have
been carried out extensively. Pfalzgraf (2007) examined the role of sterol glucosides (SG),
monoglycerides, and water on filtration time after a cold temperature soak. The studies
resulted in a positive correlation with higher filter times. Tang and co-workers cooled
biodiesel blends to 4 °C, significantly above the expected cloud point, and noted the
presence of precipitates after a storage time of 24 h (Tang et al. 2008). The precipitates on
analysis showed a significant presence of saturated monoglycerides, monoglycerides and a
combination of both in some feedstocks. This provides valuable information on the species
contributing to the cold weather operatability issues and the need to remove all
monoglycerides from the biodiesel. Moreau et al. examined 24 samples from various places
in the biodiesel supply chain (Moreau et al. 2008). It was found that solids in these samples

35
consisted primarily of saturated monoglycerides and other plant sterols. These studies
suggest that SGs are mainly responsible for filter plugging above the CP.
Selvidge et (2007) al also reported that the use of a cold soak filtration test is
effective at identifying biodiesel exhibiting precipitate formation above the CP and can
contribute in lowering the incidents of fuel filter plugging (Selvidge et al. 2007).
In addition to this the profile of the fatty acid associated within the FAME affects the
cold flow properties of the biodiesel. The melting point of methyl stearate (C18:0) is 39.1 ℃
while that of methyl oleate (C18:1) is -20 ℃ and methyl linoleate (C18:2) is -35 ℃ (Gunstone
et al. 1994). It is easily seen that obtaining a biodiesel having less saturated FAMEs in an
ester mix is desirable. This can be obtained by cold weathering of the fuel where a mixture
of FAMEs is cooled below its cloud point and filtered to remove saturated FAMEs. In this
current work, we have explored a new way of speciating the monoglycerides by exploiting
the difference in the reaction kinetics of saturated vs unsaturated lipids.
4.2 Objectives In this present study, a membrane reactor was employed to study transesterification
kinetics through continuous elusion reactions to investigate the concentration of Fatty Acid
Methyl Esters as a function of time for various vegetable oils, with an objective of speciating
saturated monoglycerides namely monopalmitin and monostearin.
36
4.3 Approach
4.3.1 Understanding Triglycerides, Di-glycerides and Monoglycerides
The distribution of esters has a great deal of effect on the properties of biodiesel, which
include density, cetane number, cloud point, melting point etc (Van Gerpan et al. 2005).
Since, different feed stocks contain different concentration of fatty acids, the choice of feed
stock generally characterises the fuel properties.
Glycerol contains three hydroxyl groups that can combine with up to three fatty acids to form
monoglycerides, diglycerides, and triglycerides. If all the hydroxyl groups are esterified by
fatty acids, we get triglyceride. Two esterified groups represent diglyceride and one
esterified hydroxyl group represents monoglyceride (Zamora, 2012).
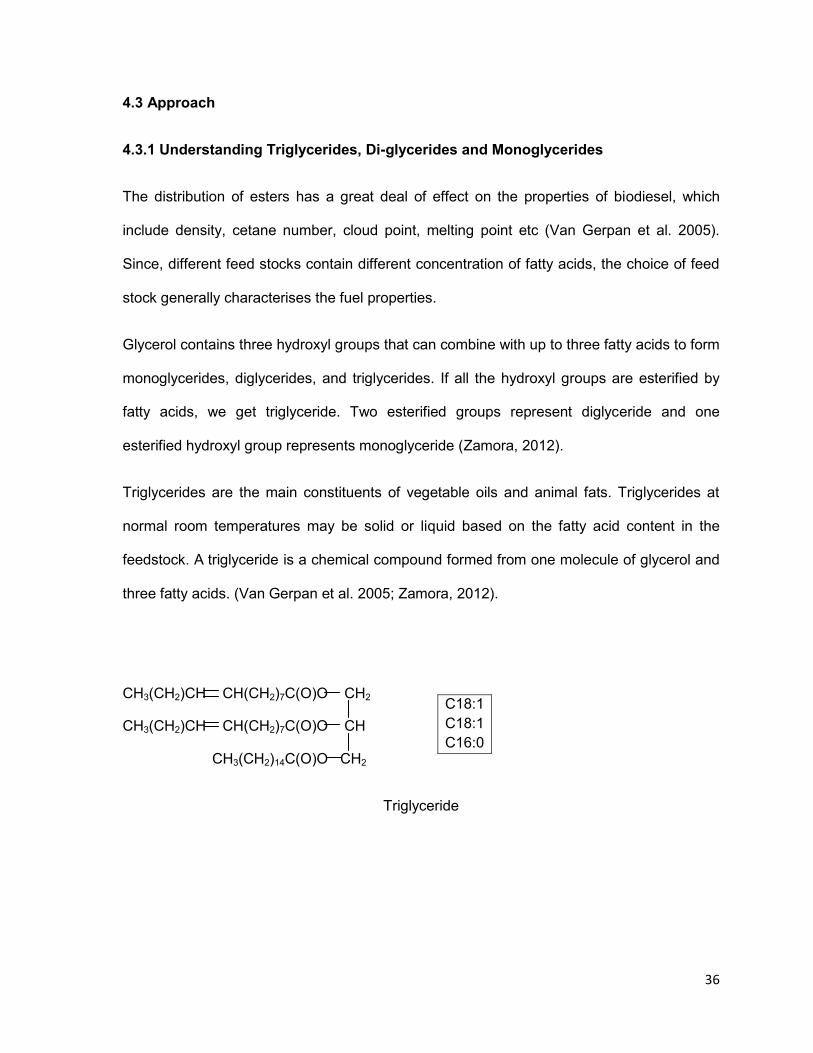
Triglycerides are the main constituents of vegetable oils and animal fats. Triglycerides at
normal room temperatures may be solid or liquid based on the fatty acid content in the
feedstock. A triglyceride is a chemical compound formed from one molecule of glycerol and
three fatty acids. (Van Gerpan et al. 2005; Zamora, 2012).
CH3(CH2)CH CH(CH2)7C(O)O CH2
CH3(CH2)CH CH(CH2)7C(O)O CH
CH3(CH2)14C(O)O CH2
Triglyceride
C18:1
C18:1
C16:0

37
CH3(CH2)CH CH(CH2)7C(O)O CH2
OH CH
CH3(CH2)14C(O)O CH2
1- Monoglyceride
Figure 4.1 An example of Tri, diglyceride and monoglyceride molecules.
The triglyceride structural formula in Fig 4.1 on the left consists of two radicals of oleic acid
(C18:1) and one of palmitic acid (C16:0) attached to glycerol.
A diglyceride molecule has two of the carboxyl groups joining other the other two hydroxyl
groups to form an ester linkage and usually exists in the 1,2 or 1,3 form. A monoglyceride
has only one fatty acid radical per molecule of glycerol. The fatty acid may be attached to
carbon 1 or 2 of the glycerol molecule. The fatty acid distribution in various oils and fats is
listed in Table 4.1.
C18:1
-
C16:0
OH CH2
OH CH
CH3(CH2)14C(O)O CH2
-
-
C16:0
38
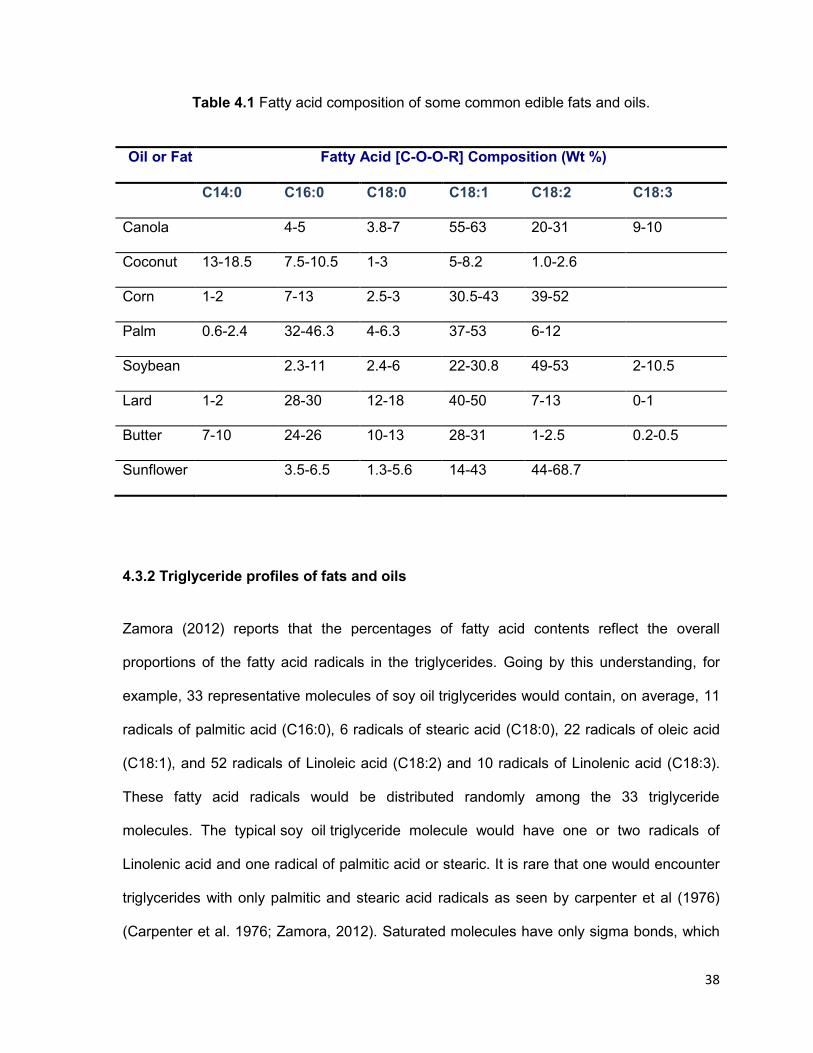
Table 4.1 Fatty acid composition of some common edible fats and oils.
Oil or Fat Fatty Acid [C-O-O-R] Composition (Wt %)
C14:0 C16:0 C18:0 C18:1 C18:2 C18:3
Canola 4-5 3.8-7 55-63 20-31 9-10
Coconut 13-18.5 7.5-10.5 1-3 5-8.2 1.0-2.6
Corn 1-2 7-13 2.5-3 30.5-43 39-52
Palm 0.6-2.4 32-46.3 4-6.3 37-53 6-12
Soybean 2.3-11 2.4-6 22-30.8 49-53 2-10.5
Lard 1-2 28-30 12-18 40-50 7-13 0-1
Butter 7-10 24-26 10-13 28-31 1-2.5 0.2-0.5
Sunflower 3.5-6.5 1.3-5.6 14-43 44-68.7
4.3.2 Triglyceride profiles of fats and oils
Zamora (2012) reports that the percentages of fatty acid contents reflect the overall
proportions of the fatty acid radicals in the triglycerides. Going by this understanding, for
example, 33 representative molecules of soy oil triglycerides would contain, on average, 11
radicals of palmitic acid (C16:0), 6 radicals of stearic acid (C18:0), 22 radicals of oleic acid
(C18:1), and 52 radicals of Linoleic acid (C18:2) and 10 radicals of Linolenic acid (C18:3).
These fatty acid radicals would be distributed randomly among the 33 triglyceride
molecules. The typical soy oil triglyceride molecule would have one or two radicals of
Linolenic acid and one radical of palmitic acid or stearic. It is rare that one would encounter
triglycerides with only palmitic and stearic acid radicals as seen by carpenter et al (1976)
(Carpenter et al. 1976; Zamora, 2012). Saturated molecules have only sigma bonds, which
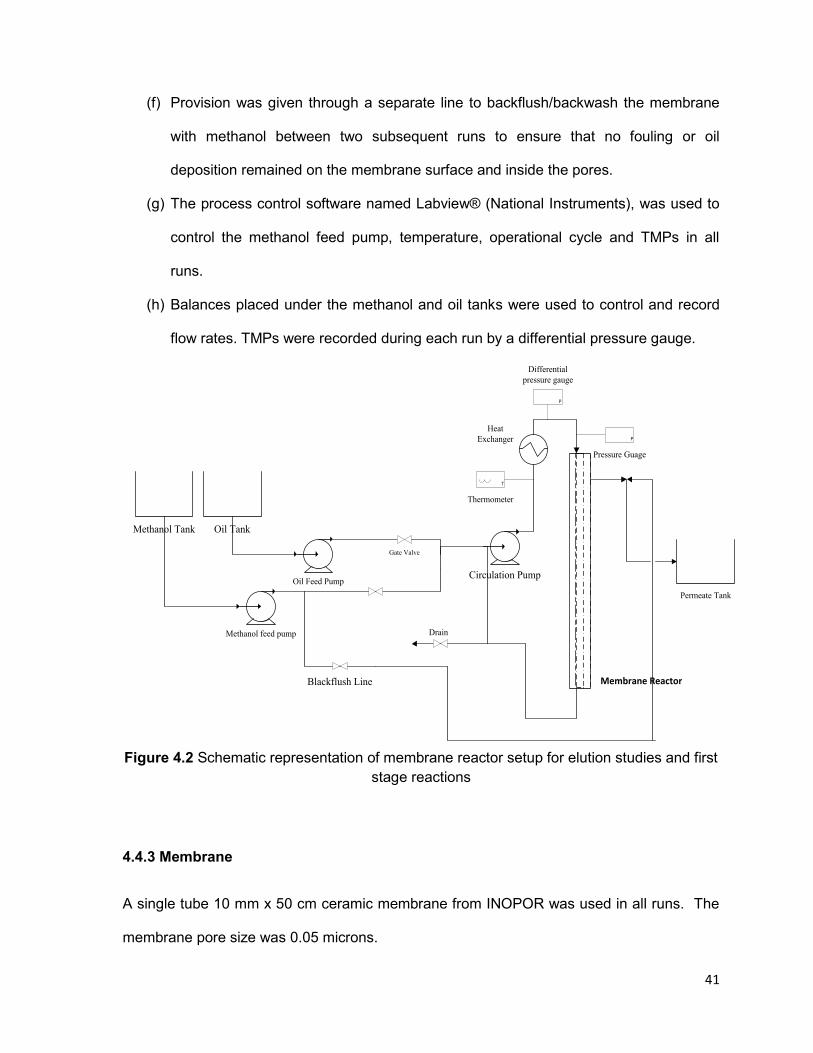
39
are very stable and hard to break. Unsaturated molecules, however, have pi bonds, and
they are weaker. They deform the orbitals slightly and are more strained. Therefore, they
will react faster and offer more reaction possibilities than their saturated counterparts.
The idea is to exploit the low reactivity of saturated fatty acids, thereby retaining saturated
monoglycerides in the reactor as the unsaturated chain would react first and detach itself
from the glycerol skeleton. The overall process of transesterification consists of three
consecutive, reversible reactions to give diglycerides and monoglycerides as intermediates,
however the actual reaction is lot more complicated. Stavarache et al. investigated the
concentration of fatty acid methyl esters of various vegetable oils as a function of time
through ultrasonic assisted transestefication. There has been not much discussed in the
literature concerning continuos elution studies and speciation of monoglycerides using a
membrane reactor and this work is first to look into this line of study. The intent is to
gradually elute a reacted mixtuire out of a membrane reactor initally loaded with oil and
measure the degree of saturation of the resulting permeate. The oils employed in the study
were chosen primarily on their fatty acid composition targetting lipids low on saturated
content as it is evident that the feedstocks with high saturated content have cold flow
operatability issues.

40
4.4 Experiment
4.4.1 Feed Stock and Reagents
Refined Bleached and Degummed Canola oil and Soy bean oil was used in this study. Lard
oil was used for batch scale experimental runs. The acid used for neutralization was
hydrochloric acid (Assay: 36.5-38%, Fisher Scientific, Canada). The alcohol used for
reactions was methanol (Fisher Scientific, Canada) and the catalyst was 25 wt% Sodium
Methoxide in methanol (Sigma- Aldrich, Canada)
4.4.2 Experimental Setup
In the present study, a UF membrane setup was employed as shown in Fig.1. A membrane
loop was utilized to perform all runs.
(a) The loop was equipped with a shell and tube heat exchanger to maintain the
temperature of the fluid at a constant value.
(b) A water bath was used to control the water temperature, which was the heating
supplying fluid.
(c) A platinum resistance temperature detector (RTD) was used in the membrane loop
to measure the temperature of the mixture at any given time.
(d) Three pumps were used in the system: two gear pumps were used to pump
methanol and oil separately into the loop and a centrifugal pump was used to
circulate the reaction mixture in the loop.
(e) The system was operated in a semi-continuous mode, where a desired amount of oil
and methanol was loaded in the loop at the beginning of the run and only methanol
was fed to the loop during the run.
41
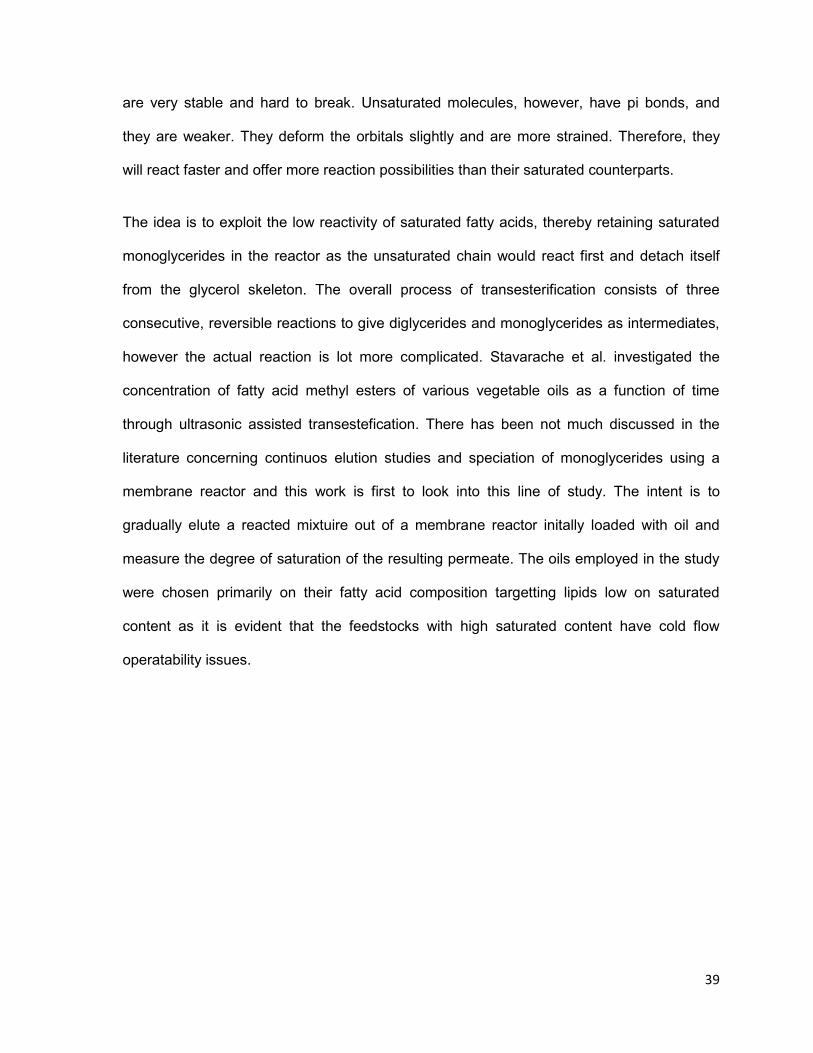
(f) Provision was given through a separate line to backflush/backwash the membrane
with methanol between two subsequent runs to ensure that no fouling or oil
deposition remained on the membrane surface and inside the pores.
(g) The process control software named Labview® (National Instruments), was used to
control the methanol feed pump, temperature, operational cycle and TMPs in all
runs.
(h) Balances placed under the methanol and oil tanks were used to control and record
flow rates. TMPs were recorded during each run by a differential pressure gauge.
Oil TankMethanol Tank
Oil Feed Pump
Methanol feed pump
Gate Valve
Blackflush Line
Circulation Pump
P
T
Thermometer
P
Pressure Guage
Membrane Reactor
Permeate Tank
Drain
Differential
pressure gauge
Heat
Exchanger
Figure 4.2 Schematic representation of membrane reactor setup for elution studies and first
stage reactions
4.4.3 Membrane
A single tube 10 mm x 50 cm ceramic membrane from INOPOR was used in all runs. The
membrane pore size was 0.05 microns.

42
4.5 Experimental Procedure and Analytical Method
4.5.1 Procedure
A series of runs with different variables were performed and analysed. Table 2 gives a list of
runs that were performed to study the elution as a function of time. The free fatty acid
content of the feedstock (Soybean and Canola) was estimated before feeding it into the
reactor. This was used to determine the minimum catalyst concentration that was needed to
be maintained in the reactor.
(a) The membrane reactor was backflushed with pure methanol to remove any
residual oil and fouling deposits on the membrane walls from previous runs.
(b) Permeate and the backflush lines were closed.
(c) Initial weight of the oil and methanol was recording from the balance. Labview
software was started to record the run information.
(d) The feed valves pertaining to oil were opened, and the oil was fed into the reactor.
(e) Oil was circulated to reach a desired temperature.
(f) Methanol was fed into the reactor and the circulation pump was started.
(g) After a residence time of 15 minutes, methanol was continuously fed into the
reactor with a constant predetermined flow rate for the remainder of the run.
(h) Permeate was collected every 5 minutes and neutralised immediately to inhibit
further reaction.
(i) Samples were collected till all the oil in the reactor was consumed.
(j) Circulation was stopped and the samples were sent for analysing.

43
4.5.2 Analysis
The samples to be analysed, have to be first free from any catalyst, glycerol and methanol.
In order to obtain pure biodiesel, a series of processes are usually required. These can
include: gravitational settling, centrifugation, water washing, adsorption and distillation.
The most common method for purification of the biodiesel is water-washing. FAME
and unreacted TG are essentially non-polar and insoluble in water, while soap, methanol
and glycerol are polar and readily soluble in water. Therefore, adding water to the non-polar
phase is usually the first and the most common step in purifying biodiesel for GC analysis.
Similar method of water washing was employed to wash the samples from the elution runs
and is illustrated below.
(a) 30 ml of biodiesel sample is taken in a vial.
(b) 10 % by weight distilled water is added to the vial.
(c) The contents are shaken well and centrifuged for 10 min at 5000 rpm.
(d) The bottom phase is removed and the procedure is repeated again.
(e) The sample is then evaporated for trace amounts of methanol and water for 30 min
at 100 mbar.
(f) The sample is ready for analysis.
4.5.3 Analytical Methods
A GC, a Varian CP-3800, was used to determine the saturated and unsaturated methyl
ester concentration in the FAME corresponding to individual samples by ASTM method. A
15 m x 0.32 mm x 0.1 μm column from Restek (MXT – Biodiesel TG) was used with a guard
column of 2 m x 0.53 mm. Calibration curves for the GC were generated using two internal

44
standards (butanetriol and tricaprin) and four references namely glycerine, monoolein,
diolein, and triolein. Three replicate injections at 5 separate concentrations were performed
to yield a glycerol calibration curve, R2 > 0.99 to meet the ASTM requirement.
Each sample was prepared for analysis by weighing 100 mg of FAME in a 10 mL septa vial.
100 μL of butanetriol, tricaprin and MSTFA were then added to the vial and shaken. The vial
was left to stand for 15 min at room temperature. Approximately 8 mL of n-heptane was
then added to the vial. 1 μL of the prepared sample mixture was then injected into the cool
on-column injection port. The operating conditions for the column oven were 50°C for 1 min,
15°C/min to 180°C, 7°C/min to 230°C, 30°C/min to 380°C, hold 10 min. The carrier gas was
helium at a constant flow of 3.0 mL/min, the detector was a flame ionization detector (FID)
held at 380°C, H2 flow was at 35 mL/min, air was at 350 mL/min, and He (make-up) was at
30 mL/min.
To get a detailed fatty acid methyl ester profile, a Perkin Elmer (PE) Auto system GC was
used. A 30m long 0.32 mm ID column from Restek (FAME WAX) was used to generate
chromatograms. The operating condition for the column were, 50°C for 5 minutes, 10°C/min
to 120°C and held for 25 minutes. The temperature was ramped to 250°C at 15°C/min and
held for 5 minutes. The plots from PE and Varian GC are discussed in the next section.
4.6 Results and Discussions
When a triglyceride molecule reacts with an alcohol, in a transesterification reaction, the
fatty acid chains are released from the glycerol backbone to recombine with alcohol to give
fatty acid alkyl esters. The left over skeleton forms di and mono glycerides before forming a
glycerol molecule.
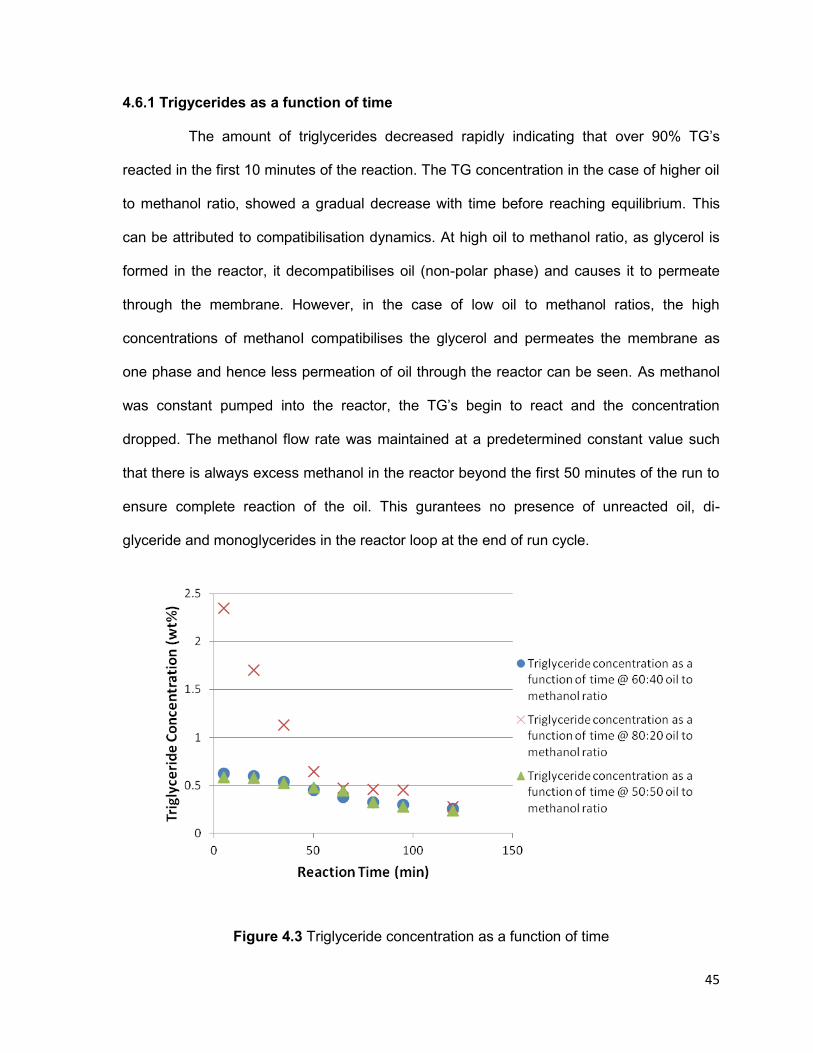
45
4.6.1 Trigycerides as a function of time The amount of triglycerides decreased rapidly indicating that over 90% TG’s
reacted in the first 10 minutes of the reaction. The TG concentration in the case of higher oil
to methanol ratio, showed a gradual decrease with time before reaching equilibrium. This
can be attributed to compatibilisation dynamics. At high oil to methanol ratio, as glycerol is
formed in the reactor, it decompatibilises oil (non-polar phase) and causes it to permeate
through the membrane. However, in the case of low oil to methanol ratios, the high
concentrations of methanoI compatibilises the glycerol and permeates the membrane as
one phase and hence less permeation of oil through the reactor can be seen. As methanol
was constant pumped into the reactor, the TG’s begin to react and the concentration
dropped. The methanol flow rate was maintained at a predetermined constant value such
that there is always excess methanol in the reactor beyond the first 50 minutes of the run to
ensure complete reaction of the oil. This gurantees no presence of unreacted oil, di-
glyceride and monoglycerides in the reactor loop at the end of run cycle.
Figure 4.3 Triglyceride concentration as a function of time

46
As a result, the effect of oil to methanol ratio is accountanble for the first 50 minutes of the
reaction. Figure 4.3 shows the triglyceride concentration as a function of time. It can be
noted that, very little TG permeates through the membrane at low oil to methanol ratios as
the TG concentration in the permeate is very low even in the first few minutes of the
reaction. It eventually reaches a very low concenration of <0.3 wt% at the end of the runs.
4.6.2 Di-glycerides as a function of time
As seen in Figure 4.4, the amount of di-glycerides were low from the begining of
the reaction and reducing gradually as the reaction proceeded. The only anamoly was again
seen in the case of high oil to methanol ratio, where the concentration reduced gradually for
the first 50 minutes, before reaching low values. The result was in agreement with
stavarache et al 2007. The oil to methanol ratio did not have a significant effect on
diglyceride reaction. Temperature did not account for significant differences.
Figure 4.4(a) Diglyceride concentration at as a function of time at 50℃
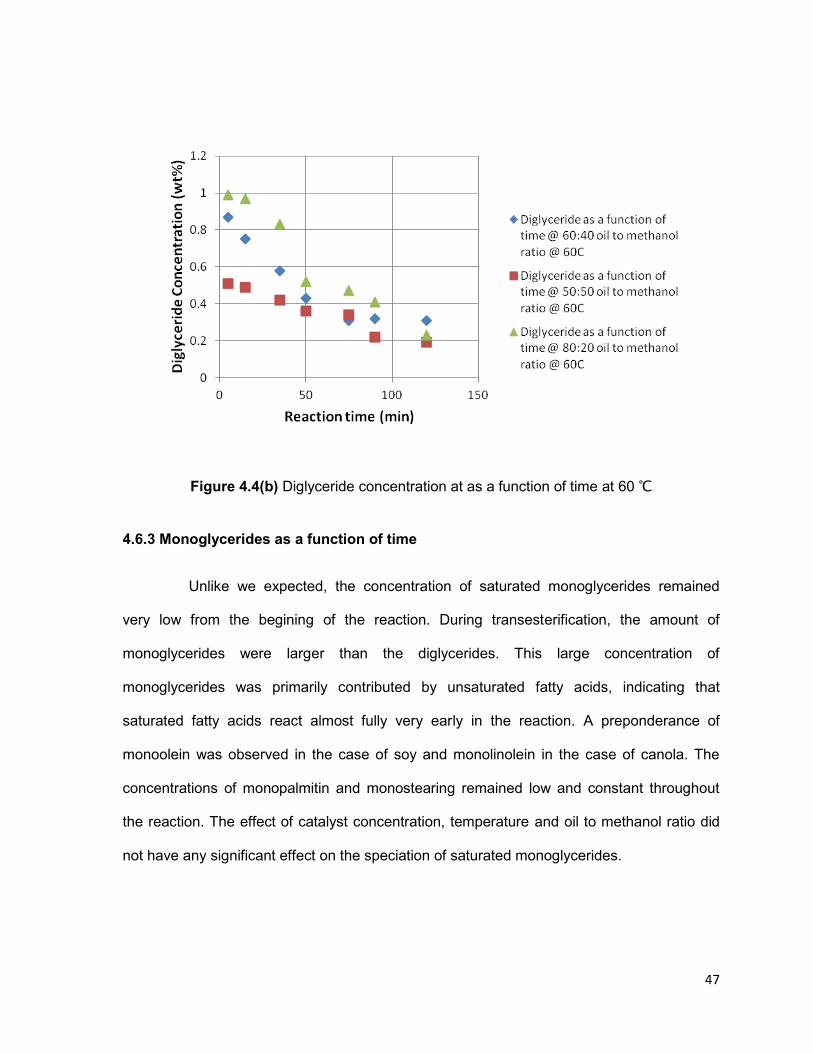
47
Figure 4.4(b) Diglyceride concentration at as a function of time at 60 ℃
4.6.3 Monoglycerides as a function of time
Unlike we expected, the concentration of saturated monoglycerides remained
very low from the begining of the reaction. During transesterification, the amount of
monoglycerides were larger than the diglycerides. This large concentration of
monoglycerides was primarily contributed by unsaturated fatty acids, indicating that
saturated fatty acids react almost fully very early in the reaction. A preponderance of
monoolein was observed in the case of soy and monolinolein in the case of canola. The
concentrations of monopalmitin and monostearing remained low and constant throughout
the reaction. The effect of catalyst concentration, temperature and oil to methanol ratio did
not have any significant effect on the speciation of saturated monoglycerides.

48
Figure 4.5 Saturated and Unsaturated monoglycerides of Soy ester as a function of time
4.6.4 Fatty Acid Methyl Ester concentration as a function of time
The saturated fatty acid methly esters in soy and canola (namely methyl palmitate C16:0
and methyl stearate C18:0) concentration remained same throughout the reaction. The
unsaturated fatty acid methyl ester concentration increased before reaching a equilibrium.
This confirms the understanding that fatty acid composition of monoglyceride mirror parent
fat or oil. The catalyst concentration, temperature and oil to methanol ratio did not have
significant effect on the saturated FAME concentration. Figure 4.6 shows the profile of fatty
acid ester of soy oil as a function of time.

49
Figure 4.6 Fatty acid ester profile of soy oil as a function of time at 50 C at oil to methanol
volume ration of 60:40.
These results suggest that saturated fatty acids are mostly transesterified at the begining of
the reaction, while the amount of unsaturated fatty esters increases as a function of time
before reaching equilibrium. This can be explained by examining the location of the
saturated and unsaturated acid chains on triglyceride molecules. Table 4.2 below illustrates
a geometric distribution of acid chains in soybean oil (Stavarache et al. 2007; Zamora
2012).
It is seen that, the positional distribution of saturated fatty acids in the sn-2 position is very
rare (Carpenter et al.1976) The chains show a preponderence of oleic acid in different
positions. Stearic acid is always in a sn-1 or sn-3 position. It is more accessible in this
poosition and will react in the first or second reaction of the transesterification reaction. This
explains the very low amount of saturated monoglycerides in the permeate and the
preponderance of unsaturated monoglycerides in the same. It also explains the increase in

50
unsaturated monoglycerides with time with Figure 4.5 before 50 min. The consequent
increase in methyl stearate in Figure 4.6 up 50 min also illustrates this. These results
indicate that transesterification is a function of positional distribution and positions sn1 and
sn3 react the fastest and sn2 reacts the slowest thereby leaving mostly unsaturated
monoglycerides in the reactor and agrees with the findings of stavarche et al 2007.
The samples collected up until 50 min in the 60:40 run would have a higher cloud point than
the ones after 50 min. This suggests that further fine tuning of the technique could possibly
lead to a speciation based on reaction kinetics and elution. The first trial of this technique
while not a complete success and does indicate a way ahead in successfully implementing
this process.
Table 4.2 Positional modelling of commercial soy bean oil
4.6.5 Monoglycerides and polymorphysm.
As seen in the results above there is very little saturated monoglycerides in the FAME
produced in this work. So we must turn to the possibility that unsaturated monglycerides can
cause filter plugging. The melting point of various unsaturated monoglycerides is given in
Table 4.3 below.
C18:0 C18:0 C18:2 C18:2 C18:2 C18:2 C18:2 C18:2 C18:0 C18:2 C18:2
C18:1 C18:1 C18:1 C18:1 C18:1 C18:1 C18:2 C18:3 C18:0 C18:2 C18:2
C16:0 C16:0 C16:0 C16:0 C16:0 C16:0 C16:0 C16:0 C16:0 C16:0 C16:0
C18:2 C18:2 C18:2 C18:3 C18:2 C18:3 C18:2 C18:2 C18:2 C18:3 C18:3
C18:2 C18:2 C18:2 C18:2 C18:2 C18:2 C18:2 C18:2 C18:1 C18:2 C18:2
C18:2 C18:2 C18:1 C18:1 C18:1 C18:1 C18:1 C18:1 C18:2 C18:1 C18:1
C18:2 C18:2 C18:2 C18:2 C18:3 C18:2 C18:2 C18:2 C18:2 C18:2 C18:2
C18:2 C18:1 C18:2 C18:1 C18:2 C18:1 C18:2 C18:1 C18:2 C18:2 C18:3
C18:1 C18:2 C18:1 C18:2 C18:1 C18:2 C18:1 C18:2 C18:1 C18:2 C18:2
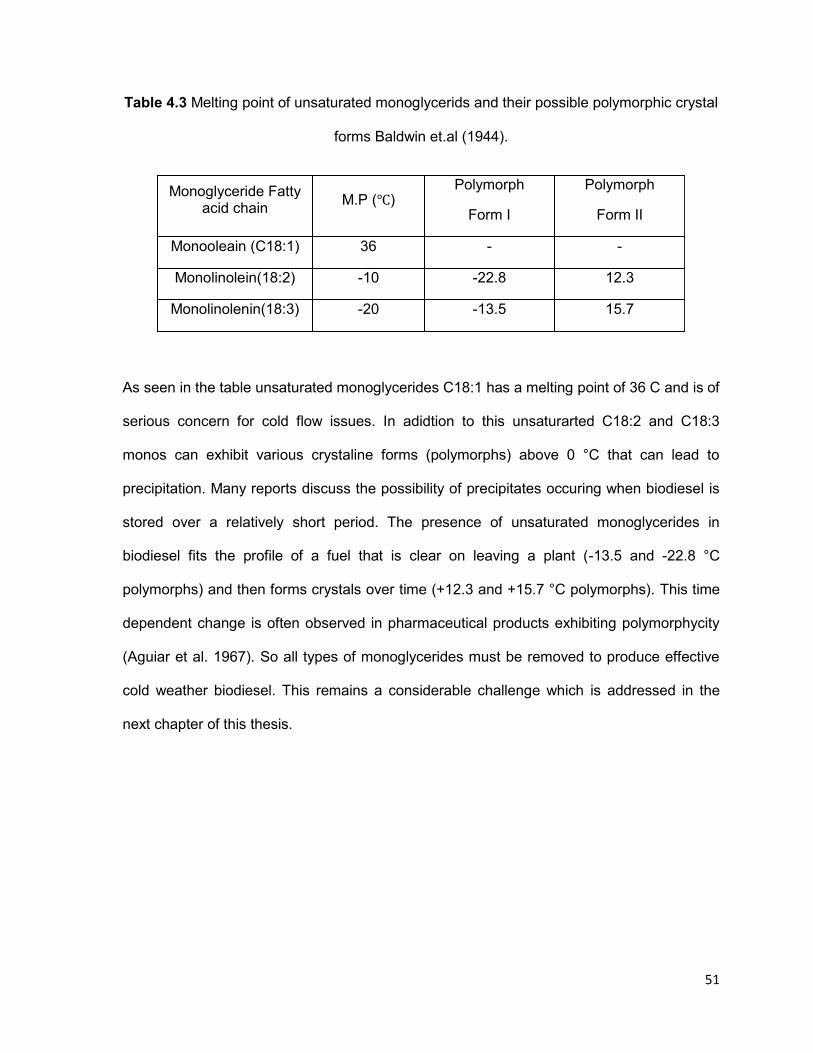
51
Table 4.3 Melting point of unsaturated monoglycerids and their possible polymorphic crystal
forms Baldwin et.al (1944).
Monoglyceride Fatty acid chain
M.P (℃) Polymorph
Form I
Polymorph
Form II
Monooleain (C18:1) 36 - -
Monolinolein(18:2) -10 -22.8 12.3
Monolinolenin(18:3) -20 -13.5 15.7
As seen in the table unsaturated monoglycerides C18:1 has a melting point of 36 C and is of
serious concern for cold flow issues. In adidtion to this unsaturarted C18:2 and C18:3
monos can exhibit various crystaline forms (polymorphs) above 0 °C that can lead to
precipitation. Many reports discuss the possibility of precipitates occuring when biodiesel is
stored over a relatively short period. The presence of unsaturated monoglycerides in
biodiesel fits the profile of a fuel that is clear on leaving a plant (-13.5 and -22.8 °C
polymorphs) and then forms crystals over time (+12.3 and +15.7 °C polymorphs). This time
dependent change is often observed in pharmaceutical products exhibiting polymorphycity
(Aguiar et al. 1967). So all types of monoglycerides must be removed to produce effective
cold weather biodiesel. This remains a considerable challenge which is addressed in the
next chapter of this thesis.
52
4.7 Conclusions
The saturated monoglycerides in the permeate from the membrane reactor were very low
and did not change over the course of the reaction. The saturated FAME was realtively
constant throughout the reaction. This was attributed to positional reactivity, with fatty acid
moeties in the sn1 and sn3 position reacting the fastest followed by slow reacting sn2
position. Saturated fatty acids naturally exist in sn1 and sn3 positions (Carpenter et al.
1976) and this explains constant saturated FAME concentrations from the begining of the
reaction. The unsaturated fatty acids usually take the sn2 position and are slower to fully
react. This causes a gradual increase in unsaturated FAME concentration as the reaction
proceeds. The preliminary investigation shows some promise for the design of a process
that uses the different kinetics of transesterification to obtain mixtures of FAMEs with
different cold flow characteristics. It also indicates that unsaturated monoglycerides should
be an important concern in the cold weather performance of biodiesel. Standards that
single out saturated vs unsaturated monoglycerides will not improve cold flow issues and all
monoglycerides must be minimized.

53
Chapter 5
Study on multi-stage transesterification reactions for production of high quality biodiesel.
54
Chapter 5
Study on multi-stage transesterification reactions for production of high quality biodiesel
Abstract
The work focuses on ways to greatly reduce monoglycerides (MG) in biodiesel with an
optimized cost efficient approach by mitigating to a greater extent the possibility of side
reactions (formation of soap). The effect of transesterification of oil as a function of alcohol,
temperature and catalyst concentration was investigated over two and three stage
reactions. Higher catalyst concentrations gave pure biodiesel with loss of yield. Three stage
transesterification reaction was found to be the most effective in greatly lowering the
monoglyceride concentration requiring least amount of catalyst and alcohol. The lowest
monoglyceride concentration reached was 0.03 Wt% at a soap concentration of 120 ppm in
the unwashed FAME phase.
Keywords: multistage, monoglycerides, yield, purity, membrane reactor, batch

55
5.1 Introduction
Biodiesel is defined as a fuel comprised of mono-alkyl esters of long chain fatty acids
derived from vegetable oils or animal fats. It can be used in diesel engines and heating
systems (Mittelbach et al. 1983; Staat and Vallet, 1994). Biodiesel has numerous benefits in
comparison with diesel fuel. It is a renewable, non-toxic and biodegradable fuel which has a
significant low emission profile and can be used as an alternative to petroleum-based diesel
fuel practically with no engine modifications. This implies less dependency on conventional
fossil fuels and low impact on the environment. In this context, many scientific articles
dealing with biodiesel production have been published. More recently, with the sharp
inflation of petroleum based diesel fuel, the demand for biodiesel has increased.
Furthermore, with advent of energy policy acts, the use of alternative fuels for transportation
has received a great boost. (Vincente et al. 2007)
The most common way to produce biodiesel is by transesterification. In this reaction,
triglycerides, as the main components of vegetable oils, react with an alcohol to produce
fatty acid mono-alkyl esters and glycerol as shown in Figure 5.1. The stoichometry of
methanolysis reaction requires 3 mol of methanol and 1 mol of triglyceride to give 3 mol of
fatty acid methyl ester and one mole of glycerol. The complete reaction consists of three
consecutive reversible steps with intermediate formation of monoglycerides and
diglycerides. Methanol is generally used for transesterification reactions as it is cheaper
than other higher alcohols. The biodiesel is then purified by water washing to remove
glycerol, catalyst and trace impurities. The purified biodiesel is then used as a diesel fuel.
The separated glycerol can be purified and used in pharmaceuticals and food industries
(Claude 1999, Vincente et al 2007).

56
O
CH2-O-C-R CH2-OH
O Catalyst O
CH2-O-C-R + 3 R’OH 3 R’-O-C-R + CH-OH
O
CH2-O-C-R CH2-OH
Triglyceride Alcohol Alkyl ester Glycerol
Figure 5.1 Transesterification Reaction (Van Gerpan 2005)
This transesterification is generally catalysed by a basic or an acid catalyst. The base
catalysed transesterification is the most commonly used technique, because the process
proves to be faster and the reaction conditions are moderate (Freedman et al. 1984). The
most commonly used basic catalysts are sodium hydroxide and potassium hydroxide.
However, the use of alkali catalysts in vegetable oil transesterification produces side
reactions that are undesirable in a process. The most common side reaction is
saponification of triglyceride and the neutralisation of free fatty acids to form soap as shown
in Figure 5.2. Both soap formations are undesirable as they partially consume the catalyst,
decrease the biodiesel yield and make the separation and purification steps cost intensive
(Vicente et al. 2004).
RCOOH + NaOH RCOONa + H2O
Fatty Acid Sodium Hydroxide Sodium Soap Water
Figure 5.2 Saponification reaction

57
Biodiesel does not contain 100 % fatty acid methyl esters; it can also contain significant
amounts of mono, di- and tri-glyceride depending on the completion of the transesterification
reaction (Van Gerpen 1997). These impurities can cause filter plugging issues and have
been discussed extensively in the literature (Chupka et al. 2011). Pfalzgraf and co-workers
studied the impact of sterol glucosides (SG) and monoglycerides on filtration time after a
reduction in temperature of the biodiesel and found that all of the tested impurities could
potentially contribute to higher filtration times (Pfalzgraf et al 2007, Chupka et al. 2011). This
brings in the need to improve the purity of biodiesel. Many studies have been carried out on
base – catalysed transesterification involving calculations on triglyceride conversion rates,
product composition as a function of time (Feuge and Gros, 1949; Freedman et al. 1984,
1986; Schwab et al. 1987; Peterson et al. 1991; Mittelbach and Trathnigg, 1990; Ali et al.
1995; Chang et al. 1996; Mittelbach, 1996; Coteron et al. 1997; Boocock et al. 1998;
Noureddini et al. 1998; Vicente et al. 1998; Darnoko and Cheryan, 2000). Most of these
studies are related to fatty acid methyl ester concentration in the biodiesel phase i.e. purity
of biodiesel. Although, the other important factor of transesterification process is the yield, it
has not been discussed extensively in literature (Frohlich and Rice, 1995; Frohlich et al.
2000; Vicente et al. 2004). According to these authors, the loss of biodiesel yield is because
of two major reasons, saponification of triglycerides and dissolution of fatty acid methyl
esters in glycerol phase (Vincente et al. 2007).
5.2 Objectives
In this present study, multistage transesterification reactions were carried out to
greatly reduce the monoglyceride concentration by minimising the yield lose due to soap

58
formation. Different approaches were investigated with a motive to develop a process that
uses lowest catalyst and methanol concentration to obtained desired results.
5.3 Methods
5.3.1 Feed Stock and Reagents
Refined Bleached and Degummed Canola oil (Spectra Foods brand) (Baie-d'Urfe, QC) was
obtained from Tannis Food Distributors (Ottawa, ON) in a 16 L container and was used in
this study. The acid used for neutralization was hydrochloric acid (Assay: 36.5-38%, Fisher
Scientific, Canada). The alcohol used for the reactions was 99% pure methanol (Fisher
Scientific, Canada) and the catalyst was 25 wt% sodium methoxide in methanol (Sigma-
Aldrich, Canada). A complete list of chemicals used in the preparation of the biodiesel in this
work is included in Table 5.1.
Table 5.1 Chemicals used to prepare biodiesel
Chemical Supplier Location Purity
Methanol Optima
Grade
Fisher Scientific Fair Lawn, NJ >99.9 %
Sodium methoxide
solution, 25wt%
Sigma-Aldrich Oakville, ON 23.5-26.5
Sulphuric acid,
Certified ACS Grade
Fisher Scientific Ottawa, ON 95-98
Hydrochloric acid,
Certified ACS Grade
Fisher Scientific Ottawa, ON 36.5-38
59
5.4 Experimental Setup
5.4.1 Membrane Reactor Setup
The experiment was carried out as two and three stage reactions. A UF membrane setup
was employed as shown in Figure 5.3. Stage one reactions were performed in a membrane
reactor.
1. The loop was equipped with a shell and tube heat exchanger to maintain the
temperature of the fluid at a constant value.
2. A water bath was used to control the water temperature, which was the heat
supplying fluid.
3. A platinum resistance temperature detector (RTD) was used in the membrane loop
to measure the temperature of the mixture at any given time.
4. Three pumps were used in the loop: two gear pumps were used to pump methanol
and oil separately into the loop and a centrifugal pump was used to circulate the
reaction mixture in the loop.
5. The system was operated in a semi-continuous mode, where the desired amount of
oil and methanol was loaded in the loop at the beginning of the run.
6. Methanol and oil were fed to the loop with predetermined flow rate during the run.
7. Provision was given through a separate line to backflush/backwash the membrane
with methanol between two subsequent runs to ensure that no fouling or oil
deposition remained on the membrane surface and inside the pores.
8. The process control software named Labview® (National Instruments), was used to
control the methanol feed pump, the flux, temperature, operational cycle and TMPs
in all runs.
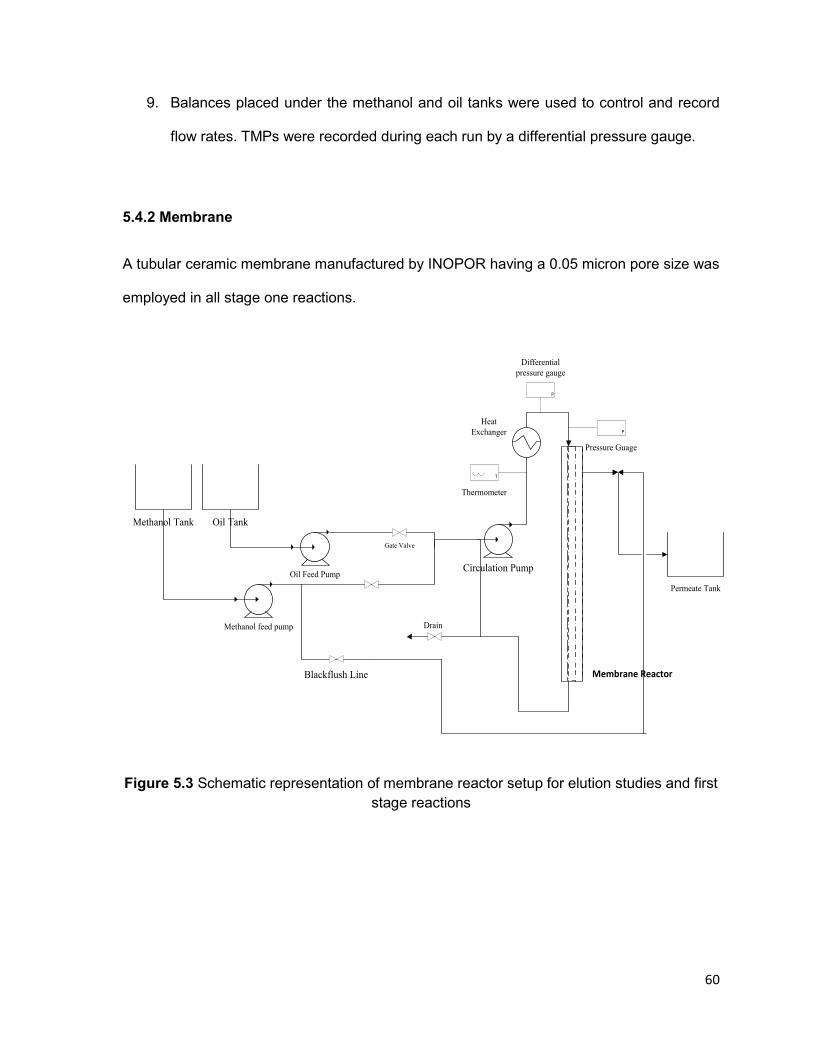
60
9. Balances placed under the methanol and oil tanks were used to control and record
flow rates. TMPs were recorded during each run by a differential pressure gauge.
5.4.2 Membrane
A tubular ceramic membrane manufactured by INOPOR having a 0.05 micron pore size was
employed in all stage one reactions.
Oil TankMethanol Tank
Oil Feed Pump
Methanol feed pump
Gate Valve
Blackflush Line
Circulation Pump
P
T
Thermometer
P
Pressure Guage
Membrane Reactor
Permeate Tank
Drain
Differential
pressure gauge
Heat
Exchanger
Figure 5.3 Schematic representation of membrane reactor setup for elution studies and first
stage reactions
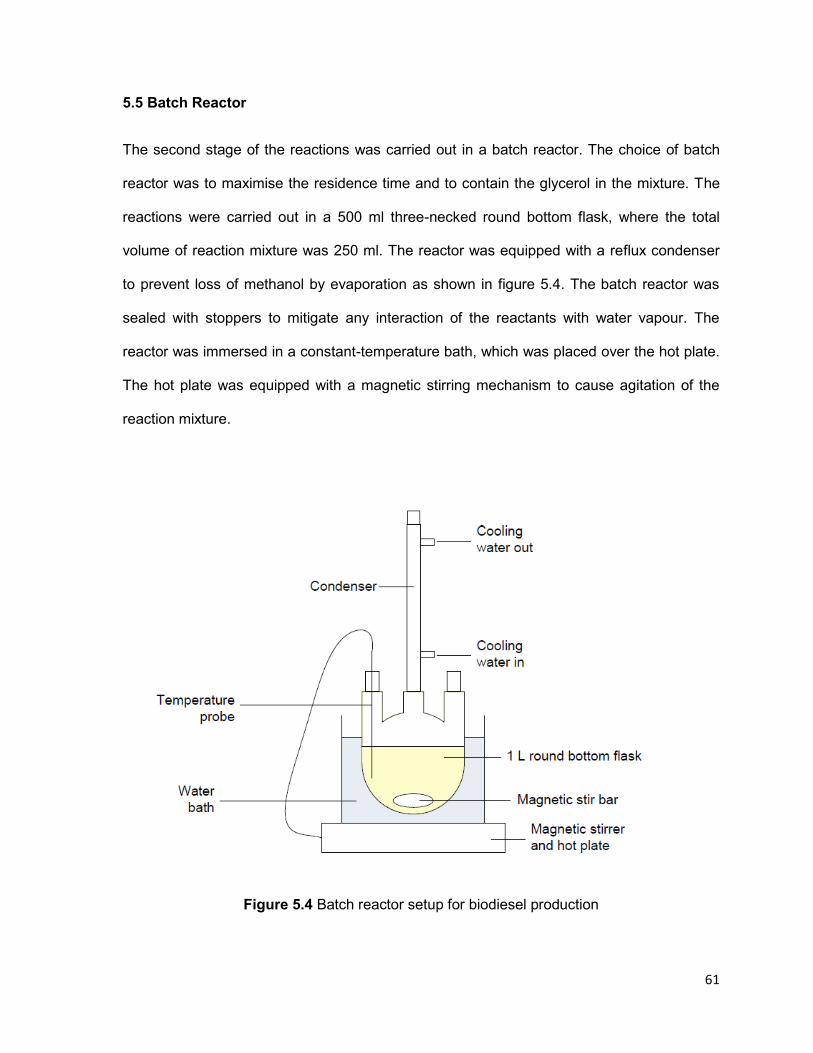
61
5.5 Batch Reactor
The second stage of the reactions was carried out in a batch reactor. The choice of batch
reactor was to maximise the residence time and to contain the glycerol in the mixture. The
reactions were carried out in a 500 ml three-necked round bottom flask, where the total
volume of reaction mixture was 250 ml. The reactor was equipped with a reflux condenser
to prevent loss of methanol by evaporation as shown in figure 5.4. The batch reactor was
sealed with stoppers to mitigate any interaction of the reactants with water vapour. The
reactor was immersed in a constant-temperature bath, which was placed over the hot plate.
The hot plate was equipped with a magnetic stirring mechanism to cause agitation of the
reaction mixture.
Figure 5.4 Batch reactor setup for biodiesel production
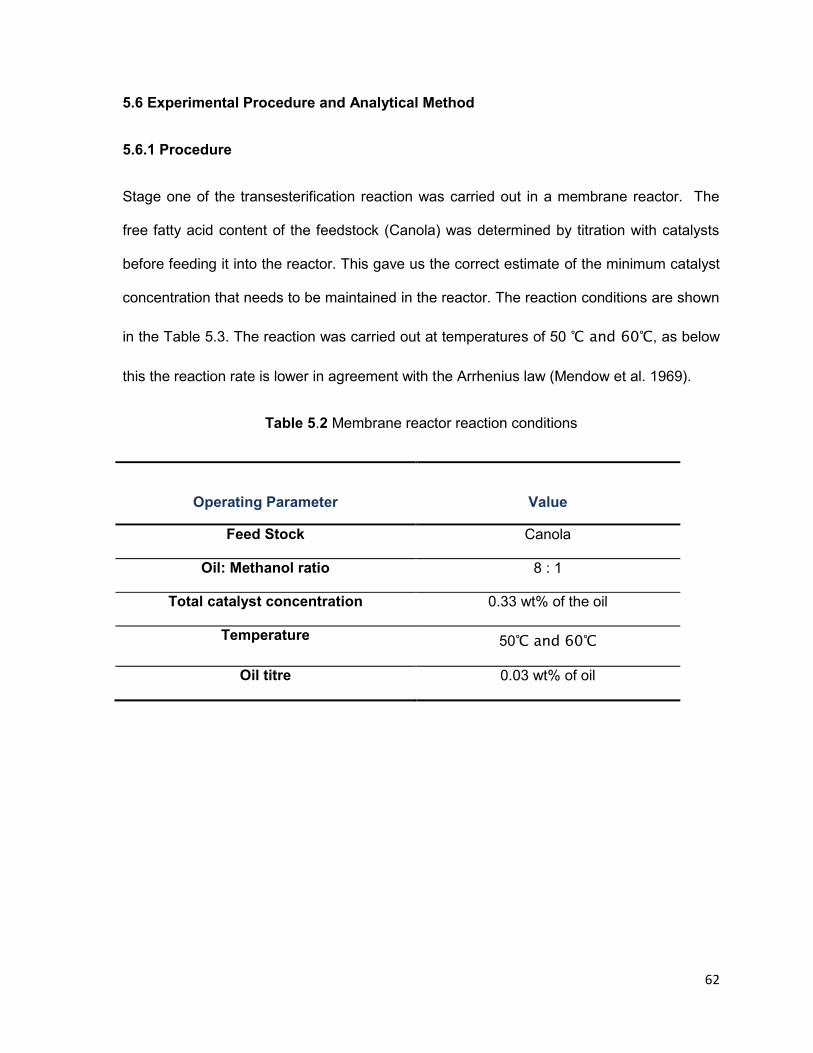
62
5.6 Experimental Procedure and Analytical Method
5.6.1 Procedure
Stage one of the transesterification reaction was carried out in a membrane reactor. The
free fatty acid content of the feedstock (Canola) was determined by titration with catalysts
before feeding it into the reactor. This gave us the correct estimate of the minimum catalyst
concentration that needs to be maintained in the reactor. The reaction conditions are shown
in the Table 5.3. The reaction was carried out at temperatures of 50 ℃ and 60℃, as below
this the reaction rate is lower in agreement with the Arrhenius law (Mendow et al. 1969).
Table 5.2 Membrane reactor reaction conditions
Operating Parameter
Value
Feed Stock Canola
Oil: Methanol ratio 8 : 1
Total catalyst concentration 0.33 wt% of the oil
Temperature 50℃ and 60℃
Oil titre 0.03 wt% of oil

63
Biodiesel was produced in the membrane reactor according to the following procedure:
a) The membrane reactor was backflushed with pure methanol to remove any
residual oil and fouling deposits on the membrane walls from previous runs.
b) Permeate and the backflush lines were closed.
c) Initial weight of the oil and methanol was recorded from the balance. Labview
software was started to record the run information.
d) The feed valves pertaining to oil were opened, and the oil was fed into the reactor.
e) Oil was circulated to reach a desired temperature.
f) Methanol was fed into the reactor and the circulation pump was started.
g) After a residence time of 60 minutes, methanol and oil was continuously fed into
the reactor with a constant flow rate such that the predetermined overall molar
ratio of 8:1 was maintained.
h) Permeate was collected after 60 minutes from the start of the run until end of the
run.
i) A total of 16 L of biodiesel was produced for use in stage two reactions.
j) Circulation was stopped and the shut down procedures were followed as
mentioned in the appendix A.

64
5.6.2 Analysis
The samples to be analysed, must be free from any catalyst and methanol. In order to
obtain pure biodiesel, a series of processes are usually required. These can include:
gravitational settling, centrifugation, water washing, adsorption and distillation
Karaosmanoglu et al. (1996).
The most common method for purification of the biodiesel is water-washing. FAME and
unreacted TG are essentially non-polar and insoluble in water, while soap, methanol and
glycerol are polar and readily soluble in water. Therefore, adding water to the non-polar
phase is usually the first and the most common step in purifying biodiesel (Clements et al.
2004). Similar method of water washing was employed to wash the biodiesel produced from
transesterification reaction and is illustrated below.
a) 30 ml of biodiesel sample is taken in a vial.
b) 13 percent by weight 0.02M hydrochloric acid is added to the vial.
c) The contents are shaken well and spun in a centrifuge at 5000 rpm for 10
minutes.
d) The bottom phase is carefully removed.
e) 10 percent by weight distilled water is added to the vial.
f) The contents are shaken well and spun in a centrifuge at 5000 rpm for 10 min.
g) The bottom phase is carefully removed.
h) The sample is then evaporated for trace amounts of methanol and water for
30 min at 100 mbar.
i) The sample is ready derivatization and analysis.

65
5.6.3 Analytical Methods
A GC, a Varian CP-3800, was used to determine the concentration of monoglycerides,
diglycerides and triglycerides in FAME corresponding to individual samples by ASTM
method. A 15 m x 0.32 mm x 0.1 μm column from Restek (MXT – Biodiesel TG) was used
with a guard column of 2 m x 0.53 mm. Calibration curves for the GC were generated using
two internal standards (butanetriol and tricaprin) and four references namely glycerine,
monoolein, diolein, and triolein. Three replicate injections at 5 separate concentrations were
performed to yield a glycerol calibration curve, R2 > 0.99 to meet the ASTM requirement
(Jehad Et al. 2010).
5.6.4 Sample Preparation for Analysis
(a) Weigh 100 µL of FAME in a 40 mL septa vial.
(b) 100 μL of MSTFA, Butanetriol and Tricaprin were added in 5 minute intervals.
(c) The vial was then shaken to mix the contents and left to stand for 15 min at room
temperature.
(d) Approximately 8 mL of n-heptane was then added to the vial.
(e) 1 μL of the prepared sample mixture was then injected in the GC.
The operating conditions for the column oven were 50°C for 1 min before ramping 15°C/min
to 180°C, 7°C/min to 230°C and finally 30°C/min to 380°C. The oven was held at 380°C for
10 min. The carrier gas, helium was held at a constant flow of 3.0 mL/min, flame ionization
detector (FID) was held at 380°C, Hydrogen flow was kept constant at 35 mL/min, air flow
rate was at 350 mL/min, and Helium flow rate was at 30 mL/min (Jehad Saleh et al. 2010).

66
5.7 Batch reactions
The permeate from the membrane reactor was collected to perform further reactions. Figure
5.5 below gives the list of runs that were performed as stage 2 and stage 3
transesterification reactions.
Figure 5.5 List of runs performed in a batch reactor
5.8 Reaction Stages
The main priority is to develop a multistage approach which runs on moderate operating
temperature, low methanol to oil ratio and very low catalyst concentrations thereby giving
best biodiesel purity (> 99.8%) and high yield and also which is viable economic point of
Rx 1 – Membrane Reactor
50℃ / 0.33 wt% / Recycle / 8:1 Methanol
Rx 2 – Batch Reactor (polar phase
removed)
50℃ / 0.1-0.6 wt% / 2:1 Methanol
Rx 2 – Batch Reactor (polar phase
retained)
50℃ / 0.1-0.6 wt% / No Methanol
Rx 3 – Batch Reactor (polar phase
removed from Rx 2)
50℃ / 0.05-0.3 wt% / No Methanol
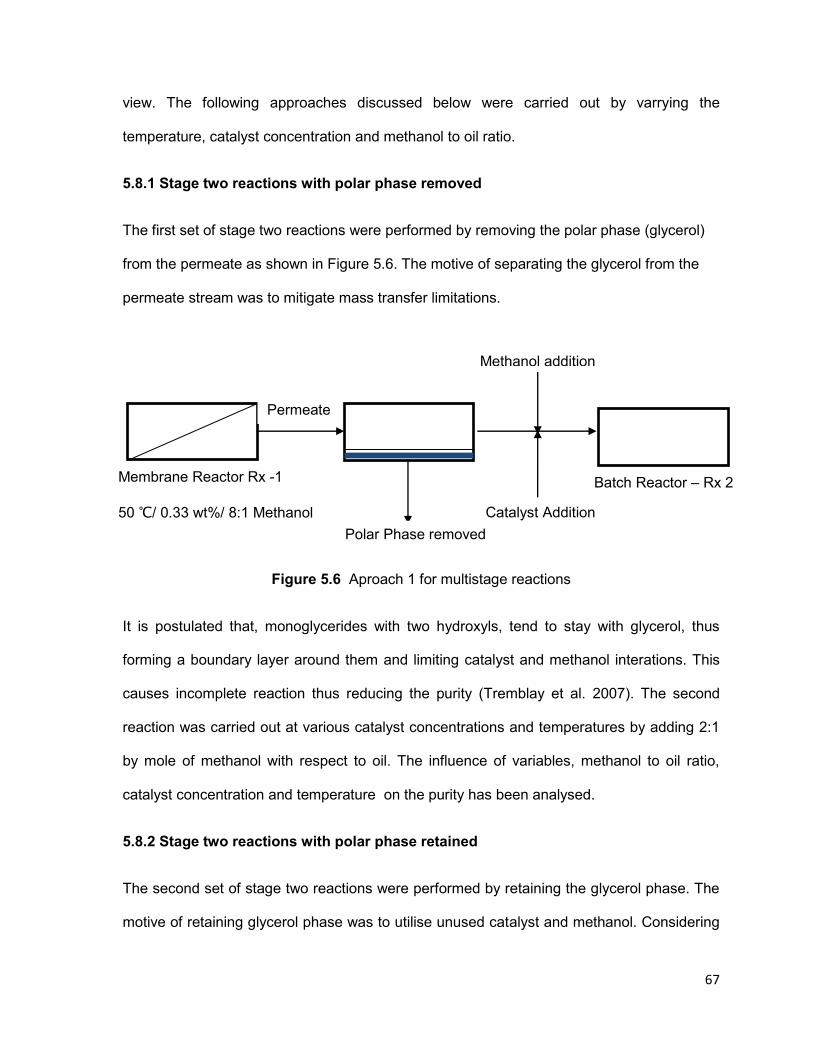
67
view. The following approaches discussed below were carried out by varrying the
temperature, catalyst concentration and methanol to oil ratio.
5.8.1 Stage two reactions with polar phase removed
The first set of stage two reactions were performed by removing the polar phase (glycerol)
from the permeate as shown in Figure 5.6. The motive of separating the glycerol from the
permeate stream was to mitigate mass transfer limitations.
Figure 5.6 Aproach 1 for multistage reactions
It is postulated that, monoglycerides with two hydroxyls, tend to stay with glycerol, thus
forming a boundary layer around them and limiting catalyst and methanol interations. This
causes incomplete reaction thus reducing the purity (Tremblay et al. 2007). The second
reaction was carried out at various catalyst concentrations and temperatures by adding 2:1
by mole of methanol with respect to oil. The influence of variables, methanol to oil ratio,
catalyst concentration and temperature on the purity has been analysed.
5.8.2 Stage two reactions with polar phase retained
The second set of stage two reactions were performed by retaining the glycerol phase. The
motive of retaining glycerol phase was to utilise unused catalyst and methanol. Considering
Permeate
Catalyst Addition
Batch Reactor – Rx 2
Polar Phase removed
Membrane Reactor Rx -1
50 ℃/ 0.33 wt%/ 8:1 Methanol
Methanol addition

68
their polarity, methanol and catalyst would go into glycerol phase. Thus, retaining the phase
would cut down the need for adding more methanol. Also, glycerol would contain the soap
formed in the reaction thus lowering the amount of soap in the FAME phase. The reactions
were carried out adding the catalyst solution and keeping all other parameters constant as
shown in Figure 5.7. The biodiesel from stage two was then reacted again as stage three,
with addition of catalyst.
Figure 5.7 Approach 2 for multistage reactions
5.8.3 Stage three reactions with polar phase removed post stage two
In this variation, the total catalyst was divided between reaction 2 and 3 as shown in Figure
5.8. The approach further lowers the need of addition additional methanol and also lowers
the overall soap in the FAME phase.
Figure 5.8 Approach 3 for multistage reactions
Permeate
Membrane Reactor Rx -1
50 ℃/ 0.33 wt%/ 8:1 Methanol
Polar Phase retained
No Methanol addition
Catalyst addition
Batch Reactor – Rx 2
Membrane Reactor Rx -1
50 ℃/ 0.33 wt%/ 8:1 Methanol
Polar Phase retained
Catalyst addition
Batch Reactor – Rx 2
Polar Phase removed
Batch Reactor – Rx 3
No Methanol
addition

69
5.9.Results and Discussions
5.9.1 Effect of catalyst concentration, temperature and methanol to oil ratio on soap
formation
Regarding the yield, the most important factor is the catalyst concentration. The second
most important factor is the temperature. Both have a negative impact on the biodiesel yield.
Therefore, any increase in temperature and catalyst concentration will reduce the biodiesel
yield (Vincente et al. 2007). Figures 5.9 shows the soap concentration as a function of
catalyst.
Figure 5.9 Catalyst concentration vs soap at different temperatures – Stage 2 polar phase
removed (Approach 1)
As it can be observed, the influence of temperature on low catalyst concentration is not
substantial but at the same time cannot be ignored. Saponification is favored at high
temperatures and catalyst concentrations. This side-reaction produces sodium soap thus,
decreasing the biodiesel yield and results were in agreement to Vincente et al. 2007.

70
The reaction with no addition of methanol produce less soap in the FAME phase as seen by
comparing Figures 5.9 and 5.10. Owing to their polarity, the soaps dissolved into the
glycerol phase during the separation stage after the reaction. In addition, the dissolved
soaps increased the methyl ester solubility in the glycerol, causing additional yield loss
when the phases are separated (Vincente et al. 2007). The concentration of soap in the
glycerol phase seen in Figure 5.10 was much greater than the FAME phase as expected
due to the polarity of the soap molecules.
Figure 5.10 Catalyst concentration Vs Soap - stage 2 with polar phase retained
(Approach 2)
5.9.2 Effect of catalyst concentration, temperature and methanol to oil ratio on purity
The initial catalyst concentration, methanol: oil molar ratio and temperature are the most
important factors and all of them have a positive effect on the biodiesel purity. In other
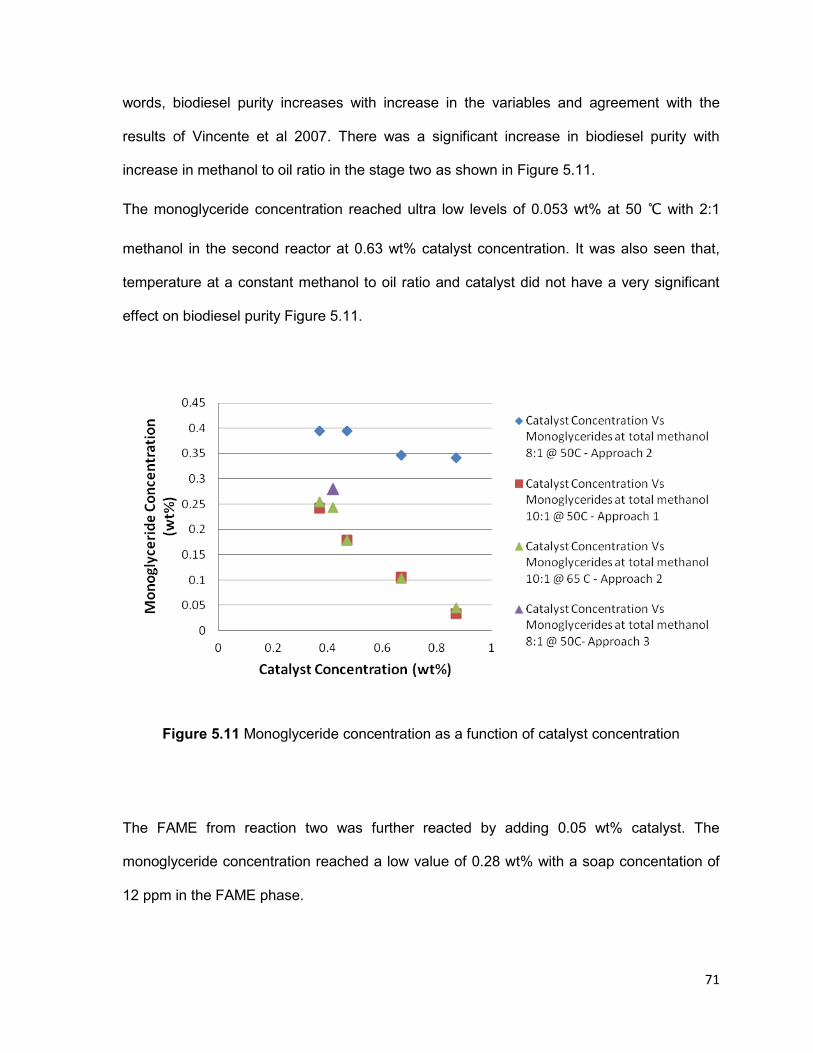
71
words, biodiesel purity increases with increase in the variables and agreement with the
results of Vincente et al 2007. There was a significant increase in biodiesel purity with
increase in methanol to oil ratio in the stage two as shown in Figure 5.11.
The monoglyceride concentration reached ultra low levels of 0.053 wt% at 50 ℃ with 2:1
methanol in the second reactor at 0.63 wt% catalyst concentration. It was also seen that,
temperature at a constant methanol to oil ratio and catalyst did not have a very significant
effect on biodiesel purity Figure 5.11.
Figure 5.11 Monoglyceride concentration as a function of catalyst concentration
The FAME from reaction two was further reacted by adding 0.05 wt% catalyst. The
monoglyceride concentration reached a low value of 0.28 wt% with a soap concentation of
12 ppm in the FAME phase.
72
5.10 Conclusions
The following set of conclusions can be derived from the study.
The most effective way of reaching ultra low concentration of monoglycerides is by
carrying out multi-stage transesterification.
It can be postulated that, the stage one of the reaction can be performed to react the
position 1 and 3 of the triglyceride molecule and further esterification can be carried
out to react position 2.
The factors affecting the biodiesel purity are catalyst concentration, methanol to oil
ratio and the temperature. All of them have a positive effect on the biodiesel purity
and therefore the biodiesel purity increases when the values of these variables
increase, the results which were in agreement with Vincente et al 2007. The most
significant effect was seen in the case of catalyst concentration.
The most important factors affecting the biodiesel yield is catalyst concentration,
methanol ratio and the temperature. Catalyst concentration has the greatest effect
on increasing soap formation while the temperature range studied had less of an
effect, the results which were in agreement with Vincente et al 2007.
From the priliminary runs, it was also observed that conversion from the membrane
reactor plays a very important role in bringing down the monoglyceride and soap
concentrations in the further reactions. It is desirable to achieve higher conversion
from the reactor one to achieve significant lower concentrations of MG and lower
soap concentrations.
The knowledge derived from the priliminary runs was that the three stage
transesterification reaction is the most suitable approach to bring down the

73
monoglyceride and soap concentration in the FAME phase with lowest catalyst and
alcohol consumption.
The three stage reaction gave a purity of 0.28 wt% and low soap formation of 12
ppm at moderate temperature of 50 ℃, at a total methanol concentration of 8:1 and
low catalyst concentration of 0.45 wt% . Furtherwork is currently underway to
analyse other approaches in producing pure biodiesel and in turn mitigating the loss
of yield and will be a matter of subsequent publications.
74
Chapter 6
6.1 Overall Conclusions
There is an increasing global concern surrounding the dwindling reserves of fossil fuels.
With newer oil wells hard to reach, and global warming being a significant challenge, the
scientific fraternity has started to focus on production of Biofuels for a sustained fuel source.
Biodiesel of all the Biofuels has gained extra attention because of its striking similarities with
petro diesel. However, the issues related to cold flow operatability plague the wide spread
use of the biodiesel. There has been substantial work carried out to determine the impact of
monoglycerides on the cloud point. Monoglycerides, which are a result of incomplete
reaction, have been identified as the major source of issues pertaining to filter plugging.
Monoglycerides have a very high melting point and could start to crystallise at temperature
well above cloud point. Hence, it calls for more stringent norms and methods to greatly
reduce monoglycerides to tackle cold flow issues and to facilitate widespread use of
biodiesel as an alternative to petro diesel.
Chapter 4
In this project, a membrane reactor was employed to speciate saturated monoglycerides
through continuous elution reaction. Series of experiments were performed to speciate
saturated monoglycerides as the reaction proceeded. The effect of variables, temperature,
catalyst concentration and methanol to oil ratio was also investigated.
From the preliminary results, there was no significant difference in the amounts of saturated
monoglycerides as a function of time. The saturated monoglycerides remained low
throughout the reaction.

75
From the results, it was realised that the positional distribution of fatty acids plays a
significant role in the reaction kinetics. The fatty acid chain in the second position is hard to
reach and reacts the slowest. Saturated fatty acids rarely occupy the second position, thus
explaining the results of high amount of unsaturated monoglycerides in the permeate
stream. The results were in agreement to stavarache et al 2007. Also, there was no
significant difference in the saturated monoglyceride content with change in temperature,
catalyst concentration and methanol to oil ratio. It was seen that unsaturated
monoglycerides were the dominant factor in biodiesel and that the saturated
monoglycerides are not present in great amounts as reports in the literature.
Chapter 5
As a part of my thesis, a novel two stage transesterification process was developed to
greatly reduce the monoglycerides. The effect of catalyst concentration, methanol to oil ratio
and temperature were analysed over multi stage transesterification reactions. The first stage
of the reaction was carried out by a membrane reactor and the second stage in a batch
reactor. The two stage system was successful and represented ultra low monoglyceride
concentrations. The system was studied to obtain low monoglyceride concentrations at low
catalyst and methanol concentrations. The effect of these variables on the yield was also
investigated. The initial results were in agreements with Vincente at al 2007. The yield
decreased with increase in catalyst concentration and temperature. High methanol ratio too
resulted in decrease in yield due to mutual solubility. Purity on the other hand, had a positive
impact on the catalyst concentration and methanol ratio. The runs were performed with
three major configurations. The first configuration of retaining polar phase in the second
stage, was not every effective in reducing the monoglyceride concentration over two stages.
This can be attributed to the mass transfer limitations due to micelle formation. However, it
76
was observed to be the best approach over three stages. The product was further reacted
as reaction three after removing the polar phase. A low concentration of 0.28 wt % with 17
ppm of soap in FAME phase was achieved. The total methanol to oil ratio was at 8:1, the
temperature at 50OC and the total catalyst concentration was 0.42 wt %. This is a novel
result as not much work has been carried out in the literature pertaining to two stage
reactions with an idea to lower monoglycerides. The third configuration at 10:1 alcohol gave
0.03 wt % monoglyceride concentration. However, it was not considered the best approach
as there was considerable yield loss due to formation of soap. The soap concentration in the
FAME phase was 120 ppm.

77
6.2 Recommendations
Very little is covered in the literature pertaining to the work carried out in this thesis. The
elusion study is a novel way of speciating saturated monoglycerides during the reaction.
Further work can be carried out to understand the chain positioning for various feedstocks
and the positional affinity to react faster. Enzymes can be used to selectively react saturated
fatty acid chains based on positional distribution. Also, the impact of unsaturated
monoglycerides on the cold flow properties can be analysed.
There is a great scope of work in the second project carried out. It would be interesting to
see the effect of low catalyst concentrations in the stage one of the process. The methanol
to oil ratio can be investigated over two or three stages by maintaining the total ratio
constant. There is also scope of investigating soap formation and monoglyceride conversion
to FAME. The process can also be investigated over higher alcohols and different
feedstocks. The multistage transesterification can be analysed over a continuous stirred,
membrane and batch reactors.

78
Chapter 7
References
Alleman, T. L.; McCormick, R. L. (2008) Results of the 2007 B100 Quality Survey,
NREL/TP-540-42787, National Renewable Energy Laboratory: Golden, CO.
Aguiar, A.; KRC, J.; Kinwel, A.W.; Samyn, (1967) J.C. Effect of Polymorphism on the
Absorption of Chloramphenicol from Chloramphenicol Palmitate, Journal of Pharmaceutical
Science, Vol. 56, No. 7.
Antonio Zamora (2012) http://www.scientificpsychic.com/fitness/fattyacids1.html
Broge, J.L., Revving Up For Diesel, Automotive Eng. Int. 110: 40–49 (2002). Energy
Information Administration, Official Energy Statistics from the U.S. Government.
Cao, P., Tremblay, A.Y., Dubé, M.A., Morse, K., (2007) Effect of membrane pore size on the
performance of a membrane reactor for biodiesel production, Ind. Eng. Chem. Res., 46: 52-
58.
Dubé, M.A., Tremblay, A.Y., Liu, J. (2007) Biodiesel production using a membrane reactor,
Biores. Tech., 93: 639-647.
Dunn, R. O. (2009) Prog. Energy Combust. Sci. 35, 481– 489.
Dunn, R.O., and M.O. Bagby, (1995) Low-Temperature Properties of Triglyceride-Based
Diesel Fuels: Transesterified Methyl Esters and Petroleum Middle Distillate/Ester Blends, J.
Am. Oil Chem. Soc. 72: 895–904.
Fredick, E.; Foubert, I.; Van De Sype, J.; Dewettinck, K. (2008) Cryst. Growth
Des. , 8, 1833–1839.
79
Gerpen, J, Shanks, B, Pruszko, R. (2004) Biodiesel Production Technology, National
Renewable Energy Laboratory. Subcontractor Report, NREL/SR-510-36244.
Gunstone, F.D., J.L. Harwood and F.B. Padley, (1994) Lipid Handbook. 2nd Edn. Chapman
and Hall, London. Gutfinger, T.; Letan, (1974) A. Lipids, 9, 658– 663
Knothe, G., Bagby, M., and Ryan, T., (1997) "Cetane Numbers of Fatty compounds:
Influence of Compound Structure and of Various Potential Cetane Improvers," SAE
Technical Paper
Karaosmanoglu, F., Cigizoglu, K.B., Tuter, M., Ertekin, S., (1996) Investigation of the
refining step of biodiesel production, Energy Fuels., 10: 890-895.
Lee, I., L.A. Johnson, and E.G. Hammond, Use of Branched-Chain Esters to Reduce the
Crystallization Temperature of Biodiesel, J. Am. Oil Chem. Soc. 72: 1155–1160 (1995).
McCormick, R.L., J.D. Ross, and M.S. Graboski (1997), Effect of Several Oxygenates on
Regulated Emissions from Heavy-Duty Diesel Engines, Environ. Sci. Technol. 31: 1144–
1150.
Meher, L., Sagar, D., and Naik S., 2006. Technical aspects of biodiesel production by
transesterification: a review. Renewable and Sustainable Energy Reviews, 10, 248-268
(2006).
Monyem, A., and J.H. Van Gerpen (2001), The Effect of Biodiesel Oxidation on Engine
Performance and Emissions, Biomass Bioenergy 4: 317–325.
Mercedes Martínez, Gemma Vicente and José Aracil (2007) Optimisation of
integrated biodiesel production. Part I. A study of the biodiesel purity and yield Original
Research Article Bioresource Technology, Volume 98, Issue 9, Pages 1724-1733
Pfalzgraf, L.; Lee, I.; Foster, J.; Poppe, (2007) G. AOCS Inform Special Supplement;
Biorenewable Resources No. 4, 17
Rodriguez-Spong, B.; Price, C. P.; Jayasakar, A.; Matzger, A.; Rodriguez-Hornedo, (2004)
N. Adv. Drug Delivery Rev., 56, 241– 274
80
Schumacher, L.G., and B.T. Adams (2002), Using Biodiesel as a Lubricity Additive for
Petroleum Diesel Fuel, ASAE Paper 026085.
Sharp, C.A., S.A. Howell, and J. Jobe (2000), The Effect of Biodiesel Fuels on Transient
Emissions from Modern Diesel Engines, Part I. Regulated Emissions and Performance,
SAE Paper No. 2000-01-1967.
Tat, M.E, and J.H. Van Gerpen (2003), Fuel Property Effects on Biodiesel, Presented at the
American Society of Agricultural Engineers 2003 Annual Meeting, ASAE Paper 036034, Las
Vegas, July 27–30.
Tat, M.E., and J.H. Van Gerpen (1999), The Kinematic Viscosity of Biodiesel and Its Blends
with Diesel Fuel, J. Am. Oil Chem. Soc. 76: 1511–1513.
Tyson, K.S., McCormick, R.L., (2006). Biodiesel Handling and Use Guide, Third Edition,
National Renewable Energy Laboratory. Technical Report, NREL/TP-450-40555.
Van Gerpen, J.H., E.G. Hammond, L. Yu, and A. Monyem (1997), Determining the Influence
of Contaminants on Biodiesel Properties, Society of Automotive Engineers Technical Paper
Series No. 971685, Warrendale, PA.
Van Gerpen, J.,(1996) Cetane Number Testing of Biodiesel, Liquid Fuels and Industrial
Products from Renewable Resources, in Proceedings of the Third Liquid Fuels Conference,
Nashville, Sept. 15–17.

81
Appendix
82
Appendix A: Gas chromatography (GC) operation guide
(ASTM D6584 – Cold on column injector)
Sample Preparation
(All steps written below are done under nitrogen in the glove compartment)
1. Weigh 100 mg of sample into a 10 ml septa vial.
2. Add 100 μl of each Butanetriol (internal standard 1), Tricaprin (internal standard 2), and
MSTFA into the sample vial. Both internal standards are located in the refrigerator in room
D403 - Make sure you put the standard solutions back in the refrigerator after you’re
done.
3. Shake the vial and let it set for 20 minutes at room temperature.
4. Add 8 ml of high grade n-heptane into the vial and shake for a few seconds.
5. Remove approximately 1 ml of the sample mixture into GC auto sampler vials.
6. Label the 10 ml vial and the auto sampler vial accordingly.
Getting Ready
1. Check that gas filters are still functional. All carrier and detector filters should be changed
when indicator shows filter is spent. Oxygen contamination in carrier gas can produce
excessive column bleed and hydrocarbons cause ghost peaks or increase detector noise.
2. Open the valves on the helium, air, and hydrogen tanks. Verify that they are set to the
appropriate pressures; if not, adjust the set-screw accordingly.
Helium, carrier gas, set point is ~80 psi
Compressed air, set point is ~60 psi
Hydrogen, set point is ~40 psi
83
3. Always leave at least 400 psi residual gas in a depleted cylinder. As the cylinder pressure
drops, the concentration of the impurities such as moisture and hydrocarbons increase
which will lead to column damage. In addition, if the cylinder pressure drops below the
supply pressure required by the GC, retention times and detector sensitivities can slowly
change and affect the validity of data gathered.
Safety guidelines
• All Lab workers should take the WHMIS exam and Lab training prior to working in the Lab.
• All safety equipment i.e. lab coat, safety goggle and gloves should be used during these
experiments.
• Both methanol and sodium methoxide (The homogenous catalyst) are extremely toxic. The
MSDS of methanol and sodium methoxide should be carefully read beforehand.
• The reactor temperature should not exceed 67°C to avoid the methanol evaporation.
• Always lower the fume hood sash when working with methanol and sodium methoxide.
• Locate spill kit and pads.
• Reactor pressure should not exceed 50 psi. If it reaches this pressure, turn off all
pumps and consult your supervisor.