reducing surgical site infections (ssis) learning session 1
TRANSCRIPT

Reducing Surgical Site Infections(SSIs)
Learning Session 1Western Cape, July 2015

To reduce Surgical Site Infections (SSIs)using a ‘care bundle’ and a
Quality Improvement (QI) approach
Aim of the SSI collaborative
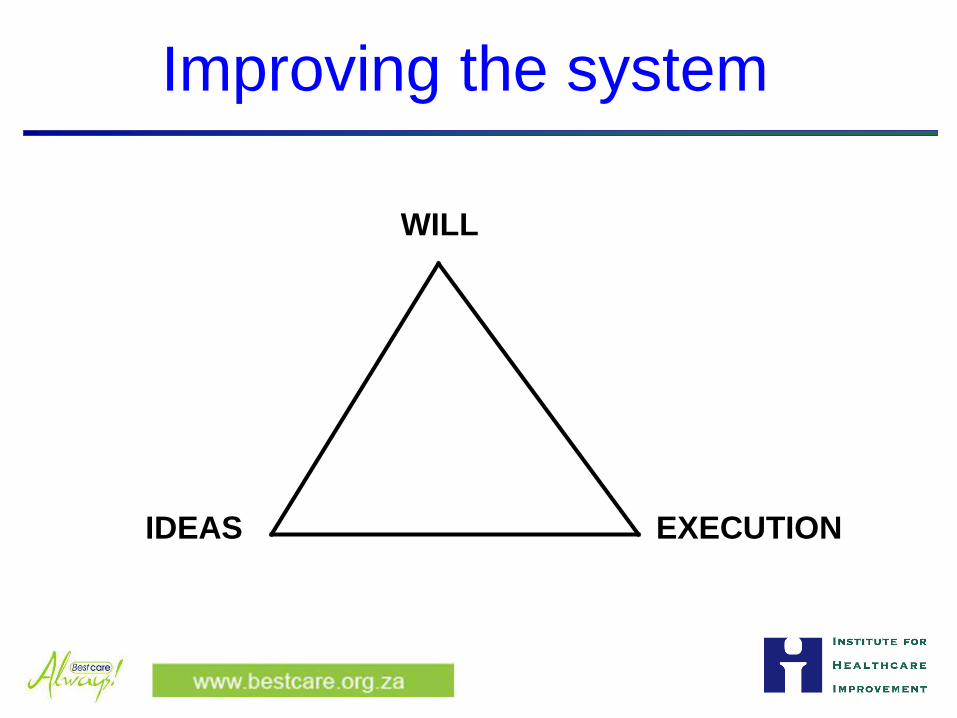
WILL
IDEAS EXECUTION
Improving the system

Where are SSIs occurring in your hospital and in which patients?
Identify the department(s) with the highest SSI rates and/or SSIs with the mostserious consequence
SSIs - how big is the problem?

Map the departments, wards and theatres manage these patients
Map the units that deal with these patients

• In which department/s did you start the project?
• Select one department in which to start your project
• What are your reasons? high priority best chance of success
Scoping the size of the challenge at your hospital
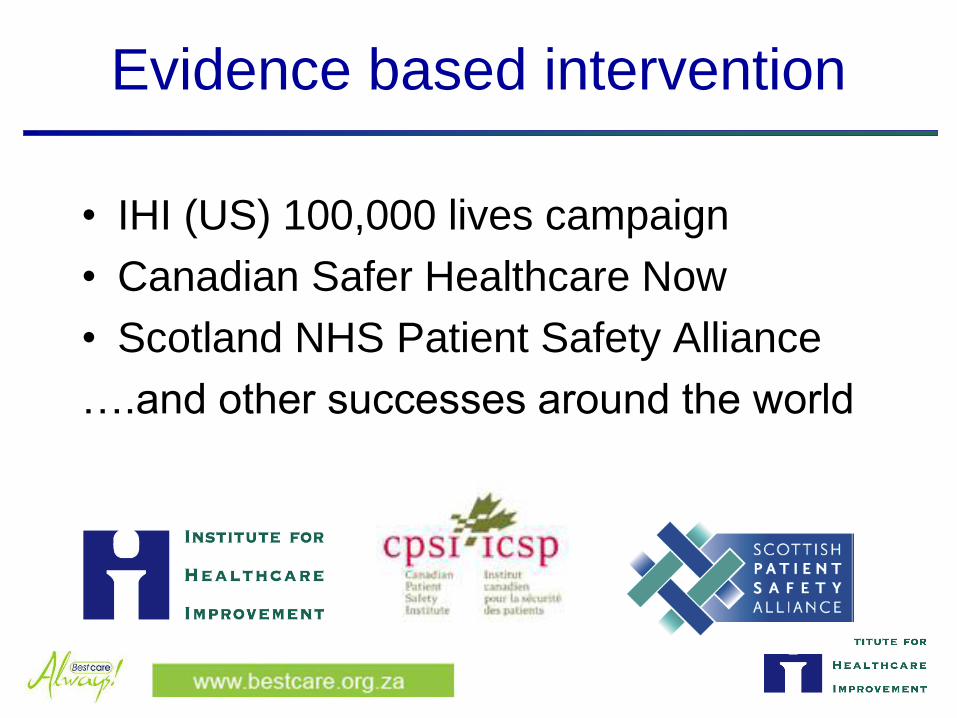
Evidence based intervention
• IHI (US) 100,000 lives campaign • Canadian Safer Healthcare Now• Scotland NHS Patient Safety Alliance ….and other successes around the world

Interventions were made into bundles
• What is a bundle and how does it work?A grouping of best practices that individually improve care,
but when applied together result in substantially greater improvement.
The science behind the bundle is so well established that it should be considered standard of care.
Bundle elements are dichotomous and compliance can be measured: yes/no answers.
Bundles shun the piecemeal application of proven therapies in favor of an “all elements” approach.

Fry D. Surgical Infections. Volume 12, Number 6, 2011
50 Ways To Cause Surgical Site Infections

The 5 elements of the SSI bundle
• Antiseptic skin preparation• Antibiotic prophylaxis• Hair removal• Glucose control• Normothermia

What can be achieved when the bundles are implemented reliably?
Reliable care:every element of the bundle
to every patientevery time!

2.10
1.52
2.13
1.93
1.30
1.94
1.30
1.09
1.80
1.59
1.38
1.16 1.21
1.57
0.95
1.37
0.93
1.38
59%
74% 75%78%
74% 73%
78% 77%79% 78%
81%84% 85%
83% 83% 83%85%
87%
0%
10%
20%
30%
40%
50%
60%
70%
80%
90%
100%
-
0.50
1.00
1.50
2.00
2.50
Jan
-00
Jan
-00
Jan
-00
Jan
-00
Jan
-00
Jan
-00
Jan
-00
Jan
-00
Jan
-00
Jan
-00
Jan
-00
Jan
-00
Jan
-00
Jan
-00
Jan
-00
Jan
-00
Jan
-00
Jan
-00
Overall Surgical Site Infections - Bundle Compliance and SSI RateMar 09 - Aug 10
Series2
Series1
HAI : SSI RATE
12

Surgical Site InfectionsBenchmarking: What is possible?

National Surgical Infection Prevention Project 56 participating hospitals Quality Improvement Approach
Measures
• The 4 BCA bundle elements plus an additional element
Results
After 11 months: • Overall surgical infection rate
fell 27% (p=0.0005)• from 2.28% the first 3 months
(215 infections/ 9435 cases)• to 1.65% in the last 3
reporting months (158 infections/ 9584 cases)

Baseline : 26% incidence of SSI in patients undergoing elective colorectal resection
Implemented 3 of the 4 BCA bundle elements
Implemented a multidisciplinary wound management protocol using SIP as guideline
Outcome: SSI incidence fell from 25.6% to 15.9% (p≤0.05)
39% improvement

Baseline : 10.9% incidence of SSI in children undergoing heart surgery
Implemented a comprehensive Infection Control Program
Included 2 of the 4 BCA elements plusAntiseptic protocol ( Chlorhexidine bath and skin prep)
Environmental elements
Outcome: 1.92% incidence in post-intervention group (82% reduction)

In summary
• 3 studies• Each implementing a combination of
bundle elements• 27-82% reduction in % of SSI’s.

• Set your aim according to the needs of the patients best practice
• At this point you don’t need to know
how how to get there
Setting a s-t-r-e-t-c-h Aim
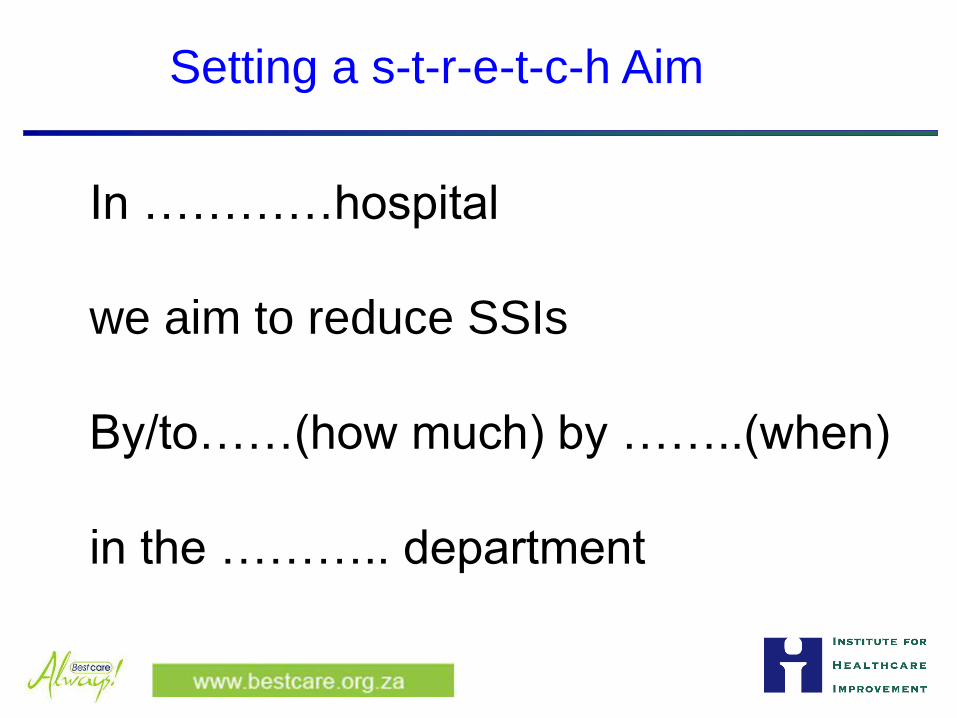
Setting a s-t-r-e-t-c-h Aim
In …………hospital
we aim to reduce SSIs
By/to……(how much) by ……..(when)
in the ……….. department

WILL
IDEAS EXECUTION
The Aim
• Tells us where we are heading
• Helps build WILL• Keeps the project focused

The SSI bundle
• Chlorhexidine shower/bath preoperatively
• IV antibiotic prophylaxis before skin incision (<1 hour) • Correct drug, dose, redosing• <24 hours
• Hair removal• Preferably, none• Clippers not razors• Depilation?
• Avoiding hyperglycemia in cardiac surgery
• Normothermia in colorectal surgery

Reducing SSIs Experience from the field
Hospital presentations – Mowbray Maternity Hospital- Paarl Hospital- Tygerberg Hospital

Going beyond the bundle
• Additional elements that have supplemented the bundle elements in SA public health projects

FAQ’s – panel discussion
PanelProf Marc MendelsonProf Ivan JoubertSr Linda van der Westhuizen (Mediclinic)
Chaired by Yolanda Walsh (Mediclinic)

Reducing SSIs Experience from the field
Sharing challenges and successes in implementing the bundle – open session

Key concepts in systems improvement

“Every system is perfectly designed to achieve the
result it gets”
12/2008

Improvement alwaysrequires change. . . .
. . . .but not all change is an Improvement!

The change • is inappropriate to problem• was not implemented as expected• worked but it caused an upset in another part of the system
The three reasons that a change doesn’t result in an improvement
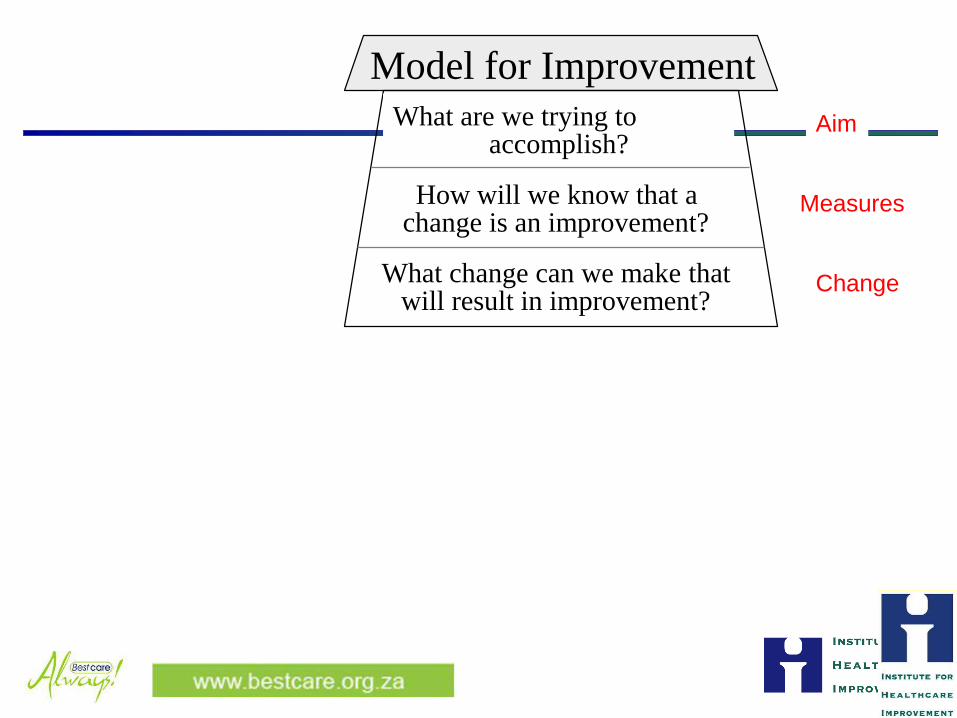
What are we trying toaccomplish?
How will we know that achange is an improvement?
What change can we make thatwill result in improvement?
Model for ImprovementAim
Change
Measures

‘Quality Improvement is data driven change’
Use the data to tell the improvement story
Measurement

2.10
1.52
2.13
1.93
1.30
1.94
1.30
1.09
1.80
1.59
1.38
1.16 1.21
1.57
0.95
1.37
0.93
1.38
59%
74% 75%78%
74% 73%
78% 77%79% 78%
81%84% 85%
83% 83% 83%85%
87%
0%
10%
20%
30%
40%
50%
60%
70%
80%
90%
100%
-
0.50
1.00
1.50
2.00
2.50
Jan
-00
Jan
-00
Jan
-00
Jan
-00
Jan
-00
Jan
-00
Jan
-00
Jan
-00
Jan
-00
Jan
-00
Jan
-00
Jan
-00
Jan
-00
Jan
-00
Jan
-00
Jan
-00
Jan
-00
Jan
-00
Overall Surgical Site Infections - Bundle Compliance and SSI RateMar 09 - Aug 10
Series2
Series1
HAI : SSI RATE
32
0.0
5.0
10.0
15.0 20
11JU
N
JUL
AU
G
SE
P
OC
T
NO
V
DE
C
2012
JAN
FE
B
MR
C
AP
R
MA
Y
JUN
JUL
AU
G
SE
PT
OC
T
NO
V
DE
C
2013
JAN
FE
B
MR
C
AP
R
MA
Y
JUN
JUL
Ward C: septic surgical cases/1000 surgical cases
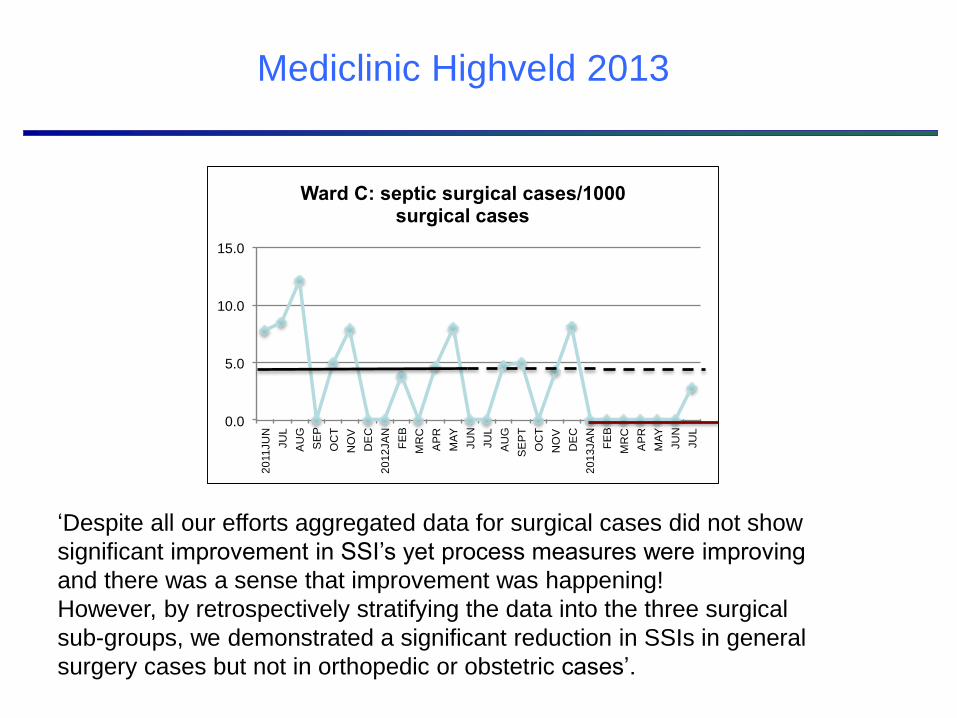
Mediclinic Highveld 2013
‘Despite all our efforts aggregated data for surgical cases did not show significant improvement in SSI’s yet process measures were improving
and there was a sense that improvement was happening! However, by retrospectively stratifying the data into the three surgical sub-groups, we demonstrated a significant reduction in SSIs in general surgery cases but not in orthopedic or obstetric cases’.

0
2
4
6
8
Surgeon1 Surgeon2 Surgeon3
#SSIsoverasixmonthperiodbysurgeon
Another hospital SSIs per surgeon over a six month period

Small multiples: comparing units or hospitals
Data source:

Measurement
Are we getting closer to our target? – SSI rates
Outcome measure

Measurement
Did we use the whole bundle in every patient every time? - % Compliance with the bundle
Process measure (Bundle compliance)

Measurement
Was the change an improvement?- Demonstrate significant change
Measuring the impact of a change

• Define the indicators - % - rate- days between infections- cases between infections
• Define the elements of each indicator- numerator- denominator
Defining the measures

• System to collect and collate the data• Display and discuss the data
- graphs- meetings
• Respond to the data- analysis - test a change
Measurement system

• Welsh Safety Cross• Line graphs and Run Chart Rules• ‘Days between infection’ graphs
Displaying the data

Safety CalendarWelsh 1000 lives campaign
I
Developed by Annette Bartley

Welsh safety Calendar

Month 1
Month 2
Month 3
No incident
More than 1 incident
New incident
KEY
Numerator only
44

Welsh Patient Safety Project

Christian Barnard Hospital

Tracking a single indicator over time
https://www.youtube.com/watch?v=YQd1QoMHYwU&feature=youtu.be
http://youtu.be/8e38RCU8-uA

Comment on the performance of these two (same size) clinics
0
2
4
6
8
10
J F M A M J J A S O N D
#ANCclients
ClinicA:NumberofANCclientstes ngHIV+/m
0
2
4
6
8
10
J F M A M J J A S O N D#ANCcllients
ClinicB:NumberofANCclientstes ngHIV+/m

Variation
0
2
4
6
8
10
J F M A M J J A S O N D
#ANCclients
ClinicA:NumberofANCclientstes ngHIV+/m
Ups and downs in the data are normal – so how do we know how the staff are doing?


Variation• If we know how a stable system is performing
─Range─Median
• We can predict where the next point will fall
0
1
2
3
4
5
6
7
8
J F M A M J J A S O N D
FacilityA:Numberofstrokepa entsadmi ed/m

Line graphs
• Is the system performing at an adequate level?
• Is the system stable? (are the points falling within the expected range?)
• Is something happening to the system that we are not aware of?
• Was the change we introduced an improvement?
Tracking data over time
‘dice’ exercise:
• Throw the die 13 times• Record the consecutive scores in the data
table• Plot the data points• Add a median, project the median point
forward with a dotted line

Adding a median
0
1
2
3
4
5
6
7
J F M A M J J A S O N D J F M A M J J A S O N D
Number thrown/monthAdd a title

If your system is stable, you can predict how it will perform
0
1
2
3
4
5
6
7
J F M A M J J A S O N D J F M A M J J A S O N D
Number thrown/month
median
range

Introducing a change to the system
• Add 12 more data points but this time add a change:
For each consecutive data point throw the die 3 times and record the highest score of the three
• Before you start record your prediction about what will happen to your system

Introducing a change- annotate your graph and plot the new data
points
0
1
2
3
4
5
6
7
J F M A M J J A S O N D J F M A M J J A S O N D
Number thrown/month
Change started
Add a title

Make a change in the system
• Was the change an improvement?• Run Chart Rules

Run Chart Rules
• Was the change statistically relevant? (iereal)
• ie did the system change when we introduced the intervention?

Rules For Determining Probability Based Signals of Change
Rule 1 (Shift) : Six or more consecutive POINTS either all above or all below the median. Skip values on the median and continue counting points. Values on the median DO NOT make or break a shift.
Median=10Median=11
Rule 1
0
5
10
15
20
25
1 2 3 4 5 6 7 8 9 10 11 12 13 14 15 16 17 18 19 20 21 22 23 24 25Me
as
ure
or
Ch
ara
cte
ris
tic
Median 10

Rule 2 (Trend): Five points all going up or all going down. If the value of two or more successive points is the same, ignore one of the points when counting; like values do not make or break a trend.
Rule 2
0
5
10
15
20
25
1 2 3 4 5 6 7 8 9 10 11 12 13 14 15 16 17 18 19 20 21 22 23 24 25
Me
as
ure
or
Ch
ara
cte
ris
tic
Median=11Median 11
Rules For Determining Probability Based Signals of Change

Rules For Determining Probability Based Signals of Change
Rule 3 (Too many or too few runs) To Determine The Number of Runs Above and Below the Median:
A run is a series of points in a row on one side of the median. Some points fall right on the median, which makes it hard to decide which run these points belong to.
So, an easy way to determine the number of runs is to count the number of times the data line crosses the median and add one.
Statistically significant change signaled by too few or too many runs.
Rule 3
0
5
10
15
20
25
1 2 3 4 5 6 7 8 9 10
Me
as
ure
or
Ch
ara
ce
ris
tic
Median 11.4
Data line crosses onceToo few runs: total 2 runs
10 Data points not on medianData line crosses onceToo few runs: total 2 runs
DG Fig 3.22

Rule 3: # of RunsTable for Checking for Too Many or Too Few Runs on a Run Chart
Total number of data
points on the run chart
that do not fall on the
median
Lower limit for the number of runs(< than this number of runs is “too few”)
Upper limit for the number of runs(> than this number of runs is “too many”)
10 3 9
11 3 10
12 3 11
13 4 11
14 4 12
15 5 12
16 5 13
17 5 13
18 6 14
19 6 15
20 6 16
21 7 16
22 7 17
23 7 17
24 8 18
25 8 18Table is based on about a 5% risk of failing the run test for random patterns of data.Adapted from Swed, Feda S. and Eisenhart, C. (1943). “Tables for Testing Randomness of Grouping in a Sequenceof Alternatives. Annals of Mathematical Statistics. Vol. XIV, pp.66 and 87, Tables II and III.

RULE 4:AstronomicalFor detecting unusually large or small numbers:
Data that is Blatantly Obvious different valueEveryone studying the chart agrees that it is unusual
Remember:Every data set will have a high and a low - this does not mean the
high or low are astronomical
Rule 4
0
5
10
15
20
25
1 2 3 4 5 6 7 8 9 10 11 12 13 14 15 16 17 18 19 20 21 22 23 24
Mea
sure
men
t or
Cha
ract
eris
tic
Rules For Determining Probability Based Signals of Change

0
2000
4000
6000
8000
10000
Jan-13
Feb
Mar
Apr
May
Jun
Jul
Aug
Sep
Oct
Nov
Dec
Jan-14
Feb
Mar
Apr
May
Jun
Jul
Aug
Sep
Oct
Nov
Dec
Jan-15
Feb
Mar
StateBpublic:PregnantwomenCounseled,testedandreceivedresults(CTRR)
Astronomical Point
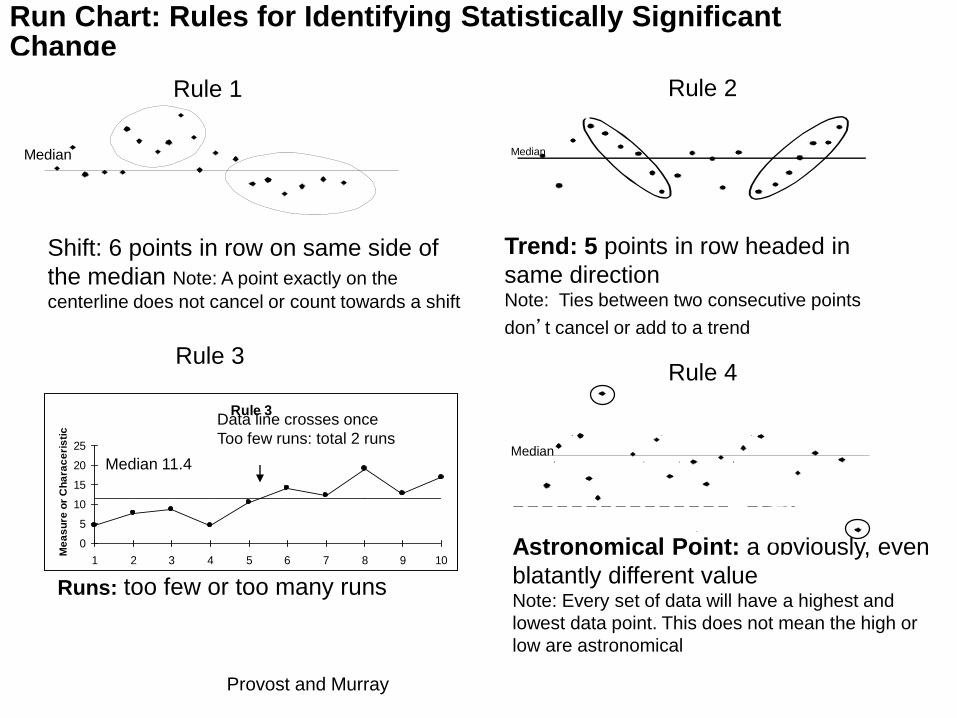
Run Chart: Rules for Identifying Statistically Significant Change
Astronomical Point: a obviously, even blatantly different valueNote: Every set of data will have a highest and lowest data point. This does not mean the high or low are astronomical
Median
Shift: 6 points in row on same side of the median Note: A point exactly on the centerline does not cancel or count towards a shift
Median
Median
Trend: 5 points in row headed in same directionNote: Ties between two consecutive points
don’t cancel or add to a trend
Rule 3
0
5
10
15
20
25
1 2 3 4 5 6 7 8 9 10
Mea
sure
or
Cha
race
rist
ic
Median 11.4
Data line crosses onceToo few runs: total 2 runs
Runs: too few or too many runs
Rule 1 Rule 2
Rule 4Rule 3
Provost and Murray

Run Charts
• 12-18 data points to understand the variation in a stable system (baseline)
• Baseline median performance• Continuous data – over a number of years• Run chart rules allow you to determine if
your median performance has changed• Annotate the line graph to see where
changes were made

Apply the Run Chart Rules to your graph to see the change was an
improvement
0
2
4
6
8
10
12
14
J FMAM J J A S ON D J FMAM J J A S ON D
FacilityA:Numberofstrokepa entsadmi ed
Change made

Was the change an improvement?
• The change must alter the overall median performance of the system

Measuring HAI
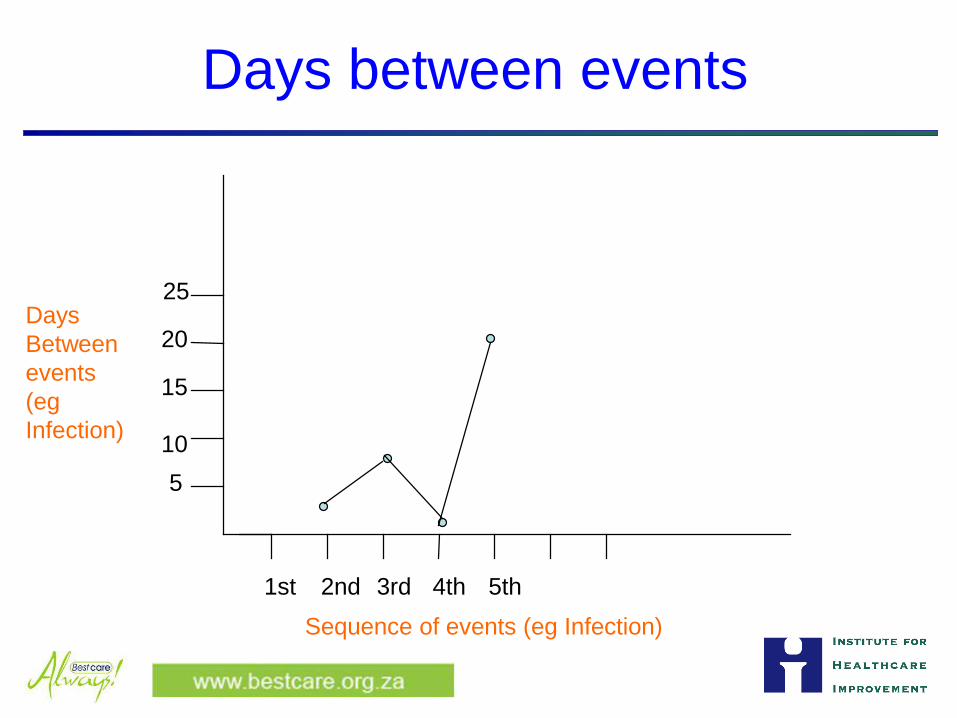
The concept of ‘days between’ infections
For measure ‘rare’ events (occur < 10%)

Off the internet, Google pictures

Off the internet, Google pictures

Source:Google pictures

Days between events (infection)
Days Betweenevents(egInfection)
Sequence of events (eg Infection)
1st 2nd 3rd 4th 5th
5
10
15
20
25
Days between events
1st 2nd 3rd 4th 5th
5
10
15
20
25Days Betweenevents(egInfection)
Sequence of events (eg Infection)

Maternal deaths – Malawi
For the “NO Maternal Death” Campaign
a colorful, laminated A4 paper that said “Days without a Maternal Death: ______”.
were hung in every Labour Ward for all (providers, patients and guardians) to see and the number was filled in daily with a dry erase marker

Neonatal deaths – Malare Health Centre, 5’s Alive! Project, Ghana
I
Larger is better

IMeasuring rare events and time-between measures. James Benneyan IHI

Use the tools provided to display the dataas a Safety Calendar and a ‘Days Between
Infection’ run chart
July Aug Sep Oct
5/7 13/8 7/9 5/10
5/7 9/9 8/10
6/7 15/9 15/10
11/7 19/10
25/7 20/10
27/7 21/10
25/10

Date of infection
# Days since last infection
Days BetweenInfection
Sequence of Infections

Reporting on the extra-net

What are we trying toaccomplish?
How will we know that achange is an improvement?
What change can we make thatwill result in improvement?
Model for Improvement
Act Plan
Study Do
How to make a change

Closing the “Know-Do” gap

I
The Implementation Gap
PLAN
IMPLEMENT
FAIL
PROBLEM
EVIDENCE BASED SOLUTION
“traditional” attempts to change

I
DO
STUDY
ACTIMPLEMENT
SUCCEED/ SUSTAIN
Overcoming the Implementation Gap
GREAT IDEAS
SYSTEM ANALYSIS to identify barriers to carePROBLEM
PLAN

Rapid Cycle Change
What can we change that will result in an improvement?
PLAN
DO
STUDY
ACT
How will we know that a change is an improvement?
What are we trying to accomplish?
PLAN
DO
STUDY
ACT
PLAN
DO
STUDY
ACT
PLAN
DO
STUDY
ACT

Actabandonadaptadopt
Plan
Study Do
PDSA – scientific method
whatwherewhowhenhow

The Plan-Do-Study-Act Cycle
Improvement Guide, Chapter 5, p. 97
P: Ask one doctor to use clippers instead of razor with 1 patient
D: Dr. M used clippers on 2 patients. Was pleased. Told staff not to put razor on his cart again!
S: Was some resistance as predicted. Lack of supplies unexpected barrier.
A: Clippers ordered. Another PDSA with 6 other surgeons planned

Improving many parts of the bundle/system at once.
PLAN
DO
STUDY
ACT
PLAN
DO
STUDY
ACT
PLAN
DO
STUDY
ACT
part 3 part 4part 1 part 2
PLAN
DO
STUDY
ACT
PLAN
DO
STUDY
ACT
PLAN
DO
STUDY
ACT
PLAN
DO
STUDY
ACT
PLAN
DO
STUDY
ACT
PLAN
DO
STUDY
ACT
PLAN
DO
STUDY
ACT
PLAN
DO
STUDY
ACT
PLAN
DO
STUDY
ACT

Make it do-able
Work as a team• Small, representative improvement team• Meet regularly, have regular huddles
Start in one department• where you have the best chance of success
Start small building as you gain confidence• Get your measures in place• Test one bundle element
Driver DiagramYour theory of change

Surgical Site Infections reduced to ……days
or …. cases
between infectionby ……………..
AIMS PRIMARY DRIVERS
SECONDARY DRIVERS
INTERVENTIONS(Change Ideas)
MEASURES
Activated and empowered
healthcare team
SSI bundle implemented
Other system factors well managed
Leadership involved & supportive ??
??
??
??
??
??
??
??
??
??
Improvement team meets regularly
QI activities are planned
Antiseptic skin prep & chlorhexidine wash
Prophylactic antibiotics
Appropriate hair removal
??
??
Normoglycaemiamaintained
Normothermiamaintained
• % Preopantiseptic
• % Preopantibiotics
• % Hair removal• % Postop
glucose• % Postop temp
• Manager regularly attends meetings
• SSI rate or days between infection
• Run charts / crosses updated monthly
W Cape BCA SSI InitiativeDriver Diagram v0.1
Environment (theatre) is clean
Excellent hand hygiene
Excellent wound care
Dependably sterile supplies
Supplies available
Drugs available
Routine measurement
system
• Weekly case counts• Infection count/date
• Quarterly reports to management
SSI Process & Outcomes

Driver Diagram

AIM of this change:
PROBLEM :

WILL
IDEAS EXECUTION
Set to go