reducing post-harvest losses of the … burundi, drc and zambia) is the second deepest lake in the...
TRANSCRIPT

P.O. Box 1390, Skulagata 4
120 Reykjavik, Iceland Final Project 2010
REDUCING POST-HARVEST LOSSES OF THE ARTISANAL DAGAA
(Rastrineobola argentea) FISHERY IN LAKE VICTORIA, TANZANIA:
A COST AND BENEFIT ANALYSIS
Lilian Ibengwe
Ministry of Livestock Development and Fisheries
P.O.Box 2462
Dar es Salaam
Tanzania [email protected]
Supervisor
Daði Már Kristófersson (PhD)
Associate Professor
Department of Economics
University of Iceland [email protected]
ABSTRACT
The Lake Victoria dagaa constitutes over 38% of the total fish landings from Lake Victoria in
Tanzania. The fishery supports a major artisanal fishery in the country, ranking second to the
Nile perch. However, the dagaa fishery is associated with a high level of post-harvest loss
(physical and quality losses) of approximately 59%. The overall objective of this study was to
propose a cost effective management strategy to reduce dagaa post-harvest loss in Tanzania.
To meet this objective a cost and benefit analysis was done to determine whether adopting
drying dagaa on racks will reduce post-harvest loss, and hold positive public value in the
future. Two categories of analysis were set, i.e. private (individual) and public (government)
for a pilot district (500 fishers). The analyses were divided into five parts: 1) Assessment of
all possible dagaa post-harvest losses, 2) Assessment of the cost of reducing the losses, 3)
Assessment of the anticipated benefits associated with reducing the losses, 4) Evaluation of
costs and benefits to determine net benefit and net present value (NPV), 5) A sensitivity
analysis. From the analysis it was found that the drying racks project has positive NPV
therefore it is worthwhile to be implemented in Tanzania to reduce dagaa post-harvest loss.
Also, the sensitivity analysis indicated that NPV is sensitive and is likely to be affected by
changes in sales price, while changes in investment and implementation cost were found to
have no impact on NPV. By using drying racks productivity will be increased and provide a
sustainable livelihood to fishers and as well as increase regional trade and foreign exchange
earnings to the government.

Ibengwe
2
UNU-Fisheries Training Programme
TABLE OF CONTENTS
TABLE OF CONTENTS ........................................................................................................ 2
LIST OF ABBREVIATIONS ................................................................................................. 4
LIST OF FIGURES ................................................................................................................. 4
LIST OF TABLES ................................................................................................................... 5
LIST OFAPPENDICES .......................................................................................................... 6
1. INTRODUCTION ............................................................................................................ 7
1.1 Overview of Tanzania ................................................................................................. 7
1.2 Fisheries of Tanzania .................................................................................................. 8
1.2.1 Fish Production ................................................................................................... 8
1.2.2 Economic importance of fisheries ........................................................................ 9
1.3 General Introduction to post-harvest loss in artisanal fisheries .................................. 9
1.4 Significance of the Study .......................................................................................... 12
1.5 Structure of the study ................................................................................................ 12
2. DAGAA IN LAKE VICTORIA ........................................................................................ 14
2.1 Biology ........................................................................................................................... 14
2.2 Dagaa Fishing, Processing and Marketing ..................................................................... 15
2.2.1 Fishing ..................................................................................................................... 15
2.2.2 Processing ............................................................................................................... 15
2.2.3 Marketing................................................................................................................. 16
2.2.4 Consumption ............................................................................................................ 17
2.3 Economic Importance of Dagaa Fishery ........................................................................ 18
3. POST-HARVEST LOSS ................................................................................................... 19
3.1 Causes of dagaa post-harvest loss .................................................................................. 20
3.2 Post harvest loss intervention strategies ......................................................................... 22
3.2.3 Stakeholders affected ............................................................................................... 23
4. METHODOLOGY ............................................................................................................ 25
4.1 Data Collection ............................................................................................................... 25
4.2 Construction of drying racks .......................................................................................... 26
4.3 Cost and Benefit Analysis .............................................................................................. 27
4.3.1 Assessment of all possible dagaa post-harvest losses ............................................. 27
4.3.2 Assessment of the cost of reducing the losses. ......................................................... 27

Ibengwe
3
UNU-Fisheries Training Programme
4.3.3 Assessment of the benefits associated with reducing the losses .............................. 28
4.3.4 Evaluation of Costs and Benefits to determine net benefit and NPV ...................... 29
4.4 Sensitivity Analysis ........................................................................................................ 29
4.4.1 Break even analysis ................................................................................................. 30
5. ANALYSIS AND RESULTS ............................................................................................ 31
5.1 Loss available when drying dagaa on ground (before using racks) and after drying on
racks. .................................................................................................................................... 31
5.1.1 Private (individual) post-harvest loss for drying racks ........................................... 31
5.1.2 Pilot district (500 fishers) project post-harvest loss for drying racks ..................... 31
5.2 Estimated Cost of reducing the post-harvest losses in Tanzania ................................... 32
5.2.1 Implementation Costs .............................................................................................. 32
5.2.2 Estimated investment cost for drying racks private and for a pilot district (500
fishers) project. ................................................................................................................. 33
5.3 Expected benefit after reducing post-harvest losses ...................................................... 34
5.3.1 Benefit for the private (individual), pilot district (500 fishers) and to the
government ....................................................................................................................... 34
5.4 Evaluation of Private/Public Costs and Benefits for drying racks to determine net
benefit and NPV ................................................................................................................... 35
5.5 Sensitivity Analysis results ............................................................................................ 36
5.6 Discussion ...................................................................................................................... 37
5.6.1 Reducing Post-harvest loss of Dagaa fisheries in Tanzania ................................... 37
5.6.2 Limitations of this analysis ...................................................................................... 38
5.7 Implementation time scale for proposed project to Reduction Post-harvest loss in
Tanzania ............................................................................................................................... 39
6. CONCLUSIONS AND RECOMMENDATION ............................................................. 42
6.1 Suggestions and recommendation .................................................................................. 42
ACKNOWLEDGEMENTS .................................................................................................. 44
LIST OF REFERENCES ...................................................................................................... 45
APPENDICES ........................................................................................................................ 49

Ibengwe
4
UNU-Fisheries Training Programme
LIST OF ABBREVIATIONS
CCRF Code of Conduct for Responsible Fisheries
DRC Democratic Republic of Congo
DoFD Department of Fisheries Development
EEZ Exclusive Economic Zone
FAO Food and Agricultural Organisation of the United Nations.
GDP Gross Domestic Production
IFLAM Informal Fish Loss Assessment Method
LT Load Tracking
LVFO Lake Victoria Fisheries Organisation
MLDF Ministry of Livestock Development and Fisheries
MNRT Ministry of Natural Resource and Tourism
NEPAD The New Partnership for Africa’s Development
PHFL Post -Harvest Fish Loss
PHFLA Post Harvest Fish Loss Assessment
QLAM Questionnaire Loss Assessment Method
T.Shs Tanzanian Shillings
USD United State Dollars
URT United Republic of Tanzania
UNU-FTP United Nations University – Fisheries Training Programme
NRI Natural Research Institute
NPV Net Present Value
IUCN International Union for Conservation of Nature
FDD Fisheries Development Division
TAFIRI Tanzania Fisheries Research Institute
LIST OF FIGURES
Figure 1: Map of Tanzania showing major water bodies and rivers ......................................... 7
Figure 2: Total fish production (marine, lakes and rivers) for artisanal fisheries in Tanzania
from 1999-2010 ........................................................................................................................ 8
Figure 3: Occurrence and interrelationship of different types of losses in fisheries ............. 10
Figure 4: Percentages of total annual fish production by three major fisheries in Lake
Victoria, Tanzania for 2009 .................................................................................................... 11
Figure 5: Rastrineobola argentea . ........................................................................................... 14
Figure 6: State of three important fish stock in Lake Victoria from 2005-2008 .................... 15
Figure 7: Flow diagram showing dagaa processing path and its distribution route to local and
regional markets . ..................................................................................................................... 17
Figure 8: Sun drying dagaa on racks........................................................................................ 23

Ibengwe
5
UNU-Fisheries Training Programme
Figure 9: Picture of a proposed design of dagaa drying rack to be used by dagaa fishers in
Tanzania ................................................................................................................................... 26
Figure 10: Breakeven point of public drying racks project for ten years ................................ 36
Figure 11: Sensitivity analysis chart on different % changes of cost, price (USD) and quantity
of dagaa (kg) private project .................................................................................................... 37
Figure 12: Sensitivity analysis chart on different % changes of cost, price (USD) and quantity
of dagaa (kg) public project ..................................................................................................... 37
Figure 13: Project cycle assessment stages as a continuous process for drying on racks ....... 40
LIST OF TABLES
Table 1: Total fish production from all major water bodies in Tanzania ( marine and inland)
for 2009 ..................................................................................................................................... 9
Table 2: Estimated dagaa export and its value from 2005 to 2009 ......................................... 18
Table 3: Indicative quantitative post-harvest loss in dagaa fishery Tanzania ........................ 25
Table 4: Estimated price (USD/T.Shs.) for 1 kg of different products of dagaa in Tanzania . 26
Table 5: Estimated dagaa catches per fisher/day/month/year .................................................. 31
Table 6: Summary of estimated post-harvest loss of dagaa dried on ground and dagaa dried
on racks private (individual) weight (kg) and price in USD .................................................... 31
Table 7: Summary of estimated post-harvest loss of dagaa dried on ground and dagaa dried
on racks for a pilot district (500 fishers) weight (kg) and price in USD ................................. 32
Table 8: Estimated cost for the implementation of dagaa drying project ................................ 32
Table 9: Estimated investment cost of constructing one rack per year (USD). ....................... 33
Table10: Estimated private (individual) investment cost for dagaa racks project (USD)…….……....33
Table11:Estimated investment cost to a pilot district and implementation cost to the government for
drying racks project……………………………………………………………………………………33
Table12: Anticipated private benefit after using racks, weight in kg and price in USD…………… 34
Table 13: Anticipated total benefit for the pilot district (500 fishers) after using racks, weight (ton.)
and price in 000' USD…………………………………………………………………………………34
Table 14: Drying racks (individual) private project cost and benefit analysis for five years..35

Ibengwe
6
UNU-Fisheries Training Programme
LIST OFAPPENDICES
Appendix 1: Estimated post-harvest loss of dagaa dried on ground (private) weight (kg) and
price in USD………………………………………………………………………………….49
Appendix 2: Anticipated (private) post-harvest loss reduction after using drying racks…….49
Appendix 3: Post harvest loss of dagaa dried on ground in a pilot district (500 fishers) project
(Government/public) ………………………………………………………………………...50
Appendix 4: Anticipated post-harvest loss reduction after using drying racks in a pilot district
(500 fishers) (Government/public)…………………………………………………………...50
Appendix 5: Drying racks public project in a pilot district (500 fishers) cost and benefit
analysis for ten years…………………………………………………………………………51
Appendix 6: Sensitivity analysis table of drying racks (public) project (NPV) under different
assumption of investment cost, price and quantity of catch………………………………….51
Appendix 7: Sensitivity analysis table of drying racks (public) project (NPV) under different
assumption of investment cost, implementation cost, price and quantity of catch…………..52

Ibengwe
7
UNU-Fisheries Training Programme
1. INTRODUCTION
1.1 Overview of Tanzania
Tanzania is a coastal state on the western Indian Ocean situated in the Eastern part of Africa.
It is richly endowed with natural water bodies and fisheries play a very important role as a
basis for subsistence and commercial livelihood (FAO 2007b).
The country has a total area of 947,300 km2, water covers 61,500km
2, while land cover is
885,800 km2, about 6.4 % and 93.6% respectively (Tanzania Government report 2010).
Tanzania shares three major inland lakes in Africa (Figure 1). Lake Victoria is by far the
largest and economically most significant for the national fisheries (shared by Kenya and
Uganda) and it is the second largest freshwater lake in the world. Lake Tanganyika (shared
with Burundi, DRC and Zambia) is the second deepest lake in the world and Lake Nyasa is
shared by Malawi, and Mozambique. There are also other inland water bodies, minor lakes,
rivers, dams, ponds and wetlands (LVFO 2004).
Figure 2: Map of Tanzania showing major water bodies and rivers (Tanzania Government
report 2010)
The population of Tanzania was estimated at 41 million in July 2010 (Tanzania Government
report 2010). The country’s economy depends heavily on agriculture which accounts for
more than 25% of the GDP. Industries traditionally featured are the processing of food and
other agricultural products. Within the food processing industries fisheries is the most
important sub-sector.

Ibengwe
8
UNU-Fisheries Training Programme
1.2 Fisheries of Tanzania
It has been estimated that the country has the potential of harvesting about 730,000 metric
tonnes of fish from its traditional sources of Lakes Victoria, Tanganyika, Nyasa, rivers, dams
and the inshore marine waters. This estimate covers only the freshwater and territorial waters
(MNRT 1997). The historical catch and effort data suggest that total fish production has
never been above 60% of the existing potential. The highest landings were recorded in 1990,
when 414,040 metric tonnes or about 57% of the potential yield were landed. The average
annual production (1999 – 2010) is estimated at 337,212 metric tonnes.
The Tanzania fishing industry is divided into the artisanal (small scale) and commercial/
industrial (large scale) fisheries. The artisanal fishery in Tanzania is the most important fishery
as it lands most of the inland and the marine catches and contributes about 98% of total
landings. In terms of production volume (Figure 2), output value and employment, artisanal
fisheries are much more important than industrial fisheries. Historically, artisanal fisheries
have provided the economic base for the majority of people in Tanzania.
Figure 3: Total fish production (marine, lakes and rivers) for artisanal fisheries in Tanzania
from 1999-2010 (FDD 2009)
1.2.1 Fish production
The capture fishery of Tanzania is divided into two components, freshwater and marine
waters. Fisheries in freshwater are carried out in the major lakes (Victoria, Tanganyika and
Nyasa), the minor lakes, dams and rivers. This fishery is dominated by artisanal fishers who
use small boats of between 7 to 11 m long, mainly motorized by outboard engines and a few
with inboard engines. Other crafts used include dugout canoes and dhows (Sobo 2006).
The total catch in 2009 was 335,674 metric tonnes (Table 1), of which about 86% was from
freshwater sources and the remaining 14 % was from marine waters (FDD 2009).
-
50
100
150
200
250
300
350
400
Wei
gh
t 0
00
' (T
on
s)
Year

Ibengwe
9
UNU-Fisheries Training Programme
Table 1: Total fish production from all major water bodies in Tanzania (marine and inland)
for 2009 (FDD 2009)
FISHERY WEIGHT IN M.TONS
GREAT LAKES & DAMS
Lake Victoria 238,703
Lake Tanganyika 31,213
Lake Nyassa 10,422
Lake Rukwa 4,335
Mtera Dam 897
Nyumba ya Mungu Dam 1,021
Sub total 286,591
MINOR WATERS
Lake Babati 135
Lake Jipe 12
Lake Kitangiri 71
Others 1,250
Sub total 1,468
TOTAL FRESH WATERS 288,058
MARINE WATERS 47,616
GRAND TOTAL 335,674
1.2.2 Economic importance of fisheries
The fisheries resources of Tanzania are of great economic and social significance to the
country. The Fisheries Development Division collects revenue from the sector activities such
as licensing of fish processing factories and the taxation of exporting fish products. In 2009
the country earned about 161 million USD from exported fish products.The sector contributes
around 2.9% to national GDP (FDD 2009).
The fisheries sector also provides a source of employment and livelihood to a substantial
number of people. About 172,000 people are engaged on a full-time basis and about 2 million
people make their livelihoods through various fisheries-related activities, such as: boat
building, net making, fish processing and food marketing.
In terms of animal protein availability, fish contribute about 30% of the total protein intake in
the country. Currently the estimated fish consumption is 13 kg per person per year. This is
significant, as the majority of the consumers are relatively low income earners who cannot
afford other more expensive sources of protein.
1.3 General introduction to post-harvest loss in artisanal fisheries
Post-harvest fish losses occur at many stages of the distribution chain from capture to
consumption. It has been of great concern for development practitioners who wish to improve

Ibengwe
10
UNU-Fisheries Training Programme
the livelihoods of fishers, processors and traders, and the contribution that fish makes to food
security. Recognition of the important problem fish loss poses is reflected in the FAO Code
of Conduct for Responsible Fisheries (CCRF) under Article 11.1- Responsible fish utilisation
(FAO 1998a), which places an emphasis on loss reduction. The most obvious means of
increasing supply of fish, even without increased landings, is by reducing post-harvest losses
of what is presently caught (Ward 1998).
The term post-harvest refers to a period of time from when a fish is separated from its growth
medium (Morrissey 1998). This includes the time when a fish enters a net, is caught on hooks
or in traps.
Post-harvest losses of fish can refer to physical, quality and market losses. Physical losses
occur when fish is not sold for whatever reason, be it due to spoilage, damage or consumed
by insects, birds or other domestic animals. Quality loss is the difference between the
potential value of fish if no deterioration has taken place (best quality) and the actual value of
the fish after it has undergone change due to spoilage (lower quality). A market loss is caused
by unfair marketing practices (increasing the cost to the processor) and situations where fish
operators have to sell their products (even of good quality) at a price below their expectation
(Ward and Jeffries 2000).
All three types of losses have financial implications for fishers, processors, traders and at the
macroeconomic level. Different approaches may be necessary to address these different types
of losses (Akande and Diei-Ouadi 2010).
Field experience has shown cases of close relationship between these types of losses. Quality
may deteriorate or fish thrown away because of market developments/oversupply. Market
forces, such as oversupply, lead to physical, quality and market losses (Figure 3). Physical
(material) and quality losses are both high in artisanal fisheries and these translate into losses
in nutritional contribution of fish to the total diet and health of populations.
Market oversupply
Sales increase in length Reduced price in fresh fish
Quality change in fish Market loss
Low fish price
Rejection/Dumped
Physical loss Quality loss
The latest estimates indicate that artisanal fisheries contribute over half of the world’s capture
fisheries and aquaculture production of about 110 million tonnes, nearly all of which are used
for direct human consumption (FAO 2008).
Figure 4: Occurrence and interrelationship of different types of losses in fisheries (Ansen
and Diei-Ouadi 2008)

Ibengwe
11
UNU-Fisheries Training Programme
In Africa, over 60% of the fish supply to domestic and regional markets, as well as export-
oriented processing units, is of artisanal origin (NEPAD 2005).
A review of case studies on post-harvest losses in several countries in Africa indicates high
levels of losses both in quantity (material or physical losses) and quality (mostly due to
downgrading) of fishery products (Kabahenda et al. 2009).
In Tanzania, the artisanal fisheries sector is faced with many challenges including that of
incurring high post-harvest fish losses, especially in the dagaa (Rastrineobola argentea)
fishery on Lake Victoria.
Lake Victoria supports the most important fishery in Tanzania in terms of quantity and value.
In 2009 the lake accounted for 238,703 metric tonnes (Table 1) which is 85% of total fish
production in Tanzania. The fishery is based on three main important fish stocks, the Nile
perch (Lates niloticus), dagaa and Nile tilapia (Oreochromis niloticus), which are the
backbone of commercial fisheries in that order. In Tanzania over 75% of the Nile perch goes
directly to the fish processing factories for export while dagaa and tilapia are sold on the
regional and local markets (FFD 2009).
The Lake Victoria dagaa constitutes over 38% of total fish landings from Lake Victoria in
Tanzania (Figure 4). The fishery supports a major artisanal fishery in the country, ranking
second to the Nile perch. The large volume landed, its wide distribution, high nutritional
value and low price are characteristics that have made dagaa the most important fishery to the
great majority of Tanzanians in supporting food security and sustainable livelihood.
Figure 5: Percentages of total annual fish production by three major fisheries in Lake
Victoria, Tanzania for 2009 (FDD 2009)
However, the dagaa fishery is associated with high level of post-harvest loss, both physical
and quality losses. A recent post-harvest study conducted in Lake Victoria estimated losses in
the dagaa fishery to be about 32 million USD per annum, which clearly suggests that
reduction of losses in this fishery is a potential area for addressing food security and poverty
alleviation (Mgawe and Mondoka 2008).
41%
38%
16%
5%
Nile Perch
Dagaa
Tilapia
Others

Ibengwe
12
UNU-Fisheries Training Programme
The demand for fish is increasing as populations increase. It does not appear that the supply
of fish is able to meet this growing demand, especially in developing countries where a large
proportion of captured fish is exported. One of the options for reducing this growing
imbalance is to focus the attention on well planned loss reduction measures, increasing the
amount of fish available and the value of the fish. According to James (1986) the control of
fresh and cured fish loss could bring additional financial benefit to producers as well as extra
contributions to supply, particularly in developing countries.
A better understanding of the basic economics (cost and benefit structures) of reducing dagaa
post-harvest loss of artisanal fishers in Tanzania, is useful for setting national and regional
fisheries strategies. This would help in managing effective trade-offs and better synergy in
poverty eradication, food security and improved health for the sectors and in realising the
Millennium Development Goals.
Moreover, the information gained would be equally beneficial to reduce post-harvest loss in
other fisheries with similar constraints. This is particularly critical in designing efficient
policies and programs for managing fisheries resources.
1.4 Significance of the study
There is a lack of information on the cost and benefit of management interventions that have
been recommended for reducing dagaa post-harvest losses. Loss levels are often said to be
between 20% and 40% in the dagaa fishery of Tanzania, but no study has been done on the
cost and benefit of the proposed type of management interventions for reducing post-harvest
loss.
Understanding the concepts and principles of cost and benefit analysis of post-harvest loss
using the dagaa fishery as an example can be further applied to the remaining commercially
valuable species.This study will therefore apply cost and benefit analysis and provide the
bases for future analyses for other fisheries in Tanzania.
The overall objective of this study is to propose a cost effective management strategy to
reduce post-harvest loss of Lake Victoria dagaa fishery in Tanzania for economic and
nutritional benefit to the people. To reach this, five specific objectives will be tackled:
To outline the structure of the fishery in terms of production, processing, marketing
and distribution.
To analyse the economic impact of post-harvest loss of the small-scale dagaa fishery.
To suggest strategies for reducing post-harvest loss of the fishery.
To conduct a cost and benefit study to assess the net economic benefit of the proposed
strategy.
To outline an implementation plan for reducing post-harvest loss in the dagaa fishery.
1.5 Structure of the study
The study is organised as follows: Chapter one provides background information on the
overview of Tanzania’s fishery, an introduction of the study, objective and its significance.
Chapter two and three discuss some existing academic literatures that are relevant to the
subject, including some major works on the general theory of fish post-harvest loss. Chapter
four gives the methodology by which the analysis was conducted, the cost-benefit analysis

Ibengwe
13
UNU-Fisheries Training Programme
and sensitivity analysis of the proposed management strategy. The results, discussion and
implementation time scale of the study is elaborated in chapter five. Conclusions on the
proposed management strategies and policy recommendations are presented in chapter six.

Ibengwe
14
UNU-Fisheries Training Programme
2. DAGAA IN LAKE VICTORIA
2.1 Biology
The silver cyprinid, Rastrineobola argentea, is a species of ray-finned fish in the family
Cyprinidae, the only member of the genus Rastrineobola. It is only found in Lake Victoria in
Tanzania, Kenya and Uganda, where it is known as, dagaa, omena, and mukene respectively
(Figure 5) (Bayona 2006).
Figure 6: Rastrineobola argentea (FAO 2006)
Dagaa is found both inshore and offshore. The juvenile fish migrate away from the shore
after spending their larval stage in shallow areas. Studies indicate that dagaa perform daily
vertical migrations. The adults stay near the bottom of the water column during daylight
hours and at night they migrate to the surface where they are fished. However juveniles and
parasitised adults stay near the surface throughout the day (Wandera 1992).
Its food consists mainly of zooplankton, which is abundant in the environment and for which
there is not much competition. It feeds on zooplankton during daytime supplementing this
diet with insect larvae at night (Manyala and Ojuok 2007). Preliminary results on growth of
the species indicate that dagaa grows fast and matures at ages varying from 16 to 25 months.
The dagaa breeds throughout the year but there is a major breeding peak in December-
January and a minor one in August-September. It has low absolute1 fecundity of a few
thousand eggs, but its relative fecundity is 70 times higher than for Nile perch and almost
4,000 times that of the tilapia species.
Studies by Cowx et al. (2008) indicated that Dagaa is infected by a cestode (Ligula
intestinalis) that destroys its gonads, reducing its reproductive potential by almost 10%, and
affecting its annual recruitment.
Being a fast-swimming fish of the open waters, it has been able to withstand the ecological
upheaval caused by the introduced predator Nile perch better than most other local species.
1Absolute fecundity is the total number of eggs in a female fish. On the other hand, relative fecundity is the
number of matured oocyte in a female divided by its weight.

Ibengwe
15
UNU-Fisheries Training Programme
Dagaa is the only endemic fish species which has remained abundant in Lake Victoria since
the introduction of Nile perch and Nile tilapia in the 1950s (Wanink 1988).
The decline in numbers and diversity of the native species especially the haplochromine
cichlids, as a result of predation by the Nile perch, appears to have altered the lake's food web
(Kazungu et al. 2008). This has led to an increase in biomass of dagaa (Figure 6) presumably
due to a reduction in competition for food with the zooplanktivorous haplochromines (Ogutu
-Ohwayo 1990).
Figure 7: State of three important fish stock in Lake Victoria from 2005-2008 (TAFIRI 2009)
2.2 Dagaa fishing, processing and marketing
2.2.1 Fishing
Dagaa fishing is mostly done by purse seines, scoop nets, lift nets and beach seines, using
light to attract the fish. Fishers use an average of 4–5 pressure lamps tied on rafts constructed
out of dried reeds and dagaa nets ranging between 6–8 mm mesh-size. Fishing is usually done
during the dark moon period, which is about 15–20 days per month (Wandera 1992).
Good harvest is experienced between November and April; the production of dagaa declines
during the lean season (May-October). Wind and bad weather are the main constraints to
dagaa fishing because lamps are easily lost in rough conditions (Mgawe and Mondoka 2008).
2.2.2 Processing
Sun drying is the simplest and cheapest method of fish preservation. Traditionally, most of
the dagaa catch is processed by sun drying for 10 hours. The fish are spread on the ground
(sandy beaches), rocky areas, old fishing nets and on grass locally known as kinshwi. Such
techniques are totally dependent upon the weather conditions, and dagaa dries within a day in
ideal weather (low humidity and clear skies).
-
500
1.000
1.500
2.000
2.500
2005 2006 2007 2008
Wei
gh
t in
(0
00
's)
mt
Years
Nile perch
Dagaa
Haplochromines and others

Ibengwe
16
UNU-Fisheries Training Programme
Artisanal processors at landing sites and the surrounding areas prefer drying dagaa on the
ground so as to speed up the drying processes. Many believe that it is the heat from the sand
that dries dagaa faster. Drying on the ground is also favoured because it results in sand
sticking on fish and thereby increasing the weight of the dried product, which is an important
attribute since dagaa is sold by weight in retail market (Kabahenda and Husken 2009). The
method has little control over contamination by dirt and attacks from insects and pests. As a
result the end product tends to contain a lot of sand, the quality suffers and the product
fetches low price due to quality loss.
During the rainy season the method becomes ineffective in handling large volume. The dagaa
does not dry in one day and sometimes the entire batch is lost as processors are sometimes
not able to gather their product on time, causing some of it to be swept away or soaked by
rain. The high humidity associated with the rainy season also precipitates rotting and growth
of mould especially when the product has not fully dried. Even during dry periods the drying
may be inadequate. Artisanal processors in the Lake Victoria reported that they sun dry dagaa
for only one day to avoid loss in weight. This usually results in products that are susceptible
to degradation of proteins, increased lipid oxidation and loss of vitamins and thus reduce the
nutritive value of dagaa (Kabahenda and Husken 2009).
The other threat to the nutritive value of dagaa is during storage. Dried dagaa, including the
partially dried product, is packed in gunny bags (also called poly bags) that lack aeration and
hence renders the product susceptible to degradation. The problem is intensified by the
practice of stacking bags atop slabs of cement. Bags at the bottom are subject to rotting from
slabs condensation, and the heat that accumulates inside the bags favours microbial activity
and growth of mould. Dagaa stored under such conditions requires regular airing but this is
often not possible because bags are heavy and stacked high which makes it hard to access
bags that need airing (Masette 2005).
2.2.3 Marketing
There is no effective central marketing agency in the villages. Traders buy fish at low prices
from fishers located far from major urban centres. They visit different fish landing sites daily,
buy fish and transport to markets in major towns. The local price is set depending on the
demand of fish and distances of villages from the major coastal towns. The market price of
dagaa is determined by quality, size and weight, season, market structure, supply and
demand. Dagaa prices are known to follow a seasonal pattern. Prices also vary from market
to market, and in town markets tend to be higher than in village markets due to a larger
concentration of consumers and superior family income (Abila 2003).
Dagaa is commonly distributed in local and regional markets (Figure 7). Local agents supply
the dagaa to the town markets, the largest transit market for the repacking and resale of dagaa
in Tanzania is Kirumba and Bukoba custom. There are three main markets for dagaa:
i) Local market for local consumption
ii) Regional markets in Zambia, DRC, Burundi, Rwanda, Kenya and Malawi
iii) Fishmeal industry (both local and regional)
Degraded dagaa and dagaa dust are often converted to fishmeal for animal feed but some
rotten dagaa occasionally ends up in local markets, where it becomes a potential health
hazard for local populations.

Ibengwe
17
UNU-Fisheries Training Programme
Figure 8: Flow diagram showing dagaa processing path and its distribution route to local and
regional markets (Mgawe and Mondoka 2008).
2.2.4 Consumption
Dagaa is consumed all over Tanzania. It is estimated that 91% of dagaa harvested is marketed
for domestic use, while the remaining 9% is exported to regional markets (FDD 2009).
Because of its small size, dagaa is eaten whole, including head, fins, scales, and bones, which
make this fish a major source of calcium and magnesium. The viscera give the product a
slightly bitter taste and the bitterness is more pronounced when it is not well dried. It is this
bitterness that makes dagaa less desirable to some people. The cooking methods vary, but in
general dried dagaa is fried with tomatoes and onions to make a stew or is mixed with ground
nut (peanut butter) sauce and used as a relish. Dagaa is now popular due to declines in Nile
Sun drying on sandy ground/rocks/grass (10 hours)
Selling to traders from towns (in terms of bucket)
Packing in 40 kg sacks
Transported to transit markets; such as Kirumba,
and Bukoba custom
Off-loading at transit market to check quality
Selling at Transit market to wholesale traders
Re-packing at Transit market
Wholesale transaction
Sold to retailers
Consumers
To regional markets Transported to
minor markets
Retailed in
communities

Ibengwe
18
UNU-Fisheries Training Programme
perch and tilapia catch and is increasingly used by populations around the country (Kirema-
Mukasa and Reynolds 1991).
2.3 Economic importance of dagaa fishery
Fisheries economic benefits are defined as the gains in relation to wealth acquisition from
fisheries products and its distribution to the nations, households and individuals.
In Tanzania economic importance of dagaa is reflected in several activities at the national and
community level. At the national level the main economic benefits are production and its
contribution to GDP, employment, foreign exchange earnings and collection of government
revenue. At the community level, the benefits take the forms of earnings, employment and
contribution to diet (FAO 2007).
In artisanal fisheries there are a relatively large number of positions/jobs from the fishing of
dagaa to the selling of the fish. Dagaa is rated first in terms of employment opportunities and
second in terms of economic gains to Nile perch. Fishing on Lake Victoria is carried out by
more than 98,000 full time small-scale fishers using about 29,000 small canoes with an
average crew of 3–4 fishers per canoe. Approximately another million people make their
livelihoods through various dagaa fishery-related activities as part time jobs. Such activities
include transporting, unloading, boat building, net mending, fish processing (sun drying),
retailing and other petty business.
Dagaa fisheries contributes as a source of revenue gain from its different stages of activities
like export levy charges. The money collected is used to develop the sector in terms of
management, training and monitoring of the resource utilization. Some of the revenue is also
used for human resource development in the fisheries sector (Abdalah 2004).
In 2009 Tanzania exported to the regional markets a total of 7,650 metric tons of dagaa,
which earned the country foreign exchange of about 2.7 million USD (Table 2). Fish and
fisheries products are the main foreign exchange earner after tourism and mining in the
country.
Table 2: Estimated dagaa export and its value from 2005 to 2009 (FDD 2009)
The dagaa fishery is significant for food security and sustainable livelihood. In 2000
Tanzania conducted a survey on poverty and nutrition (URT 2002), where the nutritional
value of different food stuffs was analysed in relation to cost and economic efficiency. It was
found out that dagaa from Lake Victoria had the highest score (200) followed by soy beans
(172). This shows that dagaa is a food item of extremely high economic importance, and can
Year Weight (Tons) Value 000' T.Shs Value 000' US $
2005 1278 1,403,110 1,403
2006 2227 2,149,961 2,150
2007 4694 4,689,217 4,689
2008 9991 9,207,903 9,208
2009 7651 3,430,892 3,431

Ibengwe
19
UNU-Fisheries Training Programme
contribute to Tanzania’s endeavour to improve nutritional intake through securing an
inexpensive, nutritionally rich food item (Mgawe and Mondoka 2008).
3. POST-HARVEST LOSS
Post-harvest losses occur all over the world in any type of fishery from production to point of
final sale to consumer. The loss begins immediately after the fish has been caught, hence it
includes all human activities at all stages from capture to consumption. It involves a number
of groups of stakeholders playing different roles in handling fish onboard, unloading,
processing, storing and during distribution. The type and level of loss as well as who is
affected varies according to the type of fishery, post-harvest activities, skills, knowledge,
infrastructure and access to equipment and facilities (FAO 2008).
The FAO Code of Conduct for Responsible Fisheries (CCRF) urges states to achieve full
utilisation of aquatic resources particularly those suitable for direct human consumption, by
improving practices throughout the production and supply chain in fisheries and eliminating
wastage (FAO 1998). This statement has been adopted by a number of countries including
Tanzania, where a fisheries policy (URT 1997), recognizes the existence of several
constraints in the fisheries sector to include poor fish handling practices and inadequate
processing methods. The policy statement number 7 states the aim of the country on
improving fisheries product utilization and their marketability (Mgawe and Mondoka 2008).
It is well known and documented that a large percentage of the fish caught in developing
countries are lost through poor handling. Globally, the post-harvest loss of fish has been
estimated to be between 3 (Esser 1991) and 4.2 (James 1986) million tons annually. Most of
the losses are said to occur in artisanal fisheries with estimates ranging from 15% to 75%
(Mills 1980, Moes 1980) of the catch being lost.
Nevertheless, getting beyond declarations of exact impact of fisheries post-harvest loss has
been a problem, partly owing to lack of data and concrete information regarding type, causes
of fish losses and indicative quantitative loss levels. Such data and information are crucial in
understanding the magnitude of losses before deciding appropriate and cost-effective
intervention, given limited resources available especially in developing countries. Collection
of PHFL data and information on artisanal fisheries is considered to be a difficult undertaking
due to the dispersed nature of many small-scale and less developed fisheries operations. Also,
lack of simple and cost-effective fish loss assessment methods has been a stumbling block to
conducting regular assessment of the losses.
However, FAO and the Natural Research Institute (NRI) of the University of Greenwich
United Kingdom have come up with a manual which describes three methods of assessing
post-harvest fisheries loss. The methods are; the Informal Fish Loss Assessment Method
(IFLAM), Load Tracking (LT) and Questionnaire Loss Assessment Method (QLAM). They
are designed to give the user a quantitative and qualitative understanding of post-harvest fish
losses required for planning loss reduction measures (Ward and Jeffries 2000).
The three post-harvest fish loss assessment (PHLA) methods were field tested in Tanzania
through a study conducted by FAO from 2006 to 2008. The study focused on the dagaa
fishery of Lake Victoria and the marine fisheries. The study identified different types of

Ibengwe
20
UNU-Fisheries Training Programme
losses in the dagaa fishery that cut across the entire chain of fishing, loading and unloading,
processing stage, during the selling arrangement, storage stage, transportation to transit and
terminal markets, during selling and repacking at wholesale markets to retail levels, as
presented below.
Results from IFLAM suggested high physical and quality losses in the Lake Victoria and in-
shore marine fisheries of Tanzania occur most in small-sized fish, especially dagaa. Post-
harvest losses due to quality deterioration accounts for more than 50%; also there was a
significant relationship between the type of losses and gender of operators. Men are affected
by physical and quality losses while women incur market force losses. This is the direct
consequence of different gender roles in the distribution chain.
3.1 Causes of dagaa post-harvest loss
Fishing stage
PHFL in this stage is largely caused by stepping on fish by crew on board the canoe due to
the lack of separating boards. The weight measurements taken during the study suggested that
about 0.9% of dagaa total catch weight per year is thrown overboard due to physical damage
caused by this practice.
Animal predation
The method of drying dagaa in the sun on sandy beaches, rocks or drying on grass provides
little control over attacks from insects, birds and domestic animals. Fishers employ different
tactics to deal with the problem including placing watch-keepers and butchered birds as
scaring mechanism for the growing flock of birds roaming around drying places. These
coping strategies notwithstanding, about 2% of dagaa total catch weight per year is lost
through animal predation.
Discarded after prolonged rain
Dagaa takes about ten hours to dry and get sold in the evening if the weather is favourable.
However, the situation is very challenging during the rainy season. The quality of dagaa is
heavily degraded if it rains before completion of the drying process. The grade of the product
is lowered from that for human consumption to animal feed. When there is prolonged rain on
two consecutive days, the whole lot rots and gets discarded as nyambore (unsuitable for
human consumption and animal feed). In addition, a big portion of dagaa placed on rocky
areas adjacent to the lake is easily washed in the lake.
Theft
Theft is the least of physical losses identified during the study which accounts for about 0.1%
of dagaa total catch weight per year.
Sinking sacks during transportation
After the drying process, the product is transported to major transit markets by using
transport canoes. Most of the canoes are propelled by outboard engines but they are small and
unable to withstand strong winds. Splashes of water enter the canoe and soak the fish; in such

Ibengwe
21
UNU-Fisheries Training Programme
cases the load becomes heavier compelling a skipper to throw sacks over-board for the sake
of stability and safety.
Occasionally these canoes capsize dropping the whole load of dagaa. Such a scenario occurs
about four times per transport canoe per annum. The problem is more evident during windy
seasons, mostly in February, May, June and December of each year. It was estimated that
0.7% of total weight catch per year is lost in this way.
Presence of by-catch
An increased level of by-catch (mostly Haplochromis spp.) is another cause of losses to
fishers and traders. The volume of by-catch in dagaa landings seems to be increasing over
time probably due to the decreasing population of the Nile perch, its main predator. Most of it
is sorted out and given free of charge to people who happen to be at the landing site. Failure
to sort it out lowers the quality of the dried product resulting in low prices. Despite the effort
to sort out the by-catch at the fishing village, it represents about 2.5% of dagaa total catch
weight per year reaching the wholesale market (Mgawe and Mondoka 2008).
Quality degradation caused by rain
In addition to physical loss caused by rain, the rainy season also creates drying and storage
difficulties because most of the days are unfavourable drying conditions (low temperature
and higher relative humidity). Therefore higher volumes of poor quality products are
produced during the rainy season. As if that is not enough, demand declines mainly due to
declining number of traders visiting fishing villages during the rainy season to avoid the risk
involved in quality loss. Consequently, increased proportion of dagaa is degraded, selling as
animal feed as opposed to human food. A study by Mgawe and Mondoka 2008 estimated the
quality loss due to rain is about 11% of the catch weight landed in per annum 2008.
Change in colour before being sold
Colour change from silvery to brownish, as a function of biochemical processes including fat
oxidation and autolysis is a major indicator used by customers in determining the quality of
dagaa. High water content and prolonged storage are some of the factors that accelerate the
rate of change. The colour tends to change after a period of about 5-10 days depending on
drying conditions. The dagaa dried on rocks seems to take a bit longer before it changes
colour, compared to the ones dried on sand or grass (kinshwi). The study estimated that 30%
of the dried product change in colour before being sold. As the colour change of dagaa may
reduce the selling price by one third (Akande and Diei-Ouadi 2010), the overall loss by the
colour change is probably the largest single loss factor in the whole value adding chain.
Fragments/drying grass
Fragmentation is another cause of high post-harvest loss. Initially, it was being assumed that
the problem was closely related to poor road and bad transportation. However, the study
found that this could hardly be the case for areas connected with improved tarmac roads such
as Lake Victoria area and Dar es Salaam. Rather, it was found that the problem rests with
government regulations on levy per sack instead of per kg and the arrangement of charging
transport cost by using sacks as units. These two arrangements invite traders to over-pack the

Ibengwe
22
UNU-Fisheries Training Programme
dagaa into large sacks through a practice locally known as lumbesa. In the process of pressing
up the dried fish into the sacks, some of the fish is broken, which increases the proportions of
fragments.
Large quantity of grass found in dried dagaa is another problem causing quality degradation.
This is mostly associated with dagaa dried on grass (kinshwi), a common practice in the
Kagera region of Lake Victoria.
Loss through levy evasion
Over 50% of dried dagaa from the Tanzanian side of Lake Victoria is believed to be exported
in the regional market. A common practice is that a trader purchases dried dagaa from fishing
villages or at a transit market declaring to be sending it to towns located in border areas but
within the country. This enables him to evade paying the export levy. On getting to border
towns he stores his product in large warehouses constructed in respective areas to facilitate
the cross-border trade. The actual crossing takes place at night when law enforcers are out of
sight. This practice makes the government lose potential revenue from cross-border trade
(Mgawe and Mondoka 2008).
A review of case studies on post-harvest losses in several countries in Africa estimates high
levels of losses both in quantity (physical losses) and quality (mostly due to downgrading) of
fishery products. Losses may vary within communities along the same water body and for the
same fish species; there are differences in root causes of losses and hence the type of loss
reduction intervention needed. According to Kabahenda et al. (2009), postharvest losses in
Lake Victoria dagaa fisheries are valued at:
0 – 7.5% physical loss and 1.5 – 18.9% quality loss in Kenya,
20 – 40% physical loss and 20% quality loss in Tanzania, and
26 – 40% physical loss and 2 – 5% quality loss in Uganda.
These losses have major implications on the nutritional quality and availability of fish
products to local populations. The comparison between countries shows that the potential for
improvement is very high in Tanzania.
3.2 Post harvest loss intervention strategies
Studies on dagaa post-harvest loss have recommended different intervention strategies for
reducing loss. Mgawe and Mondoka (2008) suggested processing methodologies such as
using drying racks, smoking, and production of value added products like brined and salted-
dried. Masette (2005), based on field observations, also acknowledged these methods as low-
cost processing technologies for reducing dagaa post-harvest loss.
It has been recognized that the use of drying racks can reduce post-harvest loss at 50% and it
has many advantages over traditional methods, such as:
Reduction in post-harvest losses as fish can easily be protected from rain and
groundwater by covering with a sheet of plastic or other waterproof material.
A higher quality product since pests and domestic animals cannot easily reach to
contaminate the fish.
A shorter drying time because air can pass over both sides of the fish, and
A cleaner product is obtained as there is no contact with dust and dirt. (Mwambazi
1992)

Ibengwe
23
UNU-Fisheries Training Programme
Though fishers, processors and traders experience losses, it has been found that people use
various coping strategies to control or minimise loss as much as possible. Some of these
strategies can form the basis of interventions while others are potentially harmful.
The use of drying racks in Uganda has resulted in a reduction of loss to a negligible level as
compared with the high level of losses in drying dagaa on bare floors, ground and grasses
(Figure 8). It has been realized that dagaa dried on racks are better quality product than the
ones dried on the ground. The fish dried on racks fetches a better price as compared to fish
dried on the ground (Masette 2005).
Figure 9: Sun drying of dagaa on racks
In Tanzania physical losses are frequent and high. Often children are employed to prevent
birds and animals from reaching the drying sites. Similarly tying string or twine above the
racks is used as protection or hanging dead birds up is also used as a scaring mechanism
against birds and animals (Mgawe and Mondoka 2008).
Fishers will increase fishing effort to compensate for the lost income due to the quality loss.
In so doing they tend to increase the pressure put on fishery resources producing a threat to
sustainability – a potential loss to all (Akande and Diei-Ouadi 2010).
3.2.3 Stakeholders affected
Most stakeholders are affected by post-harvest losses, e.g. fishers, fish traders, fish processors
and ancillary labourers such as boat builders and net makers as well as consumers. Losses are
a serious socio-economic problem leading to tons of highly nutritious fish being left to rot,
thus contributing to food insecurity (Poulter et al. 1988).
In Tanzania children guard drying dagaa against animal predation and theft. They are paid in
dried fish for their services, but there is an opportunity cost incurred by these children as they
have to leave school. Certainly this is the outcome of post-harvest loss to society, an integral
part of PHFL and socio-economic aspect (Mgawe and Mondoka 2008).

Ibengwe
24
UNU-Fisheries Training Programme
In Uganda, the socio-economic implication revolves around the poor who buy poor quality
fish. This, of course, exposes them to potential health hazards or unwholesome products
because, unknowingly they may be consuming fish unsafe for consumption or which has lost
its nutritional value through poor handling and time/temperature abuse. This, therefore,
increases the poor’s vulnerability to disease (Akande and Diei-Ouadi 2010).

Ibengwe
25
UNU-Fisheries Training Programme
4. METHODOLOGY
4.1 Data collection
A literature review was done to acquire the necessary information and secondary data were
extracted from different articles (reports and journal) related to the topic of study. Data were
collected from the following organisations, institutions and technical working groups:
Food and Agriculture Organization of the United Nations (FAO)
Lake Victoria Fisheries Organization (LVFO)
Regional Technical Committee Reports on Frame Surveys, Lake Victoria, Tanzania
Fisheries Departments (Tanzania and Uganda)
A study on Post-Harvest Fish Loss Assessment (PHFLA) of dagaa was conducted in Lake
Victoria by FAO in 2008 (Table 3), within the framework of the regional post-harvest loss
assessment (PHLA) programme in small-scale fisheries in Africa. The study was designed to
generate a practical guide for dagaa loss assessment in Tanzania, by providing benchmark
data for types of losses, percentages of loss in each categories and the dry weight equivalent.
Table 3: Indicative quantitative post-harvest loss in dagaa fishery Tanzania (FAO 2008)
REASONS FOR LOSS Fresh wt. (tons)
Dry wt. (tons)
Equivalent
Loss (Million
Tshs.)
Estimated dagaa landing 100 197,2002 35%
Types of loss
i) Physical loss % Loss
Physical damage during fishing 0.9%
1,775
621
1,242
Animal predation 2%
3,944
1,380
2,761
Discarded after prolonged rain 4%
3,155
1,104
2,209
Theft 0.1%
197
35
70
Sinking sacks during transportation 0.7%
1,380
520
1,040
ii) Quality loss
Presence of by-catch 2.5%
4,930
1,750
3,500
Quality degradation through rain 11%
22,400
7,840
14,112
Change in colour before being sold 30%
59,160
21,000
10,500
Fragments/drying grass 8%
15,776
5,600
10,080
TOTAL PHYSICAL AND QUALITY LOSS
45,514
iii) Market practices
Unfair marketing practice 7,700 15,400
Loss due to insect infestation Not quantified
Loss in terms of levy evasion Not quantified
2 There is conflicting information from data sources (the fisheries research institute and fisheries development
division) on average dagaa catch per year. The FAO study used data from fisheries research institute, and data for this study was obtained from the fisheries development division.
Ibengwe
26
UNU-Fisheries Training Programme
Enquiry was done in Tanzania and Uganda through the fisheries department to get data on the
design, dimension of drying racks and price differences between the product dried on ground
and that dried on drying racks. Table 4 provides estimated price per 1 kg of different products
of dagaa.
Table 4: Estimated price (USD3/T.Shs.) for 1 kg of different products of dagaa in Tanzania
The rack design, dimension and material descriptions were sent to Tanzania, to obtain the
actual cost quotation as the project will be implemented in Tanzania.
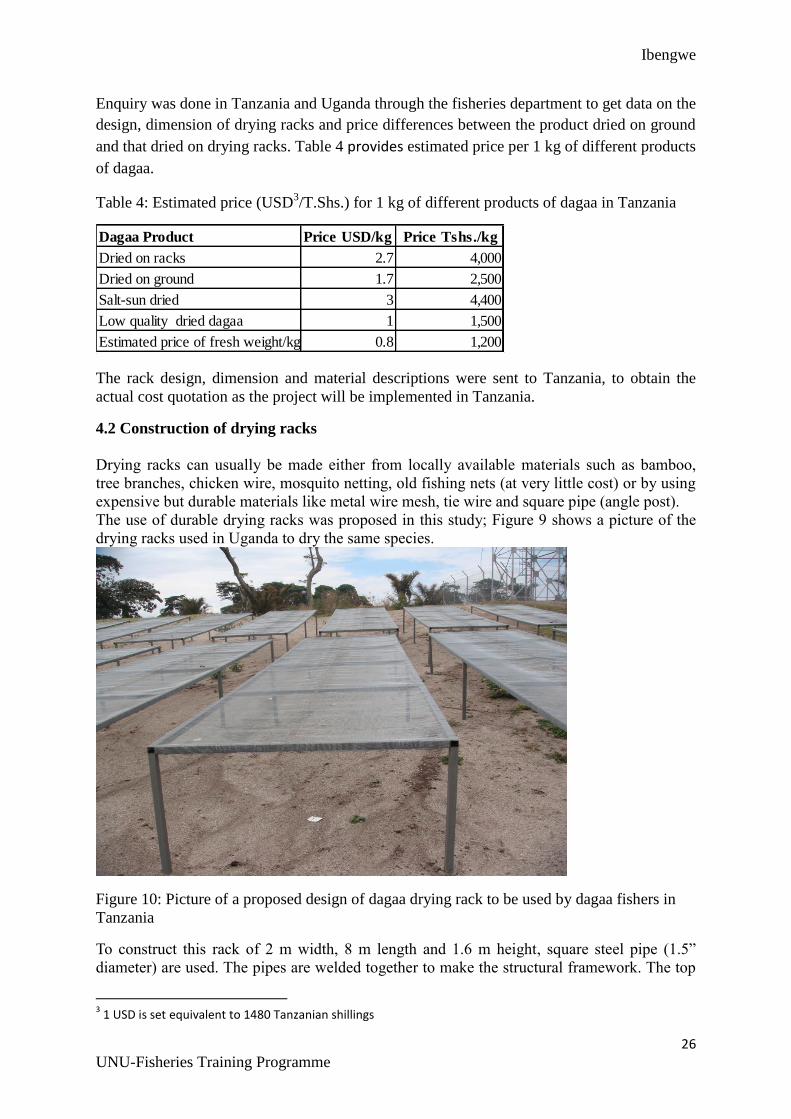
4.2 Construction of drying racks
Drying racks can usually be made either from locally available materials such as bamboo,
tree branches, chicken wire, mosquito netting, old fishing nets (at very little cost) or by using
expensive but durable materials like metal wire mesh, tie wire and square pipe (angle post).
The use of durable drying racks was proposed in this study; Figure 9 shows a picture of the
drying racks used in Uganda to dry the same species.
Figure 10: Picture of a proposed design of dagaa drying rack to be used by dagaa fishers in
Tanzania
To construct this rack of 2 m width, 8 m length and 1.6 m height, square steel pipe (1.5”
diameter) are used. The pipes are welded together to make the structural framework. The top
3 1 USD is set equivalent to 1480 Tanzanian shillings
Dagaa Product Price USD/kg Price Tshs./kg
Dried on racks 2.7 4,000
Dried on ground 1.7 2,500
Salt-sun dried 3 4,400
Low quality dried dagaa 1 1,500
Estimated price of fresh weight/kg 0.8 1,200

Ibengwe
27
UNU-Fisheries Training Programme
is then covered with wire mesh or chicken wire, depending on preference. The racks of 16 m2
can manage 80 kg fresh weight of dagaa.
4.3 Cost and benefit analysis
Cost benefit analysis has the objective to systematically compare both private and public
costs and benefits from a project to evaluate its net profitability, with time differences taken
into account. This method was chosen because it is the most straightforward, organised and
analytical method of comparing benefit and cost in evaluating the desirability of a project or
programme often of social nature (Robert et al. 1997). The analysis of management strategy
was narrowed to sun drying by using drying racks. The analysis was used to determine
whether adopting drying dagaa on racks to reduce post-harvest loss will hold positive public
value in the future. Two categories for each analysis were set i.e. private (individual fisher)
and public (government) for a pilot district (500 fishers). The analyses were divided into five
parts:
1. Assessment of all possible dagaa post-harvest losses
2. Assessment of the cost of reducing the losses, including implementation cost
3. Assessment of the anticipated benefits associated with reducing the losses
4. Evaluation of costs and benefits to determine net benefit and NPV
5. A sensitivity analysis and breakeven analysis
4.3.1 Assessment of all possible dagaa post-harvest losses
Post Harvest Fish Loss Assessment standards (Indicative quantitative PHFL ) of Lake
Victoria dagaa fishery from a previous study by the FAO (Table 3) and information on the
weight and price of fish were used to calculate the monetary loss.
Determination of total dagaa catch weight per year for private (individual fisher) and for a
pilot district (500 fishers) was done. The project is deemed good if aggregate private benefits
exceed implementation (public) costs. The percentage of loss data based on physical and
quality loss from the FAO study was used to find the fresh weight after loss that will be dried
on racks.
The dry weight equivalent was calculated based on an output ratio of 35% of the total fresh
dagaa weight. Then the dry weights in each category were multiplied with the price per kg to
get the monetary value. The monetary values were summed up to get the total loss.
4.3.2 Assessment of the cost of reducing the losses
Costs can be described as the intended or unintended negative effects of a project.
Construction costs for drying racks and implementation cost are the most direct costs to
individual fisher and the government for a public improvement project respectively.
Total anticipated cost of drying racks for private, public (government) and for a pilot district
(500 fishers) project were evaluated.
Estimated price of construction materials i.e. wire mesh, square pipe, tie wire, along with
labour cost and transport cost were used to calculate the cost of construction.

Ibengwe
28
UNU-Fisheries Training Programme
The monetary cost of reducing loss was calculated as
( ) ∑ ( ) ( ) Equation 1
Where;
C = cost of different items, i.e. construction materials, implementation, transport, etc.,
t = time of year when cost was assessed,
∑= summation of all cost,
w= the price of one unit of input j at time t,
x= quantity of input j at time t. (Boardman et al. 2006)
4.3.3 Assessment of the benefits associated with reducing the losses
Direct benefits accrued from drying dagaa on racks are income generation (economic gain)
through acquiring best price of the improved product and government increase of revenue
collection from local, national and regional trade. There may also be other benefits, such as
improved nutritional value or increased food supply. These are however not taken into
account in this study due to lack of data.
The analysis of benefit of using racks was done as follows: the total quality loss and physical
loss weight for private drying on ground and drying on racks project were deducted from
average catch per fisher (private) for one year to obtain the total weight left for selling. The
total weights left for selling were then calculated by 35% which was later multiplied by price
(better price 2.7 USD/kg) for one kg to obtain the monetary gain. Quality loss weight was
also taken into consideration by multiplying with the reduced price (1 USD/kg). The same
procedure was done for a pilot district (500 fishers) project.
The monetary gain was calculated as
B (t) ∑ ( ) ( )
Equation 2
Where;
B = Benefit of drying dagaa on racks and salt sun-drying processing,
∑= Summation of all monetary gain,
p = price of output i at time t,
q = quantity of output i at time t,
t = time when the benefit was evaluated. (Boardman et al. 2006)
To obtain the total benefit of using racks, the sum of monetary gain from weights left for
selling and weight from quality loss for private drying on ground and on racks projects were
deducted from the monetary loss (refer 4.3.1 assessment of loss) for drying on ground and
drying on racks. The same was done for the pilot district (500 fishers) project.

Ibengwe
29
UNU-Fisheries Training Programme
4.3.4 Evaluation of costs and benefits to determine net benefit and NPV
The cost and benefit analysis was done by subtracting all identified costs of management
interventions for reducing post-harvest loss from the expected benefits gained after reducing
the losses, so as to determine whether the positives outweigh the cost.
To compare the changes in benefits and costs, they are discounted back to the present period
given present values. The weighting of these flows at different time periods is possible by
using the price of holding money (the discount rate). The discount rate of 0.172 was used in
this study; it is the rate the central bank of Tanzania charges in determining the present value
of future cash flows.
The overall economic net-benefits of using racks for private (individual) as well as for a pilot
district (500 fishers) was therefore determined as follows:
Net-benefits to society = NPV (benefits – costs)
The following formula was used
0 1
T
tt
B t C tNPV
r
Equation 3
Where;
NPV is the net present value of the items of subtracting benefits to costs.
r = the discount rate,
B (t) = benefit at time t, as described above,
C (t) = cost of items at time t, as described above,
T = number of years of implementation. (Boardman et al. 2006)
4.4 Sensitivity analysis
The cost and benefit analysis is subject to substantial uncertainty, therefore a sensitivity
analysis was used to check the robustness of the calculated Net Present Value for the drying
racks project. The sensitivity analysis was categorised into two parts, private and public
drying racks project.
The analysis was conducted by working out the percentage change from -50% to 50% in
NPV, different scenarios of assumptions were set to investigate how changes in values of
implementation cost, investment cost, quantity of fresh dagaa and sales price of dagaa would
impact the Net Present Value. It was done by varying a single assumption while holding
others constant.
This makes it possible to gain a better understanding of the nature and level of impact the
actual outcome of a particular variable will have, if it differs from what was previously
calculated.

Ibengwe
30
UNU-Fisheries Training Programme
4.4.1 Break even analysis
The break even analysis presented in this study represents a long term breakeven point for the
10 year implementation plan of the public drying dagaa on racks project.
The cumulative present values in each year was used to indicate the breakeven point, at
which cost or expenses of implementing drying racks to the community will be equal to the
profit gained.

Ibengwe
31
UNU-Fisheries Training Programme
5. ANALYSIS AND RESULTS
This study assessed the feasibility of drying dagaa on racks as an intervention strategy to
reduce post-harvest loss. Sun drying as suggested here is familiar to Tanzanian artisanal
fishers.
5.1 Loss available when drying dagaa on ground (before using racks) and after drying
on racks
5.1.1 Private (individual) post-harvest loss for drying racks
The average catch per year for one fisher was estimated (Table 5). Dagaa fishing is
commonly done during the dark moon period, about 15-20 days in each month. The data on
percentage composition of loss categories (physical and quality loss) from the FAO study of
2008, on the assessment of PHFL of Lake Victoria dagaa was used to determine the fresh
weight to be dried. The dry weight equivalent was calculated based on dagaa output ratio of
35% of the total fresh weight (Table 6).
Table 5: Estimated dagaa catches per fisher/day/month/year
Average
catch/day/kg/fisher
day of
fishing/month
Average
catch/month
Average catch
(tons.)/year/fisher
21 20
420
5
The FAO PHLA data identified 59% of dagaa post-harvest loss (physical and quality loss)
per year (Table 3). Based on an average catch of 5 metric tonnes per year, fishers will incur
financial losses of approximately 1,139 USD per annum when dagaa is dried on ground
(Table 6, Appendix 1 and 2). According to Mwambazi (1992) using racks can reduce post-
harvest loss by half. Therefore dagaa post-harvest loss (physical and quality loss) will be
reduced at 30% after using drying racks per fisher/year;, this loss is equivalent to 662 USD
financial loss. The price of dried dagaa is expected to increase from 1.7 USD/(kg) to 2.7
USD/(kg) as the product of dagaa dried on racks will be of better quality.
Table 6: Summary of estimated post-harvest loss of dagaa dried on ground and dagaa dried
on racks private (individual) weight (kg) and price in USD
5.1.2 Pilot district (500 fishers) project post-harvest loss for drying racks
To determine loss for a pilot district (500 fishers), 10 villages/communities in a pilot district
were selected for introducing drying racks. It was assumed that 50 dagaa fishers in each
village will be sensitised and trained on using drying racks. It is known that one fisher can
catch a total weight of 5 tonnes per year, therefore 500 fishers are expected to catch 2,520
tonnes of dagaa per year.
Processing method Total catch/fisher/year/(kg) Post- harvest loss % Fresh wt (kg) Dry wt.(kg) Eqv. 35% Loss (USD)
Drying on ground 5,040 59% 2,984 1,044 1,139
Drying on racks 5,040 30% 1494 523 662

Ibengwe
32
UNU-Fisheries Training Programme
The analysis indicated that for a pilot district (500 fishers) dagaa post-harvest loss (physical
and quality loss) is about 57 thousand USD for dagaa dried on ground (Table 7, appendix 1
and 2) and 33 thousand USD after using drying racks.
Table 7: Summary of estimated post-harvest loss of dagaa dried on ground and dagaa dried
on racks for a pilot district (500 fishers) weight (kg) and price in USD
5.2 Estimated cost of reducing the post-harvest losses in Tanzania
The cost for implementation of the drying racks project to the community is the largest and
most direct cost of the project to the government. Potential costs to fishers includes
investment costs of construction and operational cost for drying racks.
5.2.1 Implementation costs
It is estimated that implementation of drying racks will cost 636 thousands USD (Table 8).
The plan will be executed in 10 villages/communities (50 fishers in each village) in a pilot
district.
It should be noted that the criteria for estimating costs were based on current market prices
and public service policy.
Table 8: Estimated cost for the implementation of dagaa drying project
Processing method Total catch(Tons)/500 fisher/year Post- harvest loss % Fresh wt (Tons) Dry wt.(Tons) Eqv.35% Loss (000'USD)
Drying on ground 2,520 59% 1,491 522 569
Drying on racks 2,520 30% 747 261 331

Ibengwe
33
UNU-Fisheries Training Programme
5.2.2 Estimated investment cost for drying racks private and for a pilot district (500 fishers)
project Table 9 indicates the investment cost of constructing 1 rack (pipes, mesh wire and tie wire)
along with operation cost (labour and transportation cost). It was estimated that construction
of one rack will cost 98 USD for one year.
Table 9: Estimated investment cost of constructing one rack per year (USD)
It has been estimated that one fisher is capable of catching 21 kg of dagaa per day (Table 5);
one rack was used to compute the total investment cost per year for one fisher (Table 10).
For a pilot district (500 fishers) project there were 500 drying racks for 500 fishers (Table
11).
Programe Component Program Activity Unit Time scale Item Quantity Unit Cost($US) Total Cost ($US)
1. Preparatory Stage Village 5 months 10
1.1. Consultations to inform
communities, Local leaders
&Govt.officials Hold Meetings 10 1 Days 2 100 2,000
Participants (Fisheries Division) 10 4 Days 10 65 26,000
Partipants(Community level) 10 4 Days 25 20 20,000
Hold Workshops 10 2 Days 5 100 10,000
Prepare Operational plan for implementation Consultant 3 month 1 5,000 15,000
Sub-Total 73,000
2. Management cost
Stationary(notebooks&pens) 25 1 5 5 625
Fuel 1 litres 800 2 1,600
Sub-Total 2,225
3. Implementation 12months
Community mobilization & Awareness 10 10 Days 25 40 100,000
Training in construction & use of drying Racks 10 20 Days 25 50 250,000
Participants (Fisheries Division) 10 30 Days 10 65 195,000
Sub-Total 545,000
4. Operational Fuel (1000L*3 vehicles*2 Trips) 1 litres 6000 2 12,000
Sub-Total 12,000
5.Monitoring and Evaluation 10 2 2 1,000 4,000
Sub-Total 4,000
GRAND TOTAL 636,225
Construction Materials Price USD
Pipes 24
Mesh wire 26
Tie wire 5
Sub -total 55
Operational cost
Labor 34
Transport 9
Sub-Total 43
Total 98
Table11:Estimated investment cost to a
pilot district and implementation cost to the
government for drying racks project
Table11: Estimated private (individual)
investment cost for dagaa racks project
(USD)

Ibengwe
34
UNU-Fisheries Training Programme
Materials for construction of racks can last for one year with the exception of pipes, so there
is recurrent cost for rehabilitation of racks in subsequent years. It was estimated that, for the
first year of the private project fishers will incur a total cost of 115 USD. Likewise for the
pilot district (500 fishers) costs will initially be 57 USD thousands for racks construction and
636 USD thousands to the government as implementation cost, while in subsequent years it
will cost 112 USD for private (individual fisher), 43 thousands USD for the pilot district (500
fishers) and 12 thousands USD to the government as implementation cost for the public
project in a pilot district.
5.3 Expected benefit after reducing post-harvest losses
Benefit evaluation on this study was grouped into private (individual) in a pilot district (500
fishers) and public (government) benefit. Direct benefit evaluated was improvement of
income generation (economic), expected through acquiring best price for the improved
product and increased productivity after reducing post-harvest loss.
5.3.1 Benefit for the private (individual), pilot district (500 fishers) and to the government
To derive the benefits attained by individual fisher/(500 fishers)/government from the dagaa
drying racks project; the total quality loss and physical loss weight for private drying on
ground and drying on racks were deducted from average catch per fisher (private) for one
year to obtain the total weight left for selling.
Monetary gain from weights left for selling for private/public drying on ground and drying on
racks projects were deducted from the monetary loss (4.3.1 assessment of loss) for drying on
ground and drying on racks both for public and private respectively; this was also done for
the public project (table 12 and table 13).
Investment cost
Construction Materials Year 1 Year 2-5
Pipes 24
Mesh wire 26 26
Tie wire 5 5
Labor 34 34
Transport 9 9
Sub -Total 98 74
Capital cost for 1 rack 17 13
Material cost for 1 racks 98 74
Capital cost for racks 17 38
Total investment cost 115 112
Price /USDConstruction Materials Year 1 Year 2-5
Pipes 24
Mesh wire 26 26
Tie wire 5 5
Labor 34 34
Transport 9 9
Total investment for I rack 98 74
Capital cost for 1 racks 17 13
Investment 500 racks 49,000 37,000
Capital 500 racks 8,428 6,364
Total investment for 500 racks/500 fishers 57,428 43,364
Initial Implementation cost to the Govt. 636,225
Subsequent implementation cost to the Govt. 12,000
Total implementation cost to the Govt. 636,225 12,000
Price USD
Table12: Anticipated private benefit after
using racks, weight in kg and price in USD
Table 13: Anticipated total benefit for the pilot
district (500 fishers) after using racks, weight
(ton) and price in 000' USD.

Ibengwe
35
UNU-Fisheries Training Programme
The total benefit after using racks was 477 USD for the private project and 238 USD for the
pilot district (500 fishers) project.
Benefit to the government will be an increase in revenue collection from local, national and
regional trade. The analysis indicated that 109,835 thousand USD will be gained from
revenue collection each year during the period of the project implementation.
5.4 Evaluation of private/public costs and benefits for drying racks to determine net
benefit and NPV
The overall financial net-benefits of using drying racks to individual fisher (private) as well
as to the public (government) were done.
It was found that the net benefit for the drying racks project is 142 USD per fisher (private)
for the first year; the benefit will then increase to 145 USD for the subsequent years. The
present value for each year was calculated and summed up to get the NPV 460 USD (Table
14). For the public project the first year of implementation, the project will be in loss
approximated at -607 thousand USD. Then it will make profit for the rest of implementation
period; the NPV will be 9,049 USD (Appendix 5).
Table 14: Drying racks (individual) private project cost and benefit analysis for five years
Category/catch/loss/benefit Wt/Kg Quantity in USD
Total catch available/fisher/year 5,040
Physical loss/wt/kg 388
Quality loss wt/kg 2,596
Total loss/wt/kg 2,984
Left for selling in wt/kg 2,056
Revenue from Quality loss product /USD 908
Revenue from left wt for selling/USD 1,224
Total benefit/USD 2,132
Loss occurred when drying on ground 1,139
Loss occured after using dying racks 662
Benefit drying on racks 1,470
Benefit drying on ground 993
Total benefit after using racks 477
Category/catch/loss/benefit Weight/Tonnes Quantity/000' USD
Total catch available/500 fisher/year 2,520
Physical loss/wt/Tons. 194
Quality wt./Tons. 1,298
Total loss/wt./Tons 1,492
Left for selling in wt/Tons. 1,028
Revenue from Quality loss goes to the market/USD 454
Revenue from left wt for selling/USD 612
Total benefit/USD 1,066
Loss occurred when drying on ground 570
Loss occured after using dying racks 331
Benefit using drying on racks/USD 735
Benefit drying on ground/USD 496
Total benefit after using racks 238

Ibengwe
36
UNU-Fisheries Training Programme
Figure 10 displays the breakeven point of the implementation plan for the public drying rack
project by the government. The project will experience loss from first year to the fourth year,
then it will break even and generate profit from fifth year to the last year. Therefore it will
take four years for the project to reach its full potential.
Figure 12: Breakeven point of public drying racks project for ten years
5.5 Sensitivity analysis results
Percentage change under a given set of assumptions of implementation cost, investment cost,
quantity of dagaa and sales price of dagaa was done to examine their impact on NPV
(Appendix 6 for private and Appendix 7 for public project in a pilot district).
Analysis of the drying racks project both private and public revealed that NPV is most
sensitive to changes in sales price (Figure 11 and Figure 12). However the results showed that
NPV is not sensitive to quantity of catches and investment cost.
Drying racks private project
COST/USD 1 2 3 4 5
Investment cost 1 racks 115 112 112 112 112
Taxes 220 220 220 220 220
Total cost 335 332 332 332 332
BENEFIT/ USD
Benefit drying on rack 1,470 1,470 1,470 1,470 1,470
Benefit drying on ground 993 993 993 993 993
Total benefit 477 477 477 477 477
Net Benefit 142 145 145 145 145
Present Value 121 106 90 77 66
NPV /USD 460
YEAR
-2.000
-1.500
-1.000
-500
-
500
1.000
1.500
2.000
2.500
3.000
3.500
1 2 3 4 5 6 7 8 9 10
Pre
sen
t v
alu
e (U
SD
)
Years
Profit
Breakeven point
Loss

Ibengwe
37
UNU-Fisheries Training Programme
Figure 13: Sensitivity analysis chart on different % changes of cost, price (USD) and quantity
of dagaa (kg) private project
Figure 14: Sensitivity analysis chart on different % changes of cost, price (USD) and quantity
of dagaa (kg) public project
5.6 Discussion
5.6.1 Reducing post-harvest loss of dagaa fisheries in Tanzania
The current rate of dagaa post-harvest loss was estimated to be 59% by the FAO study, and
the use of drying racks could reduce this loss by half (FAO 2008).
Based on average catch per fisher for year (5 tons) for the individual fisher and 2,520 tons for
a pilot district (500 fishers) in aggregate, the use of drying racks will lessen the post-harvest
loss from 1139 USD (drying on ground) to 662 USD when drying on racks for the individual
fisher and 57 thousands USD to 33 thousands USD for the pilot district (500 fishers). Drying
-2.000
-1.500
-1.000
-500
0
500
1.000
1.500
2.000
2.500
NP
V (
USD
)
Investment cost
Quantity of catches
Sales price
-8.000
-6.000
-4.000
-2.000
-
2.000
4.000
6.000
8.000
-50
%
-40
%
-30
%
-20
%
-10
%
0%
10
%
20
%
30
%
40
%
50
%
NP
V (
00
' USD
) Investment cost(00'USD)
Quantity of catches(00' kg)
Sales price (00' USD)

Ibengwe
38
UNU-Fisheries Training Programme
racks are beneficial because they can reduce losses, decrease drying time and process a
cleaner product of higher quality.
The construction of proposed dagaa drying racks may seem high for fishers, but this study
revealed that investment cost per year is negligible when it is compared to the profits that will
be gained. It is expected that the cost will be recovered quickly as losses will be lower and
prices will be higher for the good quality products. If improvements are demonstrated by
producing a good product, with reduced losses in a shorter time, then fishers will adopt the
use of drying racks.
It was found that the net benefit for a private (individual) dagaa drying racks project will
initially be low (142 USD/year), but it is anticipated to increase in the subsequent years at
145 USD per year. This is because the initial investment cost is also high. The analysis
indicates that drying racks will offer fishers higher profit margins.
When operated at similar capacities, the overall project of the dagaa drying racks for a pilot
district (500 fishers) will similarly give higher economic returns to the government. It has
been documented that demand for the quality product is high and is driven by its principal
markets of DRC, Zimbabwe, Zambia, Sudan, Rwanda and Burundi (Masette 2005).
Consumers are willing to pay a premium price for a high quality product, therefore there are
prospects of increasing sales price from 2.7 USD/kg (estimated in this study) to 4 USD/kg
and make better profit.
The positive NPV further confirmed good financial performance, both for private (individual)
benefits as well as for a pilot district (500 fishers) drying dagaa racks project. This strongly
supports the proposal that the drying racks project is worthwhile and should be implemented
in Tanzania. By using drying racks, dagaa post-harvest loss will be reduced, productivity will
be increased and provide sustainable livelihood to fishers and processors, as well as increase
regional trade and foreign exchange earnings for the national government.
Furthermore, the sensitivity analysis results indicated that the NPV of the drying racks project
is heavily affected by changes in sales price. This is not surprising for the reason that when
sales price is increased, the net benefit will be equally increased hence positive NPV.
On the other hand it was presented that the NPV of the drying racks project was not sensitive
to change in investment and implementation costs. Percentages increase or decrease in
investment and implementation costs had no effect on NPV. This suggests that fishers and
government should not take investment and implementation cost as an obstacle for the
project, but rather considers it as an attractive investment opportunity.
It is therefore anticipated that implementing the drying racks project will significantly support
the fisheries sector in meeting one of its objectives stated in the national fisheries policy and
strategic statement of 1997, which is ‘to put into efficient use of available resources in order
to increase fish production’.
5.6.2 Limitations of this analysis
In the reduction of post-harvest loss some of the benefits are indirectly gained by a third
party.

Ibengwe
39
UNU-Fisheries Training Programme
There were several intangible benefits in the analysis that were difficult to quantify in monetary
terms, including improvement of food security, nutrition status to the society and contribution
to employment.
The lack of accurate investment cost of dagaa drying racks was a problem that this analysis was
not truly able to overcome. However, the framework of the analysis should enable one to come
up with the exact cost of the two projects when precise figures are available.
There is conflicting information from data sources (the fisheries research institute and fisheries
development division) on average dagaa catch for individual fisher per year. The study used
conservative estimated average catch of 5 tons/fisher; this was according to the approximated
catch for artisanal fishers for one year in Africa (Kolding et al. 2008).
5.7 Implementation time scale for proposed project to reduce post-harvest loss in
Tanzania
The main objective of this study project is to propose cost effective management strategies to
reduce post-harvest loss in the Lake Victoria dagaa fishery in Tanzania. Simple and cheap
post-harvest technologies that build on fishers’ own indigenous knowledge need to be
developed and adapted to local conditions in order to reduce post-harvest losses by at least
50% during the 10 years of project implementation. The use of drying racks was
recommended to meet the objective.
Effective participatory planning processes involving all legitimate stakeholders (dagaa
processors, fishers, private sector and the Fisheries Department) need to be put into place and
supported with appropriate legislation. Adoption of new technological innovation in dagaa
processing hinges on how to promote a new technique in the dagaa processing method and
how to increase at least proportionately the net benefits to all stakeholders involved in the
fishery.
The overall goal of the implementation plan will be to contribute to food security and income
improvement of fishers in Tanzania by reducing dagaa post-harvest loss.
To attain this goal, the following intermediate objectives are defined:
Improve dagaa processing from drying the product on the ground to the use of new
appropriate drying technology of drying racks.
Strengthen/create professional organisations of fresh and dried dagaa traders.
Mobilise human and other resources to assist the sector and utilise such resources
effectively.
Provide support to dagaa processors and traders to further develop their enterprises.
Time scale for the implementation plan will be in phases (stepwise). Table 10 shows the
implementation stages with cost for the drying racks project.
The implementation plan will be organized into three stages: preparatory stage,
implementation stage and monitoring and evaluation stage. It was identified that the
preparatory stage in a pilot district will take five to six months. Time is needed for consulting
local leaders and government authorities. Sensitisation and creating awareness by holding

Ibengwe
40
UNU-Fisheries Training Programme
meetings and workshops will be done in selected villages/communities, as well as the
operational plan will be set up to start the actual implementation.
It will require 1 to 2 years for the project to be implemented in a pilot district. Community
mobilisation and awareness, as well as training in construction and use of drying racks will be
done during actual implementation of the project. The implementation phase covering all
communities will probably take anywhere from one to five years.
In the last stage of monitoring and evaluation, the retrospective assessment of project benefits
and costs need also to be done, as it may play a part in this project by providing valuable
information about the appropriate design of future projects (Figure 13).
Figure 15: Project cycle assessment stages as a continuous process for drying on racks
The initial phase of implementation will involve 10 pilot fishing villages in a pilot district,
followed by full scale implementation in all communities and fishing villages.
For successful diffusion and acceptance of these technologies by the communities, the
following multidisciplinary approaches would be studied.
Economic and social aspects
It is necessary to include data on variables such as earnings, employment, and contribution to
food security and resource rent. Special care must be taken in defining and measuring income
and profitability indicators for artisanal fisheries. It is essential to understand their needs,
opportunities and constraints.
Legal and regulatory aspect
This session is directed to decision makers in governments and agencies providing technical
assistance in the formulation of policies to reduce dagaa post-harvest fishery losses and in
requesting assistance to address the problem in the post-harvest field (Fegan 1994).
Tanzania fisheries policy (URT 1997) recognizes existence of several constraints in the
fisheries sector, including poor fish handling practices and inadequate processing methods.
The policy statement number 4 states the aim of the country on improving fisheries products
utilisation and their marketability. Policy statement number 7 aims at encouraging and
Project concept
Appraisal
Implementation
Evaluation

Ibengwe
41
UNU-Fisheries Training Programme
supporting all initiatives leading to the protection and sustainable use of fish stock and
aquatic resources.
The reduction of post-harvest fishery losses, although a goal in itself, would best fit in
these policy statements if directed toward maximising the utilisation of fishery
resources for direct human consumption.
Social-political aspect
Implementation of the dagaa salted sun-drying processing and drying racks project requires
capacity building for the fishing communities in Lake Victoria: this is the key factor in the
implementation of the technology. Under this circumstance, the Fisheries Development
Division as a key partner will be responsible for fostering community awareness and
sensitising communities, community leaders and other political leaders to the new processing
method. It will also conduct training programmes for fishers, women and fisheries officials
who will work with the communities.
Socio-cultural aspects
Research has demonstrated the importance of social and cultural factors in the transfer of
technology and information.
Many applied social scientists agree that effective programs of technology and information
transfer consist of several interrelated steps: 1) development of a technology must be
compatible with the existing traditional motor skills, beliefs, attitudes, and availability of
capital, 2) communication of idea of the new technology to intended beneficiaries, and 3)
recognition by the intended beneficiaries that the new technology will fulfil their livelihood
needs (Chambers 1983).
The success of technological reduction of the dagaa post-harvest loss (PHFL) project depends
on the effective transfer of technology and information and sustained use by the intended
beneficiaries; hence, social and cultural factors must be accounted for in the design and
implementation of the project.
Financial implications
Project implementation is costly, and it will require funding for logistics to travel to the
communities to create awareness, training and construction of racks and to transport the
materials. A mutual understanding is required between the Fisheries Division, fishing
communities, stakeholders such as non-governmental organisations and donor agencies that
could provide training, technical and financial support.
Monitoring and Evaluation
The Fisheries Division will be responsible for overall implementation, monitoring and
evaluation. The retrospective assessment of the project may provide valuable information
about the appropriate design of future projects (Morrisey 1988).

Ibengwe
42
UNU-Fisheries Training Programme
6. CONCLUSIONS AND RECOMMENDATION
Lake Victoria dagaa in Tanzania is traditionally processed by sun drying on the ground, on
the grass, and mats or on old fishing nets. The process offers no protection to the product
from rain, animals or contamination by insects, sand and dirt. As a result dagaa fishers suffer
greatly from excessive post-harvest loss. In addition to the post-harvest loss experienced by
fishers, the government is similarly affected by post-harvest loss through reduction of
fisheries revenue, food insecurity, and unsustainable fisheries resource management. This is
reflected in decline of fisheries sector contribution to GDP as well as to foreign exchange
earnings (Mwambazi 1992).
Reducing post-harvest losses in artisanal fisheries will increase productivity, profitability and
secure access of the dagaa fishery to local and regional markets. In future much needs to be
done in Tanzania to reduce the high percentage of post-harvest losses, in quality and also in
quantity.
The main objective of this study was to propose a cost effective management strategy to
reduce post-harvest loss of the Lake Victoria dagaa fishery in Tanzania. Therefore cost and
benefit analysis of dagaa drying racks, including public implementation cost, was done so as
to determine its feasibility.
From the analysis it was found that the drying racks projects have positive NPV hence they
are worthwhile to be implemented in Tanzania to reduce dagaa post-harvest loss. Also, the
sensitivity analysis indicated that NPV is sensitive and is likely to be affected by changes in
sales price while investment and implementation cost changes were found to have no impact
on NPV.
For the project to be operational, it requires that all stakeholders (government officers,
development practitioners, policy makers and local government leaders, etc.) have a common
understanding on the matter and are involved in the decision making processes regarding loss
reduction.
6.1 Suggestions and recommendation
Detailed implementation plans need to be developed for the proposed project to reduce post-
harvest loss in the Lake Victoria dagaa fishery of Tanzania.
The fisheries development division should implement the use of drying racks to help the
sector in realising the Millennium Development Goals of poverty eradication, food security
and improved health.
Government and development agencies should set a comprehensive post-harvest loss,
intervention fisheries related policy that covers the future development of the fishery.
Post-harvest loss assessments should be incorporated into national data collection systems
and used to inform stakeholders.

Ibengwe
43
UNU-Fisheries Training Programme
Sun drying is weather dependent and most effective during the dry season. There is need to
conduct a comprehensive value-chain analysis for technical innovation for development of
new dagaa products. Use of low processing technologies like fermentation, smoking and deep
frying would play a pivotal role in increasing profit margins for dagaa processors.
The government should revise the regulations of charging a levy per sack instead of per kg
and the arrangement of charging transport cost by using sacks as units. The two arrangements
tempt traders to over-pack the dagaa into large sacks and in the process they increase sizes of
dagaa fragments which affect dagaa quality.

Ibengwe
44
UNU-Fisheries Training Programme
ACKNOWLEDGEMENTS
I express my gratitude to my supervisor, Prof. Daði Már Kristófersson of the University of
Iceland, for his excellent technical and professional guidance and comments during the time
of developing and writing this report.
My special thanks to the UNU-FTP management team - to Tumi Tomasson, Director, and
Thor Asgeirsson, Deputy Director - for strengthening my professional ability, support and
guidance while developing this work;, to Konrad Thorisson for having recommended me to
join in this programme, resulting from the interview he conducted among the candidates
during his visit to Tanzania in 2009; to Sigridur Ingvarsdottir for the administrative and
sisterly role she provided during the course of the program.
I am also grateful to the board of the UNU-FTP and the United Nations University for
offering me the opportunity to participate in this course and funding my studies.
My appreciation goes to H. G. Mbilinyi, Director of Fisheries Development Division,
Tanzania for allowing me to attend this very important training programme on fisheries
policy and planning in Iceland and to Fatma A. Sobo, Assistant Director of Fisheries
Resource Development, Tanzania for her never-ending love and moral support.
I thank my fellow UNU-FTP 2010 fellows for enabling me to appreciate the world‘s cultural
diversity through our interaction, and my colleagues from the Department of Fisheries
Development Division (Statistics section) for sending me key information without which I
wouldn’t have been able to finish this work.
Lastly, I would like to extend my thanks to my family, for their patience and endurance
during my absence from home. I thank you all and God bless you.

Ibengwe
45
UNU-Fisheries Training Programme
LIST OF REFERENCES
Abdallah, A. M. 2004. Management of the commercial prawn fishery in Tanzania. Final
Project submitted for the United Nations University – Fisheries Training Programme.
Abila, R. O. 2003. Fish trade and food security; Are they reconcilable in Lake Victoria? FAO
Fisheries Report 708:128-152 Casablanca, Morocco.
Akande, G. and Diei-Ouadi, Y. 2010. Post-harvest losses in small-scale fisheries: case
studies in five sub-Saharan African countries. FAO Fisheries and Aquaculture Technical
Paper, Rome 550: 72.
Ansen, R. W. and Diei-Ouadi, Y. 2008, Addressing Post-Harvest Losses in Artisanal
Fisheries: Paper presented at the Second Workshop on Fish Technology, Utilization and
Quality Assurance in Africa, Agadir, Morocco, 24–28 November 2008.
Bayona, J.D.R. 2006. Rastrineobola argentea.In IUCN Red List of Threatened
Species.[October 22, 2010]. Version 2010.4.<www.iucnredlist.org>
Boardman, A.E., Greenberg, D. H., Vining, A. R. and David L. 2006. “Cost and Benefit
Analysis Concept and Practice” 3rd Ed. Weimer Pearson Prentice Hall, Upper Saddle River
New Jersey 07458, ISBN 0-13-143583-3.Central Intelligence Agency (CIA).The World
Factbook. 2010. Tanzania. [December 8, 2010] <www.cia.govt>
Cowx I. G., Rollins, D. and Tumwebaze R. 2008. Effect of Ligula intestinalis on the
reproductive capacity of Rastrineobola argentea in Lake Victoria. Journal of Fish Biology 73:
2249–2260.
Chambers, R.1983. Rural Development — Putting The Last First. Essex, England:
Longmans Scientific and Technical Publishers; New York: John Wiley.
Esser, J. 1991. Remedial measures to reduce fish post-harvest losses. Journal of
International Seafood.September issue, 105-109.
FAO 1998a. The code of conduct for responsible fisheries: the requirement for structural
change and adjustment in the fisheries sector.
FAO 1998b. Fish Utilization and Marketing Service.Responsible fish utilization.FAO
Technical Guidelines for Responsible Fisheries.Rome 7: 33.
FAO.1998c. Report and Proceedings of the Sixth FAO Expert Consultation on Fish
Technology in Africa. Kisumu, Kenya, 1996. 574: 269
FAO 2006. Rastrineobola argentea.
http://www.fishbase.us/country/CountrySpeciesSummary.php?id=281&c_code=800 -
FAO 2007a. Increasing the contribution of small-scale fisheries to poverty alleviation and
food Security. Rome: FAO Technical Guidelines for Responsible Fisheries 10: 79.

Ibengwe
46
UNU-Fisheries Training Programme
FAO 2007b. Fishery Country Profile.National Fishery Sector Overview. The United
Republic of Tanzania FID/CP/URT Dec. 2007.
FAO 2008. Regional Post-harvest loss assessment programme in Africa: LT Country reports.
Fegan, B.1994. A Rapid Socio Economic Assessment of the salted-dried Fish industry in
Indonesia and its Implications for demand and Design of improved drying technology, in Fish
Drying in Indonesia, ACIAAR Proceedings No.59.
Fisheries Development Division (FDD 2009), Annual fisheries statistics report, Ministry of
Livestock and Fisheries Development
James, D.G. 1986. The prospects for fish for the malnourished.Journal of Food Nutrition.
12:20-30.
Kabahenda, M.K. and Hüsken, S.M.C. 2009. A review of low-value fish products marketed
in the Lake Victoria region:Regional Programme Fisheries and HIV/AIDS in Africa,
Investing in Sustainable Solutions, the World Fish Center Project Report.
Kabahenda, M.K., Omony, P. and Hüsken, S.M.C. 2009. Post-harvest handling of low-value
fish products and threats to nutritional quality: A review of practices in the Lake Victoria
region. Regional Programme Fisheries and HIV/AIDS in Africa, the World Fish Centre
Project Report.
Kazungu, C. C., Muhoozi, L. Njiru, J. M. and Ngugi J. G. 2008. An overview of the current
status of Lake Victoria fishery: Opportunities, challenges and management strategies Article
first published online 22 Jan 2008.
Kirema-Mukasa, C. T. and J. E. Reynolds. 1991. Marketing and consumption of fish in
Uganda. In FAO,Fisheries and Aquaculture Department, Project ReportsUganda.p 82.
Lake Victoria Fisheries Organization (LVFO) 2004. Characteristics of the Lake Victoria
Fishery based on Frame survey’s 2000 and 2002: With Recommendations for Development
and Management of fishery, Regional working group on Frame surveys 5th – 8th April 2004,
Kisumu, Kenya.
Manyala, J. O. and Ojuok J. E. 2007. Survival of the Lake Victoria Rastrineobola argentea in
a rapidly changing environment: Biotic and abiotic interactions. Aquatic Ecosystem Health &
Management 10:407–415.
Masette, M. 2005. Low-Cost Processing technologies for Mukene (Rastrineobola argentea)
Report and papers presented at the FAO workshop on fish technology, utilization and Quality
assurance Bagamoyo, United Republic of Tanzania, 14–18 November 2005.FAO Fisheries
Report No. 819.

Ibengwe
47
UNU-Fisheries Training Programme
Mgawe, I.Y. and Mondoka, E. M. 2008. Post-Harvest Fish Loss Assessment on Lake
Victoria Sardine Fishery in Tanzania – Rastrineobola Argentea: Report Presented at the FAO
Second Workshop On Fish Technology, Utilization and Quality Assurance in Africa Agadir,
Morocco, 24–28 November 2008.
MNRT. 1997. National Fisheries Sector Policy and Strategy Statement, Dar-Es-Salaam,
Tanzania. Ministry of Natural Resources and Tourism.
Morrisey, M.T. 1998. Post-harvest fish losses.Proceedings of an International workshop held
at the University of Rhodes Island. Kingston, Rhodes Island ICMRD.
Mwambazi, V.C.1992. Post-Harvest Fish Technology in Zambia.FAO Technical paper
presented at the Proceedings of the symposium on post-harvest fish technology Kenya.
[November 26, 2010]. <http://www.fao.org/docrep/005/t0606b/t0606b00.htm.>
NEPAD. 2005. The New Partnership for Africa’s Development.Fish for All Summit. August
2005, Abuja, Nigeria.
Ogutu-Ohwayo, R. 1990. The reduction in fish species diversity in Lakes Victoria and Kyoga
(East Africa) following human exploitation and introduction of non-native fishes. Journal of
Fish Biology. 37 (Suppl. A):207-208.
Poulter, G.R., Ames, G.R., and Evans, N.J. 1988. Post-harvest losses in traditionally
processed fish products in less developed countries. In Postharvest Fishery Losses
Proceedings of an International Workshop held at the University of Rhode Island.Kingston,
Rhode Island ICMRD.
Robert, A. C. and Ward, A.R 1997. A model for evaluating interventions designed to reduce
Post-harvest fish losses. Elsevier Fisheries Research 35: 219-227.
Sobo, A. F. 2006. Overview of Fisheries and Aquaculture Resources Tanzania. Paper
Presented at the “Workshop on Fisheries and Aquaculture in Southern Africa: Development
and Management” Windhoek, Namibia.
Tanzania Government report, Ministry of Livestock Development and Fisheries. Tanzania
country profile. [December 2, 2010]. <http://www.tanzania.go.tz>
URT 1997. The United Republic of Tanzania, Ministry of Natural Resource and Tourism,
National Fisheries Sector Policy and Strategic Statement of 1997.
URT. 2002. Population and Housing Census: The United Republic of Tanzania. National
Bureau of Statistics. [http://www.Tanzania.go.tz/census/regions.tm] Visited on 14th April
2005.
Wandera, S.B.1992. Seasonal abundance, vertical migration of the fishery of dagaa
(Rastrineobola argentea) in the Ugandan waters of Lake Victoria. Papers presented at the
Symposium on Biology, Stock Assessment and Exploitationof Small Pelagic Fish Species in
the African Great Lakes Region.p. 270.
Ibengwe
48
UNU-Fisheries Training Programme
Wanink, J.H. 1988. Ecology and fishery biology of Rastrineobola argentea(Pellegrin).
HEST/TAFIRI Rep.51, 25 p. Leiden, The Netherlands.
Ward A.R and Jeffries, D.J. 2000. A manual for assessing Post-harvest loss.Natural
Resources Institute,University of Greenwich, Central AÍenue, Chatham Maritime, Kent ME4
4TB, U.K.Vii + 1400pp.English.
Ward, A. R. 1998. Field based fish loss assessment methodologies. In a Report and
proceedings of the sixth FAO Expert workshop.

Ibengwe
49
UNU-Fisheries Training Programme
APPENDICES
Post-harvest loss assessment of dagaa dried on ground and that dried on racks
Appendix 1: Estimated post-harvest loss of dagaa dried on ground (private) weight (kg) and
price in USD
Appendix 2: Anticipated (private) post-harvest loss reduction after using drying racks
REASONS FOR LOSS Total catch (Tons) /fisher/year Output % after drying Expected price in USD /(Kg)
Estimated dagaa landing/fisher 51 100 35
Best Price 1.7
Reduced Price for low quality 1
Types of loss
i).Physical loss Total annual % loss Fresh wt.(kg) Dry wt. (kg)Equivalent Loss (USD.)
Physical damage during fishing 0.9 459 161 273
Animal predation 2 1,020 357 607
Discarded after prolonged rain (nyambore) 4 2,040 714 1,214
Theft 0.1 51 18 30
Sinking sacks during transportation 0.7 357 125 212
ii).Quality loss
Presence of by-catch 2.5 1,275 446 446
Quality degradation through rain 11 5,610 1,964 1,964
Change in colour before being sold 30 15,300 5,355 5,355
Fragments/ drying grass (chekencha) 8 4,080 1,428 1,428
Total 59.2 30,192 10,567 11,529
REASONS FOR LOSS Total catch(Tons.)/fisher/year Output % after drying Expected price in USD/ (Kg)
Estimated catch (kg)/fisher 51 100 35
Best Price 2.7
Reduced Price for low quality 1
Types of loss % Reduction of post harvest loss
i).Physical loss Total annual % loss Fresh wt.(kg) Dry wt.(kg) Equivalent Loss in USD
Physical damage during fishing 1 459 161 434
Animal predation 1 510 179 482
Discarded after prolonged rain (nyambore) 2 1,020 357 964
Theft 0 26 9 24
Sinking sacks during transportation 1 357 125 337
ii).Quality loss
Presence of by-catch 2 765 268 268
Quality degradation through rain 6 2,805 982 982
Change in colour before being sold 14 7,140 2,499 2,499
Fragments/ drying grass (chekencha) 4 2,040 714 714
Total 30 15,122 5,293 6,704

Ibengwe
50
UNU-Fisheries Training Programme
Appendix 3: Post harvest loss of dagaa dried on ground in a pilot district (500 fishers) project
(Government/public)
Appendix 4: Anticipated post-harvest loss reduction after using drying racks in a pilot district
(500 fishers) (Government/public)
REASONS FOR LOSS Total catch(Tons.)/500 fisher/year Fresh wt.(Tons.) Dry wt. (Tons) Equivalent % Expected price in USD/ (Tons)
Estimated catch (Tons)/500 fisher/year 25,500 100 35
Best Price 1.7
Reduced Price for low quality 1
i) Physical losses Loss in 000' USD
Physical damage during fishing 0.9 2,295 803 1,366
Animal predation 2 5,100 1,785 3,035
Discarded after prolonged rain 4 10,200 3,570 6,069
Theft 0.1 255 89 152
Sinking sacks during transportation 0.7 1,785 1,062
ii).Quality losses - -
Presence of by-catch 2.5 6,375 2,231 2,231
Quality degradation through rain 11 28,050 9,818 9,818
Change in colour before being sold 30 76,500 26,775 26,775
Fragments/ drying grass 8 20,400 7,140 7,140
Total 59 150,960 52,836 57,647
REASONS FOR LOSS Total catch(kg)/500 fisher/year Fresh wt.(Tons.) Output after % drying Expected price in USD/ (Kg)
Total catch(kg)/500 fisher/year 25,500 100 35
Best Price 2.7
Reduced Price for low quality 1
i).Physical losses Total annual % of loss Dry wt.(kg) Equivalent Loss in 000' USD
Physical damage during fishing 1 2,295 803 2,169
Animal predation 1 2,550 893 2,410
Discarded after prolonged rain 2 5,100 1,785 4,820
Theft 0 128 45 120
Sinking sacks during transportation 1 1,785 625 1,687
ii).Quality losses
Presence of by-catch 2 3,825 1,339 1,339
Quality degradation through rain 6 14,025 4,909 4,909
Change in colour before being sold 14 35,700 12,495 12,495
Fragments/ drying grass 4 10,200 3,570 3,570
Total 30 75,608 26,463 33,518

Ibengwe
51
UNU-Fisheries Training Programme
Cost-benefit analysis for the drying on racks.
Appendix 5: Drying racks public project in a pilot district (500 fishers) cost and benefit
analysis for ten years.
Sensitivity analysis
Appendix 6: Sensitivity analysis table of drying racks (public) project (NPV) under different
assumptions of investment cost, price and quantity of catch
Drying on racks public project
COST/USD 1 2 3 4 5 6 7 8 9 10
Investment cost for 1500 racks 4,900 7,400 11,100 14,800 18,500 22,200 25,900 29,600 33,300 37,000
Capital cost for 1500 racks 843 1,273 1,909 2,546 3,182 3,818 4,455 5,091 5,728 6,364
Implementation cost 636,225 12,000 12,000 12,000 12,000 12,000 12,000 12,000 12,000 12,000
Total cost 641,968 20,673 25,009 29,346 33,682 38,018 42,355 46,691 51,028 55,364
BENEFIT/ USD
Benefit using drying on racks 73,475 146,950 220,425 293,900 367,375 440,850 514,325 587,800 661,275 734,750
Benefit drying on ground 49,630 99,260 148,890 198,521 248,151 297,781 347,411 397,041 446,671 496,301
Taxes 10,984 21,967 32,951 43,934 54,918 65,901 76,885 87,868 98,852 109,835
Total Benefits 34,828 69,657 104,485 139,314 174,142 208,970 243,799 278,627 313,456 348,284
Net Benefit -607,139 48,984 79,476 109,968 140,460 170,952 201,444 231,936 262,428 292,920
Present Value -518,037 35,661 49,369 58,285 63,521 65,964 66,323 65,155 62,902 59,906
NPV 9,049
YEAR
NPV 460
% changes Investment cost % changes Quantity of catches % changes Sales price
-50% 509 -50% 110 -50% -1,355
-40% 499 -40% 180 -40% -992
-30% 489 -30% 250 -30% -629
-20% 479 -20% 320 -20% -266
-10% 469 -10% 390 -10% 97
0% 460 0% 460 0% 460
10% 450 10% 530 10% 822
20% 440 20% 600 20% 1,185
30% 430 30% 670 30% 1,548
40% 420 40% 739 40% 1,911
50% 411 50% 809 50% 2,274

Ibengwe
52
UNU-Fisheries Training Programme
Appendix 7: Sensitivity analysis table of drying racks (public) project (NPV) under different
assumptions of investment cost, implementation cost, price and quantity of catch
NPV 9,049
% changes Investment cost % changes Quantity of catches % changes Implementation cost % changes Sales price
-50% 11,139 -50% 332,681- -50% 280,476 -50% 549,913-
-40% 10,721 -40% 264,335- -40% 226,190 -40% 438,121-
-30% 10,303 -30% 195,989- -30% 171,905 -30% 326,329-
-20% 9,885 -20% 127,643- -20% 117,620 -20% 214,536-
-10% 9,467 -10% 59,297- -10% 63,334 -10% 102,744-
0% 9,049 0% 9,049 0% 9,049 0% 9,049
10% 8,631 10% 77,395 10% 45,237- 10% 120,841
20% 8,213 20% 145,740 20% 99,522- 20% 232,634
30% 7,794 30% 214,086 30% 153,808- 30% 344,426
40% 7,376 40% 282,432 40% 208,093- 40% 456,218
50% 6,958 50% 350,778 50% 262,378- 50% 568,011