reducing medical cost trend in aco/aqc … environments: an innovative approach to physician...
TRANSCRIPT

Reducing Medical Cost Trend in ACO/AQC Environments: An Innovative Approach to Physician Engagement
AMGA 2013 Annual Conference March 15, 2013 Sandhya Rao, MD Megan Renfrew, MA
2
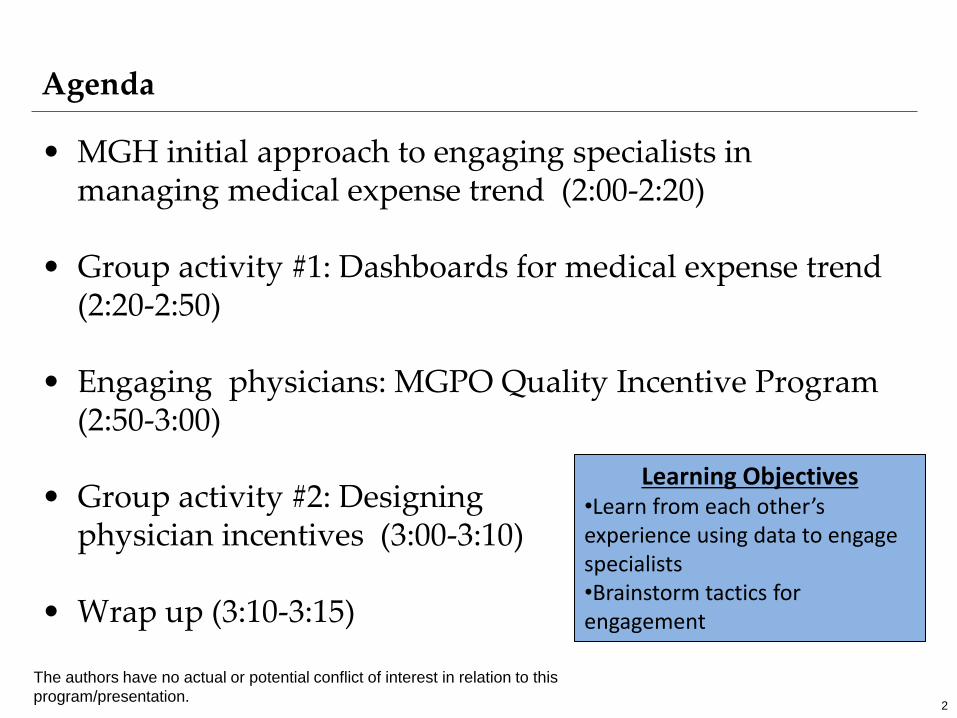
Agenda
• MGH initial approach to engaging specialists in managing medical expense trend (2:00-2:20)
• Group activity #1: Dashboards for medical expense trend (2:20-2:50)
• Engaging physicians: MGPO Quality Incentive Program (2:50-3:00)
• Group activity #2: Designing physician incentives (3:00-3:10)
• Wrap up (3:10-3:15)
Learning Objectives •Learn from each other’s experience using data to engage specialists •Brainstorm tactics for engagement
The authors have no actual or potential conflict of interest in relation to this
program/presentation.

3
Contain rates through
regulation
Implement payment reform
Turn patients into consumers
There are three ways society is combating rising costs
ACO AQC

4
What we’re facing…
• Constraining the growth of healthcare costs is a national priority – Involvement of physicians through changed incentives is unavoidable – PPACA includes several new payment mechanisms – the imperative will
persist even if the specifics change • The market is using the same play book – closed networks, budget-based
risk, cost sharing, restriction of choice – and this may generate the same backlash as 1990s managed care era
• But...
– The economy is much worse – Government is more proactive – Rate of change is slower (caps on increases, not cuts)
• And we have…
– Better health IT and data for population management – Strategies and tactics that we know will improve care and reduce costs
• Providers will need a playbook that will be successful under any of the new
payment models

5
What we’re facing… • The focus should be on reducing medical expense trend to as close to the
rate of general inflation as we can • This means taking risk and changing care models
– Shared savings (Pioneer ACO) – Bundled payments – Global payments (AQC/capitation) – Care redesign
• Challenges
– How to make the external incentives internal in a meaningful way, within a complex organization
– At the right pace • Moving too fast will lose the docs in the rush to implement – MDs
attitude often creates the patient’s attitude (managed care backlash) • Moving too slow will mean not succeeding under the contracts and
worsening the regulatory environment

Why Partners/MGH is aggressively pursuing global payment/population management
• Leadership opportunity to bend cost curve
• Efforts to reduce health care spending not going away – Government and private sector being proactive
• Lesser of two evils – Continued fee-for-service with endless rate cuts – Global payments care redesign, which decreased
utilization, which (1) shared savings and (2) backfill opportunity
• Partners increased ability to care for populations of patients – Universally adopted EHR – Successful CMS Demo
6

7
We are at the center of the conversation
“…the organization could better coordinate care at Beth Israel
Deaconess, partly because the hospital has agreed to send patients
back to their primary care doctor or a specialist at Harvard Vanguard
after their inpatient stay, rather than keep them in the more expensive
hospital system…”
“…About half of Atrius patients are covered by a global
payment…”
Boston Globe, 2/25/10
Referring Physicians
“We hope this is the beginning of a movement in
Massachusetts in which health plans, hospitals, and
physicians work together on a shared agenda to
improve care and lower costs,“
Andrew Dreyfus, Blue Cross, on the importance of AQC
Payers
“…points to the market
clout of the best-paid
providers as a main
driver of the state’s
spiraling health care
costs…” AG Investigation of Health
Care Cost Trends and
Drivers, January, 2010
Attorney General
“The Special Commission
concludes that global payment
models….should serve as the
direction for payment
reform….implemented over a
period of five years…..” -Commission Report
Payment Reform Commission
“Massachusetts General Hospital and Brigham
and Women’s Hospital typically…[are] paid
15 percent to 60 percent more for
essentially the same work as other
hospitals, even though the quality is not
superior….” Boston Globe Spotlight Series, 2008
Media

8
Partners entered new contracts with our two biggest payers on January 1, 2012
Alternative Quality Contract (AQC)
Blue Cross Blue Shield
Accountable Care Organization (ACO)
Medicare Shared Savings
Population Commercially-insured patients who receive primary care at Partners
Medicare patients with most of their care at Partners
Quality Measures
DM, CVE, HTN, Depression, Cancer Screening, Bronchitis, Patient Experience
DM, CVE, HTN, CHF, Preventative Care, Care Coordination, Patient Experience
Medical Expense Trend
1% less than non-PCHI in cost per member per month from baseline
1% less than comparison group in cost per member per month from baseline

9
Chiefs Leadership Incentive on Trend • Goal
– Departments produced a written plan for achieving trend goals, relevant to their specialties
– Specialists understand contribution to spending trends and key drivers
• Process
– Developed utilization and costs reports for at risk population to help inform divisions on high spend areas and guide possible areas of clinical opportunity
– From June – Sept 2012, we met with Chiefs and senior administrators from 23 departments total :
• Provided limited data on utilization and costs for select resource areas • Engaged in a focused discussion on clinical opportunities to reduce
overall costs of care while maintaining quality
– Chiefs receive $$ bonus for turning in trend plan

Priority areas – trend reduction
10

11
Specialty trend matrix
Excluded: hospital practice costs (only professional fees included) labs, radiology, ED
Inpt Serv Med Pharm Pharm Visits Amb Proc Diag Serv Pathology Immun
Anesthesia $3,209,317 $88 $6,043 $23,629 $2,205,448 $83
Dermatology $5,491 $22,453 $460,282 $1,542,989 $1,907,301 $59,397
Emergency Services $176,848 $937 $1,852 $263,118 $715
Mass Eye and Ear $37,201 $129,156 $297,349 $1,942,278 $1,347,248 $51,513 $151 $14
Medicine - Allergy Immunology $12,881 $267,299 $382,507 $433,483 $330,106 $43,463 $423
Medicine - Cardiology $531,910 $1,707 $527,760 $935,742 $142,687 $570,732 $31
Medicine - Clin Ed/HospMed/AHS $119,949 $4 $13,782 $61,604 $6,868 $922 $625
Medicine - Endocrine Division $41,870 $7,107 $565,292 $578,953 $76,762 $192 $4,381
Medicine - Gastroenterology $130,026 $1 $652,064 $616,113 $2,229,288 $7,500 $170 $1,410
Medicine - Hematology Oncology $182,634 $580,109 $42,279 $780 $41 $1,018
Medicine - Infectious Disease $90,419 $164 $137,192 $169,207 $4,121 $122 $224,968
Medicine - McLean Hospital $12,141 $18,985 $11,437 $90 $348
Medicine - Nephrology Division $138,624 $76,190 $351,608 $351,721 $64,020 $23,032 $9,946 $6,794
Medicine - Palliative Care $27,739 $660 $1,628
Medicine - Pulm & Critical Care $150,024 $266,383 $103,608 $13,171 $121,671 $190
Medicine - Rheumatology $9,853 $63 $479,318 $19,034 $1,136
Neurology Service $155,481 $581 $719,824 $460,661 $16,617 $336,691 $1,517 $15
Neurosurgery Service $278,651 $635 $78,784 $45,691 $45
OB GYN Service $2,121,624 $165,345 $553,652 $1,157,284 $566,022 $54,151 $19,943
Oral and Maxillofacial Surgery $202 $3,488 $78,931 $178,552 $52
Orthopaedic Surgery $631,381 $5,039 $54,228 $1,119,975 $1,468,782
Pathology $275,789 $26,880 $11,406 $65 $1,336,692 $84
Pediatrics $576,218 $123,663 $919,388 $4,333,317 $137,801 $134,427 $293,307
Physical Medicine & Rehab $104,564 $1,199 $40,164 $501,816 $207,746 $28,025
Primary Care $333,627 $10,475 $7,324,900 $7,917,843 $71,532 $108,835 $204,065
Psychiatry $42,329 $1,276,722 $1,232,121 $20,428 $137,234
Radiation Oncology $5,267 $3,184 $436,988 $222,540
Radiology Service $348,049 $938 $29,458 $379,136 $18,876
Surgery Service $1,346,803 $4,515 $73,328 $535,579 $1,455,422 $17,017
Urology Service $98,077 $2,739 $143,285 $422,684 $364,512 $51,201
Above average medical spend compared with all Department/Resource Area combinations
Below average medical spend compared with all Department/Resource Area combinations
Inpt Serv Med Pharm Pharm Visits Amb Proc Diag Serv Pathology Immun
Anesthesia $3,209,317 $88 $6,043 $23,629 $2,205,448 $83
Dermatology $5,491 $22,453 $460,282 $1,542,989 $1,907,301 $59,397
Emergency Services $176,848 $937 $1,852 $263,118 $715
Mass Eye and Ear $37,201 $129,156 $297,349 $1,942,278 $1,347,248 $51,513 $151 $14
Medicine - Allergy Immunology $12,881 $267,299 $382,507 $433,483 $330,106 $43,463 $423
Medicine - Cardiology $531,910 $1,707 $527,760 $935,742 $142,687 $570,732 $31
Medicine - Clin Ed/HospMed/AHS $119,949 $4 $13,782 $61,604 $6,868 $922 $625
Medicine - Endocrine Division $41,870 $7,107 $565,292 $578,953 $76,762 $192 $4,381
Medicine - Gastroenterology $130,026 $1 $652,064 $616,113 $2,229,288 $7,500 $170 $1,410
Medicine - Hematology Oncology $182,634 $580,109 $42,279 $780 $41 $1,018
Medicine - Infectious Disease $90,419 $164 $137,192 $169,207 $4,121 $122 $224,968
Medicine - McLean Hospital $12,141 $18,985 $11,437 $90 $348
Medicine - Nephrology Division $138,624 $76,190 $351,608 $351,721 $64,020 $23,032 $9,946 $6,794
Medicine - Palliative Care $27,739 $660 $1,628
Medicine - Pulm & Critical Care $150,024 $266,383 $103,608 $13,171 $121,671 $190
Medicine - Rheumatology $9,853 $63 $479,318 $19,034 $1,136
Neurology Service $155,481 $581 $719,824 $460,661 $16,617 $336,691 $1,517 $15
Neurosurgery Service $278,651 $635 $78,784 $45,691 $45
OB GYN Service $2,121,624 $165,345 $553,652 $1,157,284 $566,022 $54,151 $19,943
Oral and Maxillofacial Surgery $202 $3,488 $78,931 $178,552 $52
Orthopaedic Surgery $631,381 $5,039 $54,228 $1,119,975 $1,468,782
Pathology $275,789 $26,880 $11,406 $65 $1,336,692 $84
Pediatrics $576,218 $123,663 $919,388 $4,333,317 $137,801 $134,427 $293,307
Physical Medicine & Rehab $104,564 $1,199 $40,164 $501,816 $207,746 $28,025
Primary Care $333,627 $10,475 $7,324,900 $7,917,843 $71,532 $108,835 $204,065
Psychiatry $42,329 $1,276,722 $1,232,121 $20,428 $137,234
Radiation Oncology $5,267 $3,184 $436,988 $222,540
Radiology Service $348,049 $938 $29,458 $379,136 $18,876
Surgery Service $1,346,803 $4,515 $73,328 $535,579 $1,455,422 $17,017
Urology Service $98,077 $2,739 $143,285 $422,684 $364,512 $51,201
For illustrative purposes

12 12
MD Name MD Bucket
Rao Primary Care
Weilburg Psychiatry
Weil Primary Care
BCBS MemID MGH MRN Eligible Start Eligible End
1235290 0000001 1/15/11 12/15/11
5903720 0000002 3/15/11 12/15/11
4730434 0000003 1/15/11 7/15/11
BCBS
MemID
MGH MRN Eligible Start Eligible End Type Procedure Name Resource Area Date of
Service
Allowed
Amount
MD Name MD Bucket
1235290 0000001 1/15/11 12/15/11 IP Subsequent Hospital Care Inpatient Services 4/1/11 $150 Rao Primary Care
1235290 0000001 1/15/11 12/15/11 OP Office/Outpatient Visit Visits 2/7/11 $230 Weilburg Psychiatry
5903720 0000002 3/15/11 12/15/11 OP Emergency Dept Visit ED Visits 7/30/11 $160 Weil Primary Care
4730434 0000003 1/15/11 7/15/11 OP Flu Vaccine, 3 Yrs & > Immunizations 1/9/11 $15 Rao Primary Care
Resource Area
QI Bucket Inpatient Services Visits ED Visits Immunizations Ambulatory Procedures . . .
Primary Care $ X $ Y $ Z
Psychiatry
.
.
.
.
.
.
BCBS Members with an MGH PCP MGH Providers eligible for QI Program
PCHI Data Warehouse -Medical Table -Pharmacy Table
Internal Sources -Radiology -Labs
Records must meet MGH MRN and MGH Provider criteria for analysis
Costs, Utilization and PMPM are summarized by QI Bucket and Resource Area
.
.
.
QI Bucket
Resource Areas defined by trend team
Methodological approach

13
Data on utilization and costs
“Would be great to see variation by
physician by condition.”
“Can I see this by condition?”
“Looks like only way to save $ is to
not operate.”

14
<0.0001
<0.0001
Imaging variation report example
2011 Loyalty Cohort, Outpatient CT/MR/Nuc Imaging Performed in 2011. Observed / Expected With Hierarchical Provider Intercept, p-value Delivered Via IPORT And Email

15
Reports requested: Data by episode and department
Current Data
What Depts Want
Potential Targets

16
Discussion questions
We asked each group to respond to the following questions: 1. Identify patient populations or episodes in which you believe
there are opportunities to reduce overall costs of care without affecting quality or patient experience?
2. Across populations, specific resource areas where you think there is over is overuse or misuse?
3. For those populations or resource areas, what tactics should be deployed to improve efficiency? Which tactics can be employed internally within your department or collaboratively with other departments? (Short or long intervals?)
4. What do you need to move forward with these tactics?

17
Breakout Session #1- Dashboards for medical expense trend
• Instructions: • Break into small groups and discuss how you would develop
and implement a similar cost and utilization report at your institution.
• The handout will provide guidance and focused questions to consider.
• Identify a team member to report back to the group a brief summary of your approach, methods, anticipated challenges.

18
Original plan vs actual implementation
Original Plan What Actually Happened
Show data on cost and utilization for all resource areas for past 2 yrs with trend goals
•Data not great – unexpected limitations •Data wasn’t a driver for planning/unable to produce specific trend reduction goals across all departments
Identify opportunities to reduce cost standardized medical expense, based on priorities identified in data
1) Many groups didn’t need data to generate ideas
2) Many interested in collaboration with other groups
3) Desire for condition/population specific data
Create QI Measure to address 2% reduction in CSME
•Most interventions at system level not MD level •Not developed enough for QI measure •Insufficient data for fair measurement

19
Department-specific summary for Pathology Current Initiatives -Inpatient lab ordering initiative
-Ambulatory order sets (e.g. celiac screening)
Specific Populations High Risk: Cancer Low Risk: Cervical cancer screening, routine labs
Relevant Resource Areas Labs, biopsies
Variation Report Topics PCP practice variation lab ordering
Potential Tactics: Internal -Ordering of additional stains/studies on biopsies -Improved communication with referring physicians
Potential Tactics: External -Pre-operative testing -Feedback reports to PCPs re: lab ordering and appropriateness -Standard protocol and procedures reflective of clinical guidelines developed for specific conditions (e.g. paps, PSA, HPV, celiac) -Create policy addressing duplicate readings/billings from BWH pathologists;
Potential: QI Measure Appropriateness guidelines
Potential Targets Lab testing variation and spending per patient
Potential Collaborations Primary Care, Surgery, BWH, Derm, GI
Best Practices/Other Areas to Consider
None identified

20
Emergency Department : Chiefs Plan to Reduce Medical Expense Trend

21
Target populations
High Risk Cost Populations Low Risk Cost Populations
•Cancer –GYN –Skin –Pancreatic –Colon -Melanoma -Breast -Lymphoma
•Critical Care •ALS •Diabetes •HTN •COPD •Patients discharged from psych hospital
•Acne •Warts •UTI •Pneumonia •TIA •Acute appendicitis •Normal vaginal delivery •Cervical Cancer screening •Celiac disease screening •General surgery •Hematuria

22
Summary of tactics proposed by department
*Will continue Care Redesign already in progress Medicine includes the number of sub-divisions for each tactic

23
Quality Incentive Program • 1,700 eligible physicians
• Clinically active, non-trainees • In at least 2 major managed care contracts • Grouped into 3 RVU-based tiers • Includes hospital-based and MGPO MDs
• Incentive payments total $6.5 million/year (~1.5%
NPSR) – Started with a bonus check in December 2006 • Since then, 2 terms, 2 incentive payments per
year (July & December) • Max of $5,000 per MD per year • Plan to pay out ~80% of funds each term
• 3 quality measures per term
• 2 are system measures & apply to all docs • 1 is chosen by the clinical department in
consultation with the QI Program • Measurement can be individual, practice group,
department or hospital-wide • ~140 different measures have been used to date
Tier 1 ($500) Tier 2 ($1250) Tier 3 ($2500)
Eligibility Distribution
50-250 250-750 750+
RVUs over 6 months

24
Examples of department measures
Care Effectiveness. • Perioperative antibiotics • ACE/ARB for CHF and AMI patients at discharge • Antibiotics to pneumonia patients • Normothermia in the OR • Inpatient stroke standards • Antibiotics at Cesarean delivery • Complete transition to OPPE • Psychiatric global assessment of functioning
Safety. • MD hand hygiene compliance • E-prescribing • Admission note timeliness • Dating peripheral IVs • Use of patient identifiers • Safety reporting • Surgical handoff policy • Electronic pathology report sign-out
Efficiency. • PCP list review • Reduced “red” rate for ROE orders • Cross cultural training • Deploy anesthesia charting system • Structured problem list
These have applied to entire
departments or smaller groups of
physicians within a department.
Coordination/Continuity of Care. • Pediatric head injury discharge instructions • Required discharge summary elements • EMR/operative note timeliness • Dermatologic pathology report follow-up • Radiology/pathology report timeliness

25
• The Fruit Street Physician newsletter announces measures for the term and performance results
• 20-30 emails are sent each term (to explain and remind MDs) and have a high open rate
• The MGPO website has all program details – MDs can see their own performance and
that of the group
• Each term a personal results letter/email shows performance
You Are Currently Not Meeting the Visit Summary Report Target (PCP) There is still time to improve on the MGPO Quality Incentive (QI) Program, Term 2, 2012, meaningful use preparation measure for primary care physicians (PCPs): Provide a visit summary report (VSR) to patients within three business days for 50% of patients. Based on your July meaningful use dashboard, our records show that you have not yet reached the target of 50 percent. Remember that any staff person in your office can provide the VSR to the patient. Please note, that if you have worked to improve your performance in the last week or so, your efforts will not yet be reflected due to the dashboard data lag. The MGPO will alert physicians by email when the dashboard has been updated. To track your progress, go to the meaningful use dashboard. Clicking on the measure will give you more information on what needs work. For more information about VSRs, click here. For Oncall user information, click here. For additional meaningful use resources and steps to improve your results, click here. For questions, go to the MGPO QI website, or send an email to the QI Program mailbox.
Sample email to low performer Newsletter announces results
at term end
Incentives coupled with clear communication

What are other ways to engage specialists?
26
Goals: Collaboration vs. Accountability Actionable
vs. Results (e.g process vs.
outcome)
Example Individual
Practice Division Dept Hospital
Bonus for process measure
Follow-up discharge calls
Bonus for outcome measure
ED visits /1000
% of compensation on value based process/outcome measure
20% of comp contingent on efficiency measures
Sub cap or bundle payment
Rate per surgery
Capitation/shared savings
AQC
Low Risk
High risk
Goals Individual Accountability

27
Breakout Session #2-Designing physician incentives
• Instructions: • Break into small groups and discuss approaches to engaging
physicians and senior leadership using the following questions: 1. How are you currently structuring incentives for your
specialists?
2. Which approach would you choose? What are advantages/disadvantages?
3. How would you engage physicians and senior leadership? What are some anticipated challenges or barriers? How would you overcome these?
4. Any key learnings from your group?

Wrap up
28
• Key points • Data is important, but not critical if you pursue, data
driven strategy: physician-level condition-specific variation
• Engaging physicians is a journey Awareness Accountability