reducing food waste at iit mandi · pdf filereducing food waste at iit mandi. by: ashish arya...
TRANSCRIPT

Reducing Food Waste at IIT Mandi
By:
Ashish Arya Ryan Cooney Harsh Gupta
Kathryn Merritt Colleen O’Shea Raghav Sethi
Date:
2 May 2017
Report Submitted to: Dr. Viswanath Balakrishnan and Shyamasree Dasgupta
Indian Institute of Technology
Professors Fabio Carrera and Svetlana Nikitina Worcester Polytechnic Institute
This report represents work of WPI undergraduate students performed in collaboration with
IIT Mandi students submitted to the faculty as evidence of a degree requirement. WPI routinely publishes these reports on its web site without editorial or peer review. For more
information about the projects program at WPI, see http://www.wpi.edu/Academics/Projects.

Abstract The goal of our project was to research mess hall food waste at IIT Mandi and provide recommendations to reduce it. To realize this goal, we conducted waste audits on consumer and kitchen waste, and held focus groups with students and staff that eat at IIT’s mess halls. We identified that Southern Indian foods, self serve foods, and vegetarian main courses are wasted most heavily. Our research resulted in the recommendation of assorted methods to reduce food waste, including more food portioning, frequent waste auditing, and greater variety of food options.
1

Executive Summary (Poster)
2

Contents Abstract ......................................................................................................................................................................... 1
Executive Summary (Poster) ............................................................................................................................... 2
1. The Problem of Food Waste ............................................................................................................................ 6
2. Background ............................................................................................................................................................ 7
2.1. The mess halls: Cedar (D1) and Maple (D2) .................................................................................... 7
2.2. Previous waste reduction efforts at IIT Mandi ............................................................................ 10
3. Methodology ....................................................................................................................................................... 11
3.1. Determining the magnitude of food wasted at IIT Mandi ....................................................... 11
3.2. Exploring why food is wasted ............................................................................................................. 13
3.3. Developing methods to reduce food waste ................................................................................... 14
4. Results and Discussion ................................................................................................................................... 15
4.1. Consumer, kitchen leftovers, and kitchen trimming waste are equal ............................... 15
4.2. D1 and D2 experience similar waste patterns ............................................................................. 17
4.3. Dips and vegetarian main courses are wasted most ................................................................. 19
4.4. Monitored segregation reduces food waste .................................................................................. 20
4.5. Portioned foods are wasted less ........................................................................................................ 21
4.6. South Indian breakfast items are wasted more .......................................................................... 23
4.7. Improving the IIT Mandi mess hall system ................................................................................... 24
4.8. Almost one-third of the cost of food is wasted ............................................................................ 25
5. Conclusions and Recommendations ......................................................................................................... 27
5.1. Recommendations for mess managers ........................................................................................... 27
5.2. Recommendations for Mess Committee ......................................................................................... 28
Acknowledgements .............................................................................................................................................. 30
References ................................................................................................................................................................ 31
Appendices ............................................................................................................................................................... 32
Appendix A: Common Waste Reduction Methods .............................................................................. 32
Appendix B: Waste Audit Protocol ............................................................................................................ 33
Appendix C: Tray Counting Device Description ................................................................................... 34
Appendix D: IIT Bombay Case Study ........................................................................................................ 35
3

Appendix E: Focus Group Prompts ........................................................................................................... 36
Appendix F: Interview Questions ............................................................................................................... 37
Appendix G: Recommendations Pamphlet ............................................................................................ 41
4

Figures Figure 1: The two messes at IIT Mandi South Campus, D1 at left, D2 at right ............................... 7 Figure 2: The traffic flow in the D1 mess hall .............................................................................................. 8 Figure 3: The waste disposal area at D2 mess ............................................................................................. 9 Figure 4: Buckets for post-consumer food waste segregation .......................................................... 11 Figure 5: Sensor mechanism over tray disposal slot at D1 (on left), additional electronics and LCD screen for tray counter (on right) ................................................................................................ 12 Figure 6: The prototype that measures the weight of an individual’s food waste .................... 13 Figure 7: Contribution of different waste types to total waste ......................................................... 15 Figure 8: Cucumber and carrot trimmings from D1 mess, including some relatively large chunks of avoidable waste................................................................................................................................. 15 Figure 9: Attendance over one week in D2 mess ..................................................................................... 16 Figure 10: Avoidable breakfast waste in D2 mess .................................................................................. 17 Figure 11: Comparison of waste in D1 and D2 messes ......................................................................... 17 Figure 12: Roti waste at lunch per person in D1 and D2 mess .......................................................... 18 Figure 13: Avoidable and potentially avoidable waste of different food groups, per consumer, per item ............................................................................................................................................... 19 Figure 14: Segregated and unsegregated waste in D2 mess over the course of one week ... 20 Figure 15: Avoidable consumer waste in D2 mess for self serve and portioned items .......... 21 Figure 16: Avoidable leftover waste in D2 mess for self serve and portioned items .............. 22 Figure 17: Picture of the line in D1 during snack time on Monday, April 11 .............................. 22 Figure 18: Waste based on food region at D2 mess ............................................................................... 23 Figure 19: A SWOT analysis of the Mess systems on the IIT Mandi campus ............................... 24 Figure 20: Cost of daily consumer and leftover waste in D1 and D2 mess .................................. 25 Figure 21: Total cost per week of different types of food. The total cost accounts for both consumer and leftovers waste in both messes ......................................................................................... 26
5

1. The Problem of Food Waste Food waste is a global concern that impacts sustainability and world hunger. Annually,
the world wastes 1.3 billion metric tons of edible food, almost one third of the total food produced (“Save Food: Global Initiative on Food Loss and Waste Reduction”, 2017). The food wasted could feed 3.48 billion people, easily more than enough for the 795 million hungry individuals in the world (“Hunger Statistics”, 2017). As this food decays in landfills it emits greenhouse gases equivalent to 3.3 billion metric tons of carbon dioxide into the earth’s atmosphere (“Food Wastage Footprint: Impacts on Natural Resources”, 2013).
India produces an annual 105 million metric tons of food waste, which is nearly 40% of its total food production, at a cost of 8.3 billion dollars (Biswas, 2014). That amount of money equates to 4% of India’s gross domestic product (GDP). Even though India produces more than enough food to feed its own population, 15%, or 195 million people, are undernourished (“2016 Global Hunger Index”, 2016).
The mess halls at the Indian Institute of Technology Mandi (IIT Mandi) have excessive food waste production. Previous studies at IIT Mandi have determined that the messes waste on average over 225 kg of food each day, which is enough to feed over 180 people. Food waste leads to financial loss, has a negative impact on the local and global environment, and is contrary to the university’s mission of educating students about sustainability.
The mission of this project was to research mess hall food waste at IIT Mandi and provide recommendations to reduce food waste. To achieve our overarching goal, we completed a study focusing on all points of the process of food preparation and consumption at IIT Mandi. We determined the magnitude of food wasted at each point, as well as the systematic and human causes of food waste. Based on our data and understanding of food waste at IIT Mandi, we developed and proposed specific methods to reduce food waste.
6
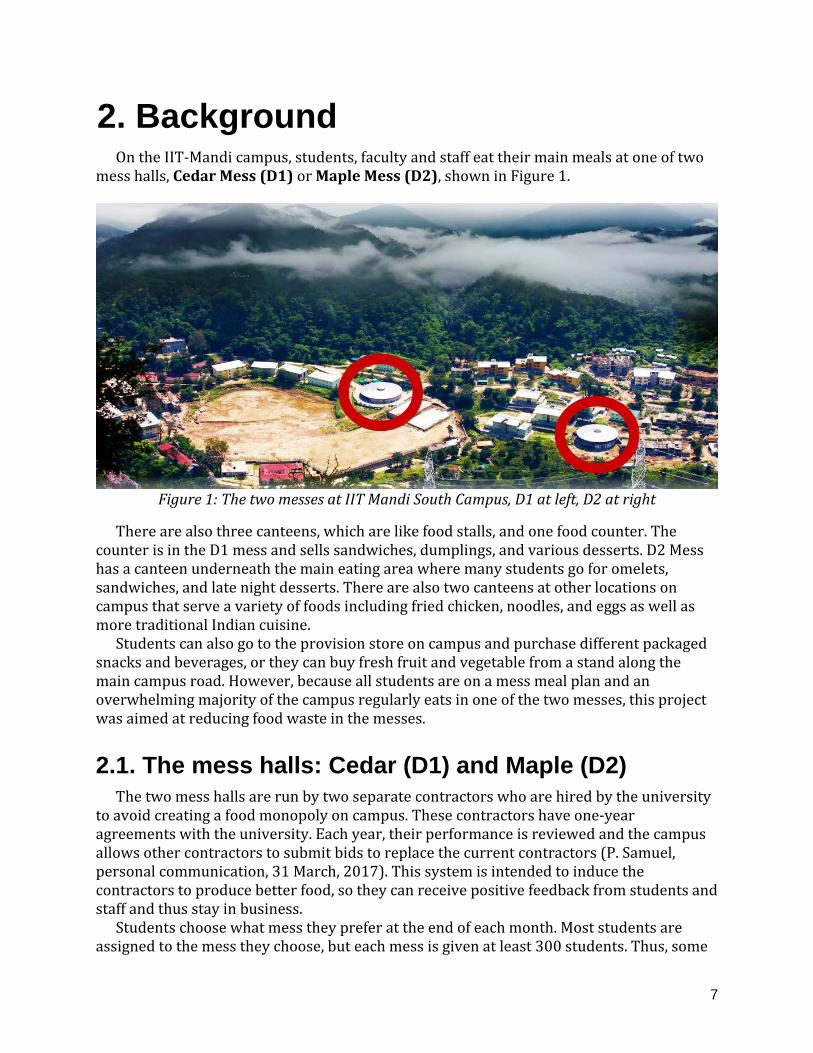
2. Background On the IIT-Mandi campus, students, faculty and staff eat their main meals at one of two
mess halls, Cedar Mess (D1) or Maple Mess (D2), shown in Figure 1.
Figure 1: The two messes at IIT Mandi South Campus, D1 at left, D2 at right
There are also three canteens, which are like food stalls, and one food counter. The counter is in the D1 mess and sells sandwiches, dumplings, and various desserts. D2 Mess has a canteen underneath the main eating area where many students go for omelets, sandwiches, and late night desserts. There are also two canteens at other locations on campus that serve a variety of foods including fried chicken, noodles, and eggs as well as more traditional Indian cuisine.
Students can also go to the provision store on campus and purchase different packaged snacks and beverages, or they can buy fresh fruit and vegetable from a stand along the main campus road. However, because all students are on a mess meal plan and an overwhelming majority of the campus regularly eats in one of the two messes, this project was aimed at reducing food waste in the messes.
2.1. The mess halls: Cedar (D1) and Maple (D2) The two mess halls are run by two separate contractors who are hired by the university
to avoid creating a food monopoly on campus. These contractors have one-year agreements with the university. Each year, their performance is reviewed and the campus allows other contractors to submit bids to replace the current contractors (P. Samuel, personal communication, 31 March, 2017). This system is intended to induce the contractors to produce better food, so they can receive positive feedback from students and staff and thus stay in business.
Students choose what mess they prefer at the end of each month. Most students are assigned to the mess they choose, but each mess is given at least 300 students. Thus, some
7

may not be assigned to their desired mess. However, there is not a regularly enforced attendance system for either mess, so students generally go to whichever mess they prefer.
Both messes provide breakfast, lunch, snack, and dinner at pre-specified times each day. As seen in Figure 2, when consumers enter the mess, they pick up a tray, a cup, and a spoon and then proceed to get their food.
Figure 2: The traffic flow in the D1 mess hall
8

Most of the food, such as rice, dal, salad, and potatoes, are self-served and consumers can take as much or as little as they would like. However, there are a few food items that are portioned out to consumers by the mess workers. These foods include bananas, paneer dishes, curd, non-vegetarian (non-veg) items like chicken and boiled eggs, and a few other foods. After the consumers eat their food and are ready to dispose of waste, they proceed to a centralized waste area, shown below in Figure 3, where there are two large dust bins designated for food waste as well as sinks to wash up after eating.
Figure 3: The waste disposal area at D2 mess
IIT Mandi has instituted a mess committee that consists of students from each year. All committee members are elected, and there is one member elected from each hostel on campus. This committee is responsible for managing the menu for the mess halls. They communicate with the mess contractor to choose dishes that taste good and use ingredients that fall within the contractor’s budget. The committee members monitor both messes in order to make sure that the mess managers and workers are complying to the mess committee’s rules. The mess committee sends out a monthly survey to students about food quality and the overall mess experience. Once these surveys have been analyzed, the mess committee can recommend changes to the managers in both mess halls in an attempt to make consumers happier. The mess committee is also responsible for creating campaigns to reduce food waste in the mess halls.
Apart from a few exceptions, all students are required to be on the meal plan and therefore pay a fee as part of their tuition each semester. The meal plan is currently Rs 98 per day and is pre-paid with the rest of the students’ expenses. Faculty and Ph.D. students have the option to pay for each meal individually as they enter the mess hall, making it more cost effective for them, as they can more easily choose which meals they would like to eat at the mess hall.
9
2.2. Previous waste reduction efforts at IIT Mandi In IIT Mandi’s 9 year history, only a few waste reduction efforts have been undertaken
in the mess. The most obvious effort consists of a series of posters located above the sinks in the D1 mess hall that encourage consumers to waste less food. Using consumer education tools like posters has been proven to work in other universities around the world, so this was an easy and obvious first step to reduce food waste in the mess halls. In fact, at the University of Kansas, using educational posters in their dining halls caused consumer food waste to be reduced by fifteen percent (Whitehair et al., 2013). However, the posters being used in the D1 mess appeared to reduce food waste for only about two weeks, before food waste returned to baseline levels (A. Singh, personal communication, 24 March, 2017). Despite this, the posters have been left in place for over one and a half years. Both messes also have a chalkboard installed where a daily estimate of the total food waste produced is written. Some other ideas about how to reduce food waste in mess halls are located in Appendix A.
10

3. Methodology
The mission of this project was to research mess hall food waste at IIT Mandi and provide long-term recommendations to reduce food waste. To complete our mission, at each point of the process of food preparation and consumption at IIT Mandi, we:
1. Determined the magnitude of food wasted 2. Explored why food is wasted 3. Developed methods to reduce food waste
3.1. Determining the magnitude of food wasted at IIT Mandi
Our first step was to audit kitchen and consumer waste in the D1 and D2 messes. To categorize consumer waste, we required consumers in the messes to segregate their food waste into different waste bins based on food type, as seen in Figure 4.
Figure 4: Buckets for post-consumer food waste segregation
We conducted 'monitored segregation' surveys at D1 (4 days) and D2 (7 days) where we observed behavior at each meal, counted the number of meal takers and weighed the waste produced for each of the foods on the menu.
During these ‘monitored’ waste audits, we observed that consumer waste was less than in former weeks because of our presence and the mere act of segregating waste. To isolate the impact of the act of segregation on waste reduction, we continued to enforce waste segregation in D1 without being present at the mess in order to remove the impact of our presence (‘unmonitored segregation’). The protocols for each type of waste audit we performed are located in Appendix B.
To automate the waste segregation measurements, our team created an electronic sensor to count the number of trays deposited in the mess. The device uses an ultrasonic
11

sensor to count the number of trays passed through the disposal slot. An Arduino microprocessor is used to process input from the sensor, and to update an LCD display to show the number of trays detected, which is shown in Figure 5. This device represents both a tool for data collection as well as a deliverable for our project. A more thorough description of this device can be found in Appendix C.
Figure 5: Sensor mechanism over tray disposal slot at D1 (on left), additional electronics and
LCD screen for tray counter (on right)
To test the impact of our presence on waste disposal, we also audited several meals in D2 mess where we did not enforce segregation but remained present at the meal, and counted the number of consumers as they returned their trays (‘monitoring without segregation’).
During our initial survey with monitored segregation we also measured the waste created by the kitchens. This included leftover food and kitchen trimmings. Additionally, in the D1 mess we measured the weight of food that was served.
Our final task for this objective was to measure the waste created by each individual consumer. This was achieved with an electronic device that stored data about the weight of a mess dustbin each time food was thrown into it, shown in Figure 6. This device was placed below a dustbin used for food disposal, and weighed the change in weight from each consumer’s contribution of waste.
Part A (labeled in Figure 6) is a wooden and metal base to support the dustbin. Below Part A is a load cell, which is part of a wheatstone bridge (Part B). An operational amplifier is used to enlarge the voltage change from the wheatstone bridge. An Arduino (Part C) processes the signal and stores the weight of each individual’s waste. The device then uses a cellular GSM connection to store data in the cloud, through Google Sheets. During normal operation, the electronics are housed inside Part D. A similar prototype was also developed at IIT Bombay and is described in Appendix D.
12

Figure 6: The prototype that measures the weight of an individual’s food waste
3.2. Exploring why food is wasted To determine why food is wasted, we conducted focus groups with mess consumers
and interviews with a variety of stakeholders. Our focus groups were used to determine consumer attitudes about why food is wasted.
Seven separate focus groups were conducted with students in each class year, as well as campus guards and faculty that eat in the messes. Groups were selected from attendees at snack time. Typically, all group members were chosen from the same table of friends to ensure that all members were of the same school year. Focus groups allow participants to express original ideas about the causes of waste and about potential reduction methods and thus they allowed us to observe trends and common food waste perceptions. We were also able to use individual responses and group dynamics to develop an understanding of the cultural significance of food waste at IIT. The questions we asked during these focus groups are located in Appendix E.
We conducted total of eight interviews in D1 mess and five interviews in D2 mess. In each mess, we interviewed mess workers, mess managers, and chefs. We also received additional information from the managers and chefs throughout our auditing process through informal conversation. Outside of the mess, we conducted interviews with various
13

campus managers and members of the student Mess Committee. Due to a need for language translation, our interviews with mess workers, chefs, and managers were fully structured. Our other interviews with university administrators were semi-structured, allowing interviewees to express their personal experiences and new ideas about food waste that we had not encountered or considered. All of the questions we asked during these various interviews are located in Appendix F.
3.3. Developing methods to reduce food waste To analyze food waste reduction methods, we first synthesized our data and
observations to identify trends and points of further inquiry. Based on this information, we performed a Strengths, Weaknesses, Opportunities, and Threats (SWOT) analysis of the dining services at IIT Mandi. This analysis was used to identify specific qualities of IIT’s dining services that effective food waste reduction methods would take advantage of, as well as any weaknesses or threats to possible reduction methods. After conducting the SWOT analysis and analyzing data, possible recommendations were generated.
14

4. Results and Discussion
This chapter discusses the results of our data collection and observations, and our corresponding analysis. The possible recommendations that follow from our data are found in the following chapter.
4.1. Consumer, kitchen leftovers, and kitchen trimming waste are equal
Our data collection for four days in D1 mess shows the approximate contribution of consumer, leftovers, and trimming waste to total waste, seen in Figure 7.
Figure 7: Contribution of different waste types to total waste
It is notable that most trimming waste is unavoidable. Thus, most avoidable waste comes from leftover and consumer waste. That said, we did find that the trimming practices in the messes, and especially D1 mess, lead to some easily avoidable waste. For example, Figure 8 below shows avoidable carrot and cucumber trimmings from D1 mess. Our interviews with mess managers and mess workers indicated that in both messes, neither the head chef nor the staff cooks have formal training on waste reduction, which may be a cause of the presence of easily avoidable trimming waste.
Figure 8: Cucumber and carrot trimmings from D1 mess, including some relatively large
chunks of avoidable waste
15

Our interviews and data collection have shown that the likely main cause of leftover waste is that mess managers have no reliable way of knowing how many students to expect at each meal.
Some meal attendance trends are consistent and apply to both messes. For example, Saturday lunch and dinner have lower attendance. Students in our focus groups have expressed that they frequently miss Saturday dinner and sometimes lunch because they travel off campus to eat (see Figure 9). Despite these common trends, both mess managers have expressed that they do not know exactly how much food to prepare because students do not always eat at their assigned messes, and because special events on campus may draw students away from the messes.
Figure 9: Attendance over one week in D2 mess
While consumer waste is undoubtedly a significant portion of total waste, not all consumer waste can be avoided. Upon first examination of the initial food waste data collected before the project began, it was determined that Wednesday, Friday, and Sunday breakfast produced some of the largest amounts of waste.
When the waste audit was conducted, the data that was collected directly contradicted this assumption. The high amount of waste on Wednesday and Sunday was actually mostly due to unavoidable waste from banana peels and eggshells, which are only served on these mornings. When this unavoidable waste was factored out of the total waste weight for the meal, the avoidable waste was shown to be reasonably low. Figure 10 shows the total amount of waste produced at breakfast and identifies how much of the waste was unavoidable.
16

Figure 10: Avoidable breakfast waste in D2 mess
4.2. D1 and D2 experience similar waste patterns As indicated by Figure 11, located below, both mess halls have very similar waste patterns. D1, indicated by the lighter bars, has slightly less food waste than D2, indicated by the darker bars, despite having more consumers assigned to it. This means poor food quality due to high attendance should not be the main cause of food waste.
Figure 11: Comparison of waste in D1 and D2 messes
In order to compare an important staple food at the two messes, we compared the roti waste per person at lunch and dinner. This comparison was motivated by focus group and
17

mess survey feedback indicating that the roti in D1 mess is incorrectly cooked and uses inferior ingredients when compared to D2. As seen in Figure 12, located below, the average roti waste is almost identical for the two messes (D1 is represented by the lighter bar while D2 is represented by the darker bar).
Figure 12: Roti waste at lunch per person in D1 and D2 mess
This may mean that food quality between the two messes is relatively similar. Most focus group participants seem to believe that one mess has better quality food, but it is not evident based on data that either mess has significantly higher quality food. It may also mean that food quality is not the main cause of waste, if low and high quality roti are wasted in similar quantities. This data gives more reason to believe that mess systems and consumer attitudes are the driving cause of food waste.
18

4.3. Dips and vegetarian main courses are wasted most
One trend that we identified was the amount of waste produced for each food type. As seen by Figure 13 below, dips and vegetarian main courses are wasted by consumers the most. This is largely due to the repetitive nature of the menu, as well as the excess amount of gravy and dips that students serve themselves in relationship to the solid foods that accompany them.
Figure 13: Avoidable and potentially avoidable waste of different food groups, per consumer,
per item
19

4.4. Monitored segregation reduces food waste Based on our monitored and segregated waste audits in the D2 mess, it was apparent
that having consumers segregate their food waste while we monitor them greatly reduced the total amount of waste produced. This is evidenced by comparing data that we had previously collected data for the first three weeks of March in the D2 mess with our monitored and segregated waste audit performed in the last week of March. This relationship is shown in Figure 14.
Figure 14: Segregated and unsegregated waste in D2 mess over the course of one week
Consumer feedback from focus groups and informal communication indicates that these audits may have reduced waste for three reasons. First, segregation is inconvenient, leading people to waste less food in order to avoid sorting waste. Second, it’s embarrassing to be watched while disposing of large amounts of waste. Third, people were scared that we would punish them for wasting food, because they did not know exactly why we were watching them dispose of waste. Thus, we also conducted tests to isolate the effects of monitoring and waste segregation. We performed an unmonitored but segregated waste audit in the D1 mess hall, and found that consumers produced an average of 19.31% more waste than they did during the monitored and segregated waste audit previously performed in the D1 mess hall. We also performed a monitored waste audit without segregation in the D2 mess hall and found that consumers produced an average of 37.94% more waste than they did during the monitored and segregated waste audit originally performed in the D2 mess hall.
20

4.5. Portioned foods are wasted less As previously mentioned, most foods served in the mess are self-served by the
consumers themselves. However special and/or expensive foods are often portioned by a mess worker. These portioned foods include non-veg items, sweet items, paneer, and bananas. Our waste audits have shown that at all mealtimes in D2 mess, self-serve menu items are wasted more than portioned menu items by consumers, as shown in Figure 15.
Figure 15: Avoidable consumer waste in D2 mess for self serve and portioned items
This trend also holds for leftover waste in D2 mess (see Figure 16 below). It is notable that waste production is clearly much more variable for leftover waste, because portioned foods are wasted almost as heavily as self serve foods at lunch, but much less at breakfast and dinner.
21

Figure 16: Avoidable leftover waste in D2 mess for self serve and portioned items
We hypothesize that this difference is in part a function of the appeal of portioned foods. Portioned foods are often more expensive, causing the mess staff to ration the quantity, thereby causing students to waste less of it. Students may also waste less of this food in an attempt to avoid the long lines more than one time. Focus group participants indicated that when lines are long, as shown below in Figure 17, consumers do not want to stand in the long line more than once. Thus, they take too much food, and cannot finish it if they become full or do not like the taste.
Figure 17: Picture of the line in D1 during snack time on Monday, April 11
22

4.6. South Indian breakfast items are wasted more Three days a week, both messes serve breakfast dishes native to South India. Many
students in our focus groups commented that “these dishes are not cooked properly and do not have a good taste”. Through the waste audits that we have conducted in both mess halls, we have found that South Indian food is wasted more than North Indian food during breakfast, which is the only meal where South Indian food is prepared, as illustrated in Figure 18. However, this could also be due to the fact that these foods are inherently heavier than other items served.
Figure 18: Waste based on food region at D2 mess
23

4.7. Improving the IIT Mandi mess hall system After gathering both quantitative and qualitative data, we conducted a SWOT analysis on
IIT Mandi’s mess system (see Figure 19 ).
Figure 19: A SWOT analysis of the Mess systems on the IIT Mandi campus
Our analysis indicates that the campus food and food waste systems are generally strong in using campus-wide feedback, as evidenced by surveys sent out to all students asking for mess feedback. Additionally, the student mess committee and campus administrators have strong control over the mess contractors. However, the mess system is especially weak because of its limited and repetitive menu as well as the very low budget that the mess contractors are given.
There is great possibility for change using competition between the messes and by increasing the contractor’s budget. However, any methods that are implemented must be dynamic enough to avoid the plight of former food waste reduction methods that failed after several weeks.
24

4.8. Almost one-third of the cost of food is wasted By determining the composition of food waste, we were able to determine the cost of waste and relative cost of different types of waste. Using local wholesale food prices, we estimated the cost of all consumer and leftovers waste to be about Rs 3600 per day, between both messes, totaling to almost 8 lakhs being wasted throughout one school year. However, this number only takes into account the cost of raw materials. Therefore if the costs of labor and transportation were taken into account, the total amount of money being wasted would be even higher. The breakdown of consumer and leftover waste of raw materials for each mess is shown below in Figure 20.
Figure 20: Cost of daily consumer and leftover waste in D1 and D2 mess
Based on how much food is purchased for D2 mess, we calculated that by weight, approximately 28% of the cost of food is wasted through consumer and leftover waste. We assume that if waste reduction measures are taken and less food is wasted, less food will need to be purchased and prepared, and money will be saved.
Figure 22 shows that total cost (over one week) spent on food waste of various types. It is interesting that non-veg items incur so much cost. This analysis is potentially misleading because although the cost of non-veg items like eggs and chicken is high, when items such as chicken and egg curry are served, most of the waste is the liquid associated with the curry. Thus, the actual cost of the waste of these items is much less than the cost of the complete recipes. Similar to the breakdown of waste per person shown in Figure 21, curry and solid dishes are two of the largest bars.
25
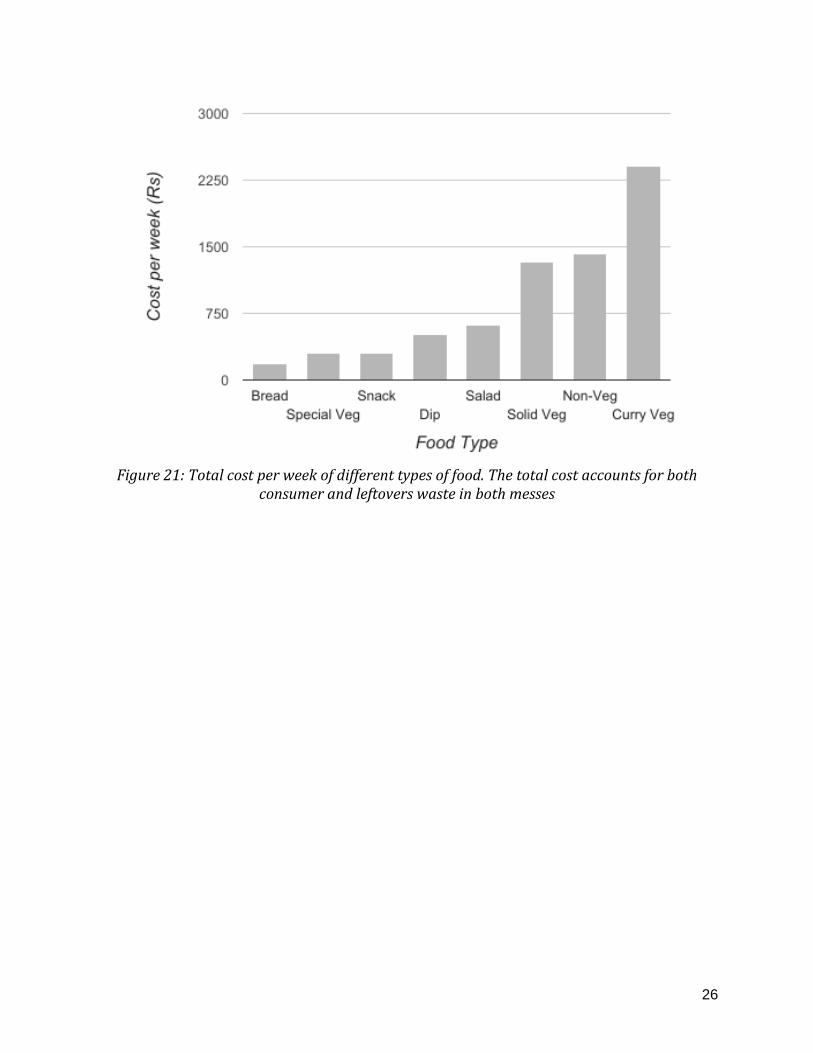
Figure 21: Total cost per week of different types of food. The total cost accounts for both
consumer and leftovers waste in both messes
26

5. Conclusions and Recommendations
After analyzing food waste at IIT Mandi’s two mess halls, our team was able to determine several recommendations for the university based on our data collection. We conducted waste audits in both mess halls, ran focus groups with mess consumers, interviewed mess and campus administrators, and determined a set of recommendations for the university to implement in the future. Some of these recommendations regard systematic changes, like increasing the price of the meal plan and tracking attendance in each mess hall. Other recommendations involve more training for the mess staff about portion sizes and food waste reduction, as well as introducing more variety to the menu. We have presented these recommendations to members of the Mess Committee, Green Panel, and mess managers, in hopes that they will take further action to reduce mess hall food waste.
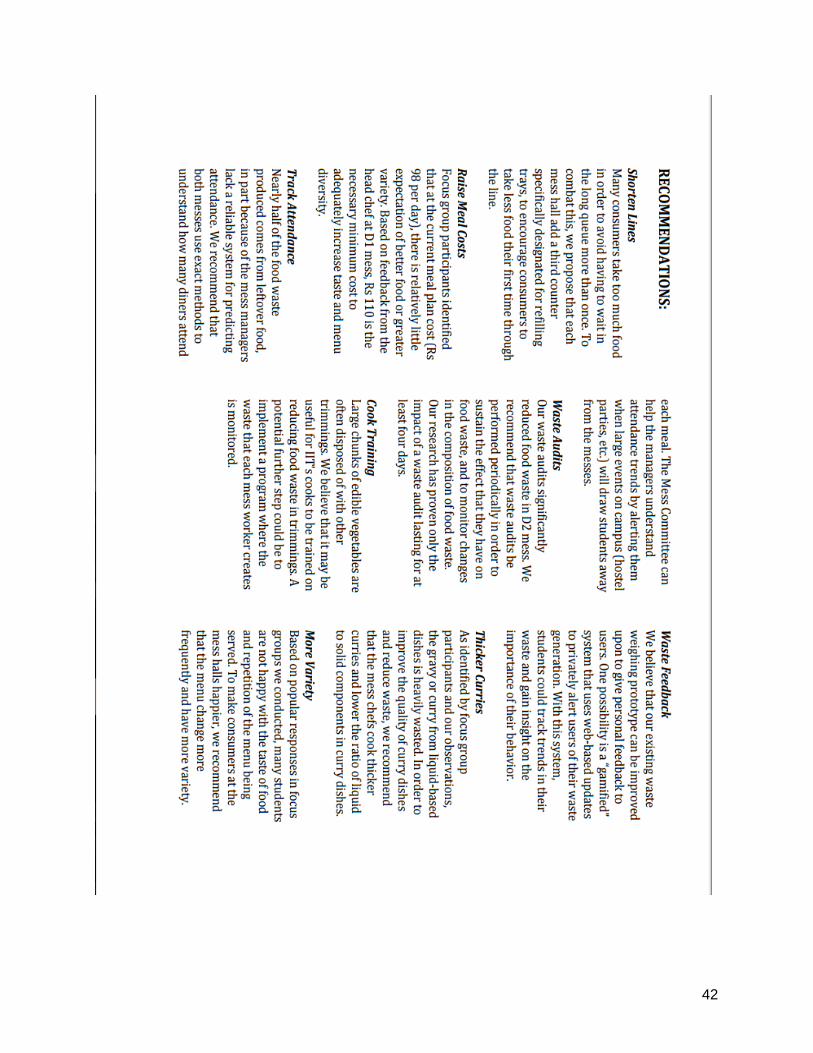
5.1. Recommendations for mess managers These recommendations can easily be implemented by the manager and/or head chef at each mess. They may require some assistance from the Mess Committee to organize new programs, so these recommendations are also relevant for the Mess Committee. Track attendance at each mess hall for each meal Currently, the mess managers at D1 and D2 mess can roughly estimate from experience how many students will attend a meal and how much food they will eat. However, nearly half of the food waste produced comes from leftovers of food in the kitchen. This is in part because of this unreliable system for predicting attendance. We recommend that both messes begin to use quantitative methods, such as the sensor we created, to understand exactly how many diners attend each meal. This will allow the managers to cook based on an exact average attendance for a given menu or meal period. Implement a program to track mess worker’s waste individually As seen in our waste audits, especially at D1 mess, large chunks of edible vegetables are often disposed of with other trimmings. As other colleges like WPI often have training for their cooks on reducing trimming waste, we believe that this would be an appropriate step for IIT’s messes to undertake. A potential further step could be to implement a program where the waste that each mess worker creates is monitored. This would allow chefs and managers to identify those that need further training or reassignment based on high waste production. Adjust current recipes As identified by focus group participants and our observations, the gravy or curry from liquid-based dishes is heavily wasted. In order to improve the quality of curry dishes and correspondingly reduce waste, we recommend that the mess chefs cook thicker curries
27

and lower the ratio of liquid to solid components in curry dishes. This should prevent the wastage of liquid components of curry dishes.
5.2. Recommendations for Mess Committee These recommendations can be most effectively implemented by the student Mess Committee and the administrators that oversee them. However, all of them will require that the committee work closely with mess managers and staff. Conduct ‘monitored segregation’ waste audits frequently As mentioned previously, our waste audits significantly reduced food waste in D2 mess. We recommend that waste audits be performed periodically in order to sustain the effect that they have on food waste, and to monitor changes in the composition of food waste. As shown by our audits with unmonitored segregation and monitoring without segregation, these waste audits will be most impactful only if they are both monitored and segregated, but either monitoring or segregation alone would likely be impactful. Our research has proven only the impact of a waste audit lasting for at least four days. We believe that any sort of regular auditing would be useful, but based on our proven results recommend continuous audits lasting for four to seven days. Raise the cost of a meal plan The cost of a meal plan at IIT Mandi breaks down to Rs 98 per day: Rs 28 for breakfast, and Rs 35 for each of lunch and dinner. Focus group participants and a member of the Mess Committee identified that at this cost, there is relatively little expectation of better food or greater variety. Thus, the Mess Committee has indicated that it would like to raise the cost of a meal plan to Rs 100 or Rs 105. However, based on feedback from the head chef at D1 mess, Rs 110 is the necessary minimum cost to adequately increase taste and menu diversity. The university should undertake significant research into the ability of all students and their families to cover this cost before raising prices. Increase communication between mess staff and students As we saw during our week of auditing at D2 mess, the manager was not aware of special events happening on campus that decreased mess attendance and in turn raised leftover waste. Thus, we recommend that one duty of the mess committee is to alert the mess managers of special events on and off campus that may draw students away from the messes. This will allow the mess managers to produce less food to account for fewer consumers. Introduce a personal feedback system We believe that our existing waste weighing prototype can be improved upon to give personal feedback to users. One possibility is a “gamified” system that uses smartphone or web-based updates to privately alert users of their waste generation. With this system, students could track trends in their waste, see where they fall in the distribution of waste generators, and gain insight on the importance of their behavior. Gamification has been
28

shown to have potential for positive changes in attitude and behavior, including in sustainability related contexts (Fijnheer, van Oostendorp, 2016). Add additional counter for second servings of food From our focus groups, it is apparent that many consumers take too much food in order to avoid having to wait in the long queue more than once. As seen before in Figure 17, the queues to get food can become quite lengthy. To combat this, we propose that each mess hall add a third counter specifically designated for refilling trays. This would allow consumers to be able to take less food their first time through the line without fear of waiting in a long queue for a second serving. Add more variety to the menu Based on popular responses in both the focus groups we conducted and the mess survey answers, many students are not happy with the taste of food and repetition of the menu being served. To make consumers at the mess halls happier, we recommend that chefs change the menu more frequently and add more variety to it. This will allow consumers to enjoy a more varied menu and not waste as much food. This will be possible if, as mentioned previously, the mess budget is increased to Rs 110 per day.
29

Acknowledgements There are many people that were essential to the success of this project. First, we would like to thank our advisors, Professors Balakrishnan, Carrera, Dasgupta, and Nikitina. They provided insights to the project that may otherwise have gone unnoticed and helped guide us towards success. We would also especially like to thank the mess workers who went out of their way to help us audit waste and test our prototype. We would like to thank Kent Fong, Virginia Massa, and Daniel Salisbury for helping our team with our waste audits, and Daniel Salisbury and Karina Larson for their assistance in building the mechanical portion of our tray counting prototype.
30

References
2016 global hunger index: India. (2016). ().
Biswas, A. K. (2014). India must tackle food waste. Retrieved from https://www.weforum.org/agenda/2014/08/india-perishable-food-waste-population-growth/
Dash, A., Sankaran, K., Shrimali, P., Iyer, P., Upadhyay, S., & Javadekar, S. (2015, November,). Food for thought. Insight: IIT Bombay's Student Media Body, 6-7.
FAO. (2013). Food wastage footprint : Impacts on natural resources FAO.
Fijnheer, J. D., & Van Oostendorp, H. (2016). Steps to design a household energy game. International Journal of Serious Games, 3(3) doi:10.17083/ijsg.v3i3.131
Hunger statistics. (2017). Retrieved from https://www.wfp.org/hunger/stats
SAVE FOOD: Global initiative on food loss and waste reduction (2017).
Whitehair, K., Shanklin, C., & Brannon, L. (2013). Written messages improve edible food waste behaviors in a university dining facility. Journal of the Academy of Nutrition and Dietetics, 113(1), 63-69. Retrieved from
31

Appendices Appendix A: Common Waste Reduction Methods
Method Goal
LeanPath system Identify long term waste trends
Cook in smaller batches using “just in time” approach
Prepare food based on real-time customer waste to avoid leftovers
Shrink amount of food displayed at once Allow smaller batches to be cooked
Reuse food trimmings in soups, salsas, etc.
Avoid throwing away edible scraps
Create new dishes with leftovers Reuse leftovers instead of throwing away or donating
Cook-to-order approaches instead of buffets
Eliminate need to pre-produce (and overproduce) some foods
Employee education Ensure that employees know how to minimize waste and understand need to minimize waste
Inventory and menu management (potentially through software)
Avoid buying excess food, identify meal attendance trends
Use creative, item specific, food storage techniques
Keep food fresh longer
Ensure that cooks have proper equipment
Avoid trimming waste and waste from improperly cooked meals
Survey students about food quality Determine how to alter recipes to meet consumer preferences
32
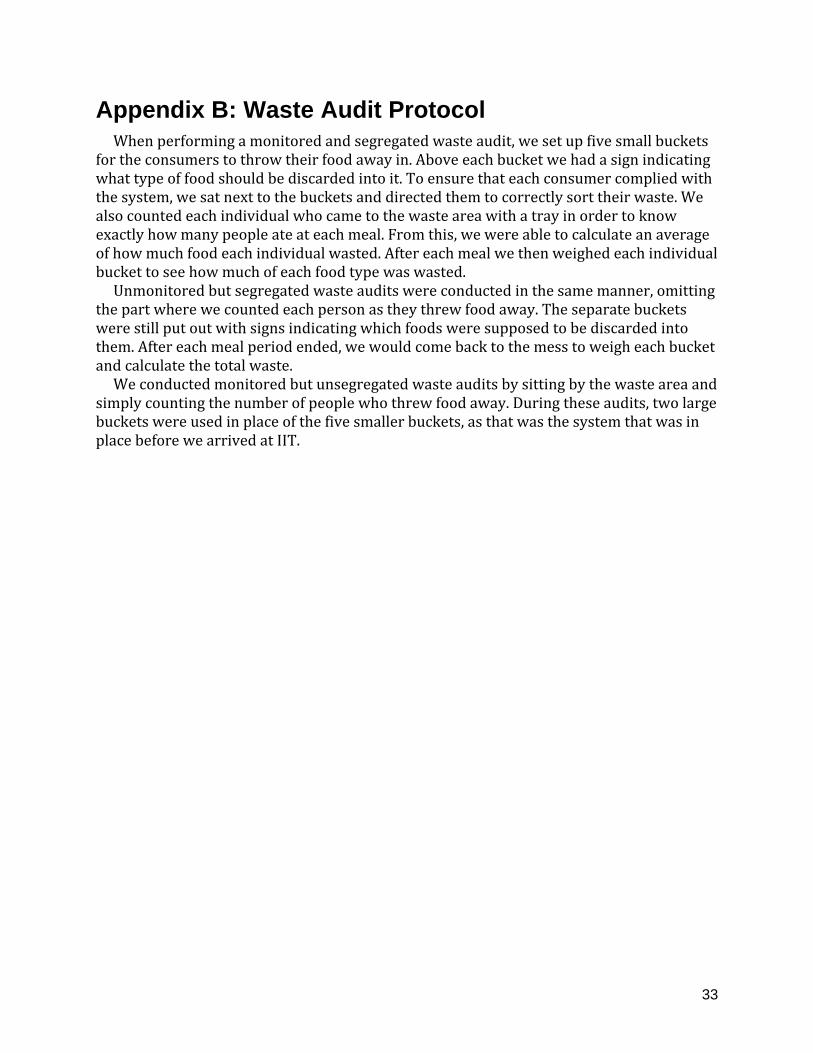
Appendix B: Waste Audit Protocol When performing a monitored and segregated waste audit, we set up five small buckets for the consumers to throw their food away in. Above each bucket we had a sign indicating what type of food should be discarded into it. To ensure that each consumer complied with the system, we sat next to the buckets and directed them to correctly sort their waste. We also counted each individual who came to the waste area with a tray in order to know exactly how many people ate at each meal. From this, we were able to calculate an average of how much food each individual wasted. After each meal we then weighed each individual bucket to see how much of each food type was wasted. Unmonitored but segregated waste audits were conducted in the same manner, omitting the part where we counted each person as they threw food away. The separate buckets were still put out with signs indicating which foods were supposed to be discarded into them. After each meal period ended, we would come back to the mess to weigh each bucket and calculate the total waste. We conducted monitored but unsegregated waste audits by sitting by the waste area and simply counting the number of people who threw food away. During these audits, two large buckets were used in place of the five smaller buckets, as that was the system that was in place before we arrived at IIT.
33

Appendix C: Tray Counting Device Description
The tray counter uses the Arduino microcontroller platform as a processor. It uses an ultrasonic sensor that is mounted above the tray disposal slot to detect trays. An LCD screen is connected to the Arduino, which displays the amount of trays deposited since the last time the counter's power was cycled. The counter is extremely accurate at processing trays, rarely, if ever missing the presence of a tray passed through the slot. Currently, the counter detects some cups and counts them as trays. This can be easily remedied by having three ultrasonic sensors instead of one. The three sensors would be placed so that a tray in any orientation will trigger at least two of the three sensors, but the sensors would be far away enough from each other that no cup could trigger two sensors. Additionally, the counter could be used to sync data to the cloud so that computerized analysis on attendance could be performed.
34

Appendix D: IIT Bombay Case Study The Indian Institute of Technology, Bombay is located on India’s Western coast, bordering the Arabian Sea. The college has approximately 8,000 total students, who dine in 16 on-campus hostels. Data from a 2011 waste audit shows that the mess hall waste per day was, on average, over 950 kg total, or between 0.1 and 0.16kg per capita (Dash et al., 2015). In 2015, a group of IIT Bombay students enraged by the amount of food waste thrown away at their college conducted an interview- and observation-based study at their mess halls to understand the cause, publicize the issue, and explore potential solutions. The authors’ first observational finding was that not all food is wasted equally. Rather, a “cursory glance at the waste food” shows that basic items that are served every day, like rice, dal, and lentils, are wasted more than “special food items”. They also found that at most hostels, kitchen waste and leftover food waste were smaller contributors to total waste than post-consumer waste. The authors’ interviews and potential assumptions lead them to hypothesize that this is due primarily to student attitudes surrounding waste. They give anecdotal evidence that students feel no responsibility for the problem, and feel entitled to waste because they pay for their food. This is potentially due to the meal plan system that was in place at IIT Bombay, where students paid a one-time fee per semester for mess food, regardless of how many meals they use. The authors hypothesize that this could be an issue because it necessitates that food providers overproduce under the assumption that large volumes of students may show up during any given meal period, resulting in wastage of cooked food (Dash et al., 2015). The authors also found that students complain of the food as “tasteless” as a justification of their waste habits. While food quality may be a major factor in IIT Bombay’s levels of waste, the report also notes that food waste levels were not reduced when food quality supposedly improved after the mess halls were transitioned from public to private ownership. Although private ownership should have a greater focus on profit and customer satisfaction that would inspire higher quality products, there may be little incentive for the private companies to please consumers with high quality products when all students are on a mandatory, fixed fee meal plan (Dash et al., 2015). The most surprising solution suggested by the report is based on a student project being tested at one the mess halls. The project is a prototype that actively weighs the total food post-consumer waste during a meal period and the weight contributed by each individual. If an individual contributes more than 0.1kg of waste (the lower end of the expected average range), then the device uses audible messages and visual feedback through a TV screen to reprimand the waster. The screen displays statistics about the prevalence of malnutrition and farmer suicides in India, which are meant to shame food wasters and encourage them to consider their own privilege (Dash et al., 2015). This system has undergone limited testing, but the fact that this system is socially acceptable in an Indian college speaks volumes about the difference between social change structures in India and in the United States.
35

Appendix E: Focus Group Prompts 1. What region of India are you from? 2. Which Mess are you assigned to and which Mess do you prefer? 3. How do you feel about the Mess assignment system? 4. How do you feel about the quality of the mess hall food?
a. Have you seen changes in the quality of the food? 5. What do you think the mess should change? 6. What determines how much you serve yourself? 7. How often do you finish all the food on your plate? Why? 8. What is the culture surrounding food waste at IIT? 9. What would motivate you to waste less food? 10. (show them the graph of food waste) can you explain the trends shown in this
graph?
36

Appendix F: Interview Questions Appendix F1: Mess Committee
1. What is the mess committee responsible for? 2. Why did you decide to become a part of the mess committee? 3. Has the mess committee ever encouraged students to waste less food? 4. What efforts has the mess committee done to reduce food waste? 5. How successful have these efforts been? 6. Do you think our method of segregating food has been successful? Do students like
the system? 7. How does the mess committee decide menu items? 8. Do the mess workers often listen to the mess committee's suggestions about
changes in the mess? 9. How many people are assigned to each mess? 10. Can you share any survey feedback with me?
Appendix F2: Mess Workers (Cleaning/Serving Staff)
1. Can you tell me about what you do for your job? 2. Can you tell me about the trainings you have received for this job? 3. (if they serve food) How do you decide how much food to serve each person? 4. What patterns have you seen in how much food people take at each meal? (i.e. type
of food, day of week and time of day) 5. How much food is leftover at the end of every meal? 6. What patterns have you seen in how much food is wasted? 7. Do you notice that different amounts of students eat at each meal? 8. Do you think a prototype for smart dust bins would be successful in the mess halls? 9. Would you be able to maintain the prototype?
Appendix F3: Mess Chefs
1. (introductions, etc.) How long have you been a cook? 2. How long have you been cooking at IIT Mandi? 3. Can you tell me about what you do as a cook at IIT Mandi? 4. Where did you learn how to cook? 5. Can you tell me about the trainings you have received for this job? 6. In general, do you believe that wasting food is a problem? Why? 7. Do you believe that reducing food waste is important for sustainability? 8. How much food does the kitchen waste? 9. Why is that food wasted? 10. Where do you throw your food away? 11. How could this kitchen reduce waste?
37

12. (Describe waste-type waste sorting monitoring system) How much extra work would this system take for you to use?
13. (Describe food-type waste sorting system) How much extra work would this system take for you to use?
14. Do you have any suggestions for food waste reduction in your kitchen? Appendix F4: Mess Managers
1. What are your duties as (job title)? 2. How do you define food waste? 3. How do you track food waste? 4. What units do you use to measure food waste? (i.e. mass, volume, money, etc.) 5. Is food waste a problem at IIT-Mandi? 6. What economic, environmental, and social impacts does food waste have at IIT-
Mandi? 7. How do you measure these impacts, if any? 8. Have any efforts been put in place to try and reduce food waste? 9. (if no efforts have been made) Why haven’t any efforts been made to reduce food
waste? 10. (if some efforts have been made) Can you tell us about the success of previous food
waste reduction efforts? 11. What training do chefs receive? 12. How do you decide what to cook? 13. How are student preferences considered in meal decisions? 14. How variable are your recipes? Are things always cooked the same way or do chefs
use creativity to change recipes? 15. How do you communicate with chefs? 16. Tell me about how you use rewards for employees 17. Tell me about how you use punishment for employees 18. (describe smart dust bin prototype) Do you think a prototype for smart dust bins
would be successful in the mess halls? 19. What changes would you make to the prototype to make it more successful or
useful? 20. Would your staff be able to maintain the prototype?
Appendix F5: Dean Secretary
1. What do you do for your job? 2. How are you involved with the messes? 3. Why does IIT have two mess contractors? 4. How are mess contractors chosen?
38

5. How do you decide if you will renew mess contracts? 6. What role do the mess contractors have in mess decisions? What role does IIT
Mandi have? 7. What rules must the mess contractors follow? 8. Do the people who deliver the food have a contractual relationship to the
contractor? 9. Are there any contractual obligations or incentives for the mess contractors to
reduce food waste? 10. What role does competition play in the relationship between the mess contractors? 11. How was the meal plan format chosen? 12. Is it possible for us to have access to information about IIT Mandi’s mess budget? 13. Do you have information that you could share about the hierarchy of mess
employees at IIT Mandi? Appendix F6: Green Panel
1. What is your role on the green panel? 2. What are your other roles at IIT Mandi? 3. What green measures has the panel taken related to food waste? 4. What green measures are you planning related to food waste? 5. Can you tell us about the composting system you are using? 6. (if not covered in question 4) Can you tell us about the biogas system that is going to
be installed soon? 7. (if not already covered) Is waste segregation necessary for the compost and/or
biogas systems? 8. Are there any barriers to reducing food waste on campus? 9. What budget do you have for implementing food waste reduction methods? 10. What control do you have over the actions that are taken by the mess contractors? 11. Is there anything else related to food waste that you'd like to share with us? 12. What is the cost of food waste?
Appendix F7: Canteen Manager
1. What is your role at this canteen? 2. Why was this canteen created? 3. What oversight does IIT Mandi have of your canteen? 4. Do you have the same food supplier as the mess? 5. (if not previously mentioned) How does your establishment work together with the
mess management? 6. On average, how many people will you serve in one day? 7. What are your busiest hours?
39

8. Do you notice any specific days/meals when you get more business? 9. What is your most popular item on the menu? 10. What is your least popular item? 11. What kinds of foods are sold more often than others? For example, desserts, meals,
drinks, snacks, etc. 12. Have you noticed an increase/ decrease in sales when the contractors of the messes
are changed? 13. How closely do you track trends of food sales and canteen attendance? 14. How often do you purchase food? 15. How do you set your prices? 16. What do you do with the food that wasn’t prepared? 17. How much food do you waste on average? 18. How do you manage your food waste? 19. Do you notice what foods are wasted most by students at your canteen? 20. What waste do you create in food preparation?
40

Appendix G: Recommendations Pamphlet
41
42