reducing esp hopper re-entrainment for pac/aci operation€¦ · reducing esp hopper re-entrainment...
TRANSCRIPT
Reducing ESP Hopper Re-entrainment forPAC/ACI Operation
Gerry Klemm, Southern Company Rob Mudry and Brian Dumont, Airflow Sciences
2013 APC Round Table
Introduction
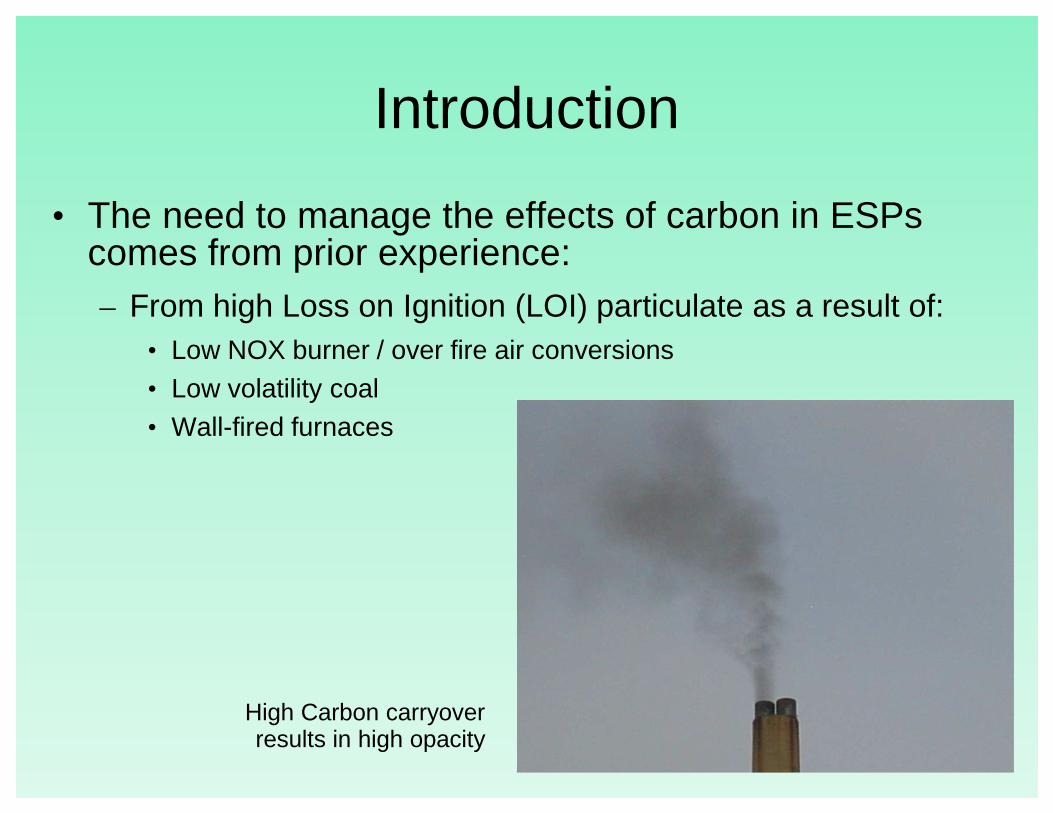
• The need to manage the effects of carbon in ESPs comes from prior experience:– From high Loss on Ignition (LOI) particulate as a result of:
• Low NOX burner / over fire air conversions• Low volatility coal• Wall-fired furnaces
High Carbon carryover results in high opacity
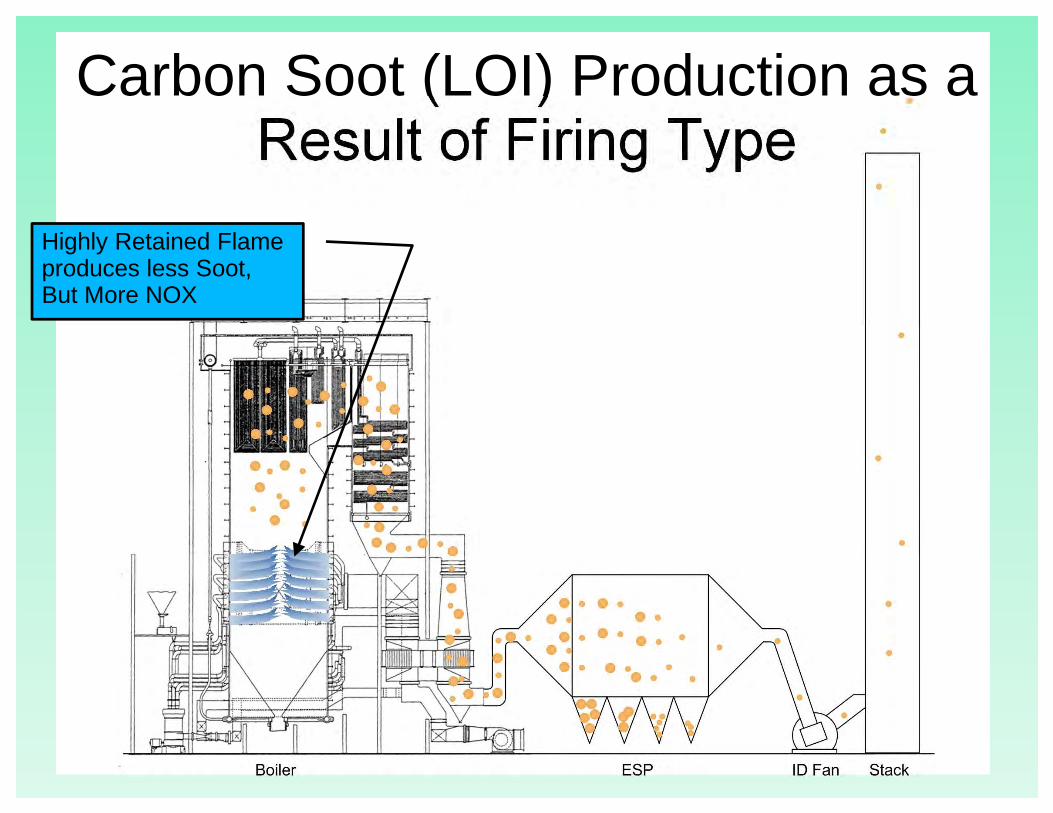
Carbon Soot (LOI) Production as a Result of Firing Type
Highly Retained Flame produces less Soot, But More NOX

Carbon Soot (LOI) Production as a Result of Firing Type
Highly Protracted Flame produces More Soot, But Less NOX
Fine, Light Carbon Soot is concentrated in Outlet ESP hoppers
More Carbon Soot is released to the stack or FGD
1
2
3
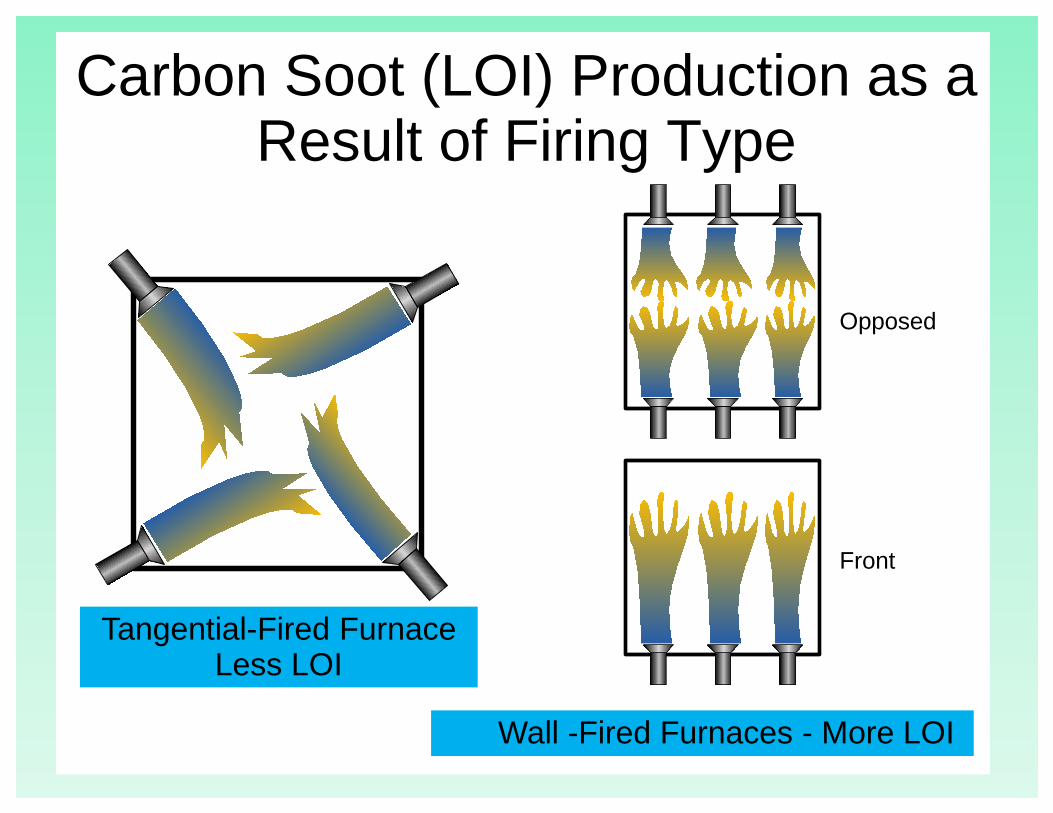
Carbon Soot (LOI) Production as a Result of Firing Type
Tangential-Fired FurnaceLess LOI
Wall -Fired Furnaces - More LOI
Opposed
Front

Investigation - Physical
• Self-performed physical modeling– Tested 1:4.5 scale model of Watson 5 ESP (partial)
• Studied steady state as well as transient conditions during rapping
• Developed hopper
baffling concepts
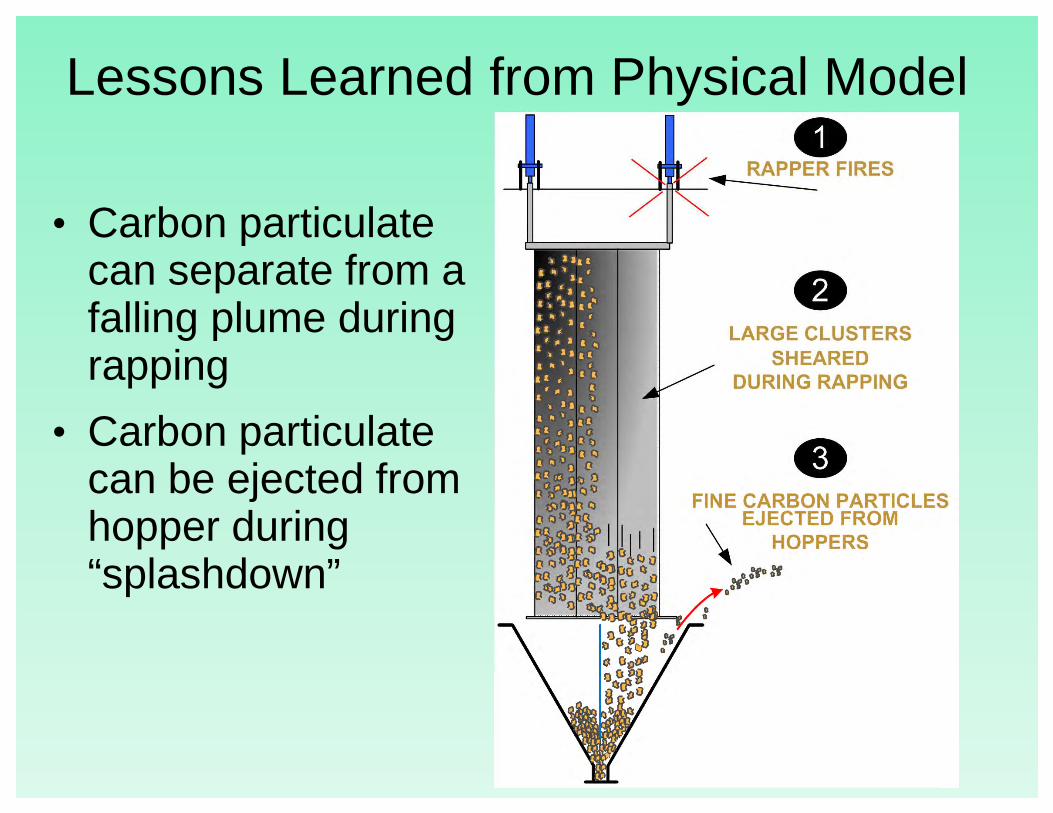
Lessons Learned from Physical Model
• Carbon particulate can separate from a falling plume during rapping
• Carbon particulate can be ejected from hopper during “splashdown”
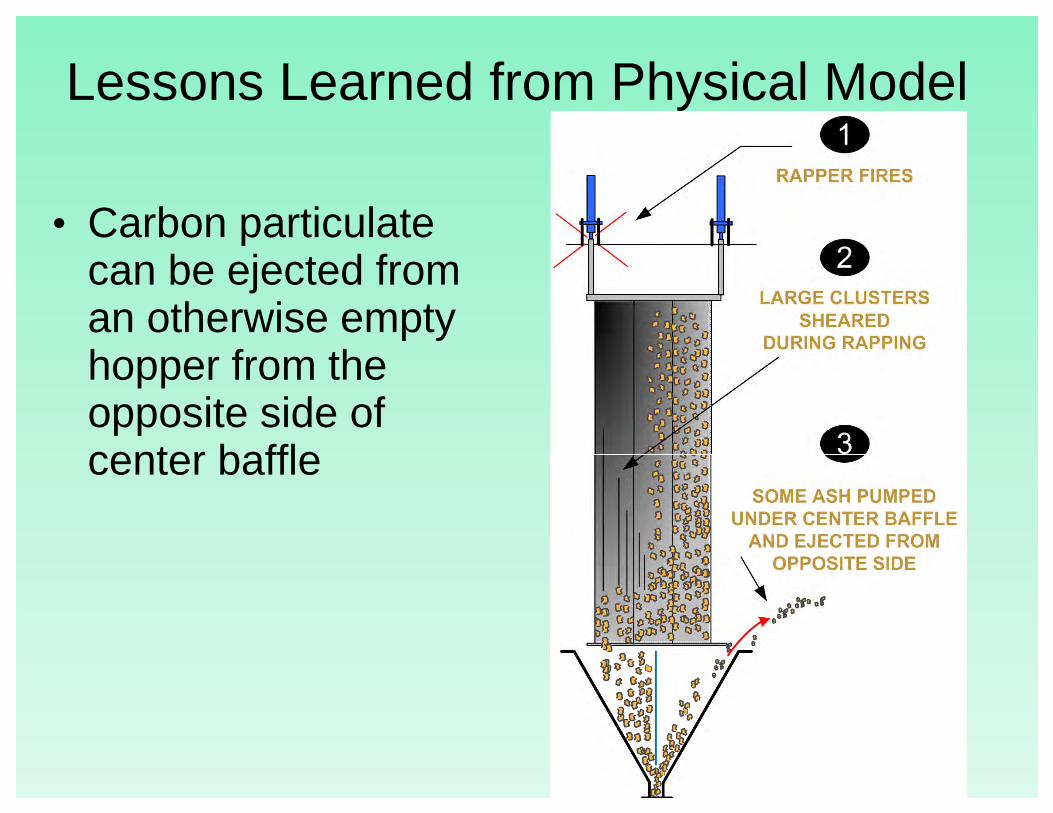
Lessons Learned from Physical Model
• Carbon particulate can be ejected from an otherwise empty hopper from the opposite side of center baffle

Devices from Physical Modeling
Hopper Grate
Carbon Baffle
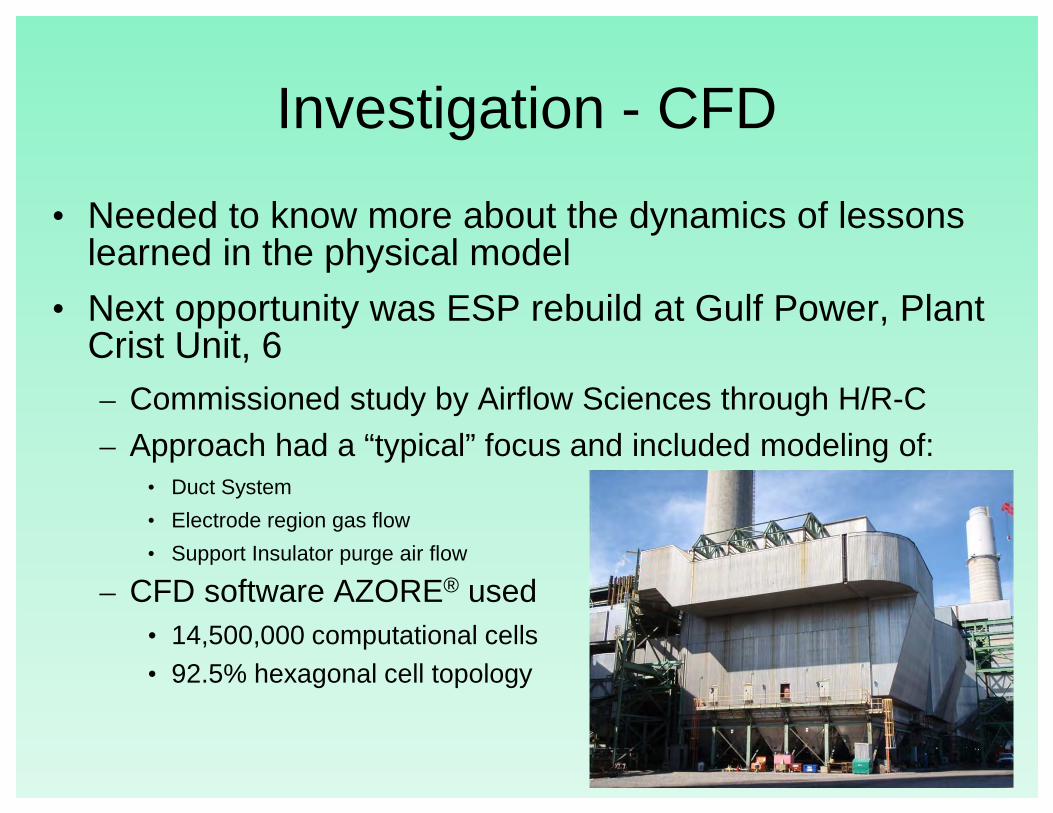
Investigation - CFD
• Needed to know more about the dynamics of lessons learned in the physical model
• Next opportunity was ESP rebuild at Gulf Power, Plant Crist Unit, 6 – Commissioned study by Airflow Sciences through H/R-C
– Approach had a “typical” focus and included modeling of:• Duct System
• Electrode region gas flow
• Support Insulator purge air flow
– CFD software AZORE® used• 14,500,000 computational cells• 92.5% hexagonal cell topology
Investigation – CFD (Cont.)• An expanded design effort was also initiated to improve
the capture of very fine, carbonaceous particles– Plant was dealing with high LOI ash – difficult for ESP to capture due to
small particle size and elevated carbon content
– Design effort concentrated on flow patterns in the hoppers, minimizing the potential for fine particle re-entrainment
• We feel that lessons learned will directly apply to MATS compliance– Activated Carbon Injection (ACI) will be used extensively for MATS
compliance
– Powdered Activated Carbon (PAC) has similar traits to high LOI flyash

Investigation – CFD (Cont.)• Modeled both Steady state and Transient conditions
– Steady State defined as normal operation at a constant gas flow with no disturbances
– Transient defined as the localized behavior of ash and flue gas under rapping
Crist 6 ESP (1/2)

Plant Crist Unit 6 ESP
• Manufactured by Wheelabrator• In service date 1994
(Retrofit from Buell)
• Rebuild with HRC internals 2012
• Necessary due to low temperature operation and rapping fatigue
Crist Unit 6 ESP
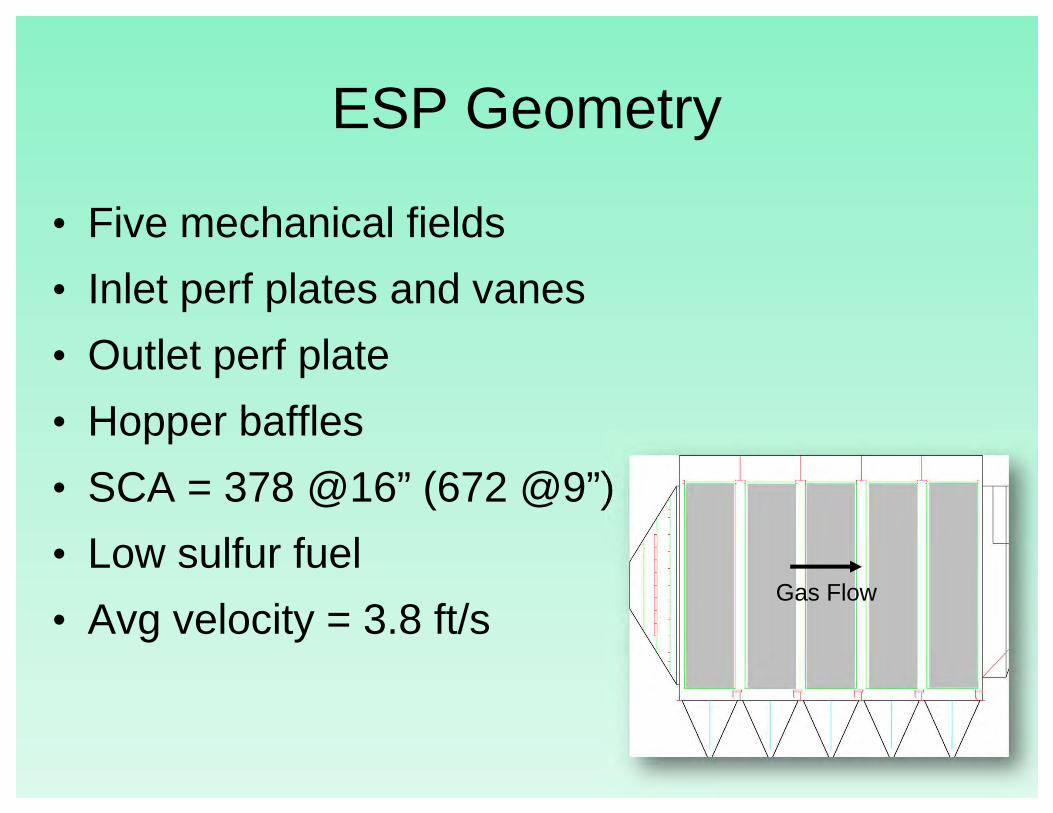
ESP Geometry
• Five mechanical fields
• Inlet perf plates and vanes
• Outlet perf plate
• Hopper baffles
• SCA = 378 @16” (672 @9”)
• Low sulfur fuel
• Avg velocity = 3.8 ft/sGas Flow
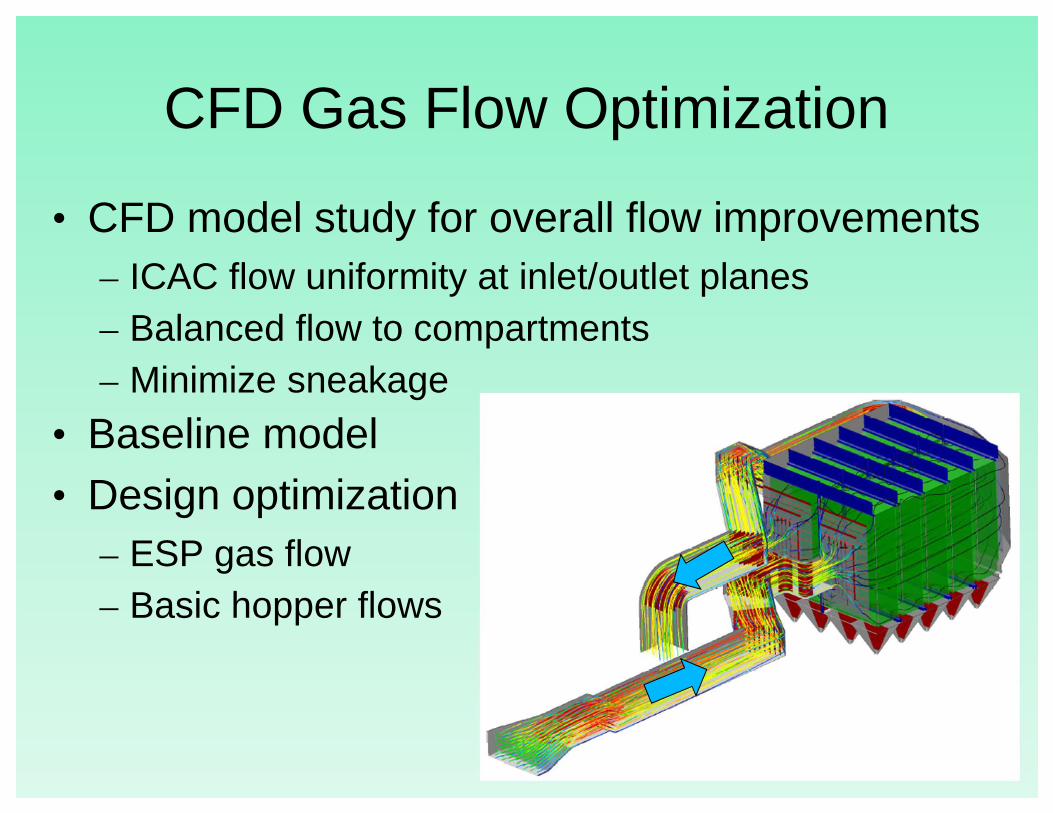
CFD Gas Flow Optimization
• CFD model study for overall flow improvements– ICAC flow uniformity at inlet/outlet planes– Balanced flow to compartments– Minimize sneakage
• Baseline model• Design optimization
– ESP gas flow– Basic hopper flows
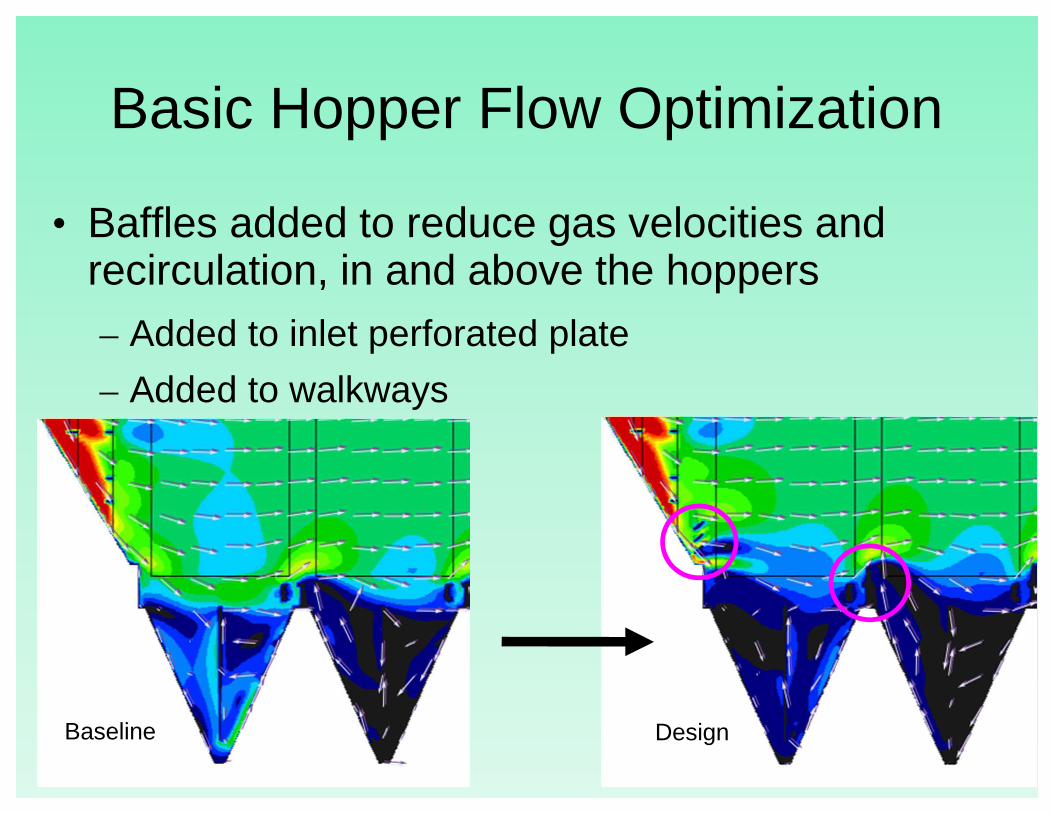
Basic Hopper Flow Optimization
• Baffles added to reduce gas velocities and recirculation, in and above the hoppers– Added to inlet perforated plate
– Added to walkways
Baseline Design

Expanded Modeling Effort
• Improve capture of very fine, high carbon flyash
• These are more difficult to capture in ESP because
– Carbon content adversely affects resistivity
– Fine particles migrate more slowly to collection plates
– Fine particles are more likely to be re-entrained during rapping before they reach the hoppers
– Fine particles are more likely to escape the hoppers• Due to subtle velocity patterns and recirculation, allowing fine ash to
be re-entrained out of hoppers
• Due to ash particle interaction and gas flow transient pressures caused by rapping of collection plates
Steady State Analysis
• Focus on hopper gas flow and particle behavior– Very fine, light weight particles, especially with a
higher carbon content (LOI, PAC), are influenced less by gravity and more by subtle gas velocities
– These particles are susceptible to re-entrainment if they waft upwards regardless of hopper fill level
– During rapping, falling mass of ash impacts existing ash in hopper and causes “splash” effect, resulting in fine particles being pushed upwards, to be re-entrained in the main gas flow
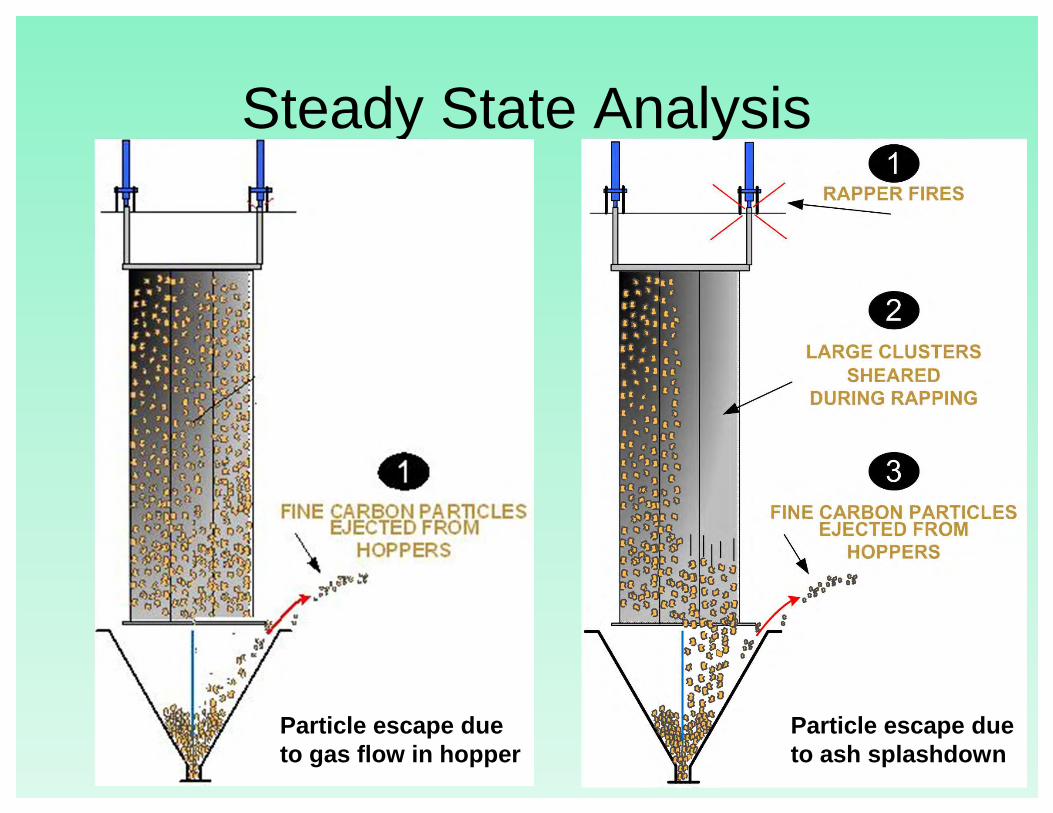
Steady State Analysis
Particle escape due to gas flow in hopper
Particle escape due to ash splashdown

Steady State Analysis
• Performed ash tracking from the hoppers to predict behavior of ash when there is flow under the hopper baffle, subtle recirculation, or “ash splashdown”
• CFD model tracks the particle path of very fine, light weight particles (25 micron, 0.65 SG), “freely-released” in the hoppers, to see where they go– Captured if they hit a wall
– Escape if they leave the hopper
• Metrics used to assess performance– Amount of flue gas flow going under the hopper baffle
– Percent of particles captured versus escaping a hopper
– Residence time of particles in hopper
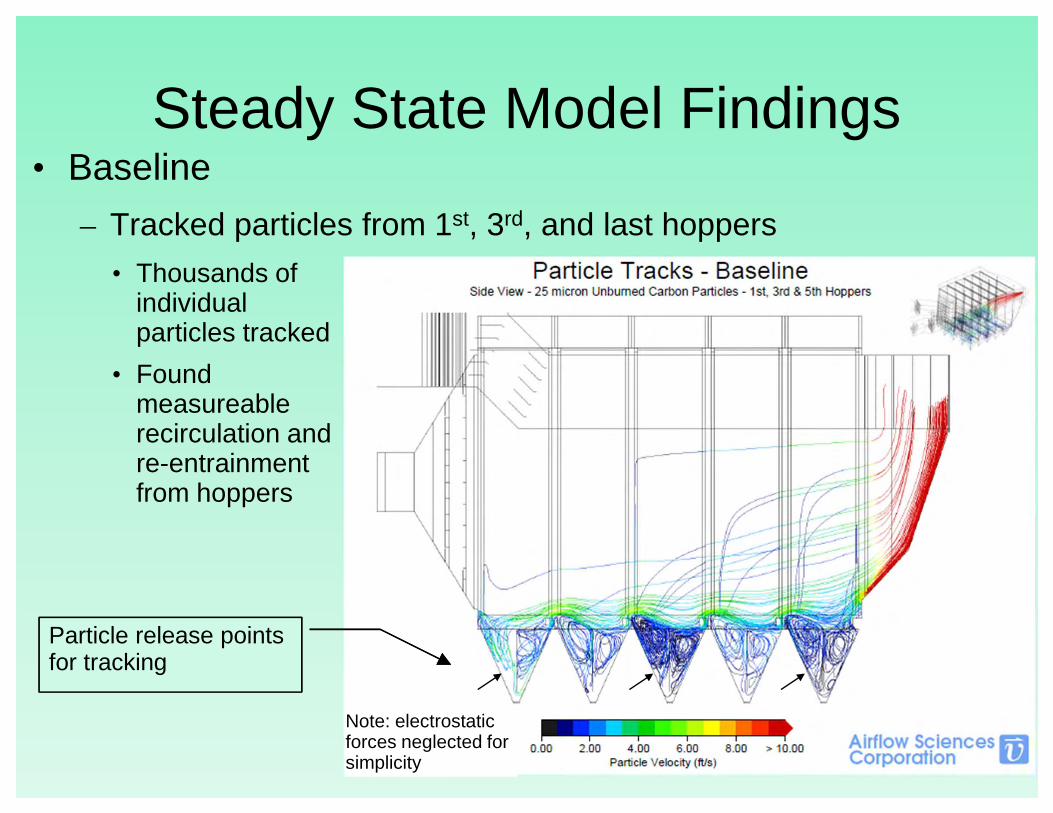
Steady State Model Findings• Baseline
– Tracked particles from 1st, 3rd, and last hoppers
• Thousands of individual particles tracked
• Found measureable recirculation and re-entrainment from hoppers
Note: electrostatic forces neglected for simplicity
Particle release points for tracking

Steady State Model Fixes• Final design:
– ASC inlet kicker baffles
– SoCo hopper baffles
– SoCo hopper grating
• Final design:
– ASC inlet kicker baffles
– SoCo hopper baffles
– SoCo hopper grating
Hopper Baffles (Typ all)
Note: electrostatic forces neglected for simplicity
Kicker Baffles
Hopper Grating (Typ all)

Improvements Seen
• Reduced gas flow under the hopper baffle
• On average, 50% reduction in gas flow under hopper baffle
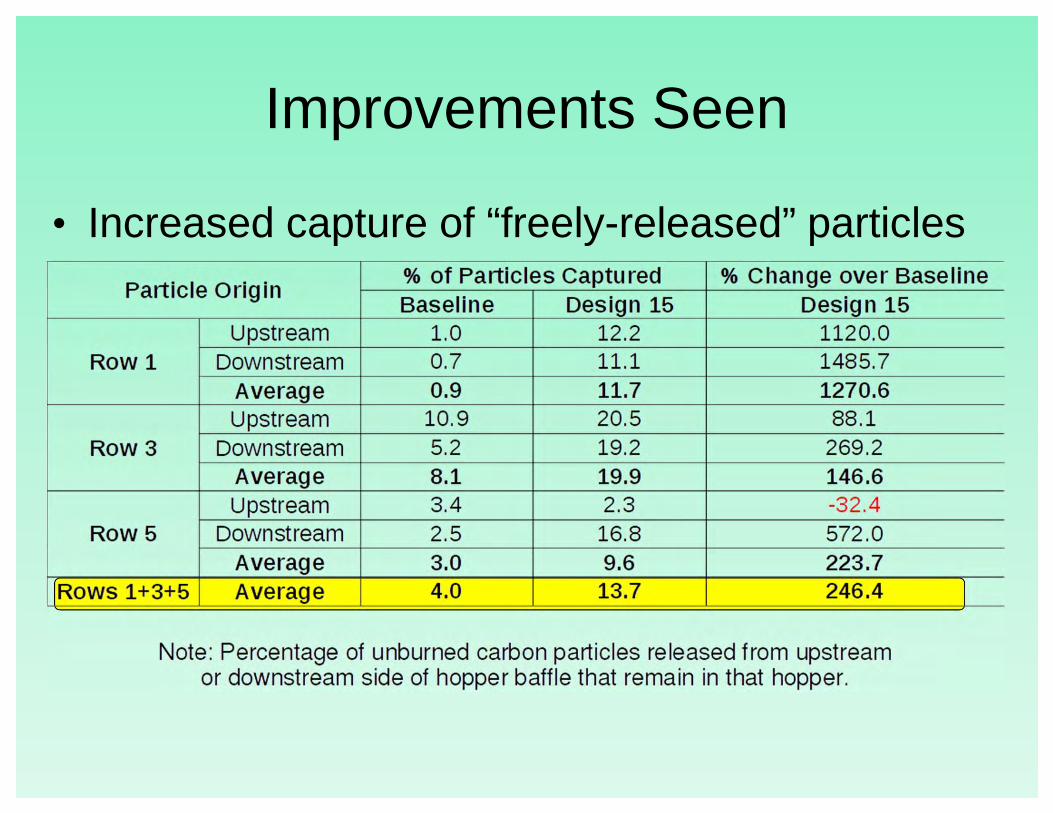
Improvements Seen
• Increased capture of “freely-released” particles
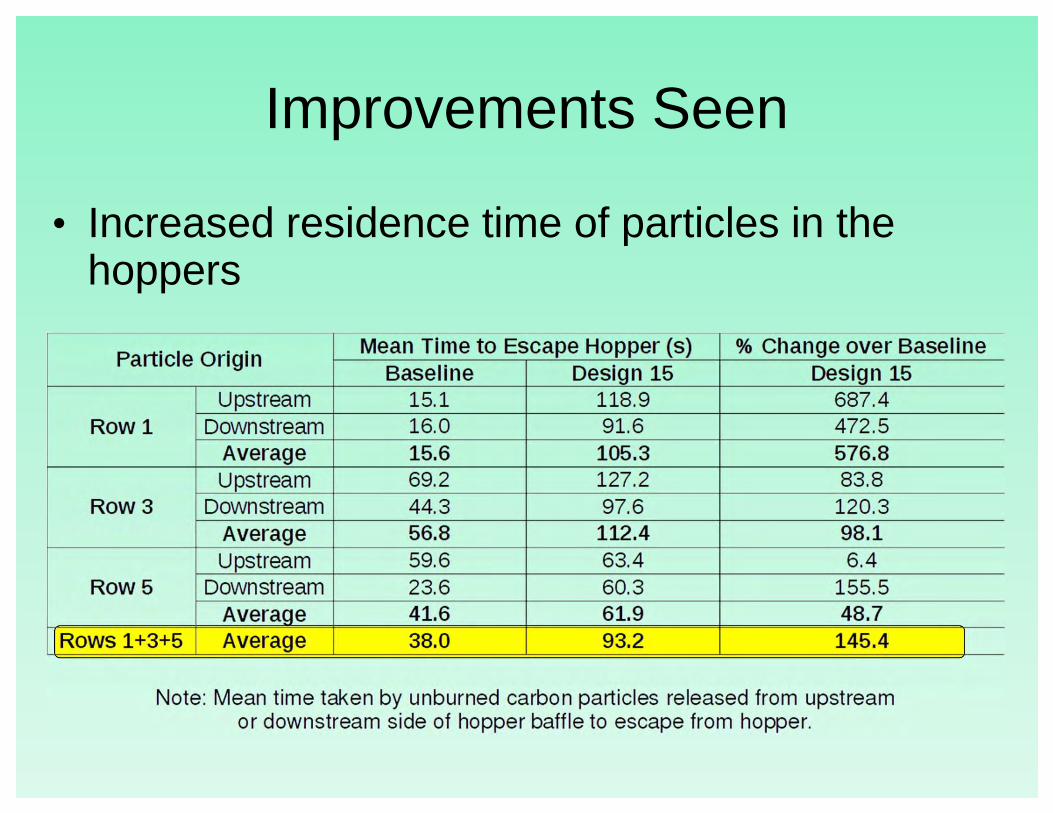
Improvements Seen
• Increased residence time of particles in the hoppers
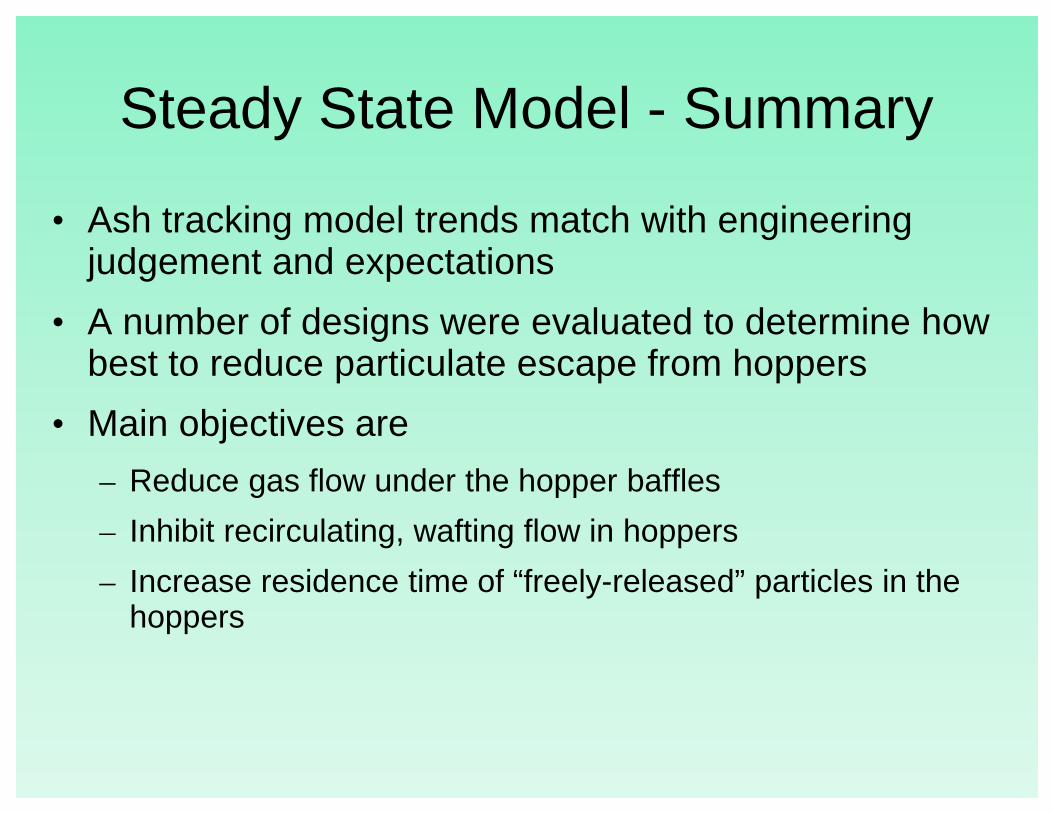
Steady State Model - Summary
• Ash tracking model trends match with engineering judgement and expectations
• A number of designs were evaluated to determine how best to reduce particulate escape from hoppers
• Main objectives are
– Reduce gas flow under the hopper baffles
– Inhibit recirculating, wafting flow in hoppers
– Increase residence time of “freely-released” particles in the hoppers

Transient Analysis
• Focus on hopper gas velocities and pressure pulses caused by rapping of collection plates
• The falling mass of ash from the plates causes an increase in flue gas pressure that pushes gas and particulate under the center baffle and up the opposite side of the hopper
• Highly time dependent and highly complex to model

Transient Modeling
• Reduced model domain with fine geometric details of collection plates, electrodes, and hopper
• Simulate the transient motion of the falling ash sheet and downward momentum of the gas flow – Simulates impact of a select volume of ash falling
– Front and back halves of hopper rapped separately
• What happens in and near the hoppers?– Flue gas velocity patterns change with time
– Velocity and recirculation increase locally, and the amount of flow under the hopper baffle increases
– To quantify impact on ash, freely-release particles in the hoppers per the Ash Tracking Method
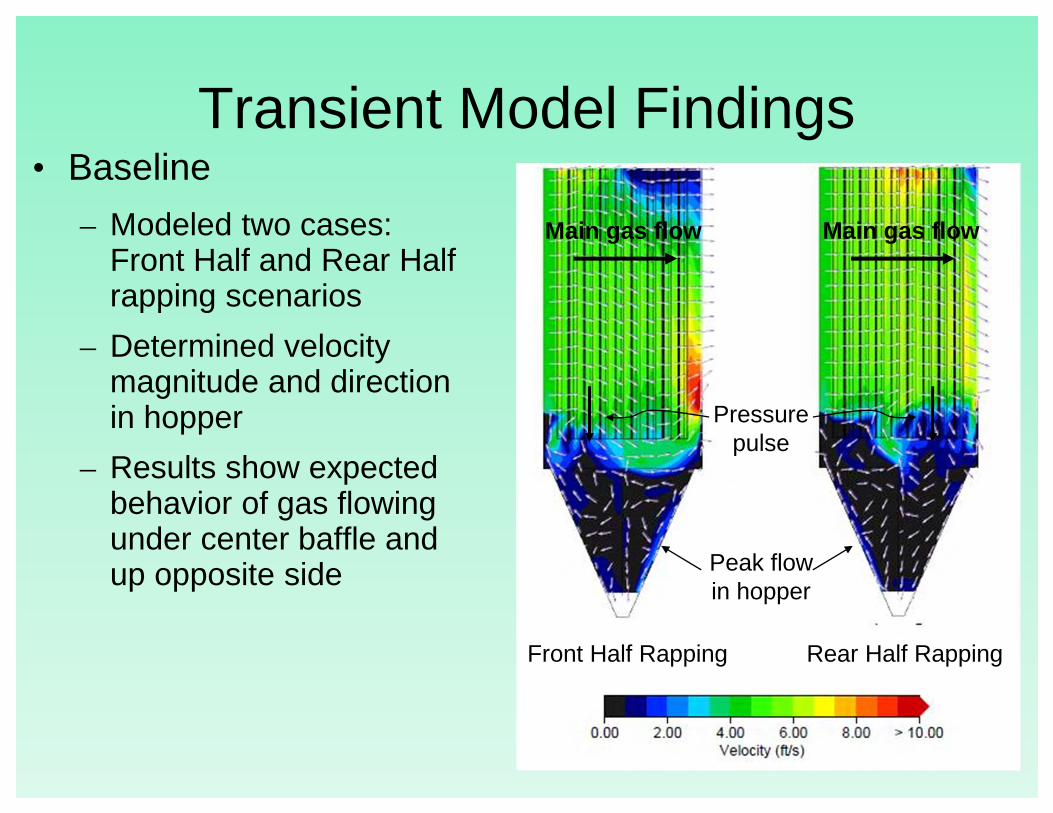
Transient Model Findings• Baseline
– Modeled two cases: Front Half and Rear Half rapping scenarios
– Determined velocity magnitude and direction in hopper
– Results show expected behavior of gas flowing under center baffle and up opposite side
Front Half Rapping Rear Half Rapping
Main gas flow
Pressure pulse
Peak flow in hopper
Main gas flow
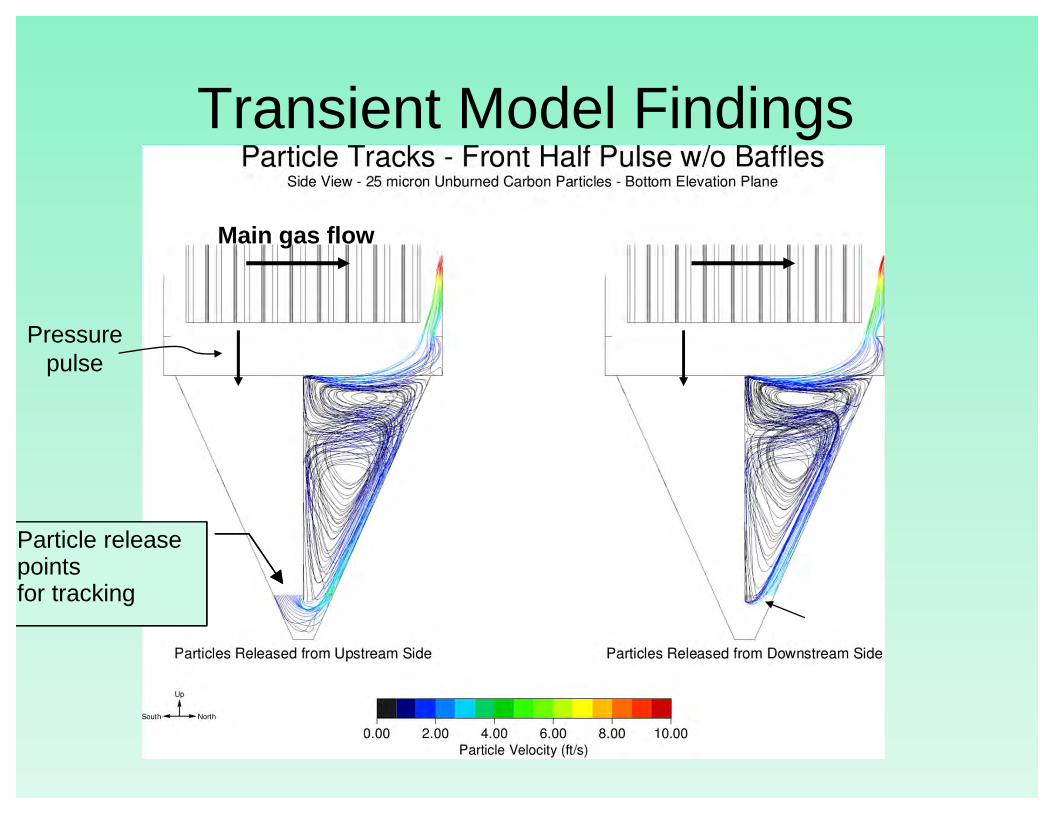
Transient Model Findings
Particle release points for tracking
Main gas flow
Pressure pulse

Transient Model Fixes• Design
– Included hopper baffles and grating
– Peak velocities along hopper slope greatly reduced
– Fewer particles escape hopper
Front Half Rapping Rear Half Rapping
Main gas flow
Pressure pulse
Reduced flow in hopper
Main gas flow

Transient Model Fixes
Particle release points for tracking
Main gas flow
Pressure pulse
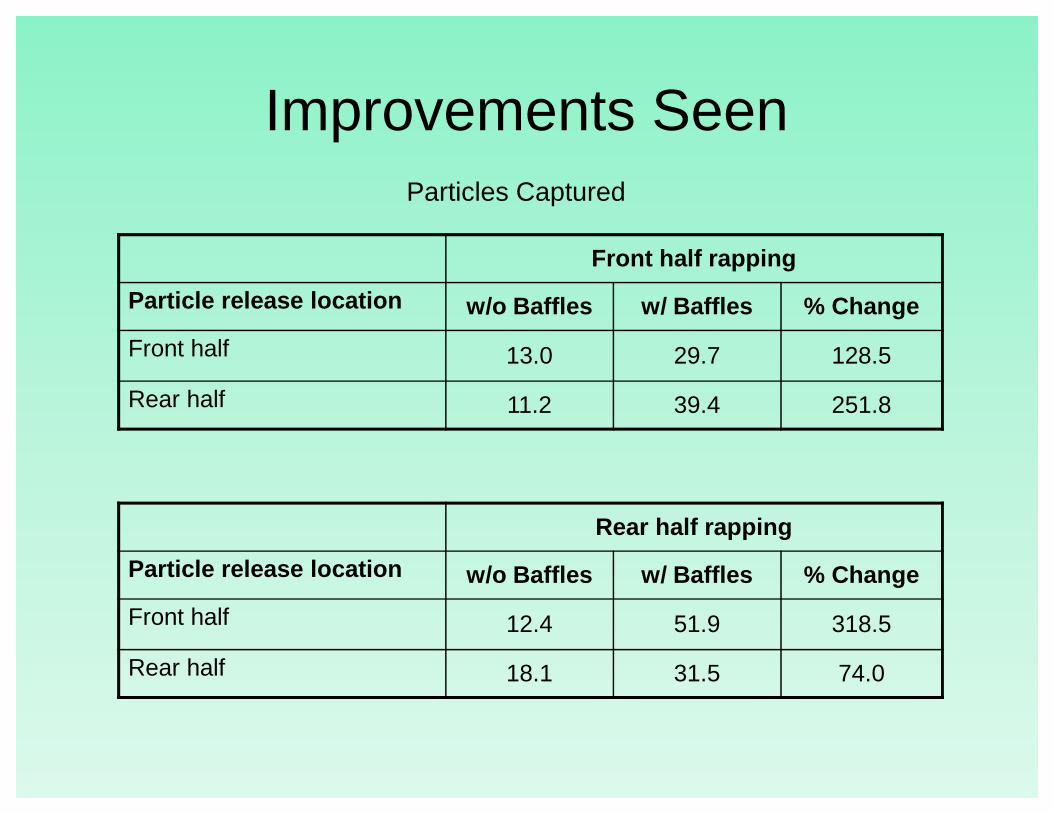
Improvements SeenParticles Captured
Front half rapping
Particle release location w/o Baffles w/ Baffles % Change
Front half 13.0 29.7 128.5
Rear half 11.2 39.4 251.8
Rear half rapping
Particle release location w/o Baffles w/ Baffles % Change
Front half 12.4 51.9 318.5
Rear half 18.1 31.5 74.0

Modeling Conclusions• CFD best practices used to model and optimize gas
flow per ICAC standards
• New methods of CFD modeling and analysis developed to scrutinize fine ash behavior and design devices to improve capture and inhibit re-entrainment– Tracking and statistical analysis of freely-released particles
– Assessment of gas flow under hopper baffles
– Pressure pulse model to simulate transient effects during rapping
• Method applicable to flyash capture, especially light, fine, carbonaceous ash
• Method also believed applicable to fine, light injected species such as PAC
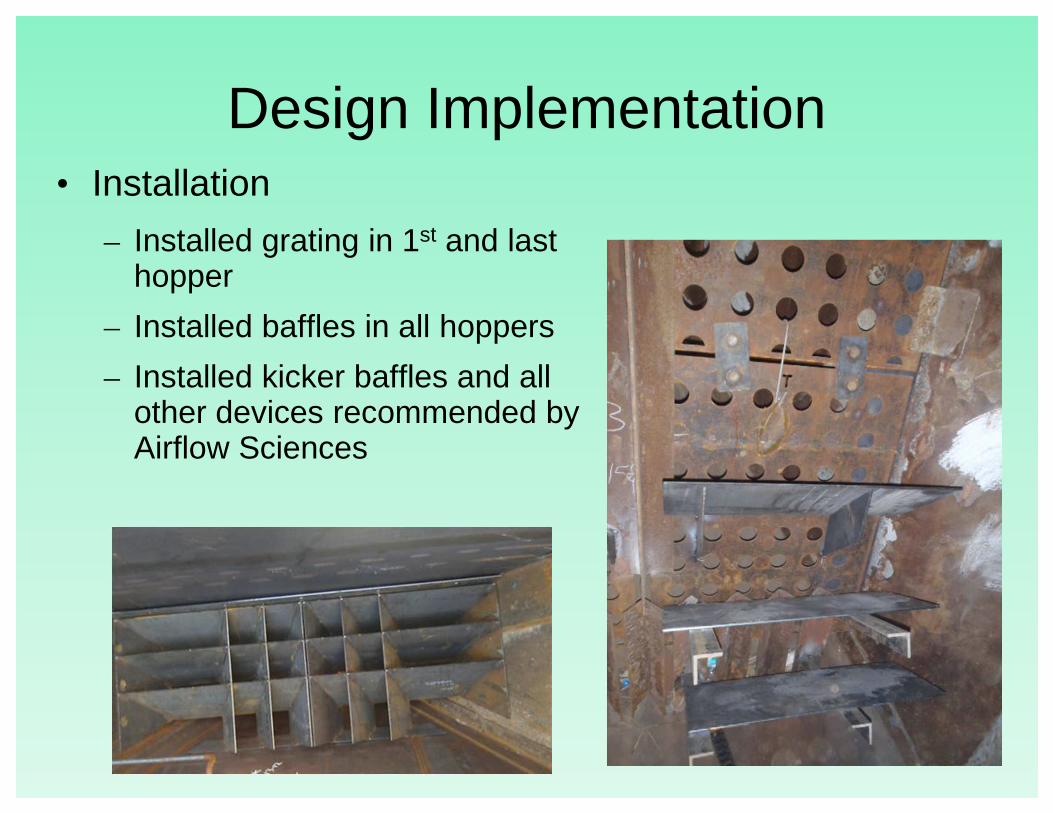
Design Implementation• Installation
– Installed grating in 1st and last hopper
– Installed baffles in all hoppers
– Installed kicker baffles and all other devices recommended by Airflow Sciences

Post Start Up Testing• Method 17 testing was performed 5 weeks after
start up.– Results showed 0.00328 #/mmBTU @ 99.96% eff.

Post Start Up Testing• Percent carbon test was performed on inlets
and outlet of B side– Results showed a low 20%, ~75% below typical
MATS Program
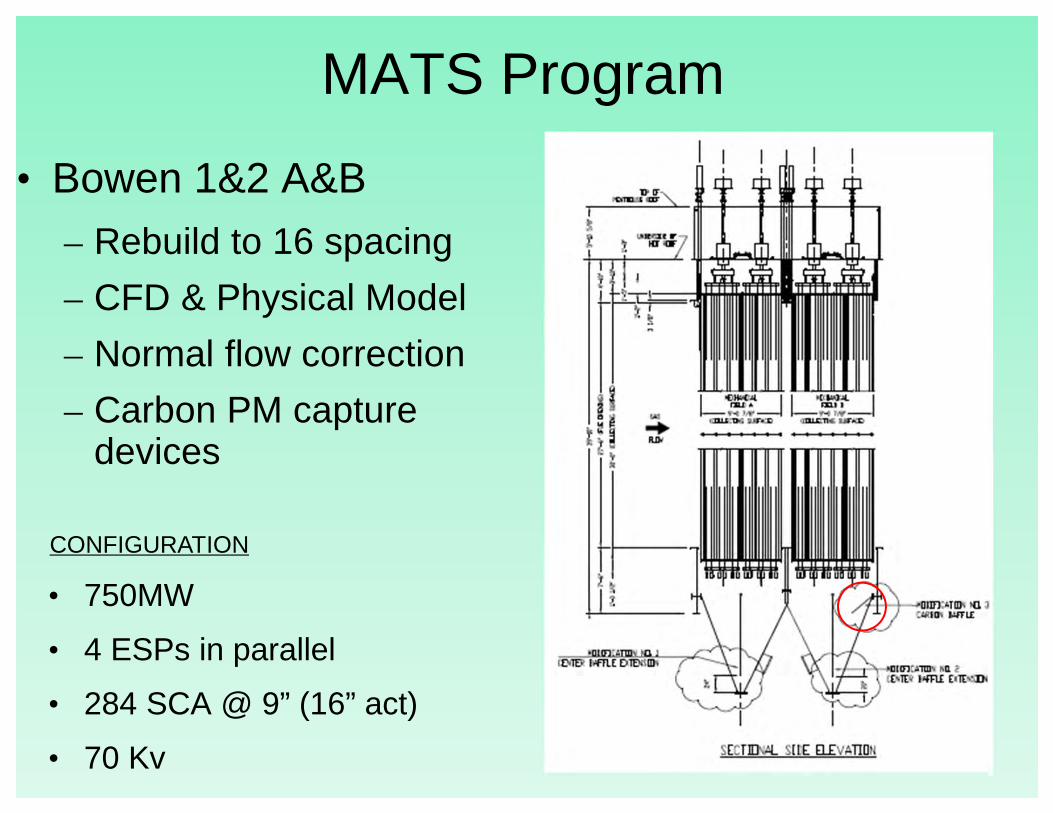
• Bowen 1&2 A&B – Rebuild to 16 spacing
– CFD & Physical Model
– Normal flow correction
– Carbon PM capture devices
• 750MW
• 4 ESPs in parallel
• 284 SCA @ 9” (16” act)
• 70 Kv
CONFIGURATION
MATS Program
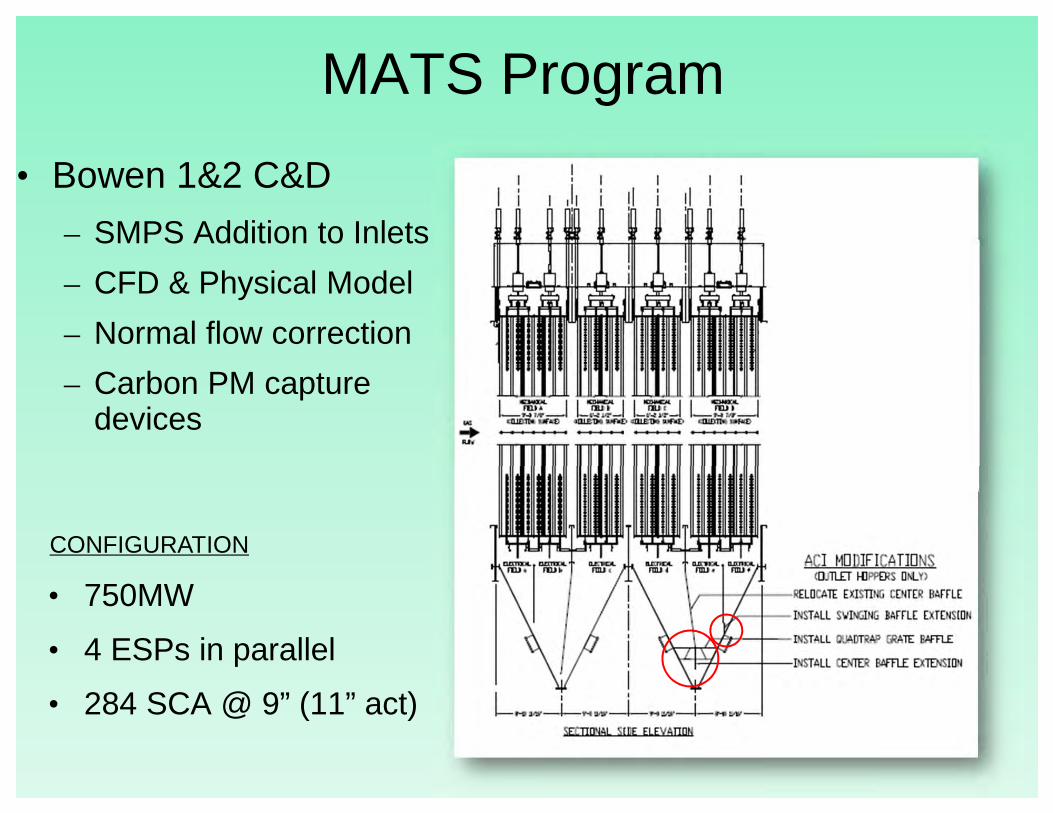
• Bowen 1&2 C&D
– SMPS Addition to Inlets
– CFD & Physical Model
– Normal flow correction
– Carbon PM capture devices
• 750MW
• 4 ESPs in parallel
• 284 SCA @ 9” (11” act)
CONFIGURATION

MATS Program
• 900MW
• 2 ESPs in chevron
• 214 SCA @ 9”
CONFIGURATION
• Wansley 1&2
– Unit 2 Rebuild to 16” spacing, Unit 1 prev. 11” spacing
– CFD & Physical Model
– Normal flow correction
– Carbon PM capture devices
– Outlet rudder vanes

MATS Program
• 100 MW
• Single casings
• 363/299 SCA @ 9”
CONFIGURATION
• Hammond 1-3
– SMPS in inlet fields
– CFD & Physical Model
– Normal flow correction
– Carbon PM capture devices
MATS Program
CONFIGURATION
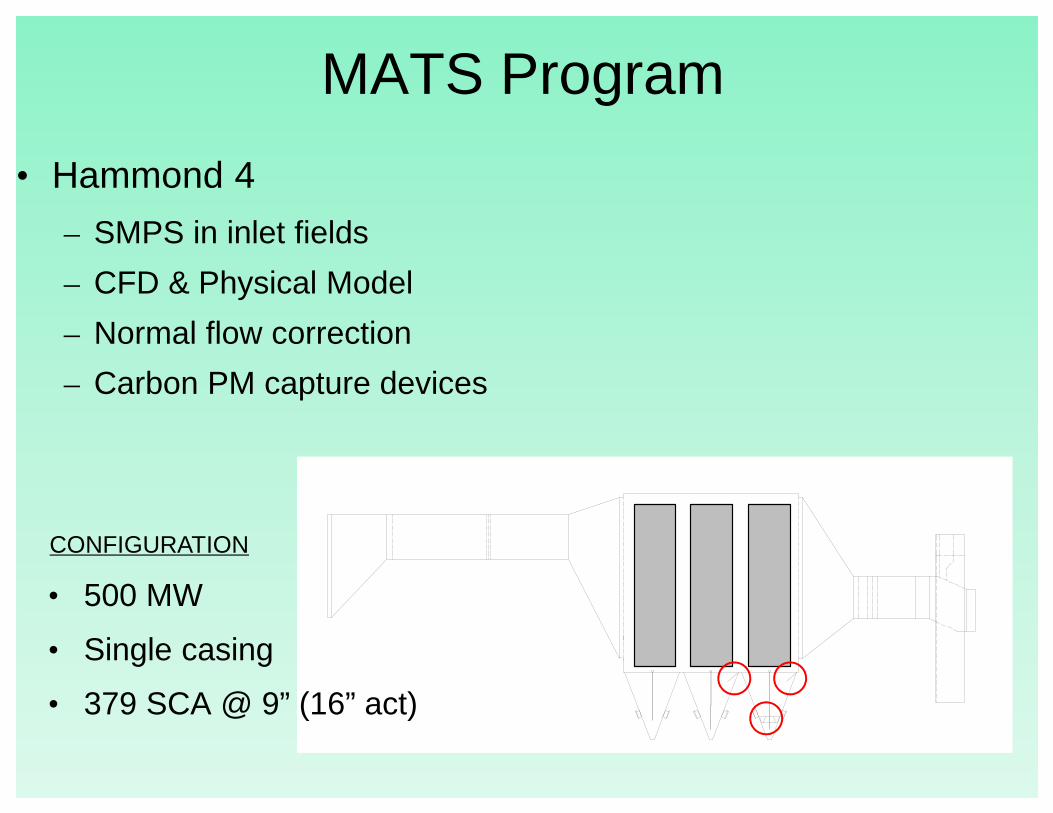
• Hammond 4
– SMPS in inlet fields
– CFD & Physical Model
– Normal flow correction
– Carbon PM capture devices
• 500 MW
• Single casing
• 379 SCA @ 9” (16” act)
MATS Program
• Other projects pending
– Miller 1&2 (Rebuild, conversion to 16” & 83Kv)
– Green County (Hot to cold conversion )
– Barry 4 (ESP mods)

Overall Conclusions
• Special attention is necessary to hopper flows when an ESP faces high LOI or PAC
• Custom design hopper grating, baffling, and flow control devices showed very positive results on Crist Unit 6
• Same CFD & physical modeling approach is being applied system-wide for SoCo MATS compliance with PAC on ESPs