reducing emissions from motor vehicles -...
TRANSCRIPT

10/7/2010
1
Policies for Low Emissions from Motor Vehicles
Policy roadmap for energy efficient motor vehicles
ENERGY EFFICIENCY, CLIMATE AND CHINA’S DEVELOPMENT STRATEGYRealising Technological Innovation and Effective Policy Implementation
Kim Sweeny
Centre for Strategic Economic Studies
Realising Technological Innovation and Effective Policy Implementation
Beijing, 9 September 2010
1
Reducing emissions from motor vehicles
• Introduction
• The challenge in Australia and Chinag
• Roadmaps for electric vehicles and batteries
• Short, medium and long term technology strategies
• Regulatory and economic policies for achieving low emissions: standards, taxes and subsidies
• Research and development initiatives in US, Europe, Japan, China
• Lithium‐ion and future generation battery technologies – Argonne Labs, Fraunhofer Institute Boston Consulting Group ARPA e US Recovery ActFraunhofer Institute, Boston Consulting Group, ARPA‐e, US Recovery Act review
• Conclusions
2

10/7/2010
2
Introduction
• CSES has been undertaking a joint project with Energy Research Institute (part of National Development and Reform Commission) in Beijing on Sustainable Energy Use in China.
• The automotive market in most developed economies has been saturated with growth coming from organic growth and replacement. For developing economies market penetration is still low so demand is growing faster than GDP.
• Australia and China are examples of these two economies and present two very different scenarios for emissions from motor vehicles.
• This shapes the technology and policy responses in each country.
3
The challenge in Australia
• Road transport motor vehicles in the form of cars, cycles, vans, trucks and buses are responsible for 12.6% of GHG emissions in Australia. Domestic air, rail and sea transport accounts for another 1.9%., p
• Passenger vehicles ‐ cars – are 7.7%
• There were 12.0 million passenger vehicles (including SUVs) in March 2009, growing at about 2.5% per annum. Average age is 9.7 years.
4

10/7/2010
3
The challenge in Australia
Projected Australian passenger vehicle fleet, millionsassuming 2% growth per year
20
4
6
8
10
12
14
16
18
67.6%
2000
2010
53.3%
Actual Projected
0
2
1985
1991
1995
1997
1999
2002
2004
2006
2008
2010
2012
2014
2016
2018
2020
2022
2024
2026
2028
2030
5
The challenge in China
6

10/7/2010
4
The challenge in China
• Passenger vehicle fleet in China was 48.5 million at the end of 2009 with sales of about 10.3 million during 2009 (12.6 m in year to July 2010).
China passenger vehicle fleet, millions
Australia10
15
20
25
30
35
40
45
50
0
5
10
1985
1986
1987
1988
1989
1990
1991
1992
1993
1994
1995
1996
1997
1998
1999
2000
2001
2002
2003
2004
2005
2006
2007
2008
2009
7
The challenge in China
• Modelling by ERI assumes that the motor vehicle fleet in China will grow from 49 million in 2010 to 354 million in 2030 (x 7.2) or 323 million under the low carbon scenario.
Projected China passenger vehicle fleet, millions
200
300
400
500
BAU
0
100
200
2005
2010
2020
2030
2040
2050
Low carbon
8
10/7/2010
5
Different challenges
• Fleet in China in 2030 is 7.2 times 2010 value compared to 1.5 times in Australia
• To maintain 2010 emission levels, the Chinese fleet in 2030 needs to emit 14% of 2010 levels compared to 68% for Australian fleet
• While Australia could meet a target like this by using currently available technologies, China can only do so by a coordinated and rapid move to fully electric vehicles embodying technology improvements resulting from a focussed R&D effort .
9
Responses to the problem
• Two interlinked responses to reducing emissions from motor vehicles –engineers and economists
• Development of new technologies or improvement to existing technologies for engines and fuels – set out in technology roadmaps.
• Policies to encourage development and greater use of new vehicles and fuels and to influence demand for transport
10

10/7/2010
6
Technology roadmaps
• Roadmaps have been developed by Governments and industry and others in Europe, USA and elsewhere.
• These range from comprehensive analyses covering all transport modes and technologies such as the International Energy Agency (2009), electric vehicles Japan (2008), batteries for electric vehicles – EC (2009) and US DOE (2008), to lithium‐ion batteries for electric vehicles ‐ Fraunhofer Institute (2010)
• One of the most developed strategies is in the United Kingdom which has made a commitment to reduce GHG emissions from all sources by at least 34% by 2020 and 80% by 2050.
• In July 2009 the UK Government released its Carbon Reduction Strategy for• In July 2009, the UK Government released its Carbon Reduction Strategy for Transport. It incorporates European emission targets of 130 g CO2/km from 2012 to 95 g/km by 2020
• Includes UK OEM Consensus Technology Roadmap, identifying priorities and timing of technology development and R&D program
11
Technology roadmaps
Source: New Automotive Innovation and Growth Team 2009 12

10/7/2010
7
Technology strategies
Short term carbon reduction strategies
• GHG emissions could be reduced by 25% if consumers bought• GHG emissions could be reduced by 25% if consumers bought the make with the most fuel efficient technology within each model class – scope to mandate emission levels within current technologies.
• 30% reductions with adoption of most efficient technologies and near term technologies – eg mild hybrid incorporating electric stop‐start biofuelselectric stop‐start, biofuels
• Reduction required for Australia to have 2030 levels at 2010 levels.
13
Technology strategies
Medium term carbon reduction strategies
• Hybrid and fully electric vehicles• Hybrid and fully electric vehicles
• Needs improvements in battery technology with respect to cost, weight, energy density, and recharge times
• GHG benefits depend strongly on how electricity is generated
14

10/7/2010
8
Technology strategies
Longer term decarbonisation strategies
• Hydrogen powered vehicles• Hydrogen powered vehicles
• Hydrogen as fuel is possible reasonably soon but on‐board storage, generation and distribution infrastructure are major issues
• If hydrogen produced by electrolysis of water then GHG benefits depend strongly on how electricity is generated
• Fuel cells are still expensive and again the benefits depend on how the hydrogen is manufactured
15
Policies to reduce emissions
• The UK Energy Research Centre (ERC) has written a thorough review of over 500 reports and papers on policies for reducing carbon emissions from road transport.
• In their March 2009 report, they review the evidence for reducing carbon emissions and the cost‐effectiveness of policies divided into two categories – (i) those that target car technology and consumer choice of cars and (ii) those that target wider travel choices.
• They found that the evidence for the first category of policies was better than for the second category.
• The review concentrates on transport policies but recognises that land use planning pays a significant role in effecting the demand for travel, choice of travel mode and the viability of public transport.
16

10/7/2010
9
Policies to reduce emissions
CSES has concentrated on 5 major policy areas
1. Carbon emission and fuel efficiency standards for vehicles
2. Vehicle purchase taxes and registration fees
3. Fuel taxes and subsidies
4. Development of alternative fuel infrastructure
5. Promotion of alternative transport modes
• R&D programs to accelerate development of technology
17
Carbon emission standards
• Carbon emission and fuel efficiency standards for vehicles.
• Different standards defined in different ways in different countries –yfootprint versus weight. Some are mandatory some are not.
• European (130 g/km in 2015, 95 in 2020 NEDC cycle) and Japanese (125) standards targets are the strictest. USA (172 in 2016) and Australia (180 in 2010) are the worst.
• China to implement corporate average standard 167 g/km by 2015.
• Japanese Top Runner program provides template for setting standards –not only for motor vehicles – computers, whitegoods, air conditioners, y p , g , ,space heaters, electric toilet seats etc.
18
10/7/2010
10
Carbon emission standards
• Economists like standards because they do not involve choosing technology winners – leave this to the manufacturers. Engineers like roadmaps
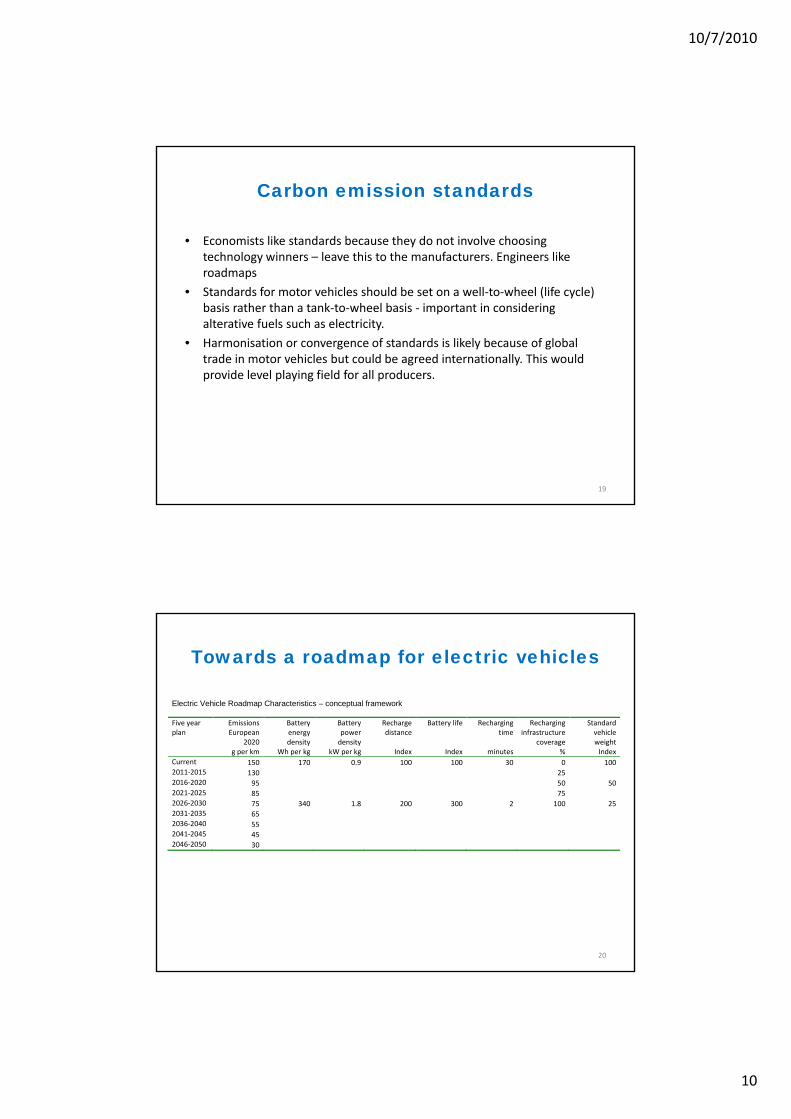
• Standards for motor vehicles should be set on a well‐to‐wheel (life cycle) basis rather than a tank‐to‐wheel basis ‐ important in considering alterative fuels such as electricity.
• Harmonisation or convergence of standards is likely because of global trade in motor vehicles but could be agreed internationally. This would provide level playing field for all producers.
19
Towards a roadmap for electric vehicles
Electric Vehicle Roadmap Characteristics – conceptual framework Five year plan
Emissions European
Battery energy
Battery power
Recharge distance
Battery life Recharging time
Recharging infrastructure
Standard vehicleplan European
2020 g per km
energy density
Wh per kg
power density
kW per kg
distance
Index Index
time
minutes
infrastructure coverage
%
vehicle weight Index
Current 150 170 0.9 100 100 30 0 100 2011‐2015 130 25 2016‐2020 95 50 50 2021‐2025 85 75 2026‐2030 75 340 1.8 200 300 2 100 25 2031‐2035 65 2036‐2040 55 2041‐2045 45 2046‐2050 30
20

10/7/2010
11
Rebates and fees for manufacturers -“Feebate”
• Vehicle taxes and subsidies based on a standard are used to influence consumer choice.
• Can be designed to be revenue neutral.
• Supplement to emissions standards
• Adopted to varying degrees in France, Germany, UK, Canada, USA
• A review by ICCT in April 2010 proposed an idealised feebate program based on experiences to date in various countries
International Council on Clean Transportation Best Practices for Feebate Program Design and Implementation, April 2010
21
Rebates and fees for manufacturers -“Feebate”
International Council on Clean Transportation Best Practices for Feebate Program Design and Implementation, April 2010
22

10/7/2010
12
Rebates and fees for manufacturers -“Feebate”
International Council on Clean Transportation Best Practices for Feebate Program Design and Implementation, April 2010
23
Fuel taxes and subsidies
• Standards control the efficiency of the vehicle but not how many there are or how far they are driven
• There are a range of measures to make transport more expensive by making cars and fuel more expensive and/or to encourage alternative transport modalities
• Problem is that the price elasticity of petrol is low in the short run at least and still pretty low in the long run.
• Therefore you need a large increase in the price of petrol to get a significant reduction in use.
• This is very difficult for Governments to do politically, not least because of equity problems.
24

10/7/2010
13
Research and development
• Both companies and government have invested heavily in R&D for the development of low carbon emission transport, especially for passenger vehicles.
• The US DOE Vehicle Technologies Program supports the FreedomCAR and Fuel Technical Partnership which has among other goals to develop “electric drivetrain energy storage with 15‐year life at 300 Whr per vehicle with discharge power of 25 kW for 18 seconds and $20/kW”. The partnership includes car companies, the DOE, energy companies and utilities.
• The European Green Car initiative is providing support for a Euro 1 billion R&D program which will include projects on electric vehicles and high densityprogram which will include projects on electric vehicles and high density batteries
• In Japan the Next‐Generation Vehicle and Fuel Initiative included 5.3 billion yen for a technology‐development project for next‐generation batteries aiming by 2030 to increase battery performance by 7 times and cost reduced to 5%.
25
Research and development
• Similar programs have been announced in China.
• Dongfeng Automobile will invest 3 billion yuan in building capacity for electric vehicles aiming to produce 50,000 by 2015
• The Government through SASAC will provide up to 100 billion RMB (USD 15 billion) over the next few years to an alliance among 16 major Government‐owned organisations to do research and development on electric and hybrid vehicles, fuel cells and charging systems, and create standards for electric and hybrid vehicles.
• The alliance includes vehicle manufacturers China FAW Group Corp and Dongfeng Auto Corp as well as oil producers, power companies, and several military and aviation companies. The group involved in battery research includes the China National Offshore Oil Corporation, Beijing Nonferrous Metal Research Institute, China Aerospace Science and Technology Corporation, China Aerospace Science and Industry Corporation and China Aviation Industry Corporation.
26
10/7/2010
14
China’s advantages
• Roland Berger consultants have reviewed the plans by China to become a market leader in electric vehicles (April 2009).to become a market leader in electric vehicles (April 2009).
• China has competitive advantages in electrified powertrainsand particularly in Lithium‐ion batteries which are expected to be the dominant means of energy storage in electric vehicles.
• BYD is leading in the development of LiFePO4 batteries and has developed both hybrid and fully electric passenger cars
27
Lithium-ion activity in China
• Argonne Laboratories reviewed Lithium‐ion technology in China in 2008ion technology in China in 2008
• There are major research centres at Tsinghua University, Tianjin Institute of Power Sources, Tongji University, GRINM, Beijing Institute of Technology, China Electrotechnical Society and associated spin‐off companies and joint venturesp p j
• There are “several hundred” manufacturers ‐ the bigger ones being BYD, Tianjin Lishen Battery, Shenzhen BAK Battery, Shenzhen B&K Technology
28
10/7/2010
15
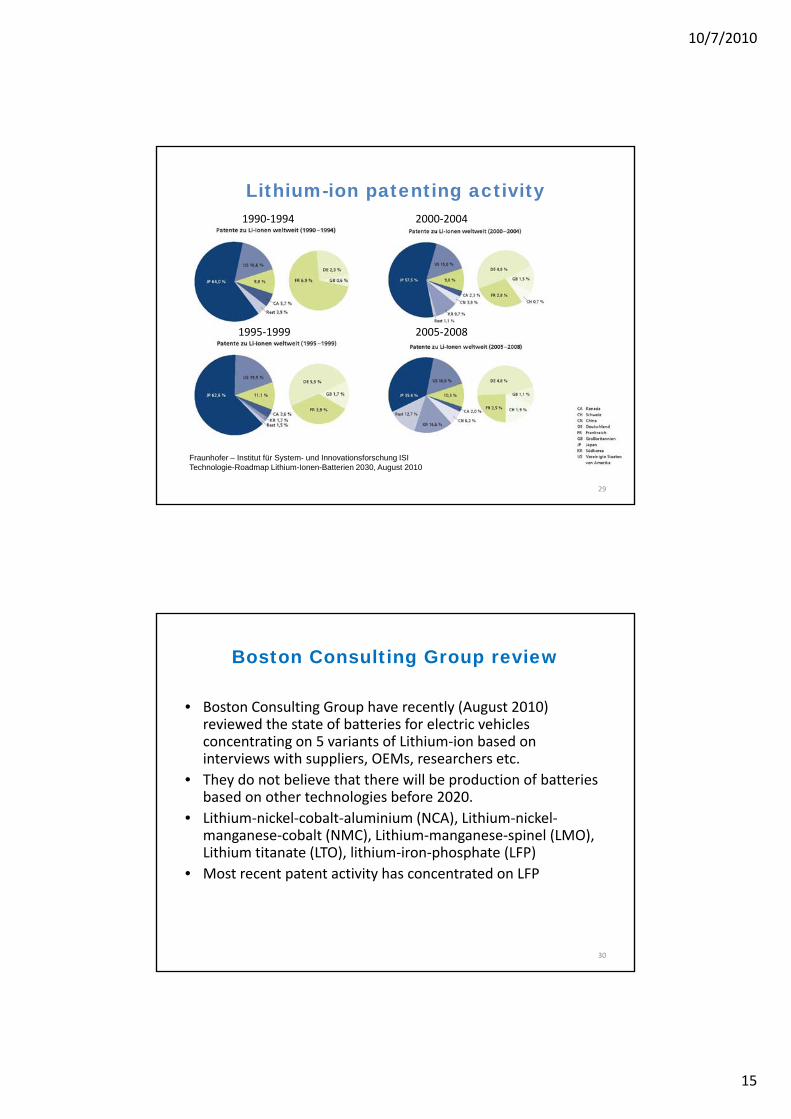
Lithium-ion patenting activity1990‐1994 2000‐2004
1995‐1999 2005‐2008
Fraunhofer – Institut für System- und Innovationsforschung ISITechnologie-Roadmap Lithium-Ionen-Batterien 2030, August 2010
29
Boston Consulting Group review
• Boston Consulting Group have recently (August 2010) reviewed the state of batteries for electric vehicles concentrating on 5 variants of Lithium‐ion based on interviews with suppliers, OEMs, researchers etc.
• They do not believe that there will be production of batteries based on other technologies before 2020.
• Lithium‐nickel‐cobalt‐aluminium (NCA), Lithium‐nickel‐manganese‐cobalt (NMC), Lithium‐manganese‐spinel (LMO), Lithium titanate (LTO) lithium iron phosphate (LFP)Lithium titanate (LTO), lithium‐iron‐phosphate (LFP)
• Most recent patent activity has concentrated on LFP
30

10/7/2010
16
Boston Consulting Group review
• Batteries were assessed on 6 criteria:
• Safety• Safety
• Life span (number of charge/discharge cycles and overall life)
• Performance (peak power)
• Specific energy (energy stored per kg)
• Specific power (power stored per kg)
• Cost
31
Boston Consulting Group review
32

10/7/2010
17
Boston Consulting Group review
• No battery technology is superior on all criteria
• LFP is probably the safest• LFP is probably the safest
• Life span is a key criterion with manufacturers aiming at a 10‐year lifespan. Replacement strategies such as leasing could remove this constraint.
33
Future generation battery technologies
• The limits of current lithium‐ based batteries are likely to be reached by 2015‐2020.
• Other battery technologies will need to be developed to meet emission standards
• ARPA‐ e* workshop in November 2009 highlighted a number of future technologies
• Lithium‐air, lithium‐sulfur, lithium‐metal and • Zinc‐air, and molten metal such as sodium nickel chloride
* Advanced Research Projects Agency‐Energy
34

10/7/2010
18
ARPA-e workshop conclusions
• Lithium‐ion batteries have significant room for continued improvement to meet USABC Long Term EV Battery Targets.
• Li‐S battery technology is continually maturing in energy density and cycle life
• Li‐Air technology is still in its early stages. Large prize in terms of energy density at the end of the tunnel.
• Zn‐Air/Metal‐Air: strong promise and good progress to date, opportunities in metals other than Zn needs more exploration.
• Na‐NiCl2 batteries – strong recent progress and many positive attributes; g p g y p ;thermal management is an issue and makes fleet applications most appealing.
• For the U.S. to regain battery manufacturing leadership, novel high performance battery architectures and new manufacturing processes need to be developed and deployed domestically
35
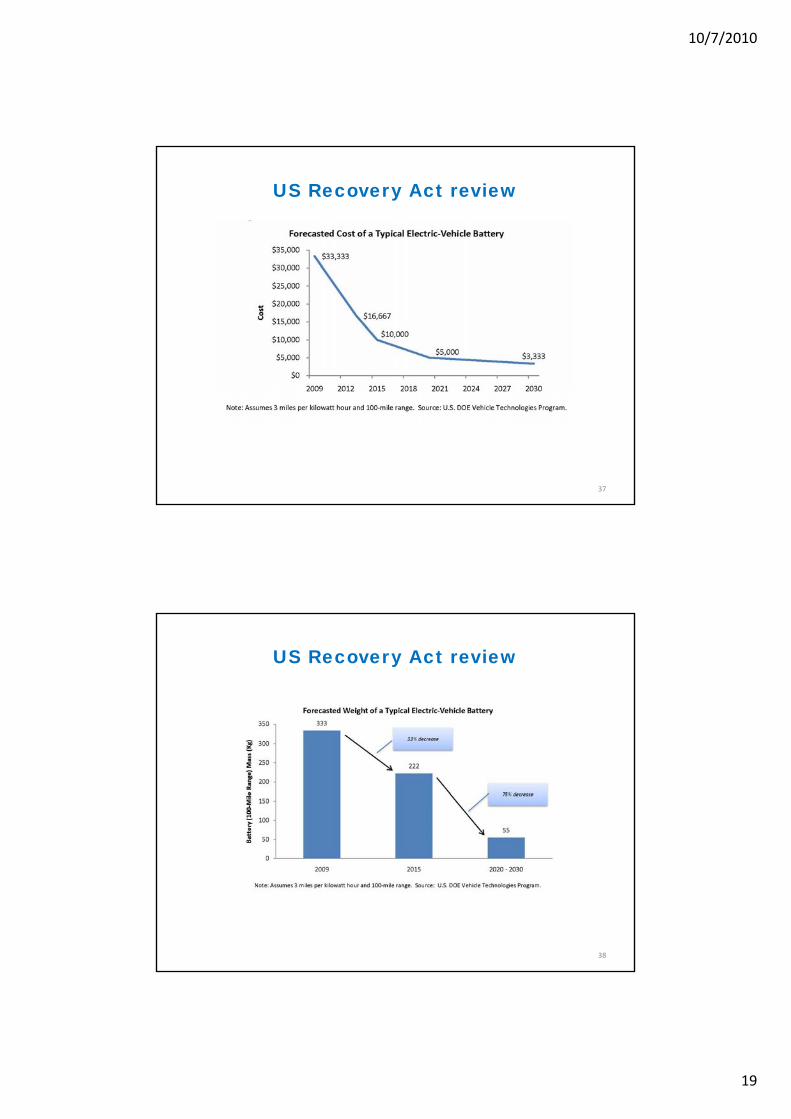
US Recovery Act review
• The US Recovery and Reinvestment Act passed in February 2009 provided $2 billion to support the development of 302009 provided $2 billion to support the development of 30 factories to produce advanced batteries and electric drive components. By 2015 they should support up to 500,000 PHEV.
• In addition Advanced Technology Vehicle Manufacturing program is providing $2.4 billion in loans to support manufacturing electric cars, eg the Nissan Leaf. g , g
• A further $400 m is being used to support 20,000 electric vehicle charging stations by 2012.
36
10/7/2010
19
US Recovery Act review
37
US Recovery Act review
38

10/7/2010
20
US Recovery Act review
39
Conclusions
• Timing of introduction of new automotive technologies and their uptake in the market depends on the timing and level oftheir uptake in the market depends on the timing and level of GHG targets and accompanying Government policies
• If the goal is to reduce emissions from transport, then medium and longer term solutions depend not only on the development of automotive technology but on how electricity is generated.
40

10/7/2010
21
Chinese electric vehicle manufacturersGreat Wall Motors, Baoding: Kulla model
It has a 48V DC motor and can go up to 87 miles (140 km) with a speed of 40 mph (65 km/h) in a single charge. It features an advanced lithium‐ion battery pack, and when combined with the DC motor, will produce 67 horsepower. The car can be quick‐charged to 70 percent of capacity in 10 minutes. A full charge takes five to six hours.
41
Chinese electric vehicle entrepreneurs Baoding
They run on an array of 10 traditional lead‐acid car batteries. The cars retailed for 16,800 to 29,800 yuan ($2,500 ‐ $4,440), but typically gave discounts. The setup is pretty basic: a car with a radio, the necessary lighting and windshield wipers. No heater or air conditioner.
42

10/7/2010
22
Thanks very much to the CSES team
Dr Jiang AlexRobDavid
Bhajanj
43
Peter(s)
44

10/7/2010
23
Kim
45