reducing bias in population and landscape genetic
TRANSCRIPT

Submitted 15 December 2015Accepted 24 February 2016Published 14 March 2016
Corresponding authorWilliam PetermanPeterman73osuedu
Academic editorJohn Measey
Additional Information andDeclarations can be found onpage 15
DOI 107717peerj1813
Copyright2016 Peterman et al
Distributed underCreative Commons CC-BY 40
OPEN ACCESS
Reducing bias in population andlandscape genetic inferences the effectsof sampling related individuals andmultiple life stagesWilliam Peterman12 Emily R Brocato2 Raymond D Semlitsch2 andLori S Eggert2
1 School of Environment and Natural Resources The Ohio State University Columbus OH United States2Division of Biological Sciences University of Missouri - Columbia Columbia MO United States
ABSTRACTIn population or landscape genetics studies an unbiased sampling scheme is essentialfor generating accurate results but logistics may lead to deviations from the sampledesign Such deviationsmay come in the formof samplingmultiple life stages Presentlyit is largely unknown what effect sampling different life stages can have on populationor landscape genetic inference or how mixing life stages can affect the parametersbeing measured Additionally the removal of siblings from a data set is consideredbest-practice but direct comparisons of inferences made with and without siblings arelimited In this study we sampled embryos larvae and adult Ambystoma maculatumfrom five ponds in Missouri and analyzed them at 15 microsatellite loci We calculatedallelic richness heterozygosity and effective population sizes for each life stage at eachpond and tested for genetic differentiation (FST and DC) and isolation-by-distance(IBD) among ponds We tested for differences in each of these measures between lifestages and in a pooled population of all life stages All calculations were done withand without sibling pairs to assess the effect of sibling removal We also assessed theeffect of reducing the number of microsatellites used to make inference No statisticallysignificant differences were found among ponds or life stages for any of the populationgenetic measures but patterns of IBD differed among life stages There was significantIBD when using adult samples but tests using embryos larvae or a combination ofthe three life stages were not significant We found that increasing the ratio of larval orembryo samples in the analysis of genetic distance weakened the IBD relationship andwhen using DC the IBD was no longer significant when larvae and embryos exceeded60of the population sample Further power to detect an IBD relationshipwas reducedwhen fewer microsatellites were used in the analysis
Subjects Conservation Biology Ecology GeneticsKeywords Ambystoma Sibship Complex life cycle Amphibian Landscape geneticsMicrosatellite Mixing tissue samples Genetic sampling Population genetics Salamander
INTRODUCTIONAn overarching goal of any study is to obtain accurate unbiased estimates of the parametersof interest In population and landscape genetics it is often recommended that 25ndash30
How to cite this article Peterman et al (2016) Reducing bias in population and landscape genetic inferences the effects of sampling re-lated individuals and multiple life stages PeerJ 4e1813 DOI 107717peerj1813
individuals be sampled from each population (Hale Burg amp Steeves 2012) For manyspecies or systems it is often easiest to meet these requirements by sampling early life stages(eg eggs or larvae) that can be found in abundance within a discrete area However manyorganisms experience extremely high mortality in these early life stages Most amphibianfish and insect species are characterized by Type III survivorship in which a majority ofyoung individuals will die before reaching sexual maturity and the genetic characteristics ofthese life stages may differ from the few surviving adults due to the decrease in populationsize (Frankham 1996) While it may often be assumed that selection pressures that reducepopulation size act uniformly and randomly selection may differentially affect individualsFor example numerous studies have assessed the role of inbreeding and heterozygosity onindividual fitness (eg Balloux Amos amp Coulson 2004 Ficetola et al 2011 Harrison et al2011 Slate et al 2004) Both of these population genetic attributes are particularly relevantin species of conservation concern which often exist in small or isolated populations Giventhe interaction between selection pressures and genetic diversity it is not unreasonable tobelieve that population genetic measures may differ depending on the age or life stage ofthe sampled cohort
Despite the potential problems with sampling different life stages it is not uncommonfor population or landscape genetic studies to combine samples from different cohortsor life stages either because of convenience or necessity Early life stages are oftensampled because they are accessible abundant and cost-effective (Heyer et al 1994)In amphibians the extreme decline in individuals from early life stages to adults has beenwell-documented Peterson et al (1991) found a pre-metamorphic mortality rate of 99 inringed salamanders (Ambystoma annulatum) Shoop (1974) found that pre-metamorphicmortality rates ranged from 87ndash99 in spotted salamanders (A maculatum) and Berven(1990) recorded pre-metamorphic mortality rates ranging from 97ndash99 in wood frogs(Rana sylvatica) The drastic decline in abundance can also be seen in fish and insectsDahlberg (1979) found a mortality rate of gt99 in the eggs of many fish species whilea study of the southern green stink bug (Nezara viridula) found mortality rates to be ashigh as 96 (Kiritani amp Nakasuji 1967) As such when early life stages are sampled tomake inferences about the adult population biased conclusions may result (Allendorf ampPhelps 1981 Goldberg amp Waits 2010) Obtaining unbiased estimates of genetic diversity isparticularly critical for management and conservation of species
Sampling animals from the field is often opportunistic due to the availability of thetarget species Environmental factors stochastic events or the timing of offspring can alterwhen a life stage becomes available if it can be found at all (Mullins Pierce amp Gutzwiller2004) In these cases researchers often need to stray away from their sampling scheme andtarget life stage and collect other life stages to reconcile the sample size gap (eg Lee-Yawet al 2009 Richardson 2012) Despite the relative commonness of these sampling realitiesthe effect of mixing life stages in population and landscape genetic analyses has not beenexplicitly addressed The sampling of full siblings has been shown to affect the estimates ofpopulation genetic parameters (Goldberg amp Waits 2010)When sampling amphibians fieldresearchers have the highest probability of collecting sibling pairs within larvae (Goldberg ampWaits 2010) related larvae are often spatially clustered and samples collected at a specific
Peterman et al (2016) PeerJ DOI 107717peerj1813 219
location may be biased towards a single family group (Hansen Nielsen amp Mensberg 1997)If researchers are unaware that family groups are being sampled the genetic structure of thefamily could be misinterpreted as population structure within the panmictic population(Anderson amp Dunham 2008) To prevent misinterpretations and avoid biased populationgenetic parameter estimates it has been suggested that samples be screened prior to analysisand full siblings removed (Goldberg amp Waits 2010)
To date only Goldberg amp Waits (2010) have empirically tested the effects of samplingdifferent life stages in amphibians (one frog and one salamander species) and quantified theimportance of removing full siblings prior to analysis The primary objective of this studywas to determine the effects of pooling different life stages on population and landscapegenetic inferences Additionally we sought to extend the findings of Goldberg amp Waits(2010) to determine the effect of sampling three life stages in amphibians adults embryosand larvae on population and landscape genetic inferences We assessed these objectivesboth with and without full-sibling pairs present in the data set and also assessed howinferences are affected by reducing the number of microsatellites used for analysis Wepredicted that the randommixing of life stages would result in genetic parameter estimatesthat did not differ from estimates of individual life stages However we predicted that therewould be significant biases present when sampling different life stages as certain alleles arelikely to be over-represented in the embryonic and larval life stages Finally we predictedthat the removal of siblings from the data set would significantly alter population andlandscape genetic estimates by increasing average allelic richness and heterozygosity withina sampled population as well as increasing the average genetic differentiation amongpopulations
MATERIALS AND METHODSEthics statementThis research was conducted in compliance with all laws and regulations for the state ofMissouri and the USA and was conducted under Missouri Wildlife Collectorrsquos permit15584 Sampling methods were approved by the University of Missouri Animal Care andUse Committee (Protocol 7403)
Data availabilityAll data and code used in this study can be accessed from Figshare at httpsdxdoiorg106084m9figshare1621318v2
Literature reviewTo determine how researchers are currently collecting tissue samples from amphibians withcomplex life cycles we conducted a literature search of the Scopus database of populationand landscape genetic studies of amphibians We used the search terms lsquolsquoamphibiarsquorsquo(occurring in the title abstract or keywords) lsquolsquomicrosatellitersquorsquo (occurring in all fields)and NOT lsquolsquoreptilrsquorsquo (occurring in the title abstract keywords) and limited the search tofindings from Molecular Ecology Conservation Genetics Heredity Biological Journalof the Linnean Society Amphibia-Reptilia Animal Conservation Molecular Ecology
Peterman et al (2016) PeerJ DOI 107717peerj1813 319
Figure 1 Map of Daniel Boone Conservation Area depicting the locations of the five ponds used in thisstudyWildlife ponds are ponds readily used by amphibians such as Ambystoma maculatum for repro-duction
Resources Evolution Plos One or Journal of Zoology published through December 2012For each study we determined if different life stages were sampled and if the study gavean indication as to whether sampling multiple life stages influenced analysis or inferencesmade from the data
SamplingOur study was conducted at Daniel Boone Conservation Area (DBCA) in WarrenCounty Missouri USA (Fig 1) This 1424 ha area is situated on the upper Ozark Plateauphysiographic region and is characterized by mature (80ndash100 years old) second-growthforest with an overstory dominated by oak (Quercus spp) and hickory (Carya spp) withvarying amounts of sugar maple (Acer saccharum) and red cedar (Juniperus virginiana) inthe understory (Semlitsch et al 2009) There are gt40 fishless manmade ponds that are onaverage separated by 2000 m (246ndash3900 m) (Peterman et al 2013b) Only man-madeponds are known to still exist on the DBCA landscape We sampled adults embryosand larvae of Ambystoma maculatum (spotted salamander) from five ponds at DBCA(Fig 1) Each of these ponds have been the focus of previous amphibian research atDBCA (eg Hocking et al 2008 Semlitsch et al 2014) and have similar surface area(160ndash330 m2) depth (lt12 m) age (27ndash47 yrs) and permanent hydroperiod We sought
Peterman et al (2016) PeerJ DOI 107717peerj1813 419
to collect 25 adult and embryo samples and 30 larval samples from each pond Adultsalamanders were captured in mesh funnel traps placed in breeding ponds in March 2013and tissue samples were obtained by removing 05 cm of tail tissue Following ovipositionwe sampled embryos by collecting a single embryo per clutch in April 2013 In June 2013larvae were captured with dip nets and to minimize the sampling of siblings we collectedlarvae from the entire perimeter of each pond Upon collection in the field each tissuesample was placed in 95 ethanol and stored at minus20 C until DNA extraction
Lab techniquesDNAwas extracted from tissue using chelex-based resin (InstaGene BioRad Hercules CAUSA) Approximately 25 mm times 25 mm of tissue was finely chopped with a sterile razorand was incubated at 60 C for 2 hrs in 250microL of InstaGene vortexed incubated for 20minat 100 C then vortexed again Following centrifugation a 100 microL aliquot was removedand used as template DNA and the remainder was kept at minus20 C (Peterman et al 2012)Nineteen tetra-nucleotide microsatellite loci were amplified using PCR primers werefluorescently 5prime labeled with FAM NED VIC and PET and arranged into two multiplexreactions (Peterman et al 2013a) Negative controls were included in all reactions to detectcontamination of reagents Amplification products were sized on an ABI 3730xl DNAAnalyzer (Applied Biosystems Foster City CA USA) using Liz 600 size standard at theUniversity of Missouri DNA Core Facility and results were scored using GENEMARKER(v197 Softgenetics State College PA USA)
Differences among life stagesBefore proceeding with analyses we created a data set free of full sibling pairs usingCOLONY (Wang 2012) For our COLONY analyses both male and female mating were setto polygamous without inbreeding We conducted a long run with full likelihood and highprecision and did not include a sibship prior We excluded siblings from the analysis suchthat all sites only had one individual per family group Values for FST and allelic richness(rarefied to our smallest sample) were calculated with the R package hierfstat (Goudet2013) observed heterozygosity and chord distance (DC) were calculated with the R packageadegenet (Jombart amp Ahmed 2011) and effective population size estimates (Ne) were madeusing the linkage disequilibrium method implemented in COLONY (Wang 2012) Theproportion of siblings removed from each life stage at each pond was also calculated Todetermine the effect of sibling removal we also calculated summary statistics (Ho Ar FSTDC) for each life stage with siblings present All population geneticmeasures were comparedamong life stages and between estimates made with and without siblings using analysisof variance (ANOVA) and paired t -tests Due to small sample sizes we bootstrapped ourANOVA analyses and conducted permutation t -tests to more robustly assess differencesamong life stages and removal of siblings
Effect of mixing life stagesPrior to pooling life stages together we conducted a second removal of related individualsusing the COLONY settings described above (Wang 2012) Specifically we found andremoved parentndashoffspring and embryo-larvae sibling pairs within each pond All unrelated
Peterman et al (2016) PeerJ DOI 107717peerj1813 519
individuals of all life stages were pooled by pond of origin to make five mixed-tissuepopulations From these populations we randomly sampled 25 individuals using the Rpackage hierfstat (Goudet 2013) in R (R Core Team 2013) This bootstrap resamplingprocedure was repeated 1000 times (both with and without siblings) and the mean and95 confidence intervals were calculated for Ho Ar FST and DC
Isolation-by-distance analysisFor the isolation-by-distance (IBD) analysis we conducted simple Mantel tests correlatinggenetic distance with Euclidean distance between ponds This test was repeated for all lifestages with and without siblings and significance was assessed using 100000 permutationsusing the R package ecodist (Goslee amp Urban 2007) We tested for IBD in the mixed samplepopulation and calculated the mean and 95 confidence interval for both the Mantel rcorrelation statistic and the associated P-value based on the 1000 bootstrap iterationsBecause we found a significant IBD relationship when using adult-only tissue samples(see lsquoResultsrsquo) we further assessed how the IBD relationship changed with the inclusion oflarval and embryo samples For this analysis we varied the proportion of larval and embryosamples included with our adult samples This was assessed at proportions ranging from 0(no larval or embryo samples) to 1 (only larval and embryo samples) at increments of 005At each increment we assessed the mean and 95 confidence intervals of the Mantel r andthe corresponding P-value based on 1000 bootstrap samples of the data We used the dataset without siblings for this analysis and sampled each population to the minimum adultsample size (n= 18)
Number of microsatellite lociConcurrent with assessing the effects of mixing life stages we also assessed the effectsof reducing the number of microsatellites used in an analysis Within the bootstrappingprocedure for assessing the proportion of larval and embryo samples described abovewe sub-sampled our microsatellite data set to include either 5 10 or all 15 of themicrosatellites At each bootstrap iteration at each mixture proportion microsatelliteswere randomly chosen to calculate Mantel r and the corresponding P-value We alsocalculated the observed heterozygosity and allelic richness at each mixture proportionand for each level of microsatellite subsampling These estimates were averaged over allpopulations sampled
RESULTSLiterature reviewWe found that 20 out of 95 (21) of studies meeting our search criteria on Scopusconducted population or landscape genetic analyses of amphibian species using mixedtissue sampling (searched on 13 February 2016) Five of these studies stated that one lifestage was sampled only when the target life stage was not available (Beebee amp Rowe 2000Lee-Yaw et al 2009 Lee-Yaw Irwin amp Green 2008Munwes et al 2010 Richardson 2012)None of these studies made attempts to check or correct for the effects of mixing life stagesin their analyses although it was common for siblings to be removed prior to analysis
Peterman et al (2016) PeerJ DOI 107717peerj1813 619
Sample summaryWe collected 24ndash25 adults and 19ndash27 embryos from each of the five ponds and 29ndash36 larvaefrom three of the five ponds (Supplemental Information 1) We were unable to samplelarvae from two of the ponds due to high embryo mortality Of the original 19 screenedprimers two loci (Am_13 Am_60) were not polymorphic and two loci (Am_33 Am_43)showed very little polymorphism and deviated significantly from expected heterozygosityvalues under Hardy Weinberg equilibrium (HWE) These four loci were removed fromthe dataset and all population genetic statistics were calculated using the remaining 15loci (Supplemental Information 1) No other loci or populations deviated from Hardy-Weinberg equilibrium or were significantly linked Overall we had lt05 missing data
Statistical summaryFor all tests none of the population genetic parameters differed significantly amonglife stages (bootstrap ANOVA P-value gt 005) or within ponds and among life stages(permutation t -test P-value ge 025 Fig 2 Tables 1 and 2) regardless of whether or notsiblings were present in the data The proportion of samples removed due to sibshipwas nearly significant (bootstrap P-value = 0053 Fig 2F) with a greater proportionof field-collected samples being omitted from larvae There was also an increase in theestimated mean FST calculated in the larval and embryo data as compared to adults(Fig 2C) but we note that this increase was not significant However this trend was notobserved when genetic distance wasmeasured using allele frequencies (DC Fig 2D) Valuesof population genetic summary statistics calculated on data sets with siblings removed aregiven as the mean (plusmnstandard deviation) Effective population size among ponds averaged874 (plusmn2528) for adults 824 (plusmn2558) for embryos and 64 (plusmn432) for larvae Averagerarefied allelic richness of adults was 383 (plusmn022) 395 (plusmn023) for embryos and 413(plusmn020) for larvae The average observed heterozygosity was 053 (plusmn001) for adults 051(plusmn003) for embryos and 051 (plusmn001) for larvae On average we removed 332 (plusmn009)of larval samples due to sibship while only 13 (plusmn0084) of adult and 1498 (plusmn009) ofembryo samples were removed With siblings removed pairwise genetic distances betweenponds measured using FST averaged 0011 (plusmn0008) in adults 0021 (plusmn0007) in larvae and0019 (plusmn0014) in embryos while DC averaged 0226 (plusmn0025) in adults 0237 (plusmn0011)in larvae and 0240 (plusmn0030) in embryos (Table 3)
When comparing each life stage at each summary metric we found no significantdifferences between data containing the sibling pairs and data with removed sibling pairs(permutation t -test P-valuege 019 Fig 2 Tables 1 and 2) We found that the mixing of lifestages resulted in genetic estimates of Ar Ho FST and DC that on average did not differfrom estimates made for each specific life stage (Tables 1 and 2) There were howeverup to three pond-pair FST values that fell outside of the bootstrapped 95 confidenceintervals (Table 3) When genetic distance was measured using DC only one pond-pair felloutside of the bootstrapped confidence interval In general there was a greater frequencyof pairwise genetic distance measures based on embryo samples to fall outside of the mixedsample confidence interval For both FST and DC the removal of siblings resulted in morepairwise estimates falling outside of the mixed sample confidence interval (Table 3) Due
Peterman et al (2016) PeerJ DOI 107717peerj1813 719
Figure 2 Bar plots representing mean values of (A) observed heterozygosity (B) rarefied allelic rich-ness (Ar ) (C) genetic distance (FST) (D) genetic distance (DC ) (E) effective population size (Ne) and(F) proportion of samples removed due to sibship Solid bars represent values containing full siblingspatterned bars represent values after sibling removal and error bars represent standard deviations
to sample size clear inferences cannot be drawn from larvae With regard to IBD onlytests using adult samples (with and without siblings) resulted in significant relationships(Table 4) and the IBD relationship was stronger when genetic distance was measured usingDC (Fig 3) IBD tests from embryos or larvae had much lower Mantel r correlations andwere not significant The mixing of tissue samples resulted in non-significant IBD testswhen using FST (pgt 005 Table 4) but had little effect when using DC (Table 4)
Our assessment of increasing the proportion of larval or embryo tissue samples clearlydemonstrated that the calculatedMantel r decreases as the proportion of larval and embryosamples increases (Fig 3) This pattern was consistent regardless of whether genetic distancewas measured using FST or DC Correspondingly the average P-value of the Mantel test
Peterman et al (2016) PeerJ DOI 107717peerj1813 819
Table 1 Summary statistics following COLONY analysis including effective population size (Ne) andthe proportion of samples removed The combined life stages sibling removal follows two iterations ofCOLONY the first within life stage the second after pooling life stages
Ne Proportion of samples removed
Pond Adult Embryo Larvae Adult Embryo Larvae Combinedlife stages
1 120 92 62 008 008 021 0402 67 114 ndash 016 005 ndash 0253 100 93 ndash 000 012 ndash 0244 100 55 70 016 020 039 0415 50 58 60 025 030 040 037Avg 874 824 64 013 015 033 033SD 2528 2258 432 008 009 009 007
Table 2 Rarefied allelic richness and observed heterozygosity estimates at each pond for both the full data set and with siblings removedMixed-tissue is the bootstrap mean and 95 confidence interval from randomly sampling all life stages together Bolded type indicates values thatfall outside of the bootstrapped 95 confidence interval
Ar Ho
Pond Adult Embryo Larvae Mixed samples (95 CI) Adult Embryo Larvae Mixed samples (95 CI)
Full data set1 411 422 421 422 (399ndash444) 054 049 052 053 (049ndash057)2 394 410 ndash 408 (386ndash427) 051 045 ndash 050 (047ndash053)3 365 368 ndash 367 (344ndash389) 050 047 ndash 049 (046ndash053)4 377 363 390 373 (350ndash398) 052 050 049 051 (047ndash054)5 366 388 407 392 (364ndash417) 050 054 052 054 (050ndash057)Avg 383 390 406 393 (351ndash435) 052 049 051 052 (048ndash056)SD 020 026 015 ndash 001 003 002 ndash
Siblings removed1 416 420 436 422 (400ndash441) 055 053 051 054 (050ndash057)2 398 415 ndash 419 (405ndash431) 052 048 ndash 051 (049ndash053)3 365 372 ndash 377 (357ndash395) 050 048 ndash 050 (047ndash053)4 377 364 388 381 (357ndash403) 054 052 050 052 (049ndash056)5 357 404 416 398 (371ndash421) 053 054 053 054 (051ndash057)Avg 383 395 413 399 (362ndash435) 053 051 051 052 (048ndash056)SD 022 023 020 ndash 001 003 001 ndash
increased as the proportion of larval and embryo samples increased Further reducing thenumber of microsatellites resulted in a reduced Mantel correlation and increased P-value(Fig 3) When using all 15 microsatellites for this analysis the mean bootstrapped P-valuefor tests using FST started at 0057 (0055ndash060) for adult-only samples and increased to0231 (0223ndash0239) for larvaeembryo-only samples (Fig 3B) In contrast the P-valuefor Mantel tests with DC started at 0019 (0018ndash0020) when only adults were includedand increased to 0146 (0140ndash0152) without adult samples (Fig 3D) The 005 P-value
Peterman et al (2016) PeerJ DOI 107717peerj1813 919
Table 3 Pairwise genetic distances (FST andDC ) between ponds for each life stage and for mixed-tissue life stages Mixed is the bootstrap meanand 95 confidence interval from randomly sampling all life stages together Bolded type indicates values that fall outside of the bootstrapped 95confidence interval
FST DC
Pond-pair Adult Embryo Larvae Mixed (95 CI) Adult Embryo Larvae Mixed (95 CI)
Full data set1_2 0000 0000 ndash 0003 (minus0006ndash0014) 0168 0195 ndash 0190 (0163ndash0216)1_3 0012 0002 ndash 0011 (0002ndash0023) 0212 0208 ndash 0235 (0206ndash0267)1_4 0019 0020 0020 0008 (minus0001ndash0020) 0205 0247 0193 0237 (0204ndash0268)1_5 0015 0024 0029 0022 (0008ndash0037) 0227 0250 0204 0237 (0208ndash0267)2_3 0005 0006 ndash 0019 (0007ndash0032) 0196 0201 ndash 0209 (0183ndash0237)2_4 0011 0023 ndash 0004 (minus0006ndash0017) 0188 0230 ndash 0218 (0192ndash0244)2_5 0013 0030 ndash 0022 (0008ndash0038) 0216 0233 ndash 0211 (0183ndash0240)3_4 0000 0004 ndash 0019 (0007ndash0032) 0151 0165 ndash 0171 (0142ndash0200)3_5 0012 0023 ndash 0010 (0000ndash0022) 0242 0207 ndash 0221 (0192ndash0250)4_5 0005 0012 0011 0010 (0000ndash0023) 0213 0197 0181 0223 (0194ndash0252)Avg 0009 0014 0020 0013 (0002ndash0026) 0202 0213 0193 0215 (0187ndash0244)SD 0006 0011 0009 ndash 0027 0027 0011 ndash
Siblings removed1_2 0000 0000 ndash 0002 (minus0005ndash0011) 0191 0199 ndash 0187 (0164ndash0212)1_3 0015 0001 ndash 0011 (0003ndash0020) 0240 0218 ndash 0230 (0206ndash0257)1_4 0024 0021 0024 0008 (0000ndash0017) 0243 0258 0234 0229 (0200ndash0256)1_5 0020 0036 0028 0017 (0006ndash0030) 0242 0273 0249 0224 (0195ndash0251)2_3 0005 0010 ndash 0016 (0007ndash0027) 0222 0233 ndash 0214 (0193ndash0234)2_4 0013 0023 ndash 0006 (minus0004ndash0018) 0220 0259 ndash 0213 (0189ndash0235)2_5 0015 0040 ndash 0019 (0007ndash0031) 0226 0276 ndash 0203 (0178ndash0228)3_4 0000 0006 ndash 0016 (0007ndash0028) 0179 0191 ndash 0173 (0146ndash0203)3_5 0013 0037 ndash 0007 (minus0001ndash0017) 0262 0256 ndash 0212 (0189ndash0237)4_5 0004 0020 0012 0008 (minus0002ndash0020) 0232 0240 0227 0213 (0187ndash0239)Avg 0011 0019 0021 0011 (0002ndash0022) 0226 0240 0237 0210 (0185ndash0235)SD 0008 0014 0007 ndash 0025 0030 0011 ndash
threshold is passed when the proportion of larvae and embryos in the sample reaches060ndash065 (P-values = 0047ndash0054 respectively) When 10 microsatellites are used the005 threshold is exceeded when the proportion of larvae and embryos reaches 030ndash035(P-values = 0047ndash0052 respectively) The IBD relationship was not significant at anymixture proportion when only five microsatellites were used
There was a trend for the mean heterozygosity to decrease and mean allelic richness toincrease as the proportion of larvae and embryos increased but we note that these trendsoccur over a very limited parameter space (Fig 4) Adult-only samples had amean observedheterozygosity of 0533 andmean allelic richness of 389 while larvaeembryo-only sampleshad a mean observed heterozygosity of 0521 and mean allelic richness of 411 The numberof microsatellites used in the analysis did not affect the mean estimate of heterozygosityor allelic richness although precision in the bootstrap estimates was greater with moremicrosatellites
Peterman et al (2016) PeerJ DOI 107717peerj1813 1019
Figure 3 Change inMantel r when using FST (A) andDC (B) and the corresponding change in the P-value (c = FST d = DC ) with increasing proportion of tissue samples coming from larvae and em-bryos The dashed line in (C) and (D) is drawn at 005 to indicate the traditional threshold for signifi-cance Mean (solid line) and 95 confidence intervals (lighter shading) were estimated at 005 incrementsbetween from 0 to 1 A proportion of 0 represents an adult-only sample while a proportion of 1 repre-sents a larvaeembryo-only sample At each 005 increment 1000 bootstrap samples were conducted andMantel P-values were estimated from 100000 permutations Each of these statistics was calculated with 510 and 15 microsatellites (full data set) with a different set of microsatellites being randomly selected ateach bootstrap iteration
Table 4 Results of simple Mantel tests assessing the correlation between genetic distance and geo-graphic distanceMixed life stage represents 1000 bootstrap iterations and the corresponding Mantel rand P-value estimates are the mean and 95 confidence intervals of the bootstrap iterations Mantel P-values were estimated from 100000 permutations
FST DC
Life stage Mantel r P-value Mantel r P-value
Full data setMixed 038 (minus004ndash071) 018 (003ndash054) 0775 (0505ndash0943) 0031 (0016ndash0100)Adult 0715 0034 0731 0033Embryo 0164 0316 0687 0033Larva minus0125 0666 minus0055 0668
Siblings removedMixed 0310 (minus010ndash065) 022 (005ndash054) 0758 (0467ndash0936) 0035 (0016ndash0100)Adult 0704 0033 0794 0016Embryo 0093 0417 0427 0118Larva 0190 0667 minus0186 0667
Peterman et al (2016) PeerJ DOI 107717peerj1813 1119
Figure 4 Observed heterozygosity and allelic richness averaged over all populationsMean (solid line)and 95 confidence intervals (lighter shading) were estimated at 005 increments between from 0 to 1 Aproportion of 0 represents an adult-only sample while a proportion of 1 represents a larvaeembryo-onlysample At each 005 increment 1000 bootstrap samples were conducted Each of these statistics was cal-culated with 5 10 and 15 microsatellites (full data set) with a different set of microsatellites being ran-domly selected at each bootstrap iteration
DISCUSSIONOur literature search revealed that mixed tissues have been used in about one fifth ofamphibian population genetic studies using microsatellites despite the lack of knowledgeconcerning the effects that this may have on population or landscape genetic inferencesCollection of genetic samples from the field is likely influenced by numerous factors suchas the timing of life stage development and accessibility to sampling sites Many of thestudies that mixed tissues did so when the target life stage was not found and minimumsample requirements had to be met Decisions made during sampling can undoubtedlyinfluence the inferences made as genetic variation within structured populations can varyspatially temporally or as a result of life history (Anderson amp Dunham 2008 Schwartz ampMcKelvey 2009 Scillitani et al 1996)
In our study however we found little evidence for adverse effects of including siblingsor with mixing tissue samples collected from different life stages when assessing levelsof allelic richness heterozygosity or effective population size Contrary to Goldberg ampWaits (2010) it may not always be necessary to remove siblings from a dataset to achieveunbiased population genetic estimates Nonetheless we urge researchers to proceed withcaution when there is a high likelihood that full-siblings are present in a data set andto carefully assess the tradeoffs between power and precision We found that estimates
Peterman et al (2016) PeerJ DOI 107717peerj1813 1219
of pairwise FST differed substantially between life stages as well as from the mixed-tissuesample but this difference was not statistically significant Additionally this pattern wasnot observed when pairwise genetic distance was measured using DC The greatest impactof mixing life stages was evident in our tests of IBD among pond pairs Only the testsusing adults were significant while larvae-only embryo-only and mixed-tissue samplesshowed little correlation with distance The IBD relationship was strongest when geneticdistance was measured usingDC and we found that the IBD relationship seen in adult-onlysamples decreased as the proportion of larvae and embryos included in the populationsample increased In our dataset the IBD relationship when assessed with DC remainedsignificant until the frequency of larvae and embryos in the population sample exceeded60 However our power to detect a significant IBD relationship was substantially affectedby the number of microsatellites usedWhen 10 of the 15 microsatellites were used the IBDrelationship became non-significant when the frequency of larvae and embryos exceeded30 and no significant IBD relationship was evident when only five microsatellites wereused As such our results suggest the greatest effects of mixing different life stages may beevident in landscape genetic analyses assessing pairwise distances among populations withdifferent conclusions potentially being drawn from adult-only samples as compared tolarvae embryo or mixed-tissue samples Further such relationships may be sensitive to thegenetic distance statistic used as well as the number or polymorphism of the microsatellitesused
Contrary to our predictions we did not observe significant biases in our populationgenetic measures among life stages or with the exclusion of full siblings from the data Thisis counter to the findings of Goldberg amp Waits (2010) who found that skewed estimatesbetween larval and adult population genetic measures were eliminated or reduced when fullsiblings were removed from the larval sample As in the analysis of mixed-tissue samplesthe greatest differences were observed in relation to genetic differentiation measured byFST which increased (insignificantly) after the removal of full siblings from the data aswell as from adults to embryos to larvae These increases in genetic differentiation in theembryonic and larval stages as compared to the adults is predicted by population genetictheory (Allendorf amp Phelps 1981) and has been empirically demonstrated in Columbiaspotted frogs (Rana luteiventris) (Goldberg amp Waits 2010)
The clearest result from our study was the proportion of samples that had to be removedfrom each life stage due to redundancy of siblings It is actually quite unlikely that wesampled full sibling adults given their life history and longevity (Petranka 1998) but wechose to remove these putative siblings from our data set for consistency of methods amonglife stagesWenote however thatGoldberg amp Waits (2010)did not test for or remove siblingpairs from their adult samples In our study up to 40 of larval samples were found tobe from sibling pairs which would have to be removed if their inclusion biased geneticparameter estimates Although larvae are often the most readily accessible and convenientlysampled life stage this represents an inefficient use of resources When possible it maybe prudent to avoid sampling larvae Ultimately the choice of which life stage or stages tosample will be idiosyncratic to the study and systemWe have demonstrated that inferencesdiffered minimally and insignificantly between larvae embryos and adults but we note
Peterman et al (2016) PeerJ DOI 107717peerj1813 1319
that both larvae and adults can be sampled non-destructively which may become a factorin deciding which life stage to sample for some species
In our study we assessed IBD through the use of simple Mantel tests We readilyacknowledge the limitations and criticisms of the Mantel test for making robust inference(eg Guillot amp Rousset 2013 Legendre Fortin amp Borcard 2015) However we feel that forour limited data set and ultimate goal of assessing relative differences and patterns betweenlife stages mixed life stage samples and genetic distance measures the simple Manteltest was sufficient and provides an appropriate cautionary caveat for future researchersusing any method More rigorous methods such as distance-based redundancy analysis(Legendre amp Anderson 1999) multiple regression of distance matrices (Holzhauer et al2006) distance-based Moranrsquos eigenvector maps (Legendre amp Legendre 2012) or mixedeffects models fit with an appropriate error structure (Clarke Rothery amp Raybould 2002)should preferentially be used over Mantel tests in future studies seeking to estimate theeffects of landscape features on genetic differentiation
To our knowledge our study is the first attempt to determine how the samplingand mixing of different life stages affects genetic parameter estimates It is unclear howdifferences in life history (eg life span breeding site fidelity reproductive strategy etc)alter the effects of sampling different life stages as we currently do not have a mechanisticexplanation for the patterns we observed We found that mixed-tissue samples can leadto different conclusions when conducting spatial analyses such as IBD and these resultswould likely extend to more complex landscape genetic analyses as well As such wecaution researchers to carefully consider the implications of mixing samples collected frommultiple life stages Our finding that population genetic parameters differed little with theremoval of siblings or mixing of life stages was surprising and contrary to our predictionsIn our study we had a relatively small sample size from which to draw inference althoughwe note that it is not much smaller than that used by Goldberg amp Waits (2010) whoassessed eight populations of R luteiventris and four populations of A macrodactylumWe do note that the power to infer differences is likely greater in our study due to thelarge number of polymorphic microsatellites used which was reinforced by our results ofsubsampling the number of genetic markers used Perhaps of greater importance is thefact that our populations are relatively close together (maximum distance = 3200 m) andsituated within continuous forest habitat In contrast Goldberg amp Waits (2010) sampledpopulations separated by 27ndash185 km of agricultural matrix Further the populationsincluded in our study are very robust with recorded breeding aggregations of severalhundred individuals (R Semlitsch 2009 unpublished data)
Like Goldberg amp Waits (2010) we suggest that future studies include a pilot phase toassess the effects of sampling different life stages to meet the objectives of the specificproject An important consideration for any population or landscape genetic study isthe target demographic group for which inferences are desired If quantifying movementor connectivity of populations is the main objective of a study then sampling adult lifestages may provide the most accurate inferences If the study objectives are to quantify thedistribution of genetic diversity then sampling of embryos appears to be the most efficientuse of resources However nearly equivalent estimates can be obtained from larvae and
Peterman et al (2016) PeerJ DOI 107717peerj1813 1419
as demonstrated in this study the presence of siblings may not result in biased estimatesUltimately the mechanisms underlying the patterns observed in this study are not knownbut thismay be a fruitful avenue for future research to explore through simulationmodelingto better understand how variation life history characteristics and sampling scenarios affectpopulation and landscape genetic inference
ACKNOWLEDGEMENTSWe thank T Luhring for assistance in the field
ADDITIONAL INFORMATION AND DECLARATIONS
FundingThis research was supported by the DoD Strategic Environmental Research DevelopmentProgram (RC2155) awarded to RDS WEP LSE and the Trans World Airline Scholarshipawarded to WEP The funders had no role in study design data collection and analysisdecision to publish or preparation of the manuscript
Grant DisclosuresThe following grant information was disclosed by the authorsDoD Strategic Environmental Research Development Program RC2155Trans World Airline Scholarship
Competing InterestsThe authors declare there are no competing interests
Author Contributionsbull William Peterman conceived and designed the experiments performed the experimentsanalyzed the data contributed reagentsmaterialsanalysis tools wrote the paperprepared figures andor tables reviewed drafts of the paperbull Emily R Brocato conceived and designed the experiments performed the experimentswrote the paper prepared figures andor tables reviewed drafts of the paperbull Raymond D Semlitsch and Lori S Eggert contributed reagentsmaterialsanalysis toolsreviewed drafts of the paper
Animal EthicsThe following information was supplied relating to ethical approvals (ie approving bodyand any reference numbers)
University of Missouri Animal Care and Use CommitteeProtocol 7403
Field Study PermissionsThe following information was supplied relating to field study approvals (ie approvingbody and any reference numbers)
Permits approved and issued by the Missouri Department of ConservationMissouri Wildlife Collectorrsquos permit 15584
Peterman et al (2016) PeerJ DOI 107717peerj1813 1519
Data AvailabilityThe following information was supplied regarding data availability
Figshare httpsdxdoiorg106084m9figshare1621318
Supplemental InformationSupplemental information for this article can be found online at httpdxdoiorg107717peerj1813supplemental-information
REFERENCESAllendorf FW Phelps SR 1981 Use of allelic frequencies to describe population
structure Canadian Journal of Fisheries and Aquatic Sciences 381507ndash1514DOI 101139f81-203
Anderson EC DunhamKK 2008 The influence of family groups on inferences madewith the program StructureMolecular Ecology Resources 81219ndash1229DOI 101111j1755-0998200802355x
Balloux F AmosW Coulson T 2004 Does heterozygosity estimate inbreeding in realpopulationsMolecular Ecology 133021ndash3031DOI 101111j1365-294X200402318x
Beebee TJC Rowe G 2000Microsatellite analysis of natterjack toad Bufo calamita Lau-renti populations consequences of dispersal from a Pleistocene refugium BiologicalJournal of the Linnean Society 69367ndash381 DOI 101111j1095-83122000tb01211x
Berven KA 1990 Factors affecting population fluctuations in larval and adult stages ofthe wood frog (Rana sylvatica) Ecology 711599ndash1608 DOI 1023071938295
Clarke RT Rothery P Raybould AF 2002 Confidence limits for regression relationshipsbetween distance matrices estimating gene flow with distance Journal of Agricul-tural Biological and Environmental Statistics 7361ndash372 DOI 101198108571102320
Dahlberg MD 1979 A review of survival rates of fish eggs and larvae in relation toimpact assessmentsMarine Fisheries Review 411ndash12
Ficetola GF Garner TWJWang J De Bernardi F 2011 Rapid selection againstinbreeding in a wild population of a rare frog Evolutionary Applications 430ndash38DOI 101111j1752-4571201000130x
Frankham R 1996 Relationship of genetic variation to population size in wildlifeConservation Biology 101500ndash1508 DOI 101046j1523-1739199610061500x
Goldberg CSWaits LP 2010 Quantification and reduction of bias from sampling larvaeto infer population and landscape genetic structureMolecular Ecology Resources10304ndash313 DOI 101111j1755-0998200902755x
Goslee SC Urban DL 2007 The ecodist package for dissimilarity-based analysis ofecological data Journal of Statistical Software 221ndash19
Goudet J 2013 hierfstat estimation and tests of hierarchical F-statistics R package version004-10 Available at httpCRANR-projectorgpackage=hierfstat
Guillot G Rousset F 2013 Dismantling the Mantel testsMethods in Ecology andEvolution 4336ndash344 DOI 1011112041-210x12018
Peterman et al (2016) PeerJ DOI 107717peerj1813 1619
Hale ML Burg TM Steeves TE 2012 Sampling for microsatellite-based populationgenetic studies 25 to 30 individuals per population is enough to accurately estimateallele frequencies PLoS ONE 7e45170 DOI 101371journalpone0045170
HansenMM Nielsen EE Mensberg KLD 1997 The problem of sampling families ratherthan populations relatedness among individuals in samples of juvenile brown troutSalmo trutta LMolecular Ecology 6469ndash474DOI 101046j1365-294X1997t01-1-00202x
Harrison XA Bearhop S Inger R Colhoun K Gudmundsson GA Hodgson DMcElwaine G Tregenza TOM 2011Heterozygosityndashfitness correlations in amigratory bird an analysis of inbreeding and single-locus effectsMolecular Ecology204786ndash4795 DOI 101111j1365-294X201105283x
HeyerWR Donnelly MA McDiarmid RW Hayek L-AC 1994 Measuring andmonitoring biological diversity standard methods for amphibians In Foster MSed Biological diversity handbook series Washington DC Smithsonian InstitutionPress 364
Hocking DJ Rittenhouse TAG Rothermel BB Johnson BR Conner CA HarperEB Semlitsch RD 2008 Breeding and recruitment phenology of amphib-ians in Missouri oak-hickory forests American Midland Naturalist 16041ndash60DOI 1016740003-0031(2008)160[41BARPOA]20CO2
Holzhauer SIJ Ekschmitt K Sander AC Dauber J Wolters V 2006 Effect of historiclandscape change on the genetic structure of the bush-cricket Metrioptera roeseliLandscape Ecology 21891ndash899 DOI 101007s10980-005-0438-9
Jombart T Ahmed I 2011 adegenet 13-1 new tools for the analysis of genome-wideSNP data Bioinformatics 273070ndash3071 DOI 101093bioinformaticsbtr521
Kiritani K Nakasuji F 1967 Estimation of the stage-specific survival rate in the insectpopulation with overlapping stages Researches on Population Ecology 9143ndash152DOI 101007BF02514921
Lee-Yaw JA Davidson A McRae BH Green DM 2009 Do landscape processes predictphylogeographic patterns in the wood frogMolecular Ecology 181863ndash1874DOI 101111j1365-294X200904152x
Lee-Yaw JA Irwin JT Green DM 2008 Postglacial range expansion from north-ern refugia by the wood frog Rana sylvaticaMolecular Ecology 17867ndash884DOI 101111j1365-294X200703611x
Legendre P AndersonMJ 1999 Distance-based redundancy analysis testing multi-species responses in multifactorial ecological experiments Ecological Monographs691ndash24 DOI 1018900012-9615(1999)069[0001DBRATM]20CO2
Legendre P Fortin M-J Borcard D 2015 Should the Mantel test be used in spatial anal-ysisMethods in Ecology and Evolution 61239ndash1247 DOI 1011112041-210X12425
Legendre P Legendre L 2012Numerical ecology 3rd edition Amsterdam Elsevier 990pages
Mullins ML Pierce BA Gutzwiller KJ 2004 Assessment of quantitative enclosure sam-pling of larval amphibians Journal of Herpetology 38166ndash172 DOI 10167067-03A
Peterman et al (2016) PeerJ DOI 107717peerj1813 1719
Munwes I Geffen E Roll U Friedmann A Daya A Tikochinski Y Gafny S 2010 Thechange in genetic diversity down the core-edge gradient in the eastern spadefoot toad(Pelobates syriacus)Molecular Ecology 192675ndash2689DOI 101111j1365-294X201004712x
PetermanWE Brocato ER Pauley LR Stuart EC Semlitsch RD Eggert LS 2013a De-velopment and characterization of 18 microsatellite loci for the spotted salamander(Ambystoma maculatum) using paired-end Illumina shotgun sequencing Conserva-tion Genetics Resources 5989ndash991 DOI 101007s12686-013-9950-4
PetermanWE Connette GM Spatola BN Eggert LS Semlitsch RD 2012 Identifi-cation of polymorphic loci in Ambystoma annulatum and review of cross-speciesmicrosatellite use in the genus Ambystoma Copeia 2012570ndash577DOI 101643CH-11-001
PetermanWE Rittenhouse TAG Earl JE Semlitsch RD 2013b Demographic networkand multi-season occupancy modeling of Rana sylvatica reveal spatial and temporalpatterns of population connectivity and persistence Landscape Ecology 281601ndash1613DOI 101007s10980-013-9906-9
Peterson CLWilkinson RF DonM Holder T 1991 Premetamorphic survival ofAmbystoma annulatum Herpetologica 4796ndash100
Petranka JW 1998 Salamanders of the United States and Canada Washington DCSmithsonian Institution Press
R Core Team 2013 R a language and environment for statistical computing Vienna RFoundation for Statistical Computing Available at httpwwwR-projectorg
Richardson JL 2012 Divergent landscape effects on population connectivity in twoco-occurring amphibian speciesMolecular Ecology 214437ndash4451DOI 101111j1365-294X201205708x
Schwartz MKMcKelvey KS 2009Why sampling scheme matters the effect ofsampling scheme on landscape genetic results Conservation Genetics 10441ndash452DOI 101007s10592-008-9622-1
Scillitani G Belfiore C Picariello O Cataudo A 1996 Estimating genetic variationfrom larvae and adults of mayflies an electrophoretic analysis of three speciesof Heptageniidae (Ephemeroptera) Italian Journal of Zoology 6323ndash30DOI 10108011250009609356102
Semlitsch RD Anderson TL OsbournMS Ousterhout BH 2014 Structure anddynamics of ringed salamander (Ambystoma annulatum) populations in MissouriHerpetologica 7014ndash22 DOI 101655HERPETOLOGICA-D-13-00074
Semlitsch RD Todd BD Blomquist SM Calhoun AJK Gibbons JW Gibbs JPGraeter GJ Harper EB Hocking DJ Hunter ML Patrick DA RittenhouseTAG Rothermel BB 2009 Effects of timber harvest on amphibian populationsunderstanding mechanisms from forest experiments Bioscience 59853ndash862DOI 101525bio200959107
Shoop CR 1974 Yearly variation in larval survival of Ambystoma maculatum Ecology55440ndash444 DOI 1023071935233
Peterman et al (2016) PeerJ DOI 107717peerj1813 1819
Slate J David P Dodds KG Veenvliet BA Glass BC Broad TE McEwan JC 2004Understanding the relationship between the inbreeding coefficient and multilocusheterozygosity theoretical expectations and empirical data Heredity 93255ndash265DOI 101038sjhdy6800485
Wang J 2012 Computationally efficient sibship and parentage assignment frommultilocus marker data Genetics 191183ndash194 DOI 101534genetics111138149
Peterman et al (2016) PeerJ DOI 107717peerj1813 1919
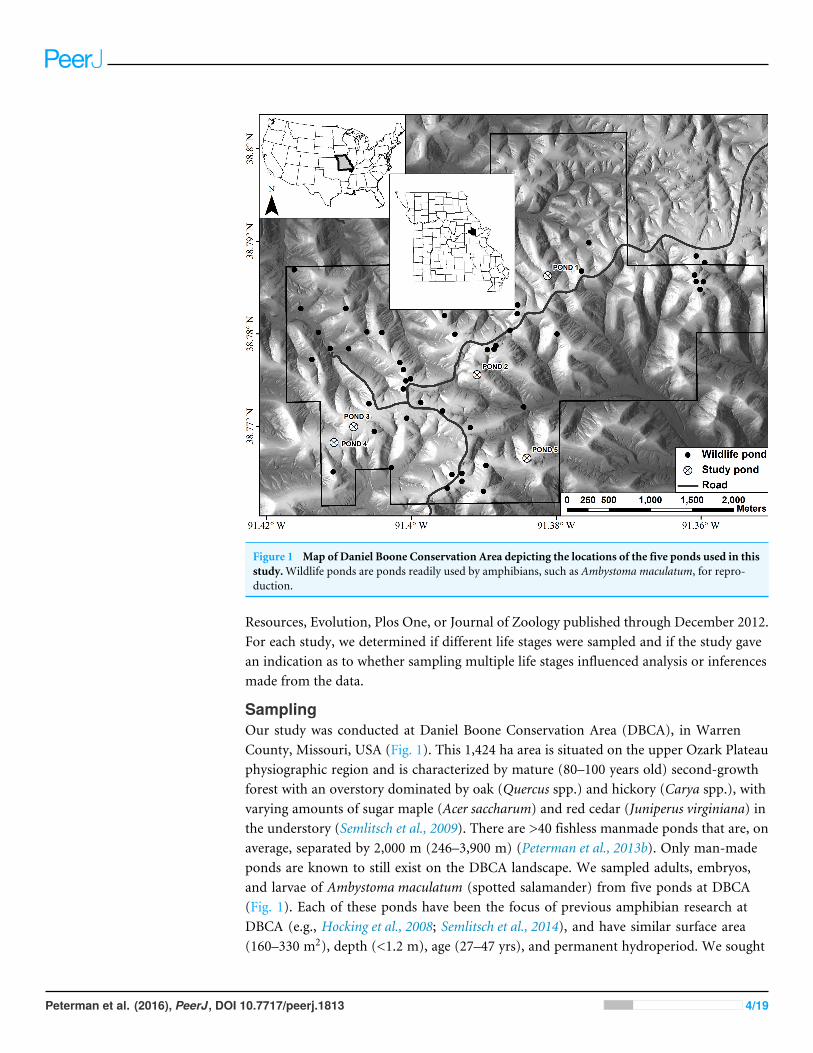
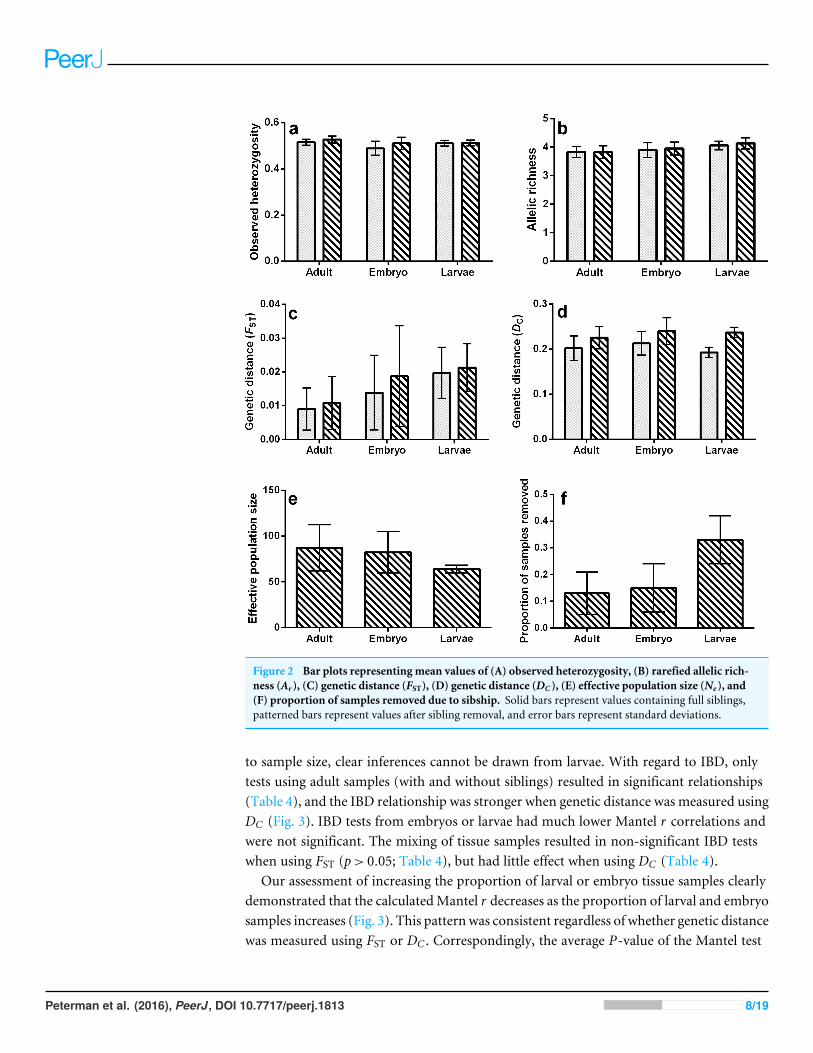