reducing atmospheric pollution in the mediterranean port ... · pdf fileport of barcelona:...
TRANSCRIPT

1
Project co-finnaced by the Europe-an Regional Development Fund
Common Mediterranean strategy and local practical Actions for the mitigation of Port, Industries and Cities Emissions
Reducing atmospheric pollution in the Mediterranean port citiesThe results of APICE project

2
Reducing atmospheric pollution in the Mediterranean port cities. The results of APICE project
APICE project final publication. - February 2013
AuthorsARPAV – Lead PartnerSalvatore Patti, Francesca Liguori, Silvia Pillon, Aurelio Latella, Elena Elvini, Alberto Della Fonta-na, Laura Susanetti, Alessio De Bortoli, Stefania De Vettori, Gianmaria Formenton, Giorgia Giral-do, Giovanna Marson, Erika Baraldo, Luca Zagolin, Enzo Tarabotti.
Veneto RegionElena Gissi, Alberto Miotto, Marco Meggiolaro, Tiziana Quaglia and Pierpaolo Campostrini.
University of Genoa – Department of PhysicsMaria Chiara Bove, Paolo Brotto, Federico Cassola, Enrico Cuccia, Dario Massabò, Andrea Maz-zino, Paolo Prati.
Province of Genoa Cecilia Brescianini, Maria Teresa Zannetti
Marseille Port AuthorityMagali Devèze, Valérie Lucani, Mylène Glot, Michaël Parra, Alexandre Armengaud (AirPACA),Damien Piga (AirPACA ), Romain Souwaine (AirPACA), Ingrid Fiol (AirPACA).
University of Provence Nicolas Marchand, Henri Wortham, Anaïs Detournay, Dalia Salameh.
Decentralized Administration of Macedoni- Thrace (DAMT)Panagiotis Georgiadis, Anastasios Vavatzanidis,George Kampas, Anna Giannotaki Evangelia Repa, Konstantinos Michailidis (Regional Development Fund of Central Macedonia) and Efi Sta-iou (Regional Development Fund of Central Macedonia).
University of Western MacedoniaJohn G. Bartzis, Dikaia E. Saraga, Evaggelos Tolis, Katerina F. Filiou Aristotle University Thessaloniki.Dimitios Melas, Anastasia Poupkou, Natalia Liora, Theodoros Giannaros, Christos Giannaros,Dimitrios Balis, Kleareti Tourpali, Prodromos Zanis, Charalampos Feidas, Natalia Kouremeti,Athanasios Karagiannidis
EUCC Mediterranean Centre Pedro Fernández, Carolina Pérez and Pedro Jiménez (Universidad de Murcia)
IDÆA-CSICJorge Pey, Noemí Pérez, Natalia Moreno, Andrés Alastuey, Teresa Moreno, Mercedes Cabañas,Xavier Querol.
EditorsFrancesca Liguori (ARPAV) - Maria Teresa Zannetti (Province of Genoa)Funding acknowledgements are given to: MED Programme – ERDF
CREDITS PHOTOSPort of Genoa: Fulvio Fossati.Port of Barcelona: Oscar Ferrer, Juanjo Martinez, Nacho VaqueroPort of Marseille: Collection Port de Marseille Fos/4ventsPort of Venice: Venice Port Authority

3
APICE approach
1 The project
2 Transnational added value of the project
3 Partnership
Comparison of the harbour cities
4 Framework analysis
5 Present time emission inventories
6 Intercomparison campaign
7 Source Apportionment Outcomes by Receptor Models
8 Source Apportionment Outcomes by Chemical Transport Models
Model application and scenarios for port cities
sustainable development strategies
9 Base Future time emissions scenario
10 Mitigation scenarios
11 Towards common steps to curb emissions: the Common
Transnational Strategy of APICE Project
12 The Local Adaptation Plans: strategies for mitigation of air
pollution in each APICE Port-City
Conclusions
13 Main Scientific conclusions
14 APICE in the Mediterranean: perspectives and emerging issues
15 Capitalisation and utilisation of the results of the project
pag
6
9
10
14
16
23
25
30
44
51
62
66
70
73
75

4

5
APICE approach

6
1. The projectHarbours represent a significant potential for the economic development all over the Mediterra-nean basin, but they also have a potential negative environmental impact due to multiple emis-sion sources.The presence of competing activities in coastal areas can lead to potential conflicts which need to be managed by the institutional actors.APICE - Common Mediterranean strategy and local practical Actions for the mitigation of Port, Industries and Cities Emissions – proposes a decision-making approach that assumes the im-pact of air pollution sources as driver for the coast management in port-cities. This model is based on a strong coordination of environmental and spatial planning policies, aiming to curb emissions and preserving economic potentialities of port-cities.
Project official web site: www.apice-project.eu
The general objective of APICE is to pinpoint concrete actions to lowering emissions and mi-tigate air pollution in harbour cities, while preserving economic potentialities of coastal areas. Focus of the project analysis is the contribution of harbour activity sources to aerosol pollutions.Five of the Northern Mediterranean harbour cities are represented in the Project, from East to West: Barcelona, Marseille, Genoa, Venice and Thessaloniki. For each “study” area both scien-tific and policies issues are taken into account, through the participation of one “scientific” and one “institutional” partner dealing with planning topics. This vision enforces one of the basic concepts of Integrated Management of Coastal Zones (ICZM): integration among disciplines. Only including both expertises a truly holistic approach towards management can be achievedThe objectives pursued by APICE are strongly connected with the overall objectives of Lisbon and Gothenburg Strategies, aiming at strengthen the dynamism of European competitiveness whilst ensuring social cohesion and sustainable development, and with the MED Operational Programme 2007-2013. With reference to the environmental challenges and its relationship with the maritime activities , APICE moves towards the reduction of the emissions from ships and port-based activities for the improvement of the air quality in the port-cities (relevant, above all, for the weakest part of population like children and aging people). In this framework, the Project also paves the way towards wider agreement between MED international ports, ship owners and public authorities to regulate ships emissions, with the concrete potential of contributing to a macro regional strategy in the MED area. The achievement of such environmental objective implicates public and private coordinated efforts to give coherence between environmental re-gulation and economic instruments, in line with the integrated coastal zones management, that are addressed not only to curb down emissions of maritime transports and industrial parks, but also at stimulating the economic potentialities and the competitiveness of the port-cities in the worldwide market.
In this context, three specific objectives of APICE have been defined.First specific objective: “pinpointing, through monitoring campaigns and models, the relative contribution of several pollution sources to the air quality in the project harbour areas, understan-ding the differences and similarities among the selected areas, and designing future environmen-tal, economic and urbanization policy-scenarios”
APICE:• funded by the European Program for Territorial Cooperation MED 2007/2013
(www.programmemed.eu)• implementation period: June 2010 – February 2013 (33 months).• total project budget: 2.271.420,00 EUR
Objectives

7
The scientific knowledge of air pollution generated by port activities in the areas involved in the project is the basic concept of APICE. In response to this objective, the “APICE approach” outlines the knowledge acquired in the project in terms of measures of pollutants, modeling studies, literature data and compares the situation in the five port cities involved in the project.
Second specific objective: “strengthen, through the use of spatial planning tools, the governance capacity across coastal areas to arbitrate between conflicting socio-economic and environmen-tal interests by including the air-pollution analysis and the scenarios within the already existing Sectorial Plans, with the final aim of supporting the strategic choices of Regions, provinces and ports in terms of sustainable and integrated coast management”
In response to this objective, the common transnational strategy was developed, as merging point of the scientific findings of the APICE approach with environmental, econo mic and urbanization trends in vulnerable MED areas and the platform for shared initiatives. The common transnational strategy aims at constituting a road map to develop a common Mediterranean path to curb emissions that is further articulated in local adaptation plans, according to a principle of environmental, economic and social sustainability
Third specific objective: “facilitate and promote voluntary agreements among local administra-tions, port authorities, ship owners and cargos’ handlers (like differentiated dues, kilometres charge, blue flag & tradable emission permits) that can concretely contribute – in the medium term - at curbing emissions and improve the environmental balance of the coastal communities without affecting the economic growth potential of harbours districts”,
In response to this objective, APICE has involved several stakeholders, in a bottom-up process which has taken place in the 5 Port-Cities involved in the project. The content of the common transnational strategy arises from the comparison of the discussions of APICE Partners with local stakeholders in each Port City.

8
APICE approachAPICE project is characterised by a strong integration between scientific insights and planning issues, with the common aim of air quality improvement in the harbour areas. The working packa-ges of the project have been designed in order to make the modelling and monitoring outcomes useful to the local managements and planning policies.
The focus of this report is to highlight the main results obtained by the cooperation between the scientific and institutional partners.In the following two chapters a brief presentation of the partnership and the added value of the project’s transnational approach are presented. Then the sequence of the branch of activities carried out is proposed. Finally the Conclusion section contains a synthesis of the main results.
The first phase of the project is more strictly connected with the activities of the scientific part-ners, and it regards the analysis of the air pollution in each territory, starting both from monitoring and inter-comparison tasks and from the updating of local emission inventories. The outcomes of these preparatory activities, here described in the following paragraphs from 4 to 6, have been the inputs for the modelling applications, which have the aim of identify the weight of harbours emissions on aerosols levels in respect to the others anthropogenic and biogenic sources (so cal-led Source Apportionment analysis). The Source Apportionment results have been summarized at chapters 7 and 8. Starting from the figures outlined by the model by one side, and from the activities carried out at local level by the working tables installed by the institutional partners and involving the local stakeholders, the future scenarios have been evaluated, considering the trend drivers and the port development plans (chapter 9). On this basis the more effective mitigation measures proposed by the local stakeholders have been simulated by the chemical transport models (chapter 10). The second phase of the project carried out in cooperation between the scientific and the institu-tional partners and in parallel with the first phase activities, concerns the identification of the risk activities and vulnerability benchmarking to design intervention scenarios and shared strategies to mitigate air-pollution effects while preserving economic potentialities of port-cities. In this context the working table outcomes have been subject to the Delphi method in order to highlight the more cost-effective and implementable mitigation actions. The path unfolded with the previously described activities, have been realized in a Common Transnational Strategy and with the Local Adaptation Plans, which are outlined in the next chap-ters11 and 12.

9
On the one hand, air pollution and its impact to the development of coasts is a common matter for the major Mediterranean harbour zones. On the other hand, maritime transport regulations are a cross-border issue being mainly ruled by the International Maritime Organization and the EU at the European level. Hence, air pollution derived from maritime transport must be addres-sed through a transnational approach. APICE has worked in this sense by bringing together five main Mediterranean ports, both from scientific and policy perspective, and has concretised main common outputs into the Common Transnational Strategy. This planning document is the result of putting together the common measures of the five local action plans. By doing this, APICE in-tends to voice local needs since many measures concern supra-national stakeholders. This is of utmost importance in the case of ships emissions, which are regulated at the international level. In other cases, the commonalities should bring feasibility opportunities for business.
Furthermore, added value of APICE can be found at the interaction of research groups with multi-level expertise: this has brought capacity building, data/information exchange, homogenization of strategies and local interventions across the Mediterranean basin, delivered to policy makers and key stakeholders able to capitalize results and contribute to governing coasts. Then, the presence of different levels of governance (ports, regional and local authorities) as users of the scientific findings has allowed tackling the same problems in several areas under different per-spectives and has made the approach really oriented to find concrete solutions to manage coast challenges (e.g. APICE proposes harmonization of practices among the involved ports to reduce pollution release from ships at berth). The internationally recognized experience of the technical partner, as well as the presence into the partnership of the key policymakers committed to give a follow-up to the project results, assure the ownership of the methodology and planning instru-ments developed by APICE.
2. Transnational added value of the project

10
ARPAV - Regional Agency for Environmental Protection of Veneto Region (Lead Partner)ARPAV is a public body founded in 1996. The goal of the Agency is to control and preserve the environment in order to help the identification and elimination of risks to humans and to the earth. Its principal activities are: controlling of the environment including sources of pollution; monitoring of the state of the environment, particularly the quality of air, water, and soil; pre-venting risk factors and promoting an education aimed at favouring life styles, which respect the environment.Website: www.arpa.veneto.it
Veneto Region – Spatial Planning and Parks DepartmentVeneto Region – Spatial Planning and Parks Department has the aim to protect and manage the regional territory to assure a balanced development and to improve regional competitiveness while mitigating the climate change effects. The Regional Coordination Spatial Plan (PTRC) is the roadmap for the development of local, provincial and urban plans in accordance with the regional socioeconomic programming. Department’s tasks are:•designstrategiestoaddressregionalspatialplanningincoordinationwiththeProvinces;•Europeanprojectmanagementandpromotionofbestpracticesinthefieldofspatialplanning,urban and environmental quality;•coordination,managementandvalorizationofregionalparksandprotectedareasofVenetoWebsite: www.regione.veneto.it; www.ptrc.it
Province of GenoaThe Province of Genoa is a local authority that manages an area of 1834 Km2, with 900.000 inhabitants.The main tasks of the Province of Genoa are concerned with territorial planning at provincial level, soil erosion prevention, education, water and waste management, promotion of rationale use of energy, pollution control. The Province of Genoa is the public body in charge of the ma-nagement of the air quality monitoring system.Website: www.provincia.genova.it
Department of Physic of the University of GenoaThe Department of Physics belongs to the “Università degli Studi di Genova”, which is the sole University in Liguria Region. The Department of Physics is composed by 70 Professor and Re-searchers and 30 technicians and administrative employees. There are active research groups in Theoretic Physics, Nuclear and subnuclear Physics, Material Science, Bio-Physics, Applied Physics to Medicine and Environment.The Atmospheric and Oceanic Physics Group and the Laboratory of Environmental and Health Physics jointly participate to APICE.Website: www.fisica.unige.it/difi
Port Authority of MarseilleAs the No. 5 port in Europe, Marseille Fos affirms its position as a major player in the Euro-Me-diterranean domain, with the adequate infrastructure and space to accommodate all types of freight traffic, passenger traffic and cruise traffic. Marseille Fos port is constantly investing and innovating to satisfy the demand generated by international maritime transport development through its sustainable growth and development plan. Website: www.marseille-port.fr For the development of the project APICE the Port Authority of Marseille collaborates with
AirPACA (formerly AirPACA, www.airpaca.org), a non-profit association created in 1982 that manages the air quality monitoring network in south-eastern France.
3. Partnership APICE has been developed in 5 study areas of 4 Mediterranean countries and involves the terri-tories of Venice, Marseille, Thessaloniki, Genoa and Barcelona. The partnership has been built up considering a tandem science-policy. Therefore, in each study area, there is at least one partner covering this field. This has allowed proper transfer of science results to policy and at the same time, it has guaranteed that the research was focused on policy needs.

11
University of ProvenceThe University of Provence was founded in 1970 and is characterised by a strong multidisci-plinary character. Research activities and academic training are mainly conducted in the cities of Aix-en-Provence and Marseilles. The 1rst Jannuary 2012, the university of provence merged with two other University of Marseille resulting of the cretaion of the Aix-Marseille University. Aix Marseille University is largest university in France and the French-speaking world, with about 70,000 students. The research group Instrumentation et Réactivité Atmosphérique (In-strumentation and Atmospheric Reactivity - IRA) of the Laboratoire Chimie Environnement (Pro-vence Chemistry Laboratory – LCE), is research team of the Aix Marseille University and CNRS (FRE3416). It was established to better coordinate the atmospheric research effort in Marseille; with an overall staff of 15 researchers, it has been active in the atmospheric chemistry area for the last 15 years. Research activities of the group are focused on atmospheric organic aerosol including analytical studies, source apportionment, kinetics and mechanisms of heterogeneous and multiphase reactions.Website: www.univ-amu.fr
Decentralized Administration of Macedonia (DAMT)Decentralized Administration of Macedonia - Thrace is a Public Authority and in particular a “unified decentralized administration unit of the State”, belonging to the core state admini-stration by representing two former Regions since 1.1.2011. The main tasks involve spatial planning, environmental policy, agricultural and fishery, water management, renewable energy sources, natural resources and management and forest protection. Website : www.damt.gov.gr
University of Western MacedoniaThe Department of Mechanical Engineering, former Department of Engineering and Manage-ment of Energy Resources, was first established in 1999 as one of the three new departments of the Aristotle University of Thessaloniki (AUTH), in the framework of expanding the scope of higher education. The department is one of the founding departments of the University of We-stern Macedonia (UOWM) which was established in 2004. The Department is located in the city of Kozani which is the heart of energy production in the country. Nearly 70% of the electricity is produced in the power plants located in the broader area of Kozani.Website: www.uowm.gr
Aristotle University Thessaloniki.The Aristotle University of Thessaloniki (AUTH) is the largest university in Greece. In the past five years, over 3,500 Research and Technological Development Projects have been carried out at AUTH. In the past three years, AUTH has cooperated with 1,080 partners (universities, research centres and companies). Within APICE, AUTH is represented by the Laboratory of Atmospheric Physics (LAP) of the Department of Physics (http://lap.physics.auth.gr ). The staff of LAP has expertise in many different scientific fields which are relevant to those investigated within the project, like the meteorological and photochemical modelling at urban and regional scales and the compilation of anthropogenic and natural emission inventories.Website: www.auth.gr/ w.a
Spanish Research Council- Institute of Environmental Assessment and Water ResearchIDÆA is one of the research centres belonging to the Spanish Research Council (CSIC). IDÆA is devoted to the study of the natural and anthropogenic changes occurring in the ecosystems of the geosphere using chemical and geochemical tools. IDÆA is focussed on the changes related to climate and those involving toxicity increases for organisms and humans. IDÆA has 174 re-searchers grouped in the Departments of Geosciences and Environmental Chemistry. They are expert in handling these problems using sophisticated analytical instrumentation and innovative environmental and geochemical methods. Website: www.idaea.csic.es
EUCC Mediterranean CentreEUCC is an association with 2700 members and member organisations in 40 countries. Founded in 1989 with the aim of promoting coastal and marine sustainable development by bridging the gap between scientists, environmentalists, site managers, planners and policy makers, it has grown since then into the largest network of coastal practitioners and experts in Europe. EUCC Mediterranean Centre, located in Barcelona, aims at carrying out the EUCC’s mission in the Me-diterranean region. EUCC is part of the ECNC Group. We work together towards a sustainable and beautiful Europe.Website: www.wearemediterranean.net

12

13
Comparison of the
harbour cities

14
At the start up of the project a comparative study of the air quality status of the five European port-cities involved in the project was performed, based on the air quality and meteorological data collected from the local networks. In particular, PM10 concentrations and their variation at the five port areas, as well as meteorological data were examined for the year 2009. The data used were obtained from: Torre Girona station for Barcelona city, Corso Buenos Aires station for Genoa city, Five avenues station for Marseilles city, Aghia Sofia station for Thessaloniki city, Parco Bissuola station for Venice city. The hourly, daily and monthly variation as well as the PM10 exceedances and the wind pattern for each area were discussed. A summary of this study fol-lows while an extended description of the results can be found in the extended Start Up Report of APICE project.
Figure 1 PM10 annual average values in μg/m3 Figure 2 Monthly variation of PM10 (in μg/m3)
The comparative study showed that the maximum annual average concentration (Fig.1) was observed in Thessaloniki (43 μg/m3), followed by Venice (37μg/m3), Barcelona (31 μg/m3) and Marseille (29 μg/m3). The minimum annual average concentration corresponded to Genoa (24 μg/m3). The annual concentrations were lower than the annual limit value (40 μg/m3) for all the areas except for Thessaloniki where it was slightly higher. The highest monthly averages (Fig.2 ) are observed during different seasons in each city as the factors that contribute to particles levels include permanent or seasonal sources. During winter, intense pollution episodes, central heating and bad operation of vehicle motors in starting because of the cold engine can lead to elevated particles levels. During summer, secondary particles formation, African dust episodes and enhanced resuspension processes are reported as the main factors for high PM levels. On the other hand, the daily variation of PM10 is quite similar in the five port areas (Fig3). The com-mon characteristic among the five cases is the decrease of particles levels during weekend due to reduced vehicles circulation and/or human activity. In general, the highest PM10 average daily values for each day of week were observed in Thessaloniki while the lowest were observed in Genoa. The difference is reduced during weekend and especially on Sundays, implying traffic as a significant particles source, affecting the port area.
Figure 3 Average values (in μg/m3) for each day of the week. Figure 4 Daily variation (in μg/m3) and exceedances of PM10 concentration
Figure 4 presents the PM10 limit exceedances based on the Directive 2008/50/EC (PM10 limit of 50 μg/m3 should not be exceeded for more than 35 times per calendar year). Although Thes-saloniki registers the highest mean value, the highest daily single values are recorded in Venice,
4. Framework analysis

15
especially during the wintertime, with frequent exceedance of the air quality limit value. Finally, it can be concluded that the hourly variation, which presents a similar picture in all cities (Fig 5), is strongly influenced by two factors: the vehicles circulation/intense human activity and the wind pattern of the area which affects pollutants accumulation or dispersion during day and night.
Figure 5 Hourly variation of PM10 (in μg/m3)
Figures 6 to 10 present PM10 concentration rose diagrams (μg/m3, degrees) and wind speed rose diagrams (m/s, degrees) for year 2009. The prevailing wind (velocity and direction) pattern differed significantly in every site, playing a crucial role to pollutants transportation. The meteoro-logical pattern of each area plays a significant role as a low dispersive atmosphere leads to par-ticle levels increase while rainy weather can lead to significant particle levels decrease. Another factor, characteristic of the near-the-sea areas is the presence of the sea breeze: a mechanism that can lead to pollutants transportation from the port to the city or pollutants dispersion at the port site.
Figure 6 Port of Venice – Wind roses Figure 7 Port of Marseille- Wind roses.
Figure8 PM10 Port of Genoa- Wind roses Figure 9 Port of Barcelona – Wind roses.
To conclude, in each of the five cities, there are different factors that contribute to particles levels, including permanent or seasonal sources. In general, the main reported particles sources in (all or part of) the five cities are: emissions from vehicles, buildings’ central heating, human activity, construction activities, resuspension, African dust outbreaks, emissions from trucks and ships in the ports, emissions from industries in surrounding areas. At the start up of the project, only qua-litative and indicative conclusions for the port’s effect on the city’s air quality could be drawn. To address this issue, more specified measurements including particles chemical characterization and focused source apportionment studies have been conducted in the frame of APICE project in every one of the 5 study areas.

16
In the framework of the APICE project, pollutant emission inventories have been prepared for five Mediterranean port-cities: Barcelona, Marseille, Genoa, Venice and Thessaloniki. The emission inventories reflect present time conditions and include emission data from all anthropogenic sources for CO, NMVOC, SO2, NOx, PM10 and PM2.5 (except Barcelona) as well as natural emissions (e.g. biogenic NMVOC, sea salt, wind-blown dust). Emphasis has been given on the estimation of the maritime sector emissions including emissions from ships and vessels and other activities in the harbor area of each port-city. The detailed description of the methodo-logies used for the estimation of all anthropogenic source emissions is already available in the report “Compilation of emission inventories for five large Mediterranean cities: Barcelona, Genoa, Marseille, Thessaloniki and Venice” which is available on the APICE website http://www.apice-project.eu/content.php?ID1=49&ID2=46&ID=46&ID3=49&lang=ENG). In this section, the metho-dologies used for the calculation of emissions from maritime sector will be presented only briefly.
The main maritime and harbor activities for which emissions have been estimated are the fol-lowing;
• Passenger ships (cruises, ferries, other passenger etc)• Cargo ships (dry bulk cargo, liquid bulk cargo, solid bulk cargo, container, general cargo, car-
carrier, cargo Ro-Ro, fridge cargo, other cargo etc)• Inland waterways vessels (sailing boats, personal watercraft etc)• Fishing boats • Other ships and vessels (tugs etc)• Port activities (dust emissions from (un)loading and piling of materials, exhaust and non-
exhaust emissions from vehicles, locomotives etc).
Maritime sector emissions have been estimated within a 100x100km2 area for all port-cities except for Genoa for which the reference area has a 30x40km2 extent. In addition, for Marseille, Genoa, Thessaloniki and Venice, ship emissions have been estimated for three operation modes: on-cruise, maneuvering and hotelling. In the emission inventory of Barcelona, ship emissions have been calculated only for the maneuvering and hotelling modes. The main methodologies applied for the emissions estimation of the maritime sector were those of the EMEP/CORINAIR emission inventory guidebook (EEA, 2006, 2009) implemented for Bar-celona, Venice and Thessaloniki and of Trozzi and Vaccaro (1998) (developed within the MEET project) used for both Genoa and Marseille. Furthermore, the emission factors of the EMEP/CORINAIR emission inventory guidebook (EEA, 2006, 2009) (for Barcelona, Thessaloniki and Ve-
5. Present time emission inventories

17
nice), Cooper and Gustafsson (2004) (for Thessaloniki) and Trozzi and Vaccaro (1998) (for Genoa and Marseille) were used.
A methodology of the US Environmental Protection Agency (EPA, 2006) was used for the determi-nation of emissions from handling and storage piles in the port (for Venice and Thessaloniki). Dust emissions from the circulation of port vehicles or machineries on paved roads were accounted for in the Thessaloniki emission inventory according to (EPA, 2011). In addition, for Venice, the Italian Fleet COOPERT IV Emission Factors (ISPRA, 2012) were applied on the mileages driven by the total amount of vehicles (duty vehicles and passenger ones) arriving and leaving from the port in a year, as estimated by the Venice Port Authority. Finally, the EMEP/CORINAIR emission inventory guidebook factors were used for the railway transport emissions for Venice.
Figure 1 illustrates the annual ship traffic for the study areas for the years 2006 to 2010. The ports of Marseille and Barcelona have comparable ship arrival numbers which are the highest in comparison to the other ports. Genoa is the third in the rank followed by Venice and Thessaloniki.
Following, Table 1 presents the calculated ship and vessel pollutant emissions for the cities stu-died.
Table 1. Ship and vessel pollutant emissions (Mg/year) per study area.Referenceyear
Reference area (km2)
NOx SO2 NMVOC PM10 PM2.5
Barcelona1 2008 100x100 6261 7564 329 525
Genoa 2010 30x40 4191 820 230 122 121
Marseille 2007 100x100 11841 16350 3601 304 304
Thessaloniki 2010 100x100 10881 4529 194 288 287
Venice 2011 100x100 4622 1655 224 249 249
1 Emissions for Barcelona have been estimated only for maneuvering and hotelling modes, while for the other study areas
on-cruise pollutant emissions have been also accounted for.
Table 2 presents in more detail the ship and vessel PM10 emissions including emissions from passenger ships, cargo ships (e.g. containers, dry and liquid bulk ships, general cargo, Ro-Ro cargo, other cargo), other ships and vessels (e.g tugs), inland waterways vessels and fishing boats. According to Table 2, cargo ship category is the major contributor to total ship and vessel PM10 emissions. The second most important emission source is the passenger ships for all the under study cities except for Thessaloniki for which fishing boats is the second larger contributor.
Figure 1. Ship arrivals per year for all study areas.

18
Table 2. PM10 emissions (Mg/year) for different ship and vessel types for each study area.Referenceyear
Reference area (km2)
Passenger Ships
Cargo ships
InlandWaterways
Fishing Other shipsand ves-sels
TOTAL
Barcelona1 2008 100x100 111 359 -- - 55 525
Genoa 2010 30x40 43 68 - - 11 122
Marseille 2007 100x100 78 178 7 - 41 304
Thessaloniki 2010 100x100 2 221 7 58 0.4 288
Venice 2011 100x100 94 135 842 - 20 2492
1 Emissions for Barcelona have been estimated only for maneuvering and hotelling modes, while for the other study areas
on-cruise pollutant emissions have been also accounted for.2For Venice, the emissions by water traffic inside the Venice Lagoon and the historical city is reported; these emissions
are not summed up on the total since there’re not to be addressed to the Venice port activities.
Emissions from passenger and cargo ships during the hotelling and maneuvering modes are presented in Figure 2 in an effort to make a comparison of the pollutant emissions between the study areas. Attention has to be paid on the reference year of the emission estimation which is not the same for all the cities. It should be noted also that since 2010, the sulphur limit of 0.1% m/m in ship fuels on hotelling phase entered into force (Directive 2005/33/EC). For Thessaloniki, the regulation for the maximum sulphur content has been applied since 2010 concerning though both maneuvering and hotelling modes.
According to Figure 2, Marseille has the highest ship emissions during hotelling and maneuve-ring modes for all pollutants except for PM10 for which emissions are the highest for Barcelona. This can be explained by the fact that Marseille and Barcelona have the highest ship traffic as presented in Figure 1. It should be noted also that the SO2 emissions for Marseille and Barcelona are much higher than those for the other cities. One of the reasons is the reference years of the emission inventories for these cities being prior to 2010 and as a consequence prior to the en-forcement of the regulation for a sulphur content upper limit in ship fuels on the hotelling phase. Genoa is third in the rank for NOx, SO2 and NMVOC emissions followed by Venice and Thessa-loniki. Regarding PM10 and PM2.5 emissions, Venice is third in the rank followed by Genoa and Thessaloniki.

19
Figure 2. Passenger
and cargo ship pollu-
tant emissions during
the maneuvering and
hotelling modes for
each study area (re-
ference year: 2008 for
Barcelona, 2010 for
Genoa, 2007 for Mar-
seille, 2010 for Thes-
saloniki and 2011 for
Venice).
In the emission inventories of Barcelona, Genoa, Thessaloniki and Venice, the emissions from additional activities that occur within the harbor area other than ship and vessel have been taken into account as well as those induced by the presence of the port. For Barcelona and Genoa, these are emissions from cargo handling, solid bulks and land traffic (trucks and trains). For Ve-nice, dust emissions from loading, unloading and piling of materials, exhaust and non-exhaust emissions by passenger and duty vehicles and exhaust emissions by freight on non-electrified railway were estimated. For Thessaloniki, emissions from harbor operations including dust emis-sions from unloading, loading and piling of materials and dust emissions from the circulation of port vehicles or machineries on paved roads were accounted for. These emission data are shown in Table 3. For Marseille, emissions from port activities other than ship and vessels have not been estimated because no input data were available.
Table 3. Pollutant emissions from port activities other than ship and vessel and pollutant emis-sions induced by the port activities (in Mg/year).
Referenceyear
NOx SO2 NMVOC PM10 PM2.5
Barcelona 2008 724 20 0 106 -
Genoa 2010 313 11 16 36 31
Marseille - - - - - -
Thessaloniki 2010 - - - 37 6
Venice 2011 811 0.4 42 30 24
A further analysis of the emission data presented above has allowed the identification of the ma-ritime and harbor activities that are more risky to the environment in terms of the pollutants that are emitted in the atmosphere. This analysis is presented in detail in the “Identification of the risk activities” reports which are available on the APICE website and is summarized below for each study area.

20
BarcelonaFor Barcelona, pollutant emission data refer to the following maritime and harbor activities: Ships and vessels, Harbor craft (tug boats and au-xiliary means), Terminal equipment (cargo handling), Solid bulks, Land traffic (heavy-duty vehicles and locomotives), Enlargement and mainte-nance works.Regarding NOx, NMVOC and PM10 emissions from ships and vessels, the major source contributor is the container ships while the second one is the liquid bulk cargo ships followed by the ferries passenger ships.
GenoaFor Genoa, pollutant emission data refer to the following maritime and harbor activities: Ships and vessels (cargo ships, passenger ships, tugs), Cargo handling, Solid bulk operations, Liquid bulk operations, Heavy-duty vehicles, Rail road locomotives.Although the data validation is not yet final, the identification of risk activities allows to evaluate that, considering PM2.5 and NOx, cargo ships are the major source contributor, followed by passenger ships. Solid bulk is higher contributor to PM2.5 emissions. Because of the conformation of the Port of Genoa, all port activities (and in particular the passenger terminals and industrial activities) have a direct effect on areas densely populated and rich in artistic treasures.
MarseilleFor Marseille, pollutant emission data refer to the following maritime and harbor activities: Solid and liquid bulk ships, Containers, Cargo ships, Passenger ships, Inland waterways and Others. Marseille port is divided in two parts distant of 40 km: the western har-bor mainly dedicated to goods transport and the eastern harbor, close to the city center, mainly dedicated to passenger transport. At the scale of the whole Marseille port, two activities display a major contribution to emissions: liquid bulk and passenger transport. The third activity in terms of emissions is the container. For the western part, the major source contributor is the liquid bulk ship followed by container ship. For the eastern part, the major source contributor is the passenger ac-tivity. In the domain, pollutant emissions are dominated by the hotelling phase, higher than maneuvering and on-cruise emissions, except for NOx emissions, dominated by the maneuvering phase.

21
ThessalonikiFor Thessaloniki, pollutant emission data refer to the following mariti-me and harbor activities: Passenger ships (ferries, other passenger), Cargo ships (general cargo, container and other cargo vessels), Tugs, Harbor operations (Loading/unloading/pilling of goods/materials and vehicles operation in the port), Inland waterways vessels (small and medium vessels e.g. pleasure crafts), Fishing boats.In the domain of 100x100 km2 extent, on an annual basis, cargo ship-ping is the major contributor to emissions for all pollutants. In par-ticular, the most important source for NOx, SO2 and NMVOC total emissions is the Containers while for PM is the General Cargo ships. CO is emitted mainly by the Other Cargo Vessels. The second most important emission source is the fishing boats. The in-port storage processes like loading, unloading and pilling of goods/materials can be identified as the third in the rank of the PM10 emission sources. Concerning PM2.5, the third most important emission source is the inland waterway vessels. In addition, for all pollutants, the total cruising emissions represent the highest share of total emissions from all operation modes (cruising, maneuvering and hotelling). This result is valid for each of the cargo ship types (general cargo, container, other cargo vessels). On a more local scale (in the port area), on an annual basis, the hotelling of ships is the major emission source for PM2.5, CO and NMVOC. PM10 are emitted mostly from the in-port pro-cesses relevant with the loading, unloading and pilling of goods/materials. The largest NOx and SO2 emissions are released from the maneuvering of ships; however, the NOx ship maneuvering emissions are comparable with those emitted from ship hotelling.
VeniceFor Venice, pollutant emission data refer to the following maritime and harbor activities: Ships and vessels, Harbor craft (tug boats), Loading and unloading of ships, In port traffic load induced by port activities (as road and as railway transport). Emission estimation has been performed not only for the total amount of traffic of the Port of Venice, but also splitting the emissions betwe-en the terminal inside the historical city of Venice (mostly Passenger Terminals) and the Commercial and Industrial Terminals in Porto Mar-ghera (on the inner border of the lagoon) or southward to the Oil Ter-minal in San Leonardo. On the 100 x 100 km2 scale, chosen as APICE domain to be analyzed, the kilometers travelled in cruise phase by the ships outside the lagoon are almost 44-47 km, depending on the la-goon inlet (Lido or Malamocco), of which 22 km inside territorial seas.The emissions due to the local traffic of boats and water buses (va-poretti) in the city of Venice and in the surrounding lagoon have been considered, too. The calculation has been based on the total amount of gasoline and marine gas oil sold by the fuel stations operating in the area and the fuel consumed by the public water service (consumption data referred to year 2008).In Venice, considering every ship category separately (passenger, dry bulk cargo, tanker, contai-ner, general cargo, etc.), the most important emission source for all pollutants is the passenger ships. The second larger contributor to total maritime emissions is the Containers for all pollu-tants except NMVOC for which the second most important source is the liquid bulk ships. Regar-ding passenger ships, emissions are highest during the cruising mode for all pollutants except for NMVOC emissions which are highest during the hotelling phase. Emissions from liquid bulk ships are highest during hotelling mode for all pollutants except SO2 for which emissions are highest on-cruise.

22
ConclusionsFocusing on PM10 which is a key species within APICE, the study on the identification of the present time maritime and harbor activities that are most risky for the environment in terms of emissions released in the atmosphere indicates that cargo shipping is the major source contribu-tor to PM emissions while in most cases passenger ships is the second most important emission source of PM. Considering the usual location of the passenger ships terminals in the very heart of the port-cities studied, moreover in some cases (Venice and Genoa) at a very short distance to the populated urban areas, passenger ships have been identified as an emission source for which mitigation actions should be examined within the course of the project.
The ports of Marseille and Barcelona have been identified as those with the highest passenger and cargo ship pollutant emissions during the maneuvering and hotelling modes considering also the increased grater ship traffic compared to the ports in the other study areas.
References
1. Cooper DA., T. Gustafsson, 2004. Methodology for calculating emissions from ships: Update of emission factors, Report series SMED and SMED & SLU 4. Available at http://westcoastcollaborative.org/
2. EEA (European Environment Agency), 2006. EMEP/CORINAIR Emission Inventory Guidebook 2006. (EEA Technical Report no.30). Available at http://reports.eea.europe.eu/EMEPCORINAIR4.
3. EEA (European Environment Agency), 2009. EMEP/EEA air pollutant emission inventory guidebook 2009. (EEA Technical Report no. 9/2009). Available at http://www.eea.europa.eu/publications/emep-eea-emission-inventory-guidebook-2009
4. EPA, 2006 (United States Environmental Protection Agency). AP 42, Fifth Edition, Volume I Chapter 13: Miscella-neous Sources. 13.2.4., Aggregate Handling and Storage Piles. Available at http://www.epa.gov/ttnchie1/ap42/ch13/
5. EPA, 2011 (United States Environmental Protection Agency). AP 42, Fifth Edition, Volume I Chapter 13: Miscella-neous Sources. 13.2.1., Paved Roads. Available at http://www.epa.gov/ttnchie1/ap42/ch13/
6. ISPRA, 2012. Dati sul trasporto stradale utilizzati per l’inventario nazionale con riferimento alla serie storica 1990 - 2010 ed al programma di stima Copert 4 (versione 9.0, Ottobre 2011). http://www.sinanet.isprambiente.it/it/inven-taria/Gruppo%20inventari%20locali/datitrasporto1990-2010.zip/view
7. Trozzi C. and Vaccaro R., 1998. Methodologies for estimating air pollutant emissions from ships. Techne report
MEET RF98.

23
Since no absolute source apportionment approach exists, intercomparison of the different metho-
dologies used by each scientific partners of APICE is a prerequisite for any comparison between
the 5 involved in the project. An intercomparison measurement campaign thus took place at
Marseilles, from January the 25th to March the 2nd 2011. It gathered all of the APICE scientific
partners on the same sampling site, « 5 avenues » (urban background measurement site, located
in a large landscape park, in Marseilles downtown). A large set of instruments was deployed to
insure the constant monitoring of aerosol physico-chemical parameters and associated gas pha-
se (VOC’s and regulated pollutants – i.e.: O3, NOx, SO2-); including all samplers and analyzers to
be used by each scientific partner of APICE for the second part of the project.
Particles samples collected throughout the measurement campaign were then analyzed accor-
ding to each partner specific method. A first report discussing of the intercomparison of measu-
rements has been already published1. Those data were then used as input for different source
apportionment methods, by each scientific partner, as summarized in table 1.
Table 1: Source apportionment methods used by each partners
PMF approach has been chosen by 4 partners (IDAEA-CSIC, Univ. Genoa, UOWM, and ARPA Ve-
neto), while CMB has been used by one partner (Aix Marseille Univ.). Each team used a different
set of variables, mixing metals/trace elements, sulfate, nitrate, ammonium, OC (Organic Carbon),
EC (Elemental Carbon). Those analyses leaded to the characterization of different sources profi-
les for each partner, which had to be grouped into 5 source groups: Secondary aerosol, Industrial
/Marine, Primary Natural, Residential and Transport emissions. On Figure 1 are displayed the
average results obtained for the different scientific partners, for each source group.
Primary natural source group (mainly sea salt and dust) can be regarded as in reasonable agree-
ment between partners, taking into account the different approaches and data set used.
1 Progress report can be downloaded here :
http://www.apice-project.eu/img_web/pagine/files/Final%20report%20Intercomparison%20campaign%20final%20ver-
sion.pdf
6. Intercomparison campaign

24
Figure 1: Average relative contributions of source groups to PM2.5
Residential sources are, in this study, quasi exclusively related to wood burning emissions, cle-
arly identified by the use of very specific molecular markers (levoglucosan or dehydro abietic
acid). As for transport sources, a good agreement can be observed between the different part-
ners, with the exception of Univ. Genoa results, which can be easily explained. Actually, vehicular
exhaust and wood burning are both largely dominated by organics. Since, in this approach, no
variables providing insights into the chemical nature of this fraction have been injected, we can
consider that the Road factor here represents the sum of residential and road sources. This as-
sumption is supported by the important homogeneity observed for the sum of those 2 sources
for the different partners.
For industrial and secondary factors the situation is a little bit different and these two factors
must be considered together in the discussion. Industrial sources contribution shows a high
discrepancy between partners, with higher contributions estimated for PMF approach. PMF
approach is based on the internal variability of the data set; thus, atmospheric dynamics (advec-
tion of air masses or boundary layer height) can play a major role on the identification and the
quantification of the different factors. Marseille is downwind the industrial area during particular
wind conditions: mistral (NW winds). Mistral is canalized by the Rhône valley (a heavily urbani-
zed and industrial area), bringing to Marseille in most cases (when moderate winds) high loads of
secondary aerosol particles. Therefore, a significant fraction of the secondary aerosol particles
from medium and long range transport episodes have been included in the industrial factor by
the PMF approach. This assumption is supported by the fact that the sum of industrial and se-
condary sources are in pretty good agreement between partners.
Considering the conditions of the intercomparison exercise (different data set, and partners total-
ly free to use its own methodology), results obtained can be consider in quite good agreement.

25
Source Apportionment analysisThe contribution of the different emission sources – both anthropogenic and natural – to the Par-
ticulate Matter concentrations – has been highlighted by two different approaches: the receptor
models and the Chemical Transport Models.
The two different techniques of Source Apportionment analysis, have been applied at the same
time in the five cities in order to answer to these questions:
• whichpollutantemissionmostlyaffectsPM10andPM2.5concentrations?
• whichistheweightofthepresenceoftheportinthestudiedcitiesintermsofPM10and
PM2.5 concentrations?
The two different Source Apportionment (SA) approaches aimed at integrating the peculiar po-
tentialities of both techniques: by one side receptor models, more suitable to pointing out speci-
fic emission sources bind to specific markers, and, on the other side, CTMs, which extend their
assessment on the formation of secondary aerosols, since they apportion the gas precursor
emissions, too. Moreover, while receptor models give SA outcomes on some monitoring sites
only, SA by CTMs provides outcomes on the whole studied territory with a certain resolution
(spatial maps).
Receptor Models aim to re-construct the contribution of emissions from different sources of
atmospheric pollutants, e.g., particulate matter (PM), based on ambient data (i.e. PM elemental
and chemical composition) registered at monitoring sites. The fundamental principle of receptor
modelling is that mass and species conservation can be assumed and a mass balance analysis
can be used to identify and apportion sources of airborne PM in the atmosphere. One of the
main differences between among models is the degree of knowledge required about the pol-
lution sources prior to the application of receptor models. A second major difference between
these different approaches is the number of observations (e.g., samples) needed to apportion
sources. While Chemical Mass Balance (CMB) model assumes and needs an a-priori knowledge
of the emission sources and could be used with only one sample, approaches such as Positive
Matrix Factorization (PMF) need a significant number of samples (at least equal to the number of
chemical species included in the model) to single out the emission sources active in a particular
area and to provide statistically sound results. PMF (in Barcelona, Genoa, Thessaloniki and Ve-
nice) and CMB (in Marseille) are the two approaches adopted by the APICE Partners. Note that,
even if none of these approaches can be regarded as absolute, the conclusions drawn from the
inter-comparison campaign recommend using the PMF as a common approach. This work will
be finalized in Marseille in early February 2013 and can not be reported here.
We report here a very synthetic summary of the results obtained in each study area:
Barcelona: Simultaneous sampling was carried out in two sites every four days from Februa-
ry 2011 to January 2012: Port of Barcelona (41°19’58”N; 2°8’27”E) and Palau Reial (urban
background site, 41°23’15”N; 2°6’56”E). A PMF analysis was performed on 295 cases, including
simultaneous PM10 and PM2.5 measurements performed at both monitoring sites.
7. Source Apportionment Outcomes by Receptor Models

26
Barcelona,Average results:
Sources Port: Contribution (µg/m3) to PM2.5 PM10
Palau Reial: Contribution (µg/m3) to PM2.5 PM10
Industrial emissions 1.8 ± 0.1 0.3 ± 0.1 0.3 ± 0.0 0.8 ± 0.1
Mineral/road dust 9.2 ± 0.5 2.1 ± 0.2 0.4 ± 0.1 3.3 ± 0.3
Ammonium sulphate 2.9 ± 0.6 7.9 ± 0.9 9.9 ± 0.9 4.8 ± 0.7
Fuel oil combustion 3.8 ± 0.3 1.1 ± 0.2 0.9 ± 0.1 2.8 ± 0.2
Vehicle exhaust emissions
6.6 ± 0.8 5.3 ± 0.5 2.9 ± 0.3 2.6 ± 0.4
Aged sea spray + nitrate
12.1 ± 1.0 9.2 ± 0.8 2.3 ± 0.4 2.0 ± 0.3
Unaccounted 0.0 0.8 1.6 1.2
The biggest differences between the port and the urban area of Barcelona were found for the mi-neral dust source, attributed to the influence of dust re-suspension from the new port area under construction, but also to re-suspension of road dust from the intense truck traffic around the port area. The fuel oil combustion source was also higher for the port of Barcelona, reflecting direct emissions from shipping. The contribution of the industrial emissions was also higher at the port area. This is attributed to the transport of pollutants from the industrial area in the surroundings of Barcelona. The aged sea spray+nitrate source was also higher at the port area. This source reflects aging of pollutants during transport of air masses to the monitoring site. However, the ammonium sulphate source was much higher at the urban area of Barcelona. This is attributed to the formation of secondary ammonium sulphate from SO2 shipping.The results show that the contribution of port emissions to PM10 and PM2.5 at the port were around 40% for both PM10 and PM2.5, being mainly attributed to mineral dust (23 and 17% for PM10 and PM2.5, respectively) and fuel oil combustion (10 and 16%, respectively). Vehicle exhaust emissions accounted for 3% in both fractions, and ammonium sulphate for 2 and 6%, respectively.At the urban area of Barcelona the contributions from the port were 11% and 18% for PM10 and PM2.5, respectively. The influence of the port in the urban background of Barcelona is mainly attributed to fuel oil combustion (4-5%) and ammonium sulphate (6 and 12%, respectively) from the formation of secondary ammonium sulphate during transport of SO2 emissions from the port to the urban background site.It is important to highlight the formation of secondary aerosols in the urban area of Barcelona, from the gaseous precursors SO2, transported from the port, and the high levels of NH3 measu-red at the urban background.
Genoa: the monitoring campaign was organized collecting daily PM2.5 samples in three si-tes: two immediately outside the harbour area (Corso Firenze, 44°25’5.69”N; 8°55’38.97”E, and Multedo, 44°25’37.18”N; 8°49’49.21”E) and one in the northern area of the city (Bolzaneto: 44°27’45.92”N; 8°54’4.40”E) about 7 km inland. The sampling started in February 2011 in Corso Firenze and in May 2011 in the other two sites and was stopped in all the sites in October 2011).
A PMF analysis was performed to apportion the PM2.5 sources.
Genoa, Average results (contribution to PM2.5 level in μg/m3):
Secondary sulphates
Secondary nitrates
Road trafficHeavy oil
combustionSoil dust Soil dust
Cs. Firenze 6.7 ± 0.5 1.0 ± 0.2 3.2 ± 0.3 1.9 ± 0.5 1.1 ± 0.4 -
Multedo 6.7 ± 0.4 1.1 ± 0.2 2.4 ± 0.3 1.6 ± 0.4 1.0 ± 0.2 0.7 ± 0.3
Bolzaneto 7.3 ± 0.6 1.4 ± 0.2 4.3 ± 0.6 1.5 ± 0.2 1.0 ± 0.2 -

27
The PM2.5 level (about 14 μg/m3) and composition turned out to be quite uniform, with secon-
dary components (sulphates, nitrates but organic aerosol too) very well correlated in the three
sites. Road traffic gave the highest contribute to PM2.5 level in Bolzaneto located a few hundred
meters from the large highway connecting Genoa to Milan. Heavy oil combustion can be attribu-
ted completely to ship emissions being any other residential source of this type negligible in the
city. On average, ship emissions contributed to 10%- 15% of PM2.5 level during spring-summer
2011.
Marseille: The monitoring campaign in Marseille was conducted In two sites : “Cinq avenues”
(43°18’18.84”N; 5°23’40.89”E, a urban background site where PM2.5 was collected daily from
July 2011 to July 2012) and “dock east of the harbor” of Marseille (43°18’4.18”N; 5°21’48.71”E,
site affected by the emissions of industrial zone situated in the west of Marseille;PM2.5 sampling
started in November 2011 and finished in July 2012 and each filter represents a sampling period
of 48 hours). EPA CMB 8.2 was used to apportion sources and estimates their relative contribu-
tions.
Marseille, Average results at Cinq Avenues in μg/m3 (rows order: summer, fall,
winter, spring)
Biomass burning
Vehicular emissions
Vegetative detritus
Natural Gas Combustion
Shipping Main Engines
Coke production, Steel facilities
0.31 ± 0.06 6.5 ± 1.3 2.3 ± 0.5 0.01 ± 0.01 0.07 ± 0.01 0.04 ± 0.01
16 ± 3 7.0 ± 1.4 3.4 ± 0.7 0.00 ± 0.01 0.15 ± 0.03 0.08 ± 0.02
13 ± 3 8.2 ± 1.6 1.1 ± 0.2 0.03 ± 0.01 0.06 ± 0.01 0.21± 0.04
0.7 ± 0.1 6.1 ± 1.2 1.2 ± 0.2 0.01 ± 0.01 0.08 ± 0.02 0.05 ± 0.01
Unexplained organic matter
(OM)
Secondary sulfate (SO4)
Secondary nitrate (NO3)
Secondary ammonium (NH4)
Crustal dust Sea salt
0.38 ± 0.08 1.3 ± 0.3 0.41 ± 0.08 0.6 ± 0.1 1.8 ± 0.4 0.4 ± 0.1
0.16 ± 0.03 1.6 ± 0.3 2.2 ± 0.4 1.9 ± 0.4 1.6 ± 0.3 0.4 ± 0.1
0.28 ± 0.06 1.9 ± 0.4 2.9 ± 0.6 2.1 ± 0.4 0.7 ± 0.1 0.18 ± 0.04
1.0 ± 0.2 2.3 ± 0.5 0.75 ± 0.15 1.2 ± 0.3 1.3 ± 0.3 0.21 ± 0.04
Marseille, Average results at dock east of the harbor in μg/m3 (rows order: sum-
mer, fall, winter, spring)
Biomass burning
Vehicular emissions
Vegetative detritus
Natural Gas Combustion
Shipping Main Engines
Coke production, Steel facilities
0.15 ± 0.03 9.2 ± 1.8 1.3 ± 0.3 0.01 ± 0.01 0.18 ± 0.04 0.03 ± 0.01
17 ± 3 7.4 ± 1.5 0.8 ± 0.2 0.00 ± 0.01 0.10 ± 0.02 0.06 ± 0.01
7.0 ± 1.4 9.7 ± 1.9 1.2 ± 0.2 0.04 ± 0.01 0.11 ± 0.02 0.08± 0.02
1.7 ± 0.3 9.9 ± 2.0 0.9 ± 0.2 0.00 ± 0.01 0.17 ± 0.03 0.07 ± 0.01
Unexplained organic matter
(OM)
Secondary sulfate (SO4)
Secondary nitrate (NO3)
Secondary ammonium (NH4)
Crustal dust Sea salt
0.46 ± 0.09 1.1 ± 0.2 0.22 ± 0.04 0.75 ± 0.15 0.5 ± 0.1 0.35 ± 0.07
0.00 ± 0.01 2.8 ± 0.6 2.3 ± 0.5 1.9 ± 0.4 1.0 ± 0.2 0.4 ± 0.1
1.9 ± 0.4 2.3 ± 0.5 3.7 ± 0.7 1.9 ± 0.4 1.5 ± 0.3 1.7 ± 0.3
0.19 ± 0.04 5 ± 1 2.3 ± 0.5 1.9 ± 0.4 1.0 ± 0. 3.0 ± 0.6
At the urban background station the PM2.5 are dominated by OM. EC is also a dominant fraction.
Overall composition of PM2.5 in the harbour site is very similar. OM and EC represent 55% and
9% of PM2.5, respectively. Only trace elements concentrations are significantly higher in the

28
harbour site (9% vs. 3% for the urban background site). This difference is mostly due to Ca, Na
and Cl. Higher Organic markers concentrations are observed in the Urban Background station,
especially levoglucosan and odd n-alkanes. Higher concentrations of Ba, Sn, Cd and Cu in the
Urban site, while Na, Cl, Ca, Cs, Pb, V and Ni are more abundant in the vicinity of the harbour. Du-
ring the fall and winter biomass burning (wood and green wastes) is the most abundant sources
at both sites with the exception of harbour site during winter (most important source is vehicular
emissions).
Harbour related activities represent only a small fraction of the PM2.5 (0.8 and 1.2% in the urban
background and harbour sites, respectively).
Thessaloniki:Two sampling sites were selected: the City Hall at the city center (40°62’36.25”N,
22°95’38.27”E) and the Port (40°63’98.77”N, 22°91’83.57”E). PM2.5 daily samples were col-
lected between 14/06/2011-22/05/2012 in selected days for a grand total of 322 samples. A
PMF analysis was performed to apportion the PM2.5 sources.
Thessaloniki, Average results (contribution to PM2.5 level in μg/m3):
City Hall Port
Traffic (vehicle exhausts 11.3 ± 0.6 Vehicle exhausts + road dust 16.0 ± 0.8
Industry 3.6 ± 0.2 Industry/mineral 14.2 ± 0.7
Marine (sea spray + ships emissions) 2.0 ± 0.1 Sea spray 3.0 ± 0.2
Road dust 6.1 ± 0.3 Ship emissions 11.3 ± 0.6
Combustion 4.4 ± 0.2 Combustion 5.2 ± 0.3
Secondary aerosol 11.7 ± 0.6 Secondary aerosol 14.1 ± 0.7
Not apportioned 8.6 ± 0.4 Not apportioned 8.2 ± 0.4
Two traffic-related sources are presented at theCity Hall: one related to vehicle exhausts and one
to road dust. These two sources are combined and presented as one source for the case of the
Port. The total contribution to PM2.5 in the second case is lower. A marine-origin source with
rather low PM2.5 contribution is presented at the city center. The same source is split to two dif-
ferent sources for the Port site: sea spray and fuel oil combustion (ships emissions), the sum of
which presents stronger contribution to PM2.5 due to the proximity to the sources (about 16% of
PM2.5). The combustion-related source presents seasonal variation, being more intense during
the cold season, therefore it can be connected to central heating emissions. The mineral/industry
source contribution is stronger at the Port site, without presenting significant seasonal variation.
The secondary aerosols considerably contributes to PM2.5 at both sites (20%-25% of PM2.5).
Venice: Three sampling sites were selected: Parco Bissuola (45°29’58.71”N; 12°15’40.55”E)
and Malcontenta (45°29’58.71”N; 12°15’40.55”E), respectively in the district of Mestre and in
the industrial harbour area. In both the sites, PM10 daily samples were collected along the who-
le year 2011 and fully characterized in terms of PM10 composition. A third site, Saccafisola
(45°25’42.18”N; 12°18’46.79”E), was chosen in Venice in the area of the passenger terminal. In
this case a partial chemical speciation of the PM10 samples was only performed and the source
apportionment was limited to the assessment of heavy oil combustion.
A PMF analysis was performed to apportion the PM10 sources.

29
Venice, Average results (contribution to PM10 level in μg/m3):
BissuolaSpring/ Summer
Bissuola Fall/Winter
MalcontentaSpring/ Summer
MalcontentaFall/Winter
Saccafisola Spring/Sum-
mer
Saccafisola Fall/Winter
Biomass burning
5.4 ± 0.5 10 ± 1 1.1 ± 0.4 11.3 ± 1.5 - -
Heavy oil combustion
3.7 ± 0.3 3.1 ± 0.3 6.5 ± 0.5 6.1 ± 0.5 6.1 ± 1.5 3.6 ± 0.9
Glass production
0.9 ± 0.5 1.1 ± 0.6 0.4 ± 0.2 0.8 ± 0.5 - -
Industry (Cr)
0.6 ± 0.3 0.8 ± 0.5 1.1 ± 0.2 3.9 ± 0.5 - -
Industry (Pb)
2.6 ± 0.5 7.3 ± 1.4 0.9 ± 0.7 1.2 ± 1.0 - -
Road traffic
0.7 ± 0.4 1.0 ± 0.4 5.0 ± 0.5 8.3 ± 0.7 - -
Soil dust
0.5 ± 0.1 2.1 ± 0.3 1.1 ± 0.2 2.1 ± 0.3 - -
Secondary sulphathes
5.6 ± 0.4 6.3 ± 0.5 8.1 ± 0.9 7.8 ± 0.9 - -
Secondary nitrates
1.0 ± 0.1 10.7 ± 0.5 1.2 ± 0.1 10.9 ± 0.5 - -
Several industrial activities contribute to the PM10 level in the Venice area with a cumulative ave-
rage weight of 10% - 20%. Heavy oil combustion is due both to ship emissions and to industrial
plants: in the two inland sites (Bissuola and Malcontenta) the percentage weight of these sources
does not show any seasonal trend while in Venice area (Saccafisola) a quite clear increase during
the touristic season could be appreciated (in percentage terms the weight increase from about
13% to about 23% of PM10) this indicating a preponderant impact of ship emissions ( large cru-
ise ships and ferryboats).
Conclusions
The long monitoring campaigns in each study area produced a quite detailed picture of PM
composition and sources. Even if the results are not directly comparable since they partially de-
pend on the position of the sampling sites, in four cities the impact of ships emissions has been
detected at comparable and significant levels (between 10% -20% of the total PM) while a lower
figure came out from the Marseille data set. This was the only one analysed with the CMB model
and a systematic difference with the PMF approach is not surprising and would deserve a much
broader discussion. The PMF approach in Marseille will be finalized at the beginning of February
2013.

30
8. Source Apportionment Outcomes by Chemical Transport Model
Source Apportionment analysis by CTMs has been performed using the zero-out modeling tech-
nique by the groups running CHIMERE (Barcelona and Marseille) whereas for CAMx the specific
PSAT tool has been applied (Genoa, Venice, Thessaloniki and one once again Marseille). The
zero-out method sets to zero a specific emission on the original emission inventory and measu-
res the change in the concentration output; a complete model run is required for each source or
emission sector under investigation. Particulate Source Apportionment technology (PSAT) uses
reactive tracers to apportion primary PM, secondary PM and gaseous precursors to secondary
PM among different source categories and source regions.
We report here a very synthetic summary of the results obtained in each study area.
BarcelonaSource apportionment for PM10 and PM2.5 has been evaluated by CHIMERE zero-out method
for both summer (August 2011) and winter (December 2011) periods. The maritime contribution
analysis has been calculated by the zero-out method applied on the Other Mobile Sources (SNAP
8) in which port emissions are included.
SA outcomes are here discussed for three sites: an urban site in Barcelona downtown and two
sites near the Port: the World Trade Center, which can be considered as a port background site
and a second site located at the very heart of the port of Barcelona.
All the three sites present exceedances of the daily PM10, both during summer and winter pe-
riods, with higher concentration both for PM10 and PM2.5 during summer than at wintertime,
indicating the importance of secondary formation in PM levels in the city of Barcelona.
The highest concentrations are recorded at the site at the very heart of the port of Barcelona
(Table 1).

31
Table 1: PM10 and PM2.5 concentrations recorded at 3 monitoring sites in summer and winter
period
SitePM10 (µg/m3)
summerPM10 (µg/m3)
winterPM2.5 (µg/m3)
summerPM2.5 (µg/m3)
winter
Barcelona downtown 40.5 24.0 19.2 14.2
World Trade Center (WTC) 52.2 40.2 24.6 24.6
Inner Port (POR) 69.4 55.2 43.2 29.4
In all the three sites, Source Apportionment outcomes for PM10 and PM2.5 are slightly different
but not so much to give different ranking in the contribution analysis (Tab.2).
In summertime the most important contributors at the various sites are the following:
• urban site: on-road transport, followed by the maritime sector (included in other mobile
sources);
• World Trade Center site: maritime sector, followed by on-road transport. Here, also the
boundary conditions and biogenic sources have a relevant weight on PM10 and PM2.5 con-
centrations;
• inner port site: the maritime sector, dominates with over 50%, followed by on-road transport.
Here, the external contribution is reduced from both the urban and the WTC sites, indicating
the important local contribution of emissions to air quality.
In wintertime the most important contributors at the various sites are the following:
• urban site: the contribution from outside of the domain through the boundary conditions and
combustion in manufacturing industry (SNAP 3); on road traffic loses importance, as well as
the maritime sector;
• World Trade Center site: the maritime sector followed by on-road transport, with the weight
of combustion in manufacturing increased conversely to biogenic contributions in respect to
summertime;
• inner port site: the maritime sector still dominates but with a less important weight then sum-
mertime (38%); the second contributor is the combustion in manufacturing processes.
Table 2: SA from CHIMERE during summer (August 2011) and winter (December 2011) at 3
Barcelona sites.
PM2.5 Source Apportionment (% on total concentrations)
Urban site World trade center Inner port
summer summer summer winter summer winter
Boundary conditions 6.3% 14.3% 8.3% 8.9% 5.5% 7.7%
Road Transport 20.5% 8.5% 18.6% 18.1% 11.7% 8.3%
Other mobile sources (including Maritime/Harbor emissions)
16.7% 4.5% 28.4% 23.2% 53.9% 38.1%
Non-industrial combustion 6.9% 3.5% 5.6% 6.5% 4.6% 3.6%
Energy production and Industries 7.4% 8.9% 7.0% 9.3% 5.8% 16.1%
Agriculture 2.5% 1.3% 2.4% 1.2% 1.4% 1.2%
Biogenic sources 5.2% 3.1% 7.2% 2.5% 4.9% 2.0%
Others 34.5% 55.9% 22.5% 30.3% 12.2% 23.0%
Focusing on the other mobile sources sector, which includes maritime emissions, the mean con-
tribution on PM2.5 among the three sites varies between 17% at the urban sites and 54% in-
side the port area during summertime, whereas in winter this contribution decreases to 5% at
the urban site and 38% at the port. This contribution takes into account not only the emissions
from ship and vessels, but considers all the emissions coming from the SNAP 8 (other mobile

32
sources), comprehending all on shore port activities.
Very similar results are recorded for the PM10 source apportionment (between 16% and 52% in
summer and between 7% and 41% in winter). The mean contribution is rather constant throu-
ghout the year in the entire domain (approx. 7-9%), but a strong seasonality can be found at the
urban site (16-17% in summer vs. 5% in winter).
The minimal contributions are lower than 1% for both summer and winter period at the scale of
the APICE domain.
Figure 1: Monthly PM2.5
concentrations (μg m-3)
(left) during the summer
(top) and winter (bottom)
periods at the Barcelo-
na APICE domain scale
from CHIMERE model
and contributions for
maritime sector (right)
(obtained by zero-ing out
the SNAP8 sector).
GenoaSource apportionment for PM10 and PM2.5 have been evaluated by CAMx-PSAT for both a
Summer period (June-August 2011) and late Autumn period (15 November - 15 December 2011).
PSAT routine has been activated, allowing for a complete analysis of source impact over the
whole Genoa domain. SA outcomes are here discussed for the three sites where long monitoring
campaign has been performed: Corso Firenze and Multedo (costal sites) and Bolzaneto (inland),
allowing to make a comparison with results obtained by receptor models analysis.
Five source categories have been considered, in view of both the main goal of APICE project
(assesment of harbour impact) and the peculiar characteristic of Genoa area, in particular:
• Maritime sector
• Traffic
• Industrial sources
• Non industrial combustion plants (SNAP02 sector, in Genoa area mainly residential sources)
• Other sources (including boundary conditions)

33
On Table 4 we report the contribution of above listed sources to simulated PM2.5 concentrations
in the three monitoring sites.
Table 4: SA from CAMx during summer (June-August 2011) and late-autumn (15 November – 15
December 2011) at 3 Genoa sites.
PM2.5 Source Apportionment(% on total concentrations)
Cso Firenze Mutedo site Bolzaneto
summer fall-winter summer fall-winter summer fall-winter
Road Transport 53% 38% 46% 32% 47% 35%
Maritime/Harbor 11% 5% 9% 4% 4% 3%
Residential/tertiary 1% 8% 2% 9% 2% 9%
Energy production and Industries 18% 19% 18% 20% 21% 20%
Others 17% 30% 25% 35% 26% 33%
The pattern obtained confirms the expected scenario for air quality in Genoa area, showing that
the main pollution source in Genoa is related to road traffic, and minor contributions are given by
industries and by maritime activities.
A seasonal trend can be identified in both coastal and inland sites. In fact during winter period a
strong increase in the contribution of “Residential” sources is observed, which can be ascribed
indeed to the presence of residential heating emissions.
Moreover in the coastal sites, which lies near the harbour (almost inside when considering the
spatial resolution of simulation domain) a strong reduction of maritime activities contribution is
observed during winter period, when ship traffic in the harbour is lower (effect mainly related to
social trend in tourism). The maritime contribution on PM2.5 concentrations varies among the
three sites between 4% and 11% in summer, whereas in winter decreases to 3-5%.
Finally the comparison between coastal and inland sites is consistent with what expected, in par-
ticular considering that lower contribution of harbour activities on PM2.5 is observed for inland
site.
In the figures Figure 4 we report the concentration values of PM2.5 due to harbor activities emis-
sions. Higher values are observed in summer period, confirming the seasonal trend observed in
single receptor analysis. Also, in summer period the harbor activities impact is more evident in
coastal area, where most of the Genoa urban area is located.

34
Figure 4: PM2.5 mean values in summer period (top) and late-autumn (bottom) in Genoa (Maritime activities sources only).
MarseilleSource apportionment for PM10 and PM2.5 has been evaluated both by CHIMERE and CAMx,
using zero-out modeling and tracer approach (PSAT) respectively for both winter, February 2011,
and summer, August 2011 periods (Figure 2).
During the winter period, several exceedances of the daily PM10 have been monitored to the ur-
ban background station of “5 Avenues”, located downtown in Marseille. The major contributions
are associated to industry-energy and residential-tertiary sectors. The road traffic significantly
contributes to high PM10 and PM2.5 concentrations also.
During the summer period, PM10 and PM2.5 concentrations are lower. The industry-energy and
road traffic sectors still have a major contribution to particulate matter. An additional significant
contribution is issue from the natural sector. Mainly during the summer period, the external sec-

35
tor, representing the long-range transport, displays a large contribution to particulate matter
concentrations.
Except the agriculture and the non-road and non-maritime sectors, every anthropic emission
sector displays a significant contribution with different timing, spatial extent or absolute contri-
bution. Thus, an efficient reduction of PM concentrations should involve each activity sector over
large areas.
Figure 2: Concentration and relative contribution of emission sectors to the monthly PM10 (left) and PM2.5 (right) con-
centrations at «5 Avenues» sampling site during winter and summer periods using zero-out modeling from CHIMERE and
tracer approach from CAMx by PSAT module.
SA outcomes are here discussed for two sites: an urban background site located downtown in
Marseille and a second site located inside Marseille’s harbor (Table 3). Focusing on the maritime
contributions, the maximal contribution of this sector is computed during the summer period at
the port site with 10% of the PM2.5 concentration. At the urban background site, the maritime
contributions are lower and range between 7% and 9% of the PM2.5 concentrations. As the
distance between sites is less than the spatial resolution of the model, results for urban and port
sites are very similar.
Table 3: SA from CAMx during summer (August 2011) and winter (February 2011) at 2 Marseille
sites.
PM2.5 Source Apportionment (% on total concentrations)
Urban site “5Avenues” Inner port site
summer winter summer winter
Boundary conditions 37% 25% 38% 26%
Road Transport 17% 20% 16% 19%
Maritime/Harbor 9% 7% 10% 7%
Other mobile sources (excluding horbour) 0% 0% 0% 0%
Residential/tertiary 5% 21% 4% 20%
Energy production and Industries 17% 21% 17% 21%
Agriculture 0% 2% 0% 2%
Biogenic sources 14% 4% 14% 4%
36
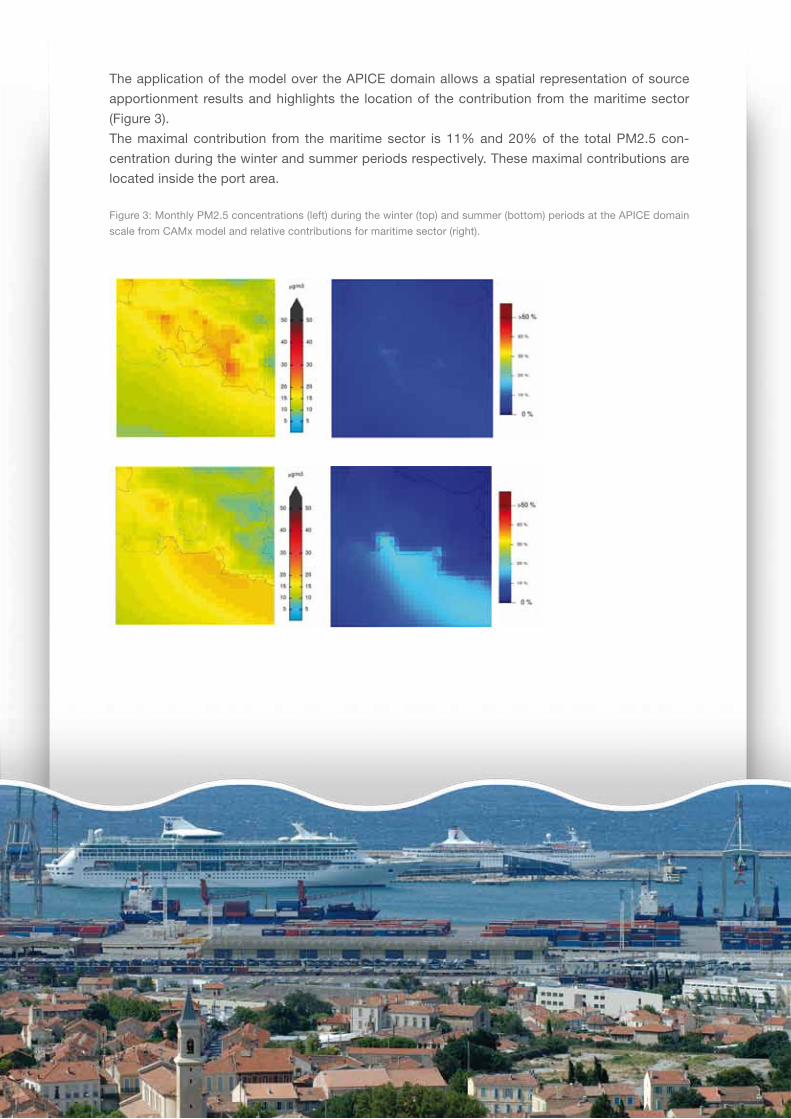
The application of the model over the APICE domain allows a spatial representation of source
apportionment results and highlights the location of the contribution from the maritime sector
(Figure 3).
The maximal contribution from the maritime sector is 11% and 20% of the total PM2.5 con-
centration during the winter and summer periods respectively. These maximal contributions are
located inside the port area.
Figure 3: Monthly PM2.5 concentrations (left) during the winter (top) and summer (bottom) periods at the APICE domain
scale from CAMx model and relative contributions for maritime sector (right).

37
ThessalonikiSource apportionment for PM2.5 has been evaluated by CAMx-PSAT for both a Summer period
(June-August 2011) and early Winter period (15 November – 15 December 2011).
PSAT routine has been activated, allowing for a complete analysis of source impact over the
Thessaloniki domain, that covers the urban area with an extent of 120 km and a resolution of 2
km.
PM2.5 Source Apportionment outcomes are here discussed for the two sites where the long
monitoring campaign has been performed: the first is in the Port area while the second is in the
City Hall (Figure 6).
Figure 6: The city of Thessaloniki and the monitoring sites.
Table 6 presents the SA for the fine airborne particulate matter (PM2.5) at the monitoring sites.
The SA analysis has revealed an important contribution of the pollution sources outside the mo-
deling domain to the atmospheric levels of PM2.5 in Thessaloniki. However, in the results shown
in Table 6, this influence is not considered. Consequently, the results shown are indicative of
the contribution of the pollution sources inside the modeling domain to the PM2.5 atmospheric
pollution in Thessaloniki.
Table 6: SA from CAMx during summer (June-August 2011) and late-autumn (15 November – 15
December 2011) at 2 Thessaloniki sites.
PM2.5 Source Apportionment (% on total concentrations)
City Hall Port
summer fall-winter summer fall-winter
Road Transport 45.1 24.5 44.8 24.9
Maritime/Harbor 2.2 1.0 5.8 2.8
Central Heating 0.0 45.4 0.0 44.3
Industries 20.1 10.9 16.4 9.8
Windblown Dust 1.2 0.9 1.2 0.8
Biogenic NMVOCs 0.6 0.1 0.6 0.1
Leftover Sources 30.8 17.2 31.2 17.3
Road Transport and Central Heating have the highest contribution to PM2.5 concentrations in the
Thessaloniki urban area in the summer and in the winter period examined respectively.
The Maritime and Harbor activities present a rather small contribution to the PM2.5 average le-
vels: from 6% in the port sites during summer to 1% in the urban site in the early winter period.

38
The influence of this emission source is greater in summer compared to the winter time because
of the increased ship traffic,harbor and fishing activities during the summer. The influence of the
Maritime and Harbor activities is smaller in the City Hall compared to the Port. The City Hall is
about 5km away from the Port and represents urban background conditions.
Figure 7 illustrates the spatial distribution of the contribution of Maritime and Harbor activities
to mean PM2.5 concentration over the whole modeling domain. As expected, the CAMx results
have shown that the contribution is higher over the maritime than over the coastal and continen-
tal areas of the study domain. Over the former areas, the contribution can be rather significant in
the summer (more than 50%) while it is moderate in the wintertime (about 20%). In addition, the
contribution is higher over the maritime areas that are more distant to the coast.
Figure 7: Spatial distribution of the % contribution of Maritime and Harbor activities to the mean PM2.5 concentrations
over the Thessaloniki study domain.

39
VeniceSource apportionment for PM2.5 has been evaluated by CAMx-PSAT for both a Summer period
(June-August 2011) and late Autumn period (15 November – 15 December 2011).
PSAT routine has been activated, allowing for a complete analysis of source impact over the
Venice nested domain, which covers the urban area with an extent of 30 km and a resolution of
1 km.
PM2.5 Source Apportionment outcomes are here discussed for the three sites where the long
monitoring campaign has been performed: two urban background sites, one in the Venice histo-
rical center (close to the passenger ship berths, Sacca Fisola) and one in the mainland part of
the Venice Municipality (Mestre, Parco Bissuola), and one industrial site located close to Porto
Marghera (industrial and commercial harbor and industrial area of Venice).
Table 5 shows the SA for the fine airborne particulate matter (PM2.5) at the Venetian monitoring
sites, expressed as % contribution to the mean concentration of the seasonal period.
Table 5: SA from CAMx during summer (June-August 2011) and late-autumn (15 November – 15
December 2011) at 3 Venice sites.
PM2.5 Source Apportionment (% on total concentrations)
Venice Mestre Marghera
summer fall-winter summer fall-winter summer fall-winter
Boundary conditions 27.0% 19.0% 27.4% 17.6% 28.1% 18.1%
Road Transport 8.6% 16.8% 16.7% 20.4% 11.9% 17.5%
Maritime/Harbor 8.0% 1.8% 5.5% 0.2% 8.1% 0.9%
Central Heating 0.3% 27.0% 0.5% 32.9% 0.5% 33.0%
Industries 5.9% 7.6% 9.1% 6.4% 10.8% 6.9%
Agriculture 4.8% 8.2% 6.2% 9.1% 7.6% 8.6%
Biogenic sources 28.6% 13.4% 27.7% 10.7% 27.2% 12.3%
Leftover Sources 16.7% 6.2% 6.8% 2.6% 5.8% 2.7%
The boundary conditions, which refer to the PM amounts coming from outside the main modeling
domain (256x236 km2 covering Veneto Region and part of the neighbouring regions), play an
important role on the concentration levels simulated in the Venice area, in both seasons.
In the summer period, natural sources account for the greatest amount of PM2.5 concentrations,
followed by boundary conditions, whereas the anthropogenic source with the most relevant im-
pact on concentrations is road transport. The maritime activities account for the 6-8% of the
PM2.5 concentrations along the three monitoring sites.
During the late Autumn 2011, characterized by concentrations up to three times higher than the
summer period, the wind blew from north-west and brought the emissions from the Po valley
into the nested domain; in these meteorological conditions the influence of boundary conditions
decreases while the relative importance of first levels diffusive emissions increases, even if road
transport, wood combustion from residential heating and agriculture aren’t typical emissions in
Venice historical center. The maritime and harbor activities present a rather small contribution to
the PM2.5 average levels during this cold scenario, mainly because the presence of the emis-
sions of domestic heating in respect to the summer scenario. Moreover the passenger vessels
traffic decrease significantly between November and March.
Figure 5 illustrates how harbor activities contribution on PM2.5 concentration is spatially distri-
buted on the nested modeling domain, in the summer and late-autumn period. The maximum
contribution of harbor activities to the mean PM2.5 values is depicted in green and reaches 15%
in the summer period and 4% during the cold one.

40
Figure 5: Spatial distribution of the % contribution of Maritime activities to the mean PM2.5 concentrations over the Ve-
nice nested domain in the summer scenario (top) and in the late-autumn scenario (bottom).

41
Conclusions
The Source Apportionment analysis by CTMs produced a quite detailed picture of the contribu-
tion of the different emission sources to PM10 and PM2.5 in each study area.
Focusing on the maritime activities impact on PM2.5 concentrations, a common feature for the
five study area is an higher contribution during Summer period, when touristic ship activities are
at their maximum and residential heating is at its minimum.
The maximum impact by maritime activities has been spotted always in summer: in Barcelona a
contribution of 54% of harbour activities (ships and vessels and on shore harbour activities) has
been calculated in the very heart of the port; a comparable contribution (~65%) is estimated in
Thessaloniki over the open sea, estimation however calculated considering only the contribution
of the pollution sources at local-medium scale (that is without taking into account the contribu-
tion of the emission sources outside the inner modelling domain).
Considering only the ship and vessels emissions, in summertime a maximum value of 33% is
reached in Genoa whereas in Marseille and Venice the highest values are 20% and 15% respec-
tively.
In wintertime, the highest contributions by maritime/harbour activities become lower: 38% in
Barcelona and 20% in Thessaloniki; more comparable contribution have been obtained for Ge-
noa, Marseille and Venice: 7%, 11% and 4% respectively.
Analysing the maritime contribution over the sites of the long monitoring campaign performed in
every study area, the pattern spotted is: a contribution from 2% to 17% for the urban background
sites in summer that become from 0% to 7% in winter.
The contribution for the sites very exposed to harbour emissions is quite different among the
study areas and strongly depends on the different exposition to the local emission within the
port-city area under investigation and on the method applied to analyse the harbour contribution.

42

43
Model application and scenarios
for port cities sustainable
development strategies

44
For all study areas, anthropogenic pollutant emission data were estimated for a future reference
year. Consequently, a base future emission scenario was configured to act as a basis for the
application of air quality models in order to investigate the impact of mitigation actions relevant
with the maritime and harbor activities on the air quality in the future. In this chapter, a short
description of the rational of the future base emission scenario for each area is presented. The
future maritime and harbor activities that are expected to be risky to the environment in terms of
pollutant emissions to the atmosphere are also discussed.
While configuring the base future scenario, effort has been paid in order to take into account
the existing normative framework for ship emissions. The air pollution from maritime transport is
regulated by Annex VI of the Convention for the Prevention of Marine Pollution from Ships (MAR-
POL 73/78) governed by the International Maritime Organization (IMO). According to a revision
of the MARPOL Annex VI, a stepwise reduction of the sulphur content of fuels used by ships
while on cruise in all seas to 0.5% as of 2020 and to 0.1% in SECAs (Sulphur Emission Control
Areas) as of January 2015 is prescribed. As a consequence, SO2 and PM ship emissions are
predicted to decrease considerably. Moreover, it should be noted that, according to the directive
2005/33/EC, since 2010, all ships have to change their marine fuel used while being at berth with
fuel of sulphur content not exceeding 0.1% by mass. It should be noticed that according to an
amendment of the directive 2005/33/EC (FEK 173B – 30/08/2007), all ships have to change their
marine fuel used before entering into the ports of Greece (i.e. during maneuvering also) with fuel
of sulphur content not exceeding 0,1% by mass.
For Barcelona, the base future emission scenario has as a reference time the year 2015 and con-
siders the port and maritime activity forecast and the future normative framework for ship fuels.
In particular, it was built up accounting for the:
• Socioeconomic trends developed within APICE project
• Official Port forecast regarding goods and passengers figures
• Ongoing or planned changes in infrastructure and operations within the port.
As for all other anthropogenic source emissions, data from the Catalan air quality improvement
plan were used.
For Genoa, the emission values for the 2020 year base future scenario were calculated on the
basis of the analysis of the ENEA project GAINS-Italy (http://gains-it.bologna.enea.it/gains/IT/
index.login). According to this projection, there is an overall reduction of PM2.5 emissions, mainly
due to a general reduction of all production activities. The simulation of the effect of the new
regulatory limit imposed for the content of sulphur in the fuels used by vessels required an as-
sumption for the PM2.5 emissions which were reduced by -20%, enough for overcoming the
expected emissions increase related to the maritime sector activities development.
For Marseille, the base future scenario is for the year 2025 and considers port and maritime traffic
evolutions according to the Marseille port projections. Data concerned the following ship types:
container, liquid bulk, solid bulk, cargo, cruise and passenger. An additional calculation provided
projection for tugs according to the maritime traffic evolution. To calculate and to map the future
emissions, the main properties for ships and their calls were conserved (ship dimension, engi-
ne, speed, duration of hotelling, maneuvering and on-cruise phases, provenance and destina-
tion, location of the quay to load/unload). Only the fuel characteristics were modified to respect
the future regulation with sulphur content of 0.5% and an additional reduction of -20% for the
PM2.5 emissions. These hypotheses allowed firstly an evaluation of the impact of the maritime
9. Base Future time emissions scenario

45
trafic evolution on the air quality in Marseille and secondly an independent evaluation of several
projects from the Marseille port plan as the building of a new cruise terminal, the modification of
the fuel type or others.
For Thessaloniki, the base future emission scenario refers to the year 2020. Emissions from the
maritime and harbor activities were estimated according to activity data provided by the Thes-
saloniki Port Authority SA and considering the port evolution without taking into account any
modification in engine types and emission factors. The projected emissions were based mainly
on the Port Authority investment and development plans including a pier extension and the con-
struction of a marina. Because of that, an increase in cargo ship traffic is expected along with an
increase in the traffic of vessels that will be hosted in the marina (e.g. pleasure crafts). Moreover,
in the calculations of the future SO2 emissions, the reduction of the sulfur content in fuels used
by ships to 0.5% was taken into account. Future PM2.5 emissions from ships were reduced by
-20% because of the future normative framework for ship fuels. Regarding the future emission
data for all other anthropogenic sources, the projections foreseen for Greece provided by the
GAINS model were used (http://gains.iiasa.ac.at/models/).
Future emissions for the year 2020 were calculated for Venice considering the two main port de-
velopment projects with a realistic realization within 2020: the Venice Motorways of the Sea Ter-
minal and the first development of the new Container, for which a much more important growth
is foreseen after 2020 with the realization of the off – shore Terminal outside the Venice Lagoon.
With the realization of these two projects, both in Porto Marghera, an increase of 18% for Con-
tainerships, 11% for Ro-Ro Cargo Ships and 77% for Ro-Ro Passenger vessels is expected
compared to those of the present time. Moreover, a yearly rate increase of 2% for the cruise mo-
vements was considered, whereas the ships movements related to the industrial activities were
considered unchanged. Beside the emissions from ships, the traffic emissions induced on roads
and railways by the total amount of vehicles arriving to and departing from the port of Venice
were considered too. The induced traffic emission estimation was based on the forecast for duty
and passenger vehicles on road, as well for the railway provided by Venice Port Authority for the
two projects. For the SO2 emissions, the 2020 scenario considered the limits on sulphur content
in fuels of 0.5% in maneuvering and cruising phases for all ships, with an associated reduction of
-20% for PM10 and PM2.5 for Bunker Fuel Oil (BFO) emission factors, as suggested in EC, 2006.
Figure 1 illustrates the annual ship traffic for the reference year of the base future scenario for
each study area. The port of Marseille has the highest ship arrivals. Barcelona is the second in
the rank followed by Genoa and Venice. Ship arrivals in the port of Thessaloniki are the lowest.

46
Figure 1. Annual ship traf-
fic for the reference year
of the base future sce-
nario being 2015 for Bar-
celona, 2020 for Genoa,
Thessaloniki and Venice
and 2025 for Marseille.
Table 1 shows the calculated ship and vessel pollutant emissions for the base future scenario
for all the cities studied.
Referenceyear
Reference area (km2)
NOx SO2 NMVOC PM10 PM2.5
Barcelona1 2015 100x100 6694 3079 369 393 -
Genoa 2020 30x40 4522 463 260 118 109
Marseille 2025 100x100 22107 4270 6384 444 444
Thessaloniki 2020 100x100 14015 1600 431 459 448
Venice 2020 100x100 6671 757 335 360 360
1Emissions for Barcelona have been estimated only for maneuvering and hotelling modes, while for the other study areas
on-cruise pollutant emissions have been also accounted for.
Following, Table 2 shows the change in ship and vessel present time emissions because of the
base future emission scenario examined for each study area. It is obvious that ship and vessel
emissions for NOx and NMVOC show an increase in the future in all the study areas. Regarding
SO2, a decrease in ship and vessel emissions is foreseen, which is due to the reduction of
sulphur content in ship fuels. PM10 and PM2.5 emissions are expected to increase in all cities
except for Barcelona and Genoa in which a small to moderate decrease is foreseen.
Table 2. % Change in present time ship and vessel pollutant emissions because of the base
future emission scenario.
Referenceyear
Reference area (km2)
NOx SO2 NMVOC PM10 PM2.5
Barcelona1 2015 100x100 12 -59 12 -25 -
Genoa 2020 30x40 8 -43 13 -2 -10
Marseille 2025 100x100 87 -74 77 45 45
Thessaloniki 2020 100x100 29 -66 122 59 56
Venice 2020 100x100 44 -54 50 44 44
1Emissions for Barcelona have been estimated only for maneuvering and hotelling modes, while for the other study areas
on-cruise pollutant emissions have been also accounted for.

47
Tables 3 presents PM10 emissions per ship and vessel type in accordance with the base future
scenario for all cities except for Genoa for which a more detailed analysis of the future emission
data has been produced on the basis of very recent data that have to be verified. According to
Table 3, cargo shipping is the major contributor to ship and vessel future emissions of PM10 in
all the study areas, except for Venice in which passenger ships is the largest contributor. For
Barcelona and Marseille, the second most important emission source is the passenger ships.
For Thessaloniki, the second larger contributor to total emissions is the inland waterways, which
show a steep increase in the future, followed by the fishing boats.
Table 3. PM10 future emissions (Mg/year) for different ship and vessel types for each study area.
Referenceyear
Reference area (km2)
Passenger ships
Cargo ships
Inland waterways
Fishing
Other ships
and ves-sels
TOTAL
Barcelona1 2015 100x100 115 236 - - 42 393
Genoa - 30x40 - - - - - -
Marseille 2025 100x100 95 281 14 - 54 444
Thessaloniki 2020 100x100 2 248 170 38 1 459
Venice 2020 100x100 198 131 842 - 31 3602
1Emissions for Barcelona have been estimated only for maneuvering and hotelling modes, while for the other study areas
on-cruise pollutant emissions have been also accounted for. 2For Venice, the emissions by water traffic inside the Venice Lagoon and the historical city is reported; these emissions
are not summed up on the total since there’re not to be addressed to the Venice port activities.
In an effort to make a comparison of the pollutant emissions among the study areas, future emis-
sions from passenger and cargo ships during the hotelling and maneuvering modes are presen-
ted in Figure 2 for all study areas apart from Genoa for which the specific data are not available.
Attention has to be paid on the reference year of the emission estimation which is not the same
for all the cities. Marseille has the highest emissions in accordance with Figure 1 showing incre-
ased ship traffic compared to the other study areas. Barcelona has the second higher gaseous
pollutant emissions while PM10 emissions are comparable with those of Marseille. Venice and
Thessaloniki follow as third and fourth in the rank respectively in accordance with the ship arrivals
shown in Figure 1.
Figure 2. Passenger and cargo ship pollutant future emissions during the maneuvering and hotelling modes for each
study area (reference year: 2015 for Barcelona, 2025 for Marseille, 2020 for Thessaloniki and Venice).
Table 4 shows the pollutant emissions from additional activities that occur within the harbor

48
area (other than ship and vessel emissions) and those induced by the presence of the port. For
Marseille, this information is not available due to lack of input data to be used for the emissions
estimation.
Table 4. Pollutant future emissions from port activities other than ship and vessel and pollutant
emissions induced by the port activities (in Mg/year).
Referenceyear
NOx SO2 NMVOC PM10 PM2.5
Barcelona 2015 605 14 0 75 -
Genoa - - - - - -
Marseille - - - - -
Marseille 2020 - - - 67 10
Venice 2020 1419 1 73 47 41
According to Table 5 emissions from port activities other than ship and vessels are going to incre-
ase in the future for Thessaloniki and Venice for all pollutants. For Barcelona, the corresponding
emissions are expected to decrease for all pollutants apart from NMVOC for which emissions
remain the same.
Table 5. % Change in present time emissions from port activities other than ship and vessel and
emissions induced by the port activities because of the base future emission scenario.
Referenceyear
NOx SO2 NMVOC PM10 PM2.5
Barcelona 2015 -16 -30 0 -29 -
Genoa - - - - - -
Marseille - - - - - -
Marseille 2020 - - - 81 66
Venice 2020 75 150 74 57 70
A further analysis of the emission data presented above has allowed the identification of the ma-
ritime and harbor activities that are expected to be more risky for the environment in the future in
terms of the pollutants that are emitted in the atmosphere. This analysis is presented in detail in
the “Identification of the risk activities” reports which are available on the APICE website and is
summarized below for each study area.
BarcelonaThe trend scenario 2015 has been based on the evolution of type of merchandise/passengers,
which has been provided by the Strategy Department of Port of Barcelona. The dry bulk carriers
tend to increase while no change on tug boats fleet is foreseen by 2015 in a way that it can be as-
sumed that for that type of boats, fuel and operations will be the same. NOx emissions resulting
from auxiliary means working within the port have been estimated considering the overall change
of activity at the Port. According to the official forecast, activity would increase around 15%.
Cargo handling related emissions are estimated in function of TEUs movements evolution and
new terminal equipment. Finally, the trend scenario considers evolution according to the amount
of tones expected to be transported by trucks, as well as a reduction by 10% on the emissions
factors due to fleet renewal.
According to number of calls foreseen by the Port Authority, the main increase on emissions will
be due to cargo ships. Hotelling emissions are mitigated, as for SOx and PM10 due to the entry
in force of the Directive for the fuel sulphur content.

49
GenoaA future scenario for 2015 has been configured according to the evolution of type of merchan-
dise/passengers, which has been provided by the new PRP (Piano Regolatore Portuale) of Ge-
noa Port, a document containing harbour planned intervention and structural modification for
the next years. These provisional data have been translated into vessels types and number of
calls per vessel type, considering also the increased ratio of merchandise/passengers that can
be transported by modern ships. About the development of container traffic in the short term,
the forecasts of economic operators show a growth in volumes greater than expected, with an
average growth of about 7% (2011 - 2015). Solid bulks traffic forecasts show a further increase
on specialized goods such as forestry, fruit and vegetables and metals / steel products, with
variations year to year about 4.2%. In addition, activities concerning heavy-duty vehicles and
railroad locomotives are also expected to increase in 2015. Socio-economic data of port activi-
ties development have been very recently collected and further analyses are needed to elaborate
harmonized and accurate emission data.
MarseilleMarseille port projections forecast a high increase of the maritime traffic for 2025. The main
developments are expected for the cruise activity, which will be 4 times the current traffic, the
container activity, which will be tripled and the conventional cargo activity which will be multiplied
by 2.5. Traffic of leftover activities is also expected to increase.
At the port scale, container activity is expected to be the major contributor to the future pollutant
emissions, followed by passenger activity and liquid bulk activity. In the western part, dedica-
ted to goods transport, future emissions will be dominated by container, liquid bulk and cargo
activities. In the eastern part, close to Marseille city center and mainly dedicated to passenger
transport, the first emission contributor will be the passenger activity, followed by cruise and
container activity. For all pollutants, future emissions will be dominated by hotelling phase except
for NOx emissions, dominated by maneuvering phase.
ThessalonikiIn 2020, according to activity data provided by the Thessaloniki Port Authority SA and conside-
ring the port evolution, cargo and passenger ships will increase in traffic by approximately 35%.
Tugs will increase by 50% and the inland waterways vessels will have a very high increase too.
The traffic of fishing boats is expected to decrease by about -30%.
In the domain of 100x100 km2 extent, on an annual basis, cargo shipping is expected to be the
major contributor to the future maritime and harbor activities emissions of CO, NOx and SO2. The
second larger contributor to NOx and SO2 emissions is the fishing boats and to the CO emis-
sions are the inland waterways. The inland waterways are expected to be the most important
NMVOC emission source followed by the cargo ships. PM10 and PM2.5 will be mostly emitted
by the cargo ships while the second emission contributor will be the inland waterways. Regarding
cargo ships, the highest emission source for all the pollutants except for CO is the containers
(followed by the general cargo ships). CO is emitted mostly by the other cargo vessels. Moreover,
for all pollutants, the total cruising emissions represent the highest share of total future emissions
from all operation modes (cruising, maneuvering and hotelling). This result is also valid for each
of the cargo ship types (general cargo, container, other cargo vessels).
On a more local scale (in the port area), on an annual basis, the hotelling of ships will be the ma-
jor emission source for PM2.5, CO and NMVOC in 2020. PM10 will be emitted mostly from the
in-port processes relevant with the loading, unloading and pilling of goods/materials. The largest

50
NOx and SO2 emissions will be released from the maneuvering of ships; however, the NOx ship
maneuvering emissions are estimated to be comparable with those emitted from ship hotelling.
Venice
Differently to the 2011 emissions, on the 2020 scenario, the greater emission contribution is by
passenger ships and this is mainly due to the Ro-Ro passenger vessel traffic increase of the new
Motorways of the Sea Terminal. Except for SO2 emissions, for which the limitation of 0.5% in
sulphur content of ship fuels for the maneuvering and cruising phases results to an important de-
crease, all the other pollutants record an increase between 40% to 60%, considering the whole
Port of Venice and the three phases of navigation.
Letting aside the cruise phase, that in the Port of Venice starts outside the Venice lagoon en-
trances and so it is quite distant in respect to both the historical city and the inland one (Mestre)
and considering separately the commercial/industrial terminals in Porto Marghera and the other
terminals in the historical city of Venice, the 2020 development scenario record a decrease for
all the pollutants in the historical city of Venice: - 10-12% for CO, NOx and NMVOC, -20% for
PM10 and PM2.5. On the other hand, there’s to report the increase on the total emission for the
Porto Marghera terminals: +88% for CO, +52% for NOx, +63% for NMVOC and +75% for both
PM10 and PM2.5. This is due to the fact that the Venice Motorways of the Sea Terminal foresee
a displacement of the present Ro-passenger vessels from Venice to Porto Marghera.
Conclusions
In the future, an increase in ship and vessel emissions for NOx and NMVOC is expected in all the
cities given also the increase in the ship traffic foreseen. Regarding SO2, a reduction of total ma-
ritime emissions is estimated due to the reduction of the sulphur content in ship fuels. PM10 and
PM2.5 ship and vessel emissions will increase significantly in Marseille, Thessaloniki and Venice
and present a small to moderate decrease in Barcelona and Genoa. In the latter cities, the effect
on the emissions of the new regulatory limit imposed for the content of sulphur in the ship fuels
overcomes the expected emissions increase due to the port activities evolution.
The results for the future emissions per ship and vessel type reveal that the major contributor to
PM10 emissions is the cargo shipping in Barcelona, Marseille and Thessaloniki while in Venice
passenger ships are the most important future PM10 emission source.
Finally, an increase in pollutant emissions from port activities other than ship and vessel and
emissions induced by the presence of the port is expected for Venice and Thessaloniki while a
decrease is foreseen for Barcelona.
References1. EC, 2006. TREMOVE 2. Service contract for the further development and application2. of the TREMOVE transport model - Lot 3. European Commission, 2006. Available in: http://www.tremove.org/docu-
mentation/TREMOVE_maritime_model_and_runs.pdf

51
10. Mitigation scenarios Within APICE, emission mitigation measures (and corresponding emission scenarios) relevant
with the maritime and harbor activities were studied for each port-city with the use of Chemical
Transport Models (CTM) in order to estimate the expected change in pollutant emissions and
air concentrations in comparison to those of the base future emission scenario. The mitigation
measures studied were decided mainly after discussions between the governmental bodies, port
authorities and scientific groups with a view to increase the territorial knowledge framework and
provide indications to undertake environmental-addressed actions towards mitigation strategies
as drivers for the sustainable eco-environmental growth of the coastal areas. Following is a pre-
sentation of the emission mitigation measures or emission scenarios selected for each study area
with a discussion on the related impact on air quality.
Barcelona
18 mitigation measures were examined for Barcelona aiming to the reduction of port emissions
for the reference year 2015:
1. Promotion of LNG as fuel for ships: It is considered that ferries passengers will use this fuel in
the future, considering traffic forecast by 2015. The expected reduction in emissions is about
-85% for NOx and -100% for PM10.
2. Cold ironing: It is considered for 10% of cruise passenger, with forecast data for 2015. The
expected decrease in emissions is about -6.5% for NOx and PM10.
3. LNG as fuel for tug boats: It is considered that half of the tug boats use LNG, with 2015 data
projection. The expected reduction in emissions is about -42% for NOx.
4. Measures regarding trucks: Both NOx and PM10 emissions are expected to decrease by
about -8%.
5. Measures regarding trains: NOx and PM10 emissions are expected to decrease by about
-3% and -4% respectively.
6. Conversion cargo handling machinery to natural gas: The expected reduction in NOx emis-
sions is about -35%.
Table 1 shows the reduction in the total maritime and port annual emissions of the base future
scenario due to the mitigation measures.

52
Table 1. % Change in the maritime and port annual emissions of the base future scenario due
to mitigation measures (Reference domain: Port area, Reference year: 2015).
Mitigation Action NOx PM10
18 mitigation actions1 -12% -13%
1The actions are described in text above.
The impact of several future emission scenarios, including the aforementioned mitigation actions,
on the air quality of the city of Barcelona was studied using the MM5-CHIMERE modeling sy-
stem, as described in several works (e.g. Jiménez-Guerrero et al., 2012), including both anthro-
pogenic and natural emissions (biogenic NMVOCs, wind-blown dust and sea salt aerosol). The
system was applied over two nested domains covering (1) the entire Catalonia (120 x 120 km2 at
a resolution of 2 km) and (2) the Barcelona Metropolitan Area (40 x 40 km2 at a resolution of 0.5
km) (Figure 1). 30 vertical layers up to 100 hPa were used for the simulation of the meteorological
conditions and 16 layers up to 500 hPa in the CHIMERE configuration. Modeling system simula-
tions were performed for a summer month (August 2011) and a winter month (December 2011).
Figure 1: One-way nested
domains of study simulated
with CHIMERE: Catalonia and
Barcelona Metropolitan Area.
Shaded colours represent the
maximum summertime con-
centrations of sulphur dioxide
highlighting the impact of the
Barcelona port on the levels
of this pollutant.
CHIMERE results are based on the 0.5 km resolution simulations, and cover three different emis-
sion scenarios: (a) base-case future scenario: the forecast of the emissions for the port in the
year 2015, including the trend scenario of emissions predicted by the Catalonia Government for
emissions different from the maritime sector, (b) an analogous scenario to (a), where the emis-
sions for the port include the mitigation measures as defined in APICE and (c) the plan scenario
as defined by the Catalonia Government for the year 2015, where the port emissions include the
mitigation actions defined in APICE. Further explanations are provided in the document “APICE
Plan Barcelona” (http://www.apice-project.eu/index.php?lang=SPA)..
Figure 2 presents the change in PM air quality in Barcelona for a summer period (using the
meteorology of August 2011) because of the mitigation measures selected. When comparing
the APICE mitigation scenario to 2015 base case scenario, values around -10.2% as maximum
reductions are found (very similar reductions, -11.3%, are found in the case of PM2.5 concentra-
tions). For the whole modeling domain, we observe a reduction in PM10 (PM2.5) levels around

53
-6.1% (-6.3%) for this mitigation scenario. Analogous results are observed in the APICE mitiga-
tion + Plan scenario for 2015 (where reductions from other emitting sectors are included), where
the maximum reductions downwind the port area are -12.8% and -11.9% for PM10 and PM2.5
(-5.7% and -5.4% respectively for the whole modeling domain). The above indicate that most of
the concentration reduction comes from the mitigation measures in the port and not from the rest
of planned emissions for the other emitting activities.
Analogous results are found for Barcelona in the winter month (simulations using the meteo-
rology of December 2011). The maximum decreases in mean PM levels (Figure 3) are over the
coastal areas, and especially over the Barcelona port, where reductions in the order of -10.3%
are found as maximum reductions in the scenario including the APICE mitigation measures when
compared to the base case scenario for 2015. The results are similar for PM2.5 concentrations,
where reductions by -9.9% are modeled as maximum decreases. When considering the mean in
the modeling domain, we can observe a reduction in PM10 (PM2.5) levels around -5.6% (-5.2%)
in this APICE mitigation + Trend scenario. Similar results are observed in the APICE mitigation
+ Plan scenario, where the maximum reductions are located near the port: -10.6% and -10.1%
as maximum reductions of PM10 and PM2.5, respectively (-5.2% and -4.9% as mean for the
modeling domain). As also found for the summer period, the local mitigation actions significantly
impact SO2 and NO2 concentrations in the port and surrounding areas.
Figure 2: Left: Base-case concentrations of PM10 (top) and PM2.5 (bottom) over the Barcelona domain for summertime
2015; Middle: the relative difference (%) due to the APICE mitigation measures + Trend scenario; Right: the relative diffe-
rence (%) due to the APICE mitigation measures + Plan scenario.

54
Figure 3: Left: Base-case concentrations of PM10 (top) and PM2.5 (bottom) over the Barcelona domain for wintertime
2015; Middle: the relative difference (%) due to the APICE mitigation measures + Trend scenario; Right: the relative diffe-
rence (%) due to the APICE mitigation measures + Plan scenario.
Genoa
The mitigation measure considered for Genoa was the Cold ironing for two different areas of the
port, namely the VTE cargo terminal, located at the western edge of the harbour area, and the
Ferry Terminal, sited very close to the city center. The contribution of VTE and Ferry Terminal
emissions to total harbor emissions is around 10%, while the abatement of the harbor emissions
in the area close to the electrified quays is very high (till 80%). The advantage of a very high mi-
tigation at local level can be added to the contemporary mitigation of noise from harbour. Table
2 presents the change in future time ship and vessel annual emissions in the port area due to the
cold ironing measure.
Table 2: % Change in future time ship and vessel annual emissions due to emission mitigation
measure (Reference domain: Port area, Reference year: 2020)
Mitigation Action CO NOx SO2 NMVOCs PM10 PM2.5
Cold ironing (ferry and container terminals)
-35% -38% -35% -34% -35% -35%
The emission scenarios were studied with an integrated air quality forecasting system that was
implemented at the University of Genoa. Meteorological fields were obtained from the mesosca-
le model WRF-ARW, whereas air quality simulations were performed using the photochemical
model CAMx. By means of subsequent nesting procedures, meteorological and pollutant con-
centration fields were obtained up to resolutions of 1 km. Initial and boundary conditions needed
to drive WRF simulations were provided by the global model GFS, operational at the National
Center for Environmental Prediction. Large-scale anthropogenic emissions data were provided
by the Aristotle University of THessaloniki (AUTH) after processing the 2005 European emission

55
dataset of The Netherlands Organization with the MOdel for the Spatial and tEmporal diStribution
of emissionS (MOSESS) (Markakis et al., 2013). Finally, natural emissions were computed from
the WRF outputs using the Natural Emission Model (NEMO) developed by AUTH (Markakis et al.,
2009; Poupkou et al., 2010). Figure 4 shows the environmental impact of the mitigation measure
on the air quality of Genoa as simulated for the base future time emission scenario using the
meteorology of the year 2011. The role played by meteorological conditions (mainly prevailing
wind directions) on the impact of mitigation action is clear while looking to Figure 4. Pollutant
emitted from the port is carried mainly to N/NW, then the central and eastern part of the city area
will be less affected by this intervention, while local consistent effects are expected in western
side of the city.
Figure 4. % Dif-
ference in PM2.5
concentrations
between the fu-
ture time scena-
rio with mitiga-
tion action and
the 2020 base
future scenario
(summer month).
Marseille
The following mitigation emission scenarios were studied for Marseille having as reference time
period the year 2025:
1. Cold ironing: It is applied to passenger ships in rotation between Marseille and Corsica Island.
It involves one terminal and three ships of the CNM Company (scenario name “Cold ironing”).
2. Build a new cruise terminal: The aim of this scenario is to move the current terminal cruise
closer to the historical city center to allow a direct access to the places of interest (scenario
name “New terminal cruise”).
3. Use of liquefied natural gas (LNG) in shipping: It is applied to passenger and cruise ships for
cruising, maneuvering and hotelling phases. This scenario is named “LNG passenger”.
The expected changes in the maritime emissions at the scale of the Marseille urban area for each
mitigation action examined are reported in the Table 3.

56
Table 3: % Change in the maritime annual emissions of the base future scenario due to mitiga-
tion measures (Reference domain: Marseille urban area, Reference year: 2025).
Mitigation Action CO NOx SO2 NMVOCs PM10 PM2.5
Cold ironing -3% -2% -1% -3% -3% -3%
New cruise terminal -0% -0% -0% -0% -0% -0%
LNG passenger -78% -57% -75% -78% -78% -78%
As the studied scenarios considered very local mitigation actions or a translation of maritime
emissions, the ADMS Urban model was used to allow a better evaluation of these actions. This
urban model was used over a domain including the Eastern port of Marseille, with an adaptive
spatial resolution, narrowed close to the main pollutant sources and over the areas including an
emission scenario. Receptor points were computed with a height of 1.5m. Meteorological data
were taken from a meteorological station located in Marseille. The main emission sources as
road traffic, industry and maritime activity, were modeled as explicit sources. CHIMERE model
was used with a spatial resolution of 3km over the regional area, meteorological data from the
WRF model and the local emission inventory to include background concentrations for PM10
and PM2.5.
PM10 and PM2.5 concentrations for the “Base future” scenario were computed for a winter and
a summer month, using meteorology for February and August 2011 respectively (Figure 5). As
the highest PM concentrations were identified during the winter time, the evaluation of mitiga-
tion actions focused on this period. Seasonal variations were due to lower emissions of primary
particles as from the central heating and better dispersion conditions during the summer time.
Figure 5: PM2.5 concentrations for the “Base future” scenario during winter (left) and summer (right) periods using the
CHIMERE model.
Figure 6 displays the expected changes on the PM10 and PM2.5 concentrations as a result of
the implementation of the mitigation emission scenarios selected for Marseille for a winter period
(using the meteorology of February 2011). The use of LNG as fuel for passenger ships has shown
a significant decrease for PM concentrations at the port scale. The impact of the cold ironing
action is lower with an improvement located very close to the terminal involved. The new cruise
terminal building should significantly reduce concentrations in the northern part of the port with
a translation of the emission inside the new terminal. Also, all the local mitigation actions signifi-
cantly impact NO2 concentrations in the port and surrounding areas.

57
Figure 6: Relative difference between the “Base future” and the “Cold ironing” scenario (top), the “New cruise terminal”
scenario (middle) and the “LNG passenger” scenario (bottom) for the PM10 (left) and PM2.5 (right) concentrations during
the winter period over the urban domain for Marseille.
Thessaloniki
The following mitigation actions were studied for Thessaloniki for the year 2020:
1. Cold ironing: It was considered for all types of ships.
2. Use of wetting agents (chemical and water): The aim of the measure is the reduction of the
port storage pile PM emissions.
Table 4 reveals that the implementation of both measures is expected to contribute to significant
decreases in future PM maritime/harbor emissions in the area of the port. Over the whole study
domain centered over Thessaloniki with a 100 x 100km2 extend, the reduction of the PM mariti-
me/harbor emissions due to both mitigation actions was estimated to be small (-4.4% for PM2.5
and -8.1% for PM10).

58
Table 4: % Change in the maritime/harbor annual emissions of the base future scenario due to
mitigation measures (Reference area: Port area, Reference year: 2020)
Mitigation Action CO NOx SO2 NMVOCs PM10 PM2.5
Cold ironing -80% -46% -15% -82% -19% -55%
Use of wetting agents 0% 0% 0% 0% -31% -14%
In order to assess the impact of the mitigation actions on the air quality of Thessaloniki, simu-
lations were performed using the WRF-CAMx modeling system (Skamarock et al., 2008; ENVI-
RON, 2010) applied over a 2km spatial resolution grid for Thessaloniki. There were 17 vertical
CAMx layers extending up to 10 km above ground level. CAMx simulations were performed for
a summer period (month of July using the WRF meteorology for July 2011) and a winter period
(the period from 15 November to 15 December using the corresponding WRF meteorology for
the year 2011). CAMx runs were based on the 2km resolution anthropogenic emission data of:
a) the base future emission scenario and b) the base future emission scenario reduced in order
to account for the mitigation actions selected. 2km spatial resolution natural emission data (bio-
genic NMVOCs, wind-blown dust and sea salt), as calculated with the use of NEMO driven by
the WRF meteorology for the year 2011, were also used. The chemical boundary conditions for
the Thessaloniki grid were taken from the results of CAMx having been applied over the Balkan
Peninsula for the present time emission scenario.
Figure 7 shows the differences in the mean PM10 and PM2.5 concentrations of the 2020 year
base future scenario due to the implementation of both mitigation actions. The differences are
small. The maximum decreases in mean PM levels are identified in and near the port area where
PM10 values decrease by -4.4% and -2.4% and PM2.5 concentrations are reduced by -0.9%
and -0.5% during the summer and winter period respectively. Controlling PM emissions from
port storage piles with the use of wetting agents (chemical and water) improves better the PM air
quality near the port area than the implementation of the cold ironing.
Figure 7. Difference (%) in the
mean PM10 (top panel) and
PM2.5 (bottom panel) con-
centrations implementing the
“Cold ironing” and the “Use
of wetting agents” mitigation
actions for the summer and
winter periods studied.

59
Venice
One emission mitigation scenario was examined for Venice accounting for the following 2 miti-
gation actions:
1. Cold ironing: It was considered for the cruise vessels hotelling in Venice at the Marittima Ter-
minal, with a total amount of 6195 hours of power supply in a year and a local production of
electricity by the near coal power plant in Fusina (Porto Marghera),
2. Limitation of 0.1% for the sulfur content in ship fuels: The measure was considered for all the
passenger ships arriving and departing from the terminal inside the historical city of Venice
in maneuvering and cruising phases. The emission estimation calculation has considered an
obligation to switch from Bunker Fuel Oil (BFO) to Marine Gas Oil/Marine Diesel Oil (MDO/
MGO) in order to reach the limit.
The changes in the emissions of the future reference year 2020 due to each of the mitigation
actions examined are reported in Figure 8.
Figure 8. % Change in future time emissions due to emission mitigation measures in Venice.

60
The modeling chain implemented was constituted by COSMO-LAMI (Limited Area Model Italy)
meteorological model and the photochemical air quality model CAMx, which was run for two
periods: from June to August 2011, and from mid-November to mid-December 2011. The main
CAMx grid had an extent of about 250 km and a 4 km resolution, whereas the nested one co-
vered the urban area of Venice with an extent of 30 km and a resolution of 1 km. In the CAMx
domain there were 10 vertical layers extending up to 3 km above ground level. The gaseous
and PM chemical boundary conditions were provided by the CHIMERE outputs of the Prev’air
System (http://www.prevair.org/fr/index.php). Natural emissions (biogenic NMVOCs, wind-blown
dust and sea salt) have been calculated during the CAMx simulations, starting from land use and
the meteorological data provided as input to the model. CAMx runs were based on: a) the base
future emission scenario, with the emission data coming from the projection to the year 2020 of
the Veneto Regional Emission Inventory by GAINS-Italy model and the port emissions estimated
by the EMEP/EEA methodology on the ship movements foreseen for the development scenario
at 2020 and b) the base future emission scenario reduced in order to account for the mitigation
actions selected.
Figure 9 illustrates the expected impact of both mitigation actions on the PM2.5 mean levels of
the 2020 year base future scenario in the Venice area for a summer month (using the meteorology
of the corresponding month for the year 2011). Model runs for a winter period were not performed
since the mitigation actions selected consider the passenger ship traffic that has non negligible
contribution only in summer. The maximun decrease occurs in the cell of the Passenger Terminal
in which cold ironing has been modeled.
The map for PM10 (not shown here) is very
similar with that presented in Figure 9 and
reveals differences in concentration values
that are not detectible.
Figure 9.Difference (%) in the mean PM2.5 concentra-
tions between the future mitigation scenario and the
future base scenario for the summer period studied.
Conclusions
A summary table for the effect of the different emission mitigation scenarios on the future PM
maritime emissions and PM air quality in the study areas is presented below. Table 5 shows the
differences in the mean PM2.5 and PM10 levels of the base future scenario at the monitoring
sites and in the whole modeling domain because of the emission mitigation actions examined in
each study area.
For Barcelona and Genoa, the estimated decreases in mean PM concentrations are moderate
in the summertime; down to -12.7% and -11.6% for PM2.5 and PM10 respectively in Barcelona
and -23% and -21% for PM2.5 and PM10 in Genoa. For Thessaloniki and Venice the maximum
reductions are expected to be rather small; -0.9% and -4.4% for PM2.5 and PM10 in Thessalo-
niki and -1.5% for both PM2.5 and PM10 in Venice. In wintertime, the mitigation measures could
have a moderate impact on the PM air quality in Barcelona and Marseille. The maximum decrea-

61
ses are -11.2% and -10.6% for PM2.5 and PM10 respectively in Barcelona; -8.5% and -6.1% for
PM2.5 and PM10 in Marseille when considering the “LNG passenger” scenario. For Thessaloniki,
the air quality improvement seems to be rather small.
As shown in Table 5, PM2.5 maritime/harbor annual emissions are cut down by -35% and -69%
in the port areas of Genoa and Thessaloniki respectively because of the mitigation actions. Also
in the Marseille urban study domain, the use of LNG as fuel in passenger and cruise shipping may
seriously reduce PM2.5 maritime annual emissions by -78%. The mitigation actions are expected
to result in a moderate reduction (-13%) of PM10 emissions in the Barcelona port area and in a
moderate decrease (-10%) of PM2.5 and PM10 emissions in the port of Venice.
Based on the above, it can be concluded that the mitigation actions studied for each Mediter-
ranean port-city are more effective in terms of the maritime and harbor emission reductions that
they induce mainly in local scale while their impact on the air quality is estimated to be more
limited.
Table 5: The effect of emission mitigation actions on the PM emissions and concentrations in
the study areas for a future reference year1.
City Mitigation actions
% Decrease in maritime and
port annual emis-sions2
% Difference of mean concentration at the monito-ring sites
% max increase / % max decrease of mean con-
centration in the modeling domain3
PM10 PM2.5PM2.5 (PM10)
(summer month)
PM2.5 (PM10)(winter month)
PM2.5 (PM10)
(summer month)
PM2.5 (PM10)(winter month)
Barcelona18 actions (see the text above)
-13 -Port site: -11.3 (-10.2)Urban site: -1.7 (-1.6)
Port site: -10.3 (-9.9)-Urban site: -1.3 (-1.5)
0.0 / -12.74
(0.0 / -11.6)40.0 / -11.24
(0.0 / -10.6)4
Genoa Cold ironing -35 -35Port site: -1 (-1)
Urban site: <-1 (<-1)-
0.0 / -23%(0.0 / -21%)
-
Marseille Cold ironing -3 -3 -Port site: -0.1 (-0.1)Urban site: 0.0 (0.0)
-0.0 / -1
(0.0 / -0.7)
Marseille New cruise terminal 0 0 -Port site: +0.9 (+0.6)Urban site: 0.0 (0.0)
-8.4 / -5.5(5.8 / -3.9)
Marseille LNG passenger -78 -78 -Port site: -6.0 (-4.2)
Urban site: -1.0 (-0.7)-
-0.1 / -8.5(-0.1 / -6.1)
Thessaloniki
Cold ironing and use of wetting agents (chemical and water) for storage piles
-50 -69Port site: -0.9 (-4.4)
Urban site: -0.07 (-0.4)Port site: -0.4 (-2.4 )
Urban site: -0.03 (-0.10.2/-0.9(0.2/-4.4)
0.01/-0.5(0.01/-2.4)
Venice
Cold ironing and 0.1% sulfurcontent in passenger ship fuels
-10 -10Malcontenta5: -0.5 (-0.5)Sacca Fisola5: -1.4 (-1.4)Parco Bissuola5: -0.5 (-0.5)
--1.5(-1.5)
-
1 Future reference year: 2015 for Barcelona; 2020 for Genoa, Thessaloniki and Venice; 2025 for Marseille.2 Reference area: the port area for Barcelona, Genoa, Thessaloniki and Venice; the urban area for Marseille.3 Modeling domain extend: 100 x 100 km2 for Marseille, Thessaloniki and Venice; 40 x 40 km2 for Barcelona; 40 x 30 km2 for
Genoa.4 % changes of mean concentration refer to scenario (b) (Trend scenario + APICE mitigation measures).5 Malcontenta: Commercial port in Porto Marghera; Sacca Fisola: Historical city near Passenger Terminals; Parco Bissuola: Urban
background.
References1. ENVIRON, 2010. User’s guide CAMx - Comprehensive Air Quality Model with extensions, Version 5.30, ENVIRON International
Corporation, 415.899.0700, December 2010.2. Jiménez-Guerrero, P., Montávez, J.P., Gómez-Navarro, J.J., Jerez, S., Lorente-Plazas, R., 2012. Impacts of climate change on
ground level gas-phase pollutants and aerosols in the Iberian Peninsula for the late XXI century. Atmospheric Environment, 55, 483-495, doi:10.1016/j.atmosenv.2012.02.048.
3. Markakis, K., Giannaros, T., Poupkou, A., Liora, N., Melas, D., Sofiev, M., Soares, J., 2009. Evaluating the impact of particle emis-sions from natural sources in the Balkan region, European Aerosol Conference 2009, 6-9 September 2009, Karlsruhe, Germany.
4. Markakis, K., Katragkou, E., Poupkou, A., Melas, D., 2013. MOSESS: A new emission model for the compilation of model-ready emission inventories. Application in a coal mining area in Northern Greece. Environmental Modeling and Assessment (accepted).
5. Poupkou, A., Giannaros, T., Markakis, K. Kioutsioukis, I., Curci, G., Melas, D., Zerefos, C., 2010. A model for European biogenic volatile organic compound emissions: Software development and first validation. Environmental Modelling and Software, 25, 1845-1856.
6. Skamarock, W.C., Klemp, J.B., Dudhia, J. et al., 2008. A detailed description of the advanced research WRF version 3, NCAR/
TN-475+STR, NCAR Technical Note, June 2008, Boulder, Colorado, USA.

62
11. Towards common steps to curb emissions: the Common Transnational Strategy of APICE Project
11.1 The Common Transnational Strategy: What is about?
The Common Transnational Strategy (CTS) represents the general and shared result of the APICE
project, whose title explicitly mentions, as its general aim, “Common Mediterranean strategy and
local practical Actions for the mitigation of Port, Industries and Cities Emissions”.
On one hand, CTS is meant to support policy makers and local communities to develop their
own strategies to mitigate air pollution in coastal areas. On the other, CTS is oriented to support
the ongoing discussion at European level with respect to New Directives implementation on Air
quality and on ICZM, integrated with the Marine Strategy Framework Directive.
The CTS represents the merging point of the scientific findings (air-monitoring campaigns and
model scenarios) with environmental, economic and urbanization trends in vulnerable Mediterra-
nean areas and the platform for shared initiatives. It aims at constituting a road map to develop
a common Mediterranean path to curb emissions that is further articulated in local adaptation
plans, according to a principle of environmental, economic and social sustainability.
The Common Transnational Strategy has been structured aiming at simultaneously supporting
the sustainable development of port activities, being respectful of the environment and human
health. Stakeholders, targets and goals, measures and actions, communication issues are strictly
linked and intertwined, since they together constitute the “ingredients” to design and implement
a local plan towards air pollution mitigation.
Common Transnational Strategy is the result of bottom-up process which has taken place in the
5 Port-Cities of the APICE Project: Barcelona, Genova, Marseilles, Thessaloniki and Venice. The
contents arise from the comparison of the discussions of APICE Partners with local stakeholders
in each Port City.

63
11.2 Towards a common Mediterranean strategy: shared measures
for air pollution mitigation
The Common Transnational Strategy arises from the assessment of actions for air pollution mi-
tigation in each Port City (Barcelona, Genova, Marseilles, Thessaloniki and Venice), which has
been built taking into consideration the main sectors of emissions (according to 7 categories),
which were as well considered in the emissions inventories, as follows:
• Measures cat. 1: Ship emissions
• Measures cat. 2: Diesel Powered equipment
• Measures cat. 3: Cargo handling equipment
• Measures cat. 4: Rail emissions
• Measures cat. 5: Road emissions and diesel road vehicles
• Measures cat. 6: Solid Bulks
• Measures cat. 7: Inventorying, Monitoring, Communicating
Each measure has been articulated in actions, of different type and nature. Cluster of stakehol-
ders were associated to each action, according to their involvement, roles and competences, to
evaluate the actions.
The assessment was conducted at local level by each APICE Port City working group, taking into
consideration the local differences between the 5 Port Cities, as their geographic, climate, topo-
graphic conditions, as well as the economic situation, trends and scenarios of each Port Cities.
To evaluate the feasibility of actions in each Port City, 10 criteria were adopted by the Part-
nership. The criteria, that take into consideration environmental, social and economic aspects
at once, in line with the general approach of the APICE project, have been weighted from the
Partnership through a Delphi Method: Cost-effectiveness, Implementability, Emissions reduction
potential, Technical feasibility, Costs, Enforceability, Co-benefits, Potential funding opportunities,
Measureable results, Timeframe. With respect to the criterion on “emissions reduction potential”,
the evaluation was developed according to the information deriving from the APICE modeling,
where available.
Measures and actions contained in the CTS have been shared by the APICE Partnership as the
ones that might be implemented in different ways and according to different schedule, by all
partners.
The most suitable actions supported by the APICE project are listed in table 1.

64
Table 1: actions shared by the Partnership as part of the Common Transnational Strategy
Measures Actions
Measure 1: Ship Emissions Action 1.1: On-shore Power Supply (OPS)Action 1.2: Change fuel while maneuveringAction 1.3: Alternative fuel (LNG)
Measure 2: Diesel powered equipment and Cargo handling equipment
Action 2.1: Accelerated fleet turnoverAction 2.2: Idle reduction programsAction 2.3: Alternative fuels
Measure 3: Road Traffic Action 3.1: Improvement of road system (to avoid congestion)Action 3.2: Environmental excellence certification for trucksAction 3.3: Mode switching - Alternative fuels (CNG, LNG, hybrid)Action 3.4: Idle reduction programs
Measure 4: Rail Traffic Action 4.1: Increase rail ratio through economic incentivesAction 4.2: Improvement of rail system (access, avoid congestion)Action 4.3: Track electrification
Measure 5: Inventorying, Monitoring, Coordi-nating, Communicating
Action 5.1: Monitoring and control (protocol or agreement between stakeholders, etc) Action 5.2: Port Air Quality Steering/Working CommitteeAction 5.3: Data Sharing: Inventoring Emissions and Monitoring con-centrations as the base for planningAction 5.4: Communication strategy

65
12. The Local Adaptation Plans: strategies for mitigation of air pollution in each APICE Port-CityThe Local Adaptation Plans (LAPs) have been drafted in each project area and they represent the
roadmap at the same time to elaborate and to scale down the Common Transnational Strategy
(CTS) at local level, according to the approach developed within APICE project.
While designing the targets of APICE project, in each area the LAP aims at achieving specific
targets. In the area of Barcelona, the LAP aims at constituting a guidance for reduction of 12 %
for both NOx and PM10 emissions from the port, and thus supporting and complementing efforts
by national and regional authorities. In Genoa, the APICE project is expected to develop a model
for air quality focused on harbor emissions, as this tool was missing in this area before APICE.
This tool is fundamental for the Strategic Environmental Assessment of the new Port Master Plan.
The APICE model was also applied to a selection of actions contained in the new Port Master
Plan, with the aim of continuing with the overall assessment of the whole plan. In Marseilles, the
application of APICE inputs and scenarios is meant to support a new project of setting electric
power ground supply terminal within the strategic Plan of the Port Authority and to include of
APICE deliverables in atmospheric, urban and health protection plan of PACA region.
In Thessaloniki, the LAP will contribute in establishing a roadmap for the improvement of the
efficiency of the Decentralized Administration of Macedonia – Thrace and the Region of Central
Macedonia in urban development planning for Thessaloniki city and implementing environmental
policies in order to improve the citizens’ quality of life.
For Venice, the target is to investigate on possible solutions to mitigate air pollution but at the
same time supporting the development of port activities, within the framework of planning gui-
dance to drive port-district expansion (and its connection with the northeast transport poles) and
of the Regional Masterplan (under revision) and coastal plans, as well as to support the promotion
of agreements to mitigate emissions of docked-vessels closed to the historical islands of Venice
As geographical scope, the areas investigated take into consideration morphological and geo-
graphical aspects which are specific of each Port City: in Barcelona, area declared Special Pro-
tection Zone in the Air Quality Plan (40 municipalities); in Genoa, coastline and its back of Genoa
Province; in Marseilles, the Bouche-du Rhône land as a part of the PACA Region; in Thessaloniki,
the Region of Central Macedonia; in Venice, City of Venice and Venice Lagoon, with respect to
Veneto Region.
The Local adaptation plans are organized in a coherent way to be comparable between part-
ners, even if local differences are put in evidence, as they characterize the specific context in
which the Common Transnational Strategy has been elaborated and downscaled through the
common methodology. Based on the CTS general framework, each Port City working group has
articulated the LAP according to peculiarities and specific topics emerged from the discussion
with the stakeholders involved. For example, Barcelona LAP is oriented toward the coherent and
conversion of Port activities towards the use of LNG and natural gas; while in Venice, the LAP
acquires a precautionary approach supporting voluntary agreements between public and private
stakeholders, because of high contextual uncertainties.
With respect to the contents, a first part of LAP is devoted to the Stakeholders involved and the
process of participation; the process of measures assessment; method each Port City adopted
to define emissions reduction targets (the way you use to define emissions reduction targets,
as top down or bottom up; reference to limits, etc); the analysis of emissions sources: main fin-
dings, main problems, uncertainties. A second part of the LAP discusses on measures analysis
and implementation for each specific coastal conditions, taking into consideration the general
evaluation of the measures developed according to the APICE CTS approach.

66
The analysis of each measure has been carried out, considering the state of the art, the de-
scription of the measure and actions in which it is divided (if any). The measures are analyzed
according to the criteria considered for the evaluation (please refer to the CTS paragraph in this
publication), and then discussed about benefits and advantages, disadvantages, barriers, uncer-
tainties, implementation and effect of the measure applied in the Port City.
The final part of LAP is devoted to the discussion of the mainstreaming of local adaptation plan
for each Port City, concerning the main outcomes and actions to be implemented from APICE.
The LAP Mainstreaming within local decision making processes has some specific objectives
according to each local situation: to integrate existing programming, to strengthen territorial
governance in port-cities, and to promote voluntary agreements among administrations, ports,
ship-owners and transport entrepreneurship.
Specifically, the Mainstreaming of APICE’s scenarios and designed measures referred to different
objectives according to local situation. In Barcelona, it regards the integration of APICE Plan
within the Catalan plan to improve air quality, and within Port Authority strategy and manage-
ment; for the Genoa new Port Master Plan, which foresees the reorganization of terminals loca-
tion and new infrastructures; in Marseilles, it reflects on Regional-Urban platform 08-10 for en-
vironmental control of Marseille involving the Marseille Port Authority due to strong investments
in West and East ports; the regional/local air quality environmental plans and urban master plan
of Thessaloniki and the environmental objectives and upcoming master plan of the Thessaloniki
Port Authority; and in Venice, the interaction with the new Veneto Masterplan and Port of Venice
Op. Plan 08-13 which plans hard investments.

67

68

69
Conclusions

70
The general objective of APICE was to pinpoint concrete actions to lowering emissions and miti-
gate air pollution in the pilot harbour cities, while preserving economic potentialities of port cities.
The project analysis was focused on how harbour emission sources contribute to PM concentra-
tions, with particular attention to the PM2.5 fraction.
The multidisciplinary approach, which is based on a strong coordination between scientific and
institutional partners, was meant to guarantee that the scientific knowledge and findings could
have a response on the planning policies and on the assessment plan of each territory benefiting
from the funding.
The first specific objective was to estimate the relative contribution of several pollution sources
to air quality and to understand the similarities/differences among the port areas investigated.
This task has been carried out by the scientific group following two different techniques of Source
Apportionment analysis, based respectively on receptor models and Chemical Transport Models
(CTMs). The focus of these techniques was the identification of pollutant emissions that mostly
affect PM10 and PM2.5 concentrations.
The two different Source Apportionment approaches aimed at integrating the peculiar potentia-
lities of both techniques: by one side receptor models, more suitable to pointing out the bonds
between specific emission sources and specific markers and, on the other side, CTMs, that
extend their assessment on the formation of secondary aerosols, since they apportion the gas
precursor emissions, too.
These two SA techniques have required different preparatory activities that have been imple-
mented in parallel for each harbour area of the project. Receptor models identify, on a statistical
basis, the weight of different urban sources differentiating temporal trends in concentrations; to
their implementation, chemical speciation of aerosol are required to quantify the abundance of
the different source tracers.
The chemical transport models, on the other hand, reconstruct the air pollutant concentrations
from emissions and meteorological inputs, so they are particularly suitable for scenarios evalua-
tion.
As input of the receptor models, during 2011, in each studied area a long air pollution monitoring
campaign, with aerosol measurements and chemical speciation, has been carried out. A com-
mon feature was the choice to monitor two or more sites, in each urban area, having different
exposures to emission sources. In every city, at least one site was more exposed to maritime
emissions (from harbour terminals or at least from ship traffic), one site was urban background
and possibly one place more exposed to surrounding industrial area.
In order to better understand the differences among the study areas, the inter-comparison exerci-
se in Marseille allowed comparing the monitoring techniques and the receptor model applications
in the frame of the six-week long campaign, carried out at the beginning of 2011. Considering the
conditions of the inter-comparison exercise (different data set, and partners totally free to use its
own methodology), results obtained can be consider in quite good agreement.
The long monitoring campaigns in each study area produced a quite detailed picture of PM
composition and sources. Even if the results are not directly comparable since they partially de-
pend on the position of the sampling sites, in four cities the impact of ships emissions has been
detected at comparable and significant levels (between 10% -20% of the total PM) while a lower
figure came out from the Marseille data set. This was the only one analysed with the CMB model
and a systematic difference with the PMF approach is not surprising and would deserve a much
broader discussion.
For the implementation of the chemical transport models, the present scenario of local emissions
13. Main scientific conclusions

71
has been performed in each study area. On the project’s website, it is available one emission
inventory for each partner. Emission inventories have been developed by accounting gaseous
and particulate emissions from all anthropogenic sources (transport, industry, energy, residential
heating, etc.). Emphasis has been given to the detailed calculation of emissions from ships and
other activities in the harbours. In addition, natural emissions in the study areas have been cal-
culated, including biogenic emissions and emissions from windblown dust and sea salt. Beside
the emission inventory, for every pilot area, a socio-economic trend database has been delivered.
Focusing on the most risky activities in harbour in terms of the PM emissions, cargo shipping
has been identified as the major contributor, and in most of the cases passenger ships is the
second emission source. Considering the usual location of the passenger ships terminals in the
very heart of the port-cities studied, and specifically in Venice and Genoa at a very short distance
to densely populated areas, the study of mitigation actions has been concentrated also on this
ship category.
The Source Apportionment analysis by CTMs produced a quite detailed picture of the contribu-
tion of the different emission sources to the PM2.5 in each study area. As for maritime activities
impact, a common feature for the five study areas is a higher contribution during the summer pe-
riod, when touristic ship activities are at their maximum and residential heating is at its minimum.
The maritime contribution among the city partners is quite different, depending not only on the
peculiarity of each study area (e.g.: socio-economic trends, meteorological and dispersion condi-
tions, industrial and residential emission strength and composition), but also from the methodo-
logy applied by the partners. The higher contribution of harbour activities has been estimated in
summer in Barcelona at the very heart of the port and in Thessaloniki at open sea (both over 50%
of contribution), whereas in the other cities lower values have been estimated. Nevertheless at
urban background sites more comparable results have been obtained with a contribution ranging
from 2% to 17% in summer and 0% to 7% in winter.
Beside SA analysis, CTMs have been used to simulate the future development scenarios, as well
as the mitigation scenarios, in order to assess the effectiveness of mitigation actions, addressed
in strict collaboration with the territorial authorities involved in local working tables.
The future base scenario has been estimated on a reference year (2015 or 2020 or 2025, de-
pending on the city), taking into account both the port development (extension of piers, spatial
displacements, increase in port traffic) and the projection of all the other emissions according to
future legislation and trend drivers (for example fleet renewal for road transport or change in fuel

72
consumptions).
In particular, future maritime emissions have been calculated considering the reduction to 0.5%
for the fuel sulphur content in force as of 2020, according to the Directive 2012/33/EC.
In the future, an increase in ship and vessel emissions of NOx and NMVOC is expected in all the
cities related to the foreseen increase of the maritime traffic. Regarding SO2, a reduction of total
harbour emissions is estimated due to the reduction of the sulphur content in marine fuels. PM
ship and vessel emissions will increase significantly in Marseille, Thessaloniki and Venice and
present a small to a moderate decrease in Barcelona and Genoa. In the latter cities, the effect
on the emissions of the new regulatory limit imposed for the content of sulphur in the ship fuels
overcomes the expected emissions increase due to the port activities growth. The results for
the future emissions by ship and vessel type reveal that the major contributor to PM emissions
is again the cargo shipping in Barcelona, Marseille and Thessaloniki while in Venice passenger
ships become the most important future PM emission source.
Finally, an increase in pollutant emissions from activities induced by the presence of the port is
expected for Venice and Thessaloniki while a decrease is foreseen for Barcelona.
The future base scenario was the basis to calculate the mitigation scenarios that considered
specific measures to lowering or mitigating harbour emissions. The difference between the base
future and the mitigation scenarios has been calculated both in terms of emissions and concen-
trations.
The future mitigation scenarios designed in every city come from a participative process by the
local working tables specifically established under the coordination of the institutional partners.
Following the Delphi method, a list of mitigation actions have been evaluated by the working ta-
bles stakeholders through some criteria, among which cost-effectiveness, implementability and
emissions reduction potential have been considered the more relevant in the decision making
process.
The mitigation actions considered more interesting are:
• Cold ironing for cruise ships or RO-PAX vessels
• 0.1% for sulphur content in fuels to be used also in the manoeuvring phase
• Use of LNG fuel
• Scrubbers to be used to abate emissions during the hotelling or manoeuvring phases
• Displacement of some on shore harbour activities
• Usage of wetting agents (chemical and water) to control the storage pile emissions
The decreases in mean PM concentrations were estimated to be rather limited (less than -13%)
for 4 of the 5 cities of the project. Only for Genoa, the calculated changes in PM values are rather
high (up to -23%). These figures suggest that the mitigation actions studied can be effective in
reducing emissions at the local scale, while their impact on air quality was estimated to be more
limited. It depends on urban aerosol characteristics: as aerosol pollution arises principally from
secondary formation, it has a large scale evolution, requiring acting on a wide perspective on all
emissions sectors.
Nevertheless the main project results can be considered the installation of local working tables
and the development of a Common Transnational Strategy in which the more cost-effective ac-
tions have been delineated, evaluated and compared in response to the second specific objec-
tive of the project.
This Common Transnational Strategy represents a basis for integrating the harbour management
and development plans in the air quality policy at local level, in the frame of the Local Adaptation
Plan designed in response to the third specific objective of APICE.

73
14. APICE in the Mediterranean: perspectives and emerging issues
The Common Transnational Strategy, as synthesis arisen from the main outputs of the APICE
project, puts in evidence some important issues that all APICE Port Cities share, and that can be
extended to the Port Cities of the Mediterranean area.
As emerging point, it is relevant to mention the importance of networking of port cities and their
stakeholders towards common goals on topics which will have common impacts on Port-Cities,
and which local communities alone might not be able to face.
Some important points regard (1) the evaluation at local level of the effectiveness of environmen-
tal regulations at European level; (2) the need of networking of Local stakeholders to acquire a
position in the international debate with global economic actors (Shipowners and Ship Com-
panies), towards sustainable development, (3) the need of networking of Local stakeholders to
share best practices and procedure, to achieve environmental objectives as defined by European
policies.
Special attention has to be devoted to the Mediterranean Sea and the different geographical are-
as in which it is divided, as West Mediterranean, the Adriatic and Ionian Sea, as the negotiation
of Environmental requirements might affect competitiveness and attractiveness of the Mediterra-
nean Ports on global markets. On this topic, a wider discussion should be launched with respect
to the proposal for a Emission Control Area (ECA) in the Mediterranean by the European Union
together with the stakeholders at all scales, from local stakeholders to global economic actors as
ship owners and ship companies. The discussion should be based on an extensive cost-benefit

74
analysis to put in relevance positive and negative externalities to the Mediterranean environment,
as well as to the costs that private companies might assume.
APICE methodology and rationale, in its entire process from monitoring, inventorying, mode-
ling, scenario analysis and planning, can be adopted to assess the marine SOx emissions in
the designated area and their impact on the environment and human health, as required by the
SECA application, that has to be carried out by States attending International Maritime Organi-
zation (IMO). If there exist already several indications with respect to environmental values of the
Mediterranean with respect to marine and coastal ecosystems, however, several uncertainties
should be overcome. The APICE project has defined, for the areas concerned by the project, the
contribution of each sector to emissions through source apportionment. The evaluation of the
cost-effectiveness between the effort of different sectors in reducing emissions according to their
contribution to air pollution is an uncertain point that might emerge. Further studies on the eco-
nomic impacts in the Mediterranen Sea of the entry into force of the SECA should be put in place.
The results from the APICE project might be useful to enter inside the discussion on the oppor-
tunity to launch and support the predisposition of a ECA for the Mediterranean, considering that
more original research and further discussion with the stakeholders is needed. The APICE me-
thodology, as well as the structured process of stakeholders’ participation can constitute a solid
base to introduce the phase of stakeholders’ consultation as required by the ECA application
procedure.
Besides the specific question on the Emissions Control Area, as a tool to mitigate air pollution
from maritime transport, it is necessary to understand how to promote sustainable transport in
the context of climate change, according to European objectives as definend in the White paper
“Roadmap to a single European transport area” (COM(2011) 144 final). Research and innovation
are essential for a faster and cheaper transition to a more efficient and sustainable European
transport system based synergies with sustainability objectives on (i) vehicles’ efficiency, (ii) cle-
aner energy use (iii) more secure operations. The APICE approach constitutes a robust tool to
work towards the construction of strategies of mitigation of emissions according to the principles
established by the White Paper.

75
15. Capitalisation and utilisation of the results of the project
APICE has worked since the beginning of the project in capitalizing the results by different means.
Firstly, the communication strategy has assured reaching key stakeholders from international to
local levels in a way that they have been well informed about project progress and results have
been duly transferred. To this aim, the project team has made use of the website, newsletters and
attendance to international conferences and meetings. Furthermore, the team has contributed to
the Med Programme clusters and capitalization process participating in meetings and providing
input to strategies, and therefore including APICE view at the Mediterranean scale.
The main results, the Common Transnational Strategy (CTS) and the Local Adaptation Plans
(LAP), have been transferred to concerned stakeholders by presenting and discussing with them
the measures. For example, in the case of Barcelona, the regional government already agreed on
incorporating some of the measures into their planning. In the case of Thessaloniki, an agreement
for the mitigation actions on the basis of LAP is under consideration. In Marseille, PACA region
has already made use of APICE results by integrating some of the scientific results and measures
into its regional air policy. In Genoa, the tools developed in APICE will be used by Genoa Port
Authority to evaluate the new Port Master Plan. In Venice, the APICE analysis and insight on the
contribution of the port of Venice on the air quality of the Venetian area has been integrated on
the Veneto Air Quality Regional Plan currently under implementation. Therefore, APICE is being
mainstreamed into regional and local policies and assuring project results being used.
Prior to these planning tools, research has been conducted and produced remarkable insights
for both policy makers and scientists. In fact, these new data sets, cartography, port-city com-
parisons are made available through APICE portal so they are of use for interested stakeholders.
Results are relevant in different aspects of EU-MED policy. Firstly, they support complying with air
quality standards according to current legislation. The transnational strategy and local adaptation
plan addresses transport and energy aspects, having the EU and the Programme MED an impor-
tant say. For example, territorial cooperation is relevant for rail network development throughout
the Mediterranean (this is an important measure to reduce container trucks emissions). Energy
and engines efficiency, as well as alternative energy/fuel are regarded as important measures, in
line with EU policies, supporting also innovation.

76
APICE: a MED project in accordance with the principles of Integrated
Coastal Zone Management
www.apice-project.euwww.programmemed.eu
www.ec.europa.eu/environment/ICZM/home.htm