reduced water motion enhances organic carbon stocks...
TRANSCRIPT

Reduced water motion enhances organic carbon
stocks in temperate eelgrass meadows
by
Carolyn Isabella Prentice
B.Sc., University of British Columbia, 2013
Report No. 690
Research Project Submitted in
Partial Fulfillment of the Requirements for the Degree of
Master of Resource Management
in the
School of Resource and Environmental Management
Faculty of Environment
© Carolyn Isabella Prentice 2018 SIMON FRASER UNIVERSITY
Spring 2018
Copyright in this work rests with the author. Please ensure that any reproduction or re-use is done in accordance with the relevant national copyright legislation.
ii
Approval
Name: Carolyn Isabella Prentice
Degree: Master of Resource Management
Report No: 690
Title: Reduced water motion enhances organic carbon
stocks in temperate eelgrass meadows
Examining Committee: Chair: Natasha Salter Master of Resource Management Candidate
Dr. Anne Salomon Senior Supervisor Associate Professor _______________________________________
Dr. Margot Hessing-Lewis Supervisor Research Scientist Hakai Institute _______________________________________
Dr. Rhea Sanders-Smith Supervisor Research Scientist Hakai Institute _______________________________________
Date Defended/Approved: January 26, 2018

iii
Abstract
Organic carbon (OC) storage in coastal vegetated habitats (blue carbon) is
increasingly being considered in carbon financing and ecosystem-based management.
Seagrass meadows have potential to sequester and store significant amounts of carbon,
primarily belowground in the sediments beneath them. However, existing estimates are
primarily from tropical and sub-tropical regions. On the northwest coast of North
America, the magnitude and variability of seagrass carbon stocks, as well as local
drivers of variability remain rare. We collected sediment cores from six eelgrass (Zostera
marina) meadows on the coast of British Columbia, Canada, to quantify sedimentary OC
stocks and accumulation rates. The top 20cm of sediments exhibited a 30-fold difference
in OC stocks across meadows (185 – 5545 g OC m-2). Stocks in meadow interiors (1392
± 928 SD g OC m-2) were 1.23 times greater than those along meadow edges (1130 ±
698 SD g OC m-2) and 1.42 times greater than adjacent unvegetated sediments (977.10
± 516 SD g OC m-2). The top 20cm of sediment represented 21 to 74 years of
accumulation, and OC accumulation rates ranged from 13 to 50 g OC m-2 year-1. Isotopic
analysis of sediments (δ13C = 19.43%0 ± 3.25 SD) revealed that OC is largely derived
from non-seagrass sources (terrestrial, benthic microalgae and/or macroalgae). OC
stocks in the top 5 cm were most strongly influenced by water motion (Relative Variable
Importance RVI = 0.81), relative to seagrass structural complexity (RVI = 0.21), and
sediment size (RVI= 0.22). Specifically, higher OC stocks were associated with lower
water motion, which may facilitate greater deposition of organic carbon particles and
reduce rates of erosion and resuspension. This study highlights variability in carbon
stocks at local scales with profound implications for estimating variability in carbon
stocks at regional and global scales, typically unaccounted for in seagrass blue carbon
estimates. To help account for this variability, we demonstrate that reduced water motion
can indicate high potential for blue carbon storage in temperate soft sediment habitats.
Keywords: Zostera marina; blue carbon; carbon storage; climate change; seagrass
hydrodynamics; variability

iv
Dedication
I would like to dedicate this thesis to my parents, Alison and Andrew
Prentice, who instilled a love of nature and sense of curiosity in me at a
young age and are still actively involved in citizen science and ecological
restoration (including eelgrass planting!) to this day.

v
Acknowledgements
There are numerous people who I would like to thank for their contributions to this
project and support throughout this journey. First, I would like to thank Eric Peterson and
Christina Munck for the generous support from the Tula Foundation during my degree. It
is inspirational to work with the passionate and intelligent scientists at the Hakai Institute.
Additionally, I would like to thank the Commission for Environmental Cooperation (CEC)
for their financial contributions to sediment coring supplies and laboratory analyses.
Thank you also to Fred Short for the opportunity to participate in the wider Pacific
Northwest CEC Blue Carbon project.
I am so appreciative of the passionate and hard-working Hakai Nearshore Team – Derek
Van Maanen, Kyle Hall, Kaia Bryce, Zach Monteith, Ondine Pontier, Ben Millard-Martin,
Andrew McCurdy, Krystal Bachen, Tyrel Froese, Neha Acharya-Patel, Tanya Prinzing,
Gillian Sadlier-Brown and Midoli Bresch; this project would not have been possible
without your help with sediment core collection and processing! A special thanks to
Natasha Salter and Angeelen Olson for their amazing friendship and scientific insight.
Thank you to Maureen Soon and Alice Chang for their helpful advice on elemental and
isotopic analyses. To the Cascadian Women in Blue Carbon (CWIBC) – Mira, Katrina
and Erin – I am so glad I met you! Not only are you inspirational women in science and
my go-to for any blue carbon questions, you have become dear friends to me!
Thank you to the REM and SFU community; it has been a pleasure meeting so many
amazing people over the past two and a half years! I am grateful to have been a
member of the Coastal Marine Ecology and Conservation Lab – thank you to my lab
mates Natasha Salter, Markus Thompson, Gabby Pang, Jenn Burt, Skye Augustine,
Hannah Kobluk, Erin Slade, Sachiko Ouchi, and Lynn Lee for being such a supportive,
talented, optimistic and fun group of people! Finally, I feel extremely lucky to have had
three amazing supervisors – Anne, Margot and Rhea - thank you for meeting with me
whenever I needed it, for your support and guidance and for being amazing role models!

vi
Table of Contents
Approval.......................................................................................................................... ii Abstract...........................................................................................................................iii Dedication ...................................................................................................................... iv Acknowledgements ......................................................................................................... v Table of Contents ........................................................................................................... vi List of Tables ................................................................................................................. vii List of Figures ............................................................................................................... viii
Introduction ................................................................................................................... 1 Blue Carbon Ecosystems ................................................................................................ 1 Carbon Sequestration and Storage in Seagrass Meadows ............................................. 1 Factors Influencing Seagrass Blue Carbon Potential....................................................... 2 Objectives and Hypotheses............................................................................................. 3
Methods ......................................................................................................................... 4 Study Area ...................................................................................................................... 4 Experimental Design and Sample Collection ................................................................... 4 Sediment Characterization .............................................................................................. 5 Seagrass Meadow Characterization ................................................................................ 7 Statistical Analyses ......................................................................................................... 8
Results ......................................................................................................................... 11 Carbon Content, Stocks and Accumulation Rates ......................................................... 11 Local Drivers of Variability in Surface Carbon Stocks .................................................... 12 Sedimentary Carbon Sources ....................................................................................... 12
Discussion ................................................................................................................... 13 High Spatial Variability in OC Stocks ............................................................................. 13 Water Motion Best Explains Surface OC Stock Variation .............................................. 13 Putting Regional Estimates in the Global Context ......................................................... 14 Sediment OC Primarily from Non-Seagrass Sources .................................................... 15 Additional Considerations for Nearshore Carbon Budgets ............................................ 16 Implications for Blue Carbon Policy ............................................................................... 16
Conclusions ................................................................................................................ 18
Figures ......................................................................................................................... 19
Tables .......................................................................................................................... 23
References .................................................................................................................. 27
Appendix. Supplemental Figures and Tables ...................................................... 33

vii
List of Tables
Table 1: Strength of evidence for alternative candidate models explaining variation in (a) surface (5cm) and (b) 20cm organic carbon (OC) stocks. Models with varying numbers of parameters (K) were ranked by differences (∆) in small sample size corrected Akaike Information Criterion (AICc) based on their log likelihoods (Log L) and K. Akaike weights (Wi) were calculated as the relative likelihood of each model (exp(-0.5*ΔAICc) divided by the sum of the relative likelihoods across all models. Adjusted R-squared values (adjR2) were calculated based on the sample size (n) and the number of parameters in the model (K). All values were calculated using the MuMIN package in R. ......................................................................................... 23
Table 2: Geochronological analyses (210Pb dating) and elemental analysis of carbon content were used to estimate mean (±SD), sediment accumulation rates, organic carbon (OC) densities, Constant Rate of Supply (CRS) OC accumulation rates, Constant Initial Concentration (CIC) OC accumulation rates, and the age of the top 20cm of sediment. Aged-based (in contrast with depth-based) OC stocks were calculated by multiplying the OC accumulation rate (g OC/m2 ´ year) for each site by the average number of years that 20cm represents (54 years). Note that Goose SW did not have enough excess 210Pb to obtain age or accumulation rate estimates................................................................... 24
Table 3: Strength of evidence for alternative candidate models explaining variation in surface (5 cm) organic carbon (OC) stocks. Models with varying numbers of parameters (K) were ranked by differences (∆) in small sample size corrected Akaike Information Criterion (AICc) based on their log likelihoods (Log L) and K. Akaike weights (Wi) were calculated as the relative likelihood of each model (exp(-0.5*ΔAICc) divided by the sum of the relative likelihoods across all models. Adjusted R-squared values (adjR2) were calculated based on the sample size (n) and the number of parameters in the model (K). All values were calculated using the MuMIN package in R. ......................................................................................... 25
Table 4: Comparison of organic carbon (OC) stocks from this study (all sites combined) to values obtained from published literature for Zostera marina meadows as well as other seagrass species. ......................................... 26
viii
List of Figures
Figure 1: We sampled sediments within six eelgrass (Zostera marina) meadows located along the northwest coast of North America (a), on British Columbia’s (b) Central Coast (c). Nine cores were obtained from three positions within each meadow (interior, edge and adjacent bare sediment). Specific sampling locations at each site are shown in Figure A.1. Figure adapted from Keeling et al. (2017). ...................................... 19
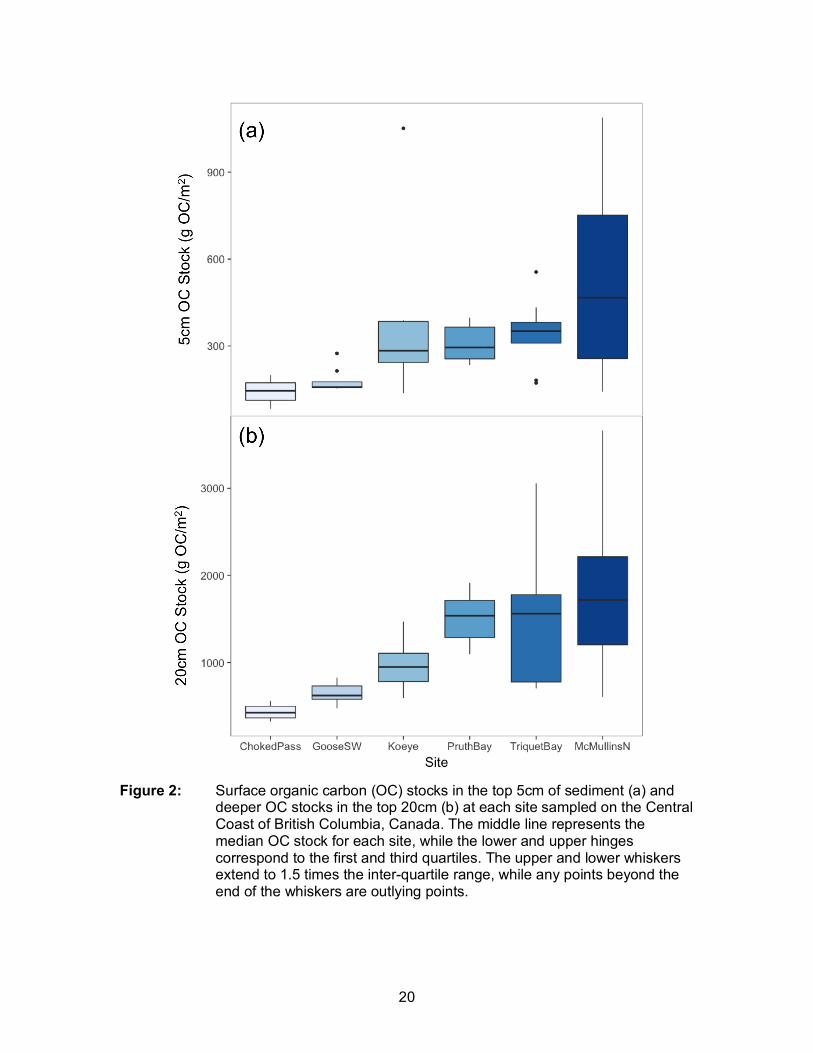
Figure 2: Surface organic carbon (OC) stocks in the top 5cm of sediment (a) and deeper OC stocks in the top 20cm (b) at each site sampled on the Central Coast of British Columbia, Canada. The middle line represents the median OC stock for each site, while the lower and upper hinges correspond to the first and third quartiles. The upper and lower whiskers extend to 1.5 times the inter-quartile range, while any points beyond the end of the whiskers are outlying points. ................................................. 20
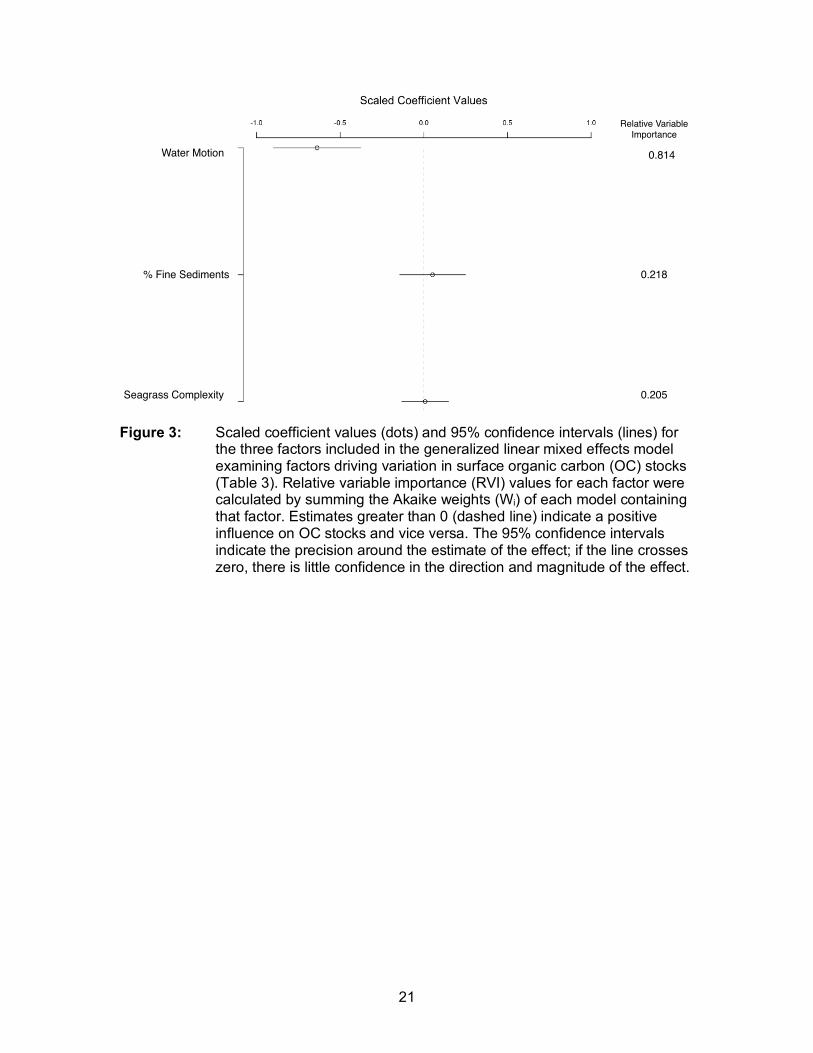
Figure 3: Scaled coefficient values (dots) and 95% confidence intervals (lines) for the three factors included in the generalized linear mixed effects model examining factors driving variation in surface organic carbon (OC) stocks (Table 3). Relative variable importance (RVI) values for each factor were calculated by summing the Akaike weights (Wi) of each model containing that factor. Estimates greater than 0 (dashed line) indicate a positive influence on OC stocks and vice versa. The 95% confidence intervals indicate the precision around the estimate of the effect; if the line crosses zero, there is little confidence in the direction and magnitude of the effect. .............................................................................................................. 21
Figure 4: δ13C and δ15N signatures for sediment mixtures from five of the six sites sampled (orange triangles) and from potential OC sources (green circles). Choked Pass is not shown, as sediment N values were too low to conduct isotopic analyses. Error bars are standard errors for sediment mixtures and standard deviations for sources, for ease of visualization. Benthic diatom signatures are from 51 benthic diatom samples in San Francisco Bay Estuary (Cloern et al., 2002); POM data represent the mean value for the Central Coast of British Columbia, Zostera marina signatures are from Choked Pass, Central Coast, BC (Olson et al. 2015); terrestrial values represent the range reported in Cloern et al. (2002). .............................. 22
ix
Preface/Executive Summary/Image

1
Introduction
Blue Carbon Ecosystems
Conserving and restoring vegetated ecosystems that efficiently sequester and
store carbon (C) is a climate strategy that can remove atmospheric carbon dioxide
(CO2)(Pan et al., 2011; Duarte et al., 2013). In addition to ‘green carbon’ sequestered by
terrestrial ecosystems, coastal vegetated ecosystems - mangroves, salt marshes and
seagrass meadows - can sequester and store significant amounts of ‘blue carbon’
(Nellemann et al., 2009; Laffoley and Grimsditch, 2009; McLeod et al., 2011). Blue
carbon habitats play a disproportionally large role in carbon sequestration relative to
their global extent, making them ‘hot spots’ for carbon storage (Duarte et al., 2005;
McLeod et al., 2011; Fourqurean et al., 2012). Further, degradation and destruction of
coastal ecosystems can release carbon that has accumulated over decadal, centennial
or millennial time scales, as well as limit capacity for future sequestration and storage
(Mateo et al., 1997; Pendleton et al., 2012). Thus, there is increasing interest to include
mangroves, tidal marshes and seagrass meadows in national greenhouse gas
inventories as well as carbon financing and offset schemes (Hejnowicz et al., 2015;
Sutton-Grier and Moore, 2016; Nellemann et al., 2009; Johannessen and Macdonald,
2016). However, scarcity of data and high within and among habitat variability in carbon
storage capacity create challenges for scaling-up carbon estimates and incorporating
blue carbon into climate policies (Lavery et al., 2013; Oreska et al., 2017a). Here, we
quantified variation in Zostera marina sedimentary organic carbon (OC) stocks and
identified local drivers of variability on the northwest coast of North America, a relatively
data deficient region for seagrass blue carbon estimates. Further, we review these
results in the context of emerging global trends to illustrate variability across different
spatial scales.
Carbon Sequestration and Storage in Seagrass Meadows
Seagrass meadows have potential for globally significant, yet variable, rates of
carbon sequestration and storage (Mcleod et al., 2011; Fourqurean et al., 2012;
Macreadie et al., 2014). Seagrasses represent some of the most productive vegetated
communities on the planet, with above and belowground biomass production averaging
2
3.8 and 1.21 g dry weight m-2 day-1 (Duarte and Chiscano, 1999). Approximately 15.9%
of this production is buried in seagrass sediments, while the remainder is decomposed
(50.3%), exported (24.3%) or consumed by herbivores (18.6%) (Duarte and Cebrian,
1996; Duarte and Krause-Jensen, 2017). Seagrass canopies also facilitate particle
capture and settlement from the water column, which can further enhance sedimentary
OC stocks (Duarte et al., 2013; Macreadie et al., 2014). The carbon in seagrass
meadow sediments can therefore be autochthonous - produced within a given meadow -
or allochthonous - produced outside the meadow (Kennedy et al., 2010; Miyajima et al.,
2015; Oreska et al., 2017b). The origin of OC has implications for remineralization rates,
as terrestrial material and seagrass tissues are more refractory, while macroalgae and
seston are more labile and vulnerable to microbial breakdown (Mazarrasa et al., 2017a;
Trevathan-Tackett et al., 2017a). Seagrass meadow sediments are generally anoxic
below the first few millimeters, resulting in low microbial activity and limited breakdown of
organic matter. However, disturbances such as bioturbation by infaunal organisms can
increase the depth of the oxic zone and subsequently enhance remineralization rates
(Martinetto et al., 2016; Trevathan-Tackett et al., 2017b). The combination of high
primary productivity, the ability to capture and bury allochthonous OC, and generally
anoxic sediments yields high potential for seagrass meadows to act as significant blue
carbon sinks. While most seagrass systems share the aforementioned characteristics to
a certain extent, their specific biological, chemical and physical environments can vary
substantially, thereby creating variability in blue carbon storage potential.
Factors Influencing Seagrass Blue Carbon Potential
To improve assessments of the OC storage potential of seagrass meadows, a
thorough understanding of the factors influencing the magnitude and variability of carbon
stocks and accumulation rates is required (Dahl et al., 2016a; Gullström et al., 2017;
Lavery et al., 2013). Large differences in OC stocks and accumulation rates among
seagrass habitats have been identified (Lavery et al. 2013; Serrano et al. 2014).
Biological factors influencing seagrass blue carbon potential include plant size and
species composition (Rozaimi et al., 2013; Gillis et al., 2017), seagrass structural
complexity (Jankowska et al., 2016) and carbon origin (Mazarrasa et al., 2017a).
Elevated OC in seagrass sediments is often associated with higher proportions of fine
sediments, higher porosity, lower bulk density and higher specific surface area (Rohr et

3
al., 2016; Dahl et al., 2016a; Gullström et al., 2017; Miyajima et al., 2017). At the
landscape level, OC stocks are often greater in the meadow interior relative to edges
(Oreska et al. 2017a; Ricart et al. 2015), and greater in large continuous meadows,
relative to smaller, patchy ones (Gullström et al., 2017; Ricart et al., 2017). Physical
factors such as water depth, turbidity levels, wave height and wave exposure have been
shown to influence OC stocks, with higher OC content at lower wave heights and
exposures, higher turbidities, and shallower depths (Serrano et al., 2014; Samper-
Villarreal et al., 2016; Mazarrasa et al., 2017b). While small scale or low intensity
disturbances may not influence OC stocks (Macreadie et al., 2014; Dahl et al., 2016b),
clam harvesting (Barañano et al., 2017) and shading (Trevathan-Tackett et al., 2018)
can result in at least a 50% reduction in sedimentary carbon content. Furthermore, the
relationships between environmental factors and OC stocks may not hold true in all
seagrass systems (e.g. Serrano et al., 2016), and the relative influence of factors can
vary regionally (Lavery et al., 2013; Samper-Villarreal et al., 2016). Determining which
physical, chemical and biological factors are most important at different scales is
challenging, but crucial to fully understanding seagrass blue carbon budgets.
Objectives and Hypotheses
The objectives of this study were to: (1) quantify within and among meadow
variability in OC stocks in OC accumulation rates in temperate Zostera marina
meadows, (2) explore local drivers of variability in OC stocks, (3) examine the sources of
OC in Z. marina associated sediments and (4) place our values in the context of
seagrass meadows globally to examine regional and global variability. We hypothesized
that OC stocks and accumulation rates would vary among meadows, given known
differences in characteristics. Further, we expected interior OC stocks to be enhanced
relative to meadow edges and adjacent bare sediment (Oreska et al., 2017a; Ricart et
al., 2015). Among meadows, we predicted higher OC stocks would be associated with
reduced water motion, greater proportions of fine sediments, and higher seagrass
structural complexity. Fine sediments allow for more adsorption of organic particles and
limit oxygen exchange, while a more complex seagrass canopy should result in more
efficient particle capture and erosion reduction. Similarly, reduced water motion would
allow more time for particle deposition and result in less resuspension and erosion.

4
Methods
Study Area
Sediment cores were collected from eelgrass (Zostera marina) meadows on the
Central Coast of British Columbia, Canada, a relatively data deficient region for seagrass
blue carbon estimates (CEC, 2013). The Central Coast is a geographically complex
coastline, with a variety of nearshore habitats including expansive eelgrass meadows of
varying size and attributes (Hessing-Lewis et al. 2017; Table A.1; Table A.2). The
relatively undisturbed nature of this region and the variability in meadow characteristics
provides an opportune setting for quantifying baselines in eelgrass carbon storage and
examining within and among meadow variability. The six meadows sampled - Pruth Bay
(PB), Choked Pass (CP), Triquet Bay (TB), McMullins North (MC), Goose Southwest
(GO) and Koeye Estuary (KY) - represent the wide spectrum of environments within
which Z. marina can grow, from sheltered, soft sediment estuarine systems such as
Pruth Bay, to exposed, outer coasts with sand or shell-hash dominated sediments such
as Choked Pass (Figure 1; Figure A.1). The meadows sampled also range widely in size
and shape, from 22,778 m2 (McMullins North) to 354,580 m2 (Choked Pass) (Figure A.1).
Experimental Design and Sample Collection
To examine among and within-meadow variability in sediment carbon content,
we collected nine cores (7 cm diameter, ~30cm depth) from six Z. marina sites (Figure
1). Three cores were taken from three different ‘positions’ within each site – along the
meadow edge (Edge 1-3), in the meadow interior (Interior 4-6) and in adjacent bare
sediment (Reference 7-9) (Figure A.1). Reference cores were taken approximately five
meters beyond the current edge of the meadow. This distance was selected across sites
as the habitat often changed quickly at this distance beyond the edge of the seagrass
meadow, e.g. turned to bedrock, or transitioned into a kelp forest (dominant canopy
species including Macrocystis pyrifera or Nereocystis leutkeana). The interior and edge
cores were associated with pre-established sampling transects as part of a long-term
seagrass monitoring program conducted by the Hakai Institute. We also obtained one
long core (10.2 cm diameter, ~1m in length) from each meadow at one interior transect
(Interior 5) for geochronological analyses (210Pb dating).

5
SCUBA divers collected cores manually at high tides, using a small
sledgehammer to pound PVC (long cores) or polycarbonate (short cores) tubing into the
sediments. This method can cause compaction as sediments shift during the coring
process, thus divers measured compaction once the core was fully inserted, or in some
cases up to 5 times during core insertion to calculate changes with depth. Compaction
was calculated as the distance (cm) from the top of the core to the sediment surface
outside of the core, minus the distance (cm) from top of core to the sediment surface
inside the core, divided by the sample depth (cm of compaction/cm sample depth).
Compaction values were on average 17.46 ± 13.32 SD %. Due to time constraints
associated with remote sites and SCUBA diving, we could not measure compaction at
every centimeter within each core and thus could not apply a linear length correction
(Morton & White, 1997), though we do acknowledge compaction as a source of error in
our measurements.
Within 24 hours of collection, cores were sliced into subsections using a custom-
fabricated extruding device and pistons. Short cores were sampled in 5cm increments,
though the deepest subsection was often shorter than 5cm. Sampling intervals for the
long cores varied with depth: 6cm section for the top section (we considered the top 6cm
the ‘mixed layer’), 2cm sections from 6 to 20cm deep, and 5cm sections >20cm deep).
Once extruded, each subsection was thoroughly homogenized and a 30cc subsample
was taken for measurements of dry bulk density, carbon content, stable isotopes and 210Pb. The remainder of the subsection was used for grain size analysis or saved.
Sediment Characterization
Chemical Analyses. The 30cc subsamples were freeze dried for approximately
one week, or until fully dry. A dry weight was obtained before each sample was ground
into a fine powder using a grinding mill. Any non-living material (e.g. shell pieces, wood,
rocks) was left in the sample, as these materials are part of the sedimentary carbon
pool. However, all visible living biomass (e.g. shoots, roots or rhizomes, macroalgae)
was removed, as it represents the biomass carbon pool. Total percent carbon (%TC)
and nitrogen (%TN) were determined using an Elemental Analyzer. A UIC Carbon
Dioxide Coulometer was used to determine the percent inorganic carbon (%IC). Both
elemental and coulometric analyses were conducted in the Department of Earth, Ocean
and Atmospheric Sciences at the University of British Columbia, Vancouver, BC,

6
Canada. Percent organic carbon (%OC) was calculated by subtracting %IC from %TC
for each sample.
Carbon (δ13C) and nitrogen (δ15N) stable isotope values were determined using
an Isoprime Isotope Ratio Mass Spectrometer at the Stable Isotope Facility in the
Department of Forest and Conservation Sciences (for δ13C) and the Department of
Earth, Ocean and Atmospheric Sciences (for δ15N) at the University of British Columbia
in Vancouver, BC, Canada. All isotopic ratios are expressed relative to Vienna Pee Dee
Belemnite (VPBD) for carbon and atmospheric air for nitrogen in per mil notation (‰).
Samples were acidified using sulfurous acid (H2SO3) to remove inorganic carbon prior to
mass spectrometry. While acidification has the potential to cause analytical errors in
samples with low organic matter, we found high inorganic carbon content within our
samples (an average of 1.86 ± 2.37 SD % and maximum value of 7.95% of samples
analyzed for isotopes), and mechanical removal of calcified structures was unfeasible
(Schlacher & Connolly, 2014).
Geochronological analyses (210Pb) were conducted by MyCore Scientific Inc. in
Dunrobin, Ontario, Canada. An alpha spectrometer was used to measure 210Po, the
granddaughter radionuclide of 210Pb, assuming radioactive equilibrium between the two
radionuclides. The activity of 210Po was determined from the ratio of counts of 209Po to 210Po and the known amounts of 209Po in each sample. Excess 210Pb was determined by
subtracting background, or supported, 210Pb from total 210Pb activity at each depth
interval.
Carbon Parameter Calculations. For each depth subsection and core, we
calculated various carbon parameters. Dry bulk density (g cm-3) was determined by
dividing dry weights of sediment subsamples by the known sample volume (30 cm3). OC
density (g OC cm-3) for each subsection was calculated by multiplying the OC fraction
(%OC/100) by the dry bulk density (g cm-3). OC mass (g OC m-2) was calculated by
multiplying the OC density (g OC cm-3) by the depth of the subsection (cm). OC stocks
were calculated by summing the carbon mass (g OC m-2) in each subsection to a
particular depth as outlined by Howard et al. (2014). From the 210Pb data, excess 210Pb
profiles were created for the depth of each long core, and the age of each sediment
layer was estimated using the Constant Rate of Supply (CRS) model, which allows
sedimentation rates to vary with depth (Appleby & Oldfield, 1978; Carey et al. 2017).

7
Sediment accumulation rates (g cm-2 year-1) were estimated at each depth interval,
based on the sediment dry bulk densities. OC accumulation rates (g OC m-2 year-1) were
calculated by multiplying the OC fractions for each subsection by the corresponding
sediment accumulation rates. For comparison, carbon accumulation rates were also
calculated using the Constant Initial Concentration (CIC) model, which assumes a
constant rate of sedimentation over time, as outlined in Carey et al. (2017). The known
decay coefficient for 210Pb (-0.03114) was divided by the slope of the regression of
ln(210Pb) versus depth, excluding the surface mixed layer, to obtain an accretion rate (cm
year-1). The accretion rate was multiplied by the average carbon density (g OC cm-3)
over the corresponding depth and converted to the appropriate units (cm2 scaled to to
m2), to estimate OC accumulation rates for each core (g OC m-2 year-1).
Grain Size Analyses. Sediment grain size analyses were conducted using an
electronic sieve shaker. For all short cores, the 0-5 and 15-20 cm sections were
analyzed, as well as the 0-5, 15-20, 35-40 and one deeper subsection, if applicable,
from the six long cores. Samples were dried at 60°C for 24-48 hours and each sample
was allowed to shake for 10 minutes. Dry weights were obtained both before and after
shaking. Sieve sizes of 4mm, 2mm, 1mm, 500μm, 250μm, 125μm and 63μm were used,
and the amount of sediment remaining in each category was weighed to the nearest
0.01g. Any particles that passed through the 63μm sieve were included in a <63μm
category (the ‘mud’ or fine sediments fraction). Based on the weight of each size fraction
and the total sample weight, the percentage of particles in each size class was
calculated. We did not perform a hydrogen peroxide digestion prior to grain size
analyses, however, the % organic matter was very low in our sediments and would
influence the mass of the % fines fraction for all samples equally, if at all.
Seagrass Meadow Characterization
We characterized environmental attributes (water depth, water motion) and
seagrass parameters (shoot density, canopy height, above and below-ground biomass)
associated with each meadow. Water depth relative to chart datum was calculated by
subtracting the tidal height (m) from the recorded water depth (m) at the time the survey
was conducted. Relative water motion was characterized at the edge and interior of
each meadow using the relative dissolution rate of Plaster of Paris chalk blocks; this
metric integrates the effects of both tidal currents and waves (Potouroglou et al., 2017).
8
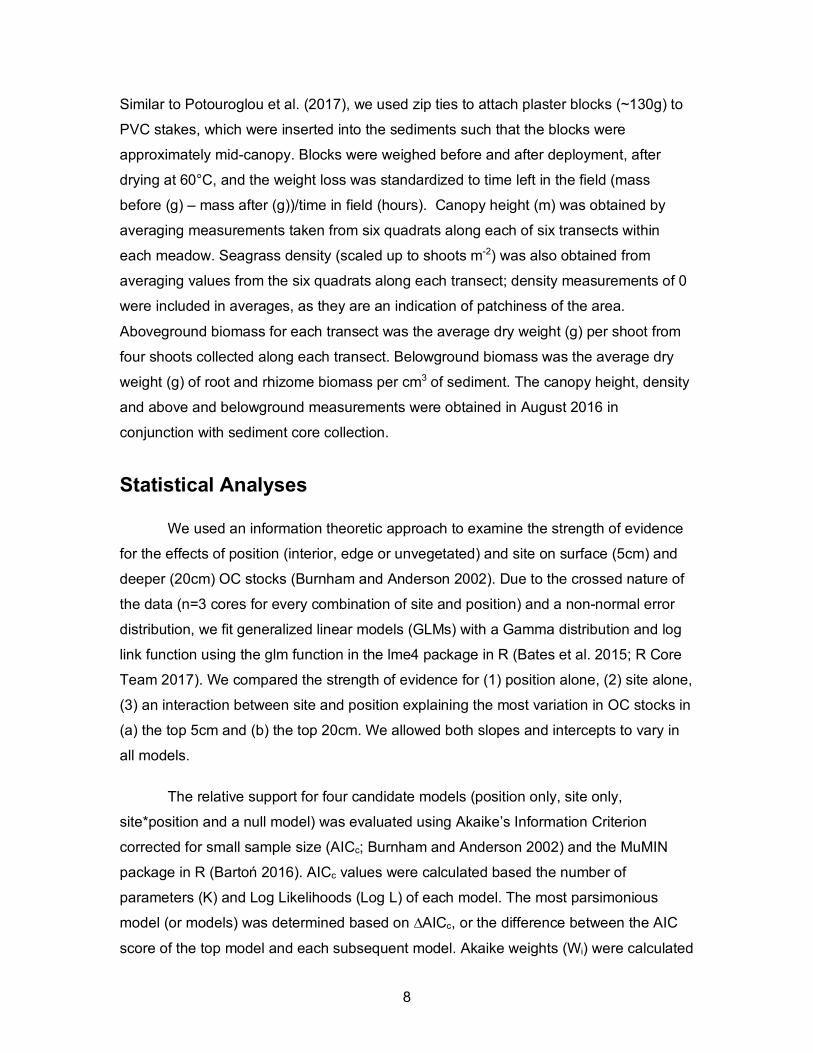
Similar to Potouroglou et al. (2017), we used zip ties to attach plaster blocks (~130g) to
PVC stakes, which were inserted into the sediments such that the blocks were
approximately mid-canopy. Blocks were weighed before and after deployment, after
drying at 60°C, and the weight loss was standardized to time left in the field (mass
before (g) – mass after (g))/time in field (hours). Canopy height (m) was obtained by
averaging measurements taken from six quadrats along each of six transects within
each meadow. Seagrass density (scaled up to shoots m-2) was also obtained from
averaging values from the six quadrats along each transect; density measurements of 0
were included in averages, as they are an indication of patchiness of the area.
Aboveground biomass for each transect was the average dry weight (g) per shoot from
four shoots collected along each transect. Belowground biomass was the average dry
weight (g) of root and rhizome biomass per cm3 of sediment. The canopy height, density
and above and belowground measurements were obtained in August 2016 in
conjunction with sediment core collection.
Statistical Analyses
We used an information theoretic approach to examine the strength of evidence
for the effects of position (interior, edge or unvegetated) and site on surface (5cm) and
deeper (20cm) OC stocks (Burnham and Anderson 2002). Due to the crossed nature of
the data (n=3 cores for every combination of site and position) and a non-normal error
distribution, we fit generalized linear models (GLMs) with a Gamma distribution and log
link function using the glm function in the lme4 package in R (Bates et al. 2015; R Core
Team 2017). We compared the strength of evidence for (1) position alone, (2) site alone,
(3) an interaction between site and position explaining the most variation in OC stocks in
(a) the top 5cm and (b) the top 20cm. We allowed both slopes and intercepts to vary in
all models.
The relative support for four candidate models (position only, site only,
site*position and a null model) was evaluated using Akaike’s Information Criterion
corrected for small sample size (AICc; Burnham and Anderson 2002) and the MuMIN
package in R (Bartoń 2016). AICc values were calculated based the number of
parameters (K) and Log Likelihoods (Log L) of each model. The most parsimonious
model (or models) was determined based on ∆AICc, or the difference between the AIC
score of the top model and each subsequent model. Akaike weights (Wi) were calculated

9
as the relative likelihood of each model (exp (-0.5 ´ ΔAICc)) divided by the sum of the
relative likelihoods across all models. Adjusted R-squared values (adjR2) were
calculated based on the sample size (n) and the number of parameters in the model (K).
We also examined the strength of evidence for the relative effects of
environmental factors on surface (5cm) OC stocks. Since we had a sample size of 36
cores (n=6 from each of the 6 meadows, interior and edge cores only), we narrowed
down our suite of potential factors to three, based on previous literature and our
understanding of the system. The three factors selected were % fine sediments
(particles < 63µm), water motion and seagrass complexity. These factors represent
major sediment, physical and eelgrass characteristics at each site and have been shown
to be important in other seagrass systems (e.g. Dahl et al. 2016a; Samper-Villarreal et
al. 2016).
Due to the hierarchical nature of the data (cores nested within sites) and a non-
normal error distribution, we fit generalized linear mixed-effects models (GLMMs) with a
Gamma distribution and log link function using the glmer function in the lme4 package in
R (Bates et al. 2015; R Core Team 2017). Water motion, seagrass complexity and %
fine sediments were included as continuous fixed effects, and site was included as a
random effect in all models. We tested the explanatory power of these factors on OC
stocks in the top 5cm of sediment (g OC/m2). Surface OC stocks were selected as the
response because grain size data was available for all top 5cm sections (but not all
deeper sections), and additionally, 20cm represents a much longer time period (as much
as 74 years), over which current-day seagrass characteristics and water motion are
unlikely to be good predictors.
We checked for collinearity among model factors using Pearson correlation
coefficients and Variance Inflation Factors (VIF; Zuur et al. 2010, 2013). VIFs account for
linear dependence among three or more variables. Correlation coefficients > 0.6 and VIF
scores > 3.5 indicate variables with a high degree of collinearity that may be problematic
if included in the same model (Zurr et al. 2009). Correlation coefficients in this analysis
ranged from 0.20 to 0.40, and all VIF scores ranged from 1.09 to 1.25, thus variables
were not collinear. To facilitate direct comparison of parameter coefficients among
continuous variables on different scales we standardized all continuous variables by
subtracting their mean and dividing by two times the standard deviation (Gelman, 2008).

10
We evaluated relative support for models with all possible combinations of fixed
factors using Akaike’s Information Criterion corrected for small sample size (AICc;
Burnham and Anderson 2004) and the MuMIN package in R (Bartoń 2016). We had no
reason to think that any combination of factors in the model was not biologically realistic
and thus included all subsets of the global model, for a total of 8 candidate models
(Table 3). As with our first model set, the most parsimonious model (or models)
explaining variation in surface carbon stocks was determined based on ∆AICc.

11
Results
Carbon Content, Stocks and Accumulation Rates
Carbon Content. Combining all sections from all cores at all sites (n=399), the
average %OC was 0.45 (± 0.38 SD) and ranged from 0 - 2.98%. High OC values can be
attributed to deposits of woody debris (Table A.2). The average %IC (carbonate) was
1.58 ± 2.10 SD % and ranged from 0 to 7.95%. High carbonate values can be attributed
to bivalve shells within the sediments (Table A.2). Site averages (± standard deviations)
ranged from 0.15 ± 0.02 % OC in Choked Pass to 0.71 ± 0.37 % in McMullins North. For
inorganic carbon, site averages (± standard deviations) ranged from 0.18 (± 0.24 SD) in
Pruth Bay to 4.54 (± 2.68 SD) in Triquet Bay (Table A.2). In some sites (e.g. Pruth Bay,
Triquet Bay), most of the total carbon was comprised of organic carbon, while in other
most of the carbon was inorganic (e.g. Choked Pass, Goose SW). Carbon content
varied with depth down the core, but irregularities in depth trends were largely driven by
spikes in either woody debris or carbonate material (Figure A.3).
Carbon Stocks. Organic carbon stocks exhibited substantial variability among
sites on the Central Coast of British Columbia. Amongst all cores (n=60), surface (5cm)
sediment OC stocks ranged from a minimum value of 0 g OC m-2 in Choked Pass to a
maximum of 1089 g OC m-2 at McMullins North. Within meadows, there was the greatest
strength of evidence that an interaction between site and position best explained these
patterns in 5cm OC stocks (Table 1). That is, the effect of position (interior, edge or
unvegetated) varied among sites (Figure A.2.) OC stocks were highest in the meadow
interior, followed by the meadow edge and unvegetated bare sediments at four of six
sites (Figure A.2). Similarly, 20cm OC stocks varied widely among sites, ranging from
185 g OC m-2 in Choked Pass to 5147 g OC m-2 at McMullins North (Figure 2). There
was the greatest strength of evidence for site alone explaining the most variation in
20cm OC stocks, with a ∆AICc of 25.11 relative to the next best model (site*position) and
a Wi of 1 (Table 1). In other words, there was greater variation among sites than among
positions within sites.
Carbon Accumulation Rates. There was sufficient excess 210Pb in the
sediments to obtain estimates of sediment ages and accumulation rates at all sites
except Goose SW (Table 2). However, due to low levels of organic matter in the
12
sediments, there were large margins of error around the estimates. OC accumulation
rates (± SD) ranged from 12.6 (± 12.5) g OC m-2 year-1 in Choked Pass to 50.5 (± 29.1) g
OC m-2 year-1 in McMullins North using the Constant Rate of Supply (CRS) Model and
9.0 g OC m-2 year-1 in Choked Pass to 39.8 g OC m-2 year-1 in Koeye using the Constant
Initial Concentration (CIC) Model. The age of the top 20cm of sediment ranged from 21
years of accumulation in the Koeye Estuary to 74 years at McMullins North, with an
average of 54.2 ± 20.1 SD years of accumulation (Table 2).
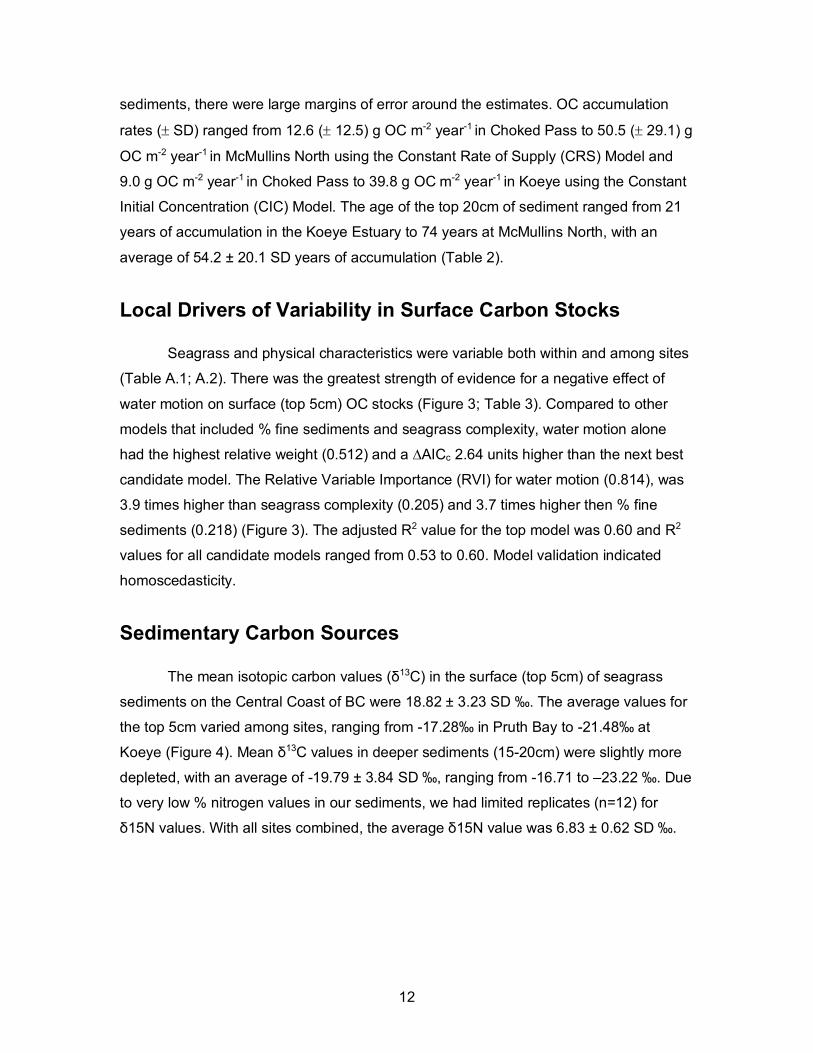
Local Drivers of Variability in Surface Carbon Stocks
Seagrass and physical characteristics were variable both within and among sites
(Table A.1; A.2). There was the greatest strength of evidence for a negative effect of
water motion on surface (top 5cm) OC stocks (Figure 3; Table 3). Compared to other
models that included % fine sediments and seagrass complexity, water motion alone
had the highest relative weight (0.512) and a ∆AICc 2.64 units higher than the next best
candidate model. The Relative Variable Importance (RVI) for water motion (0.814), was
3.9 times higher than seagrass complexity (0.205) and 3.7 times higher then % fine
sediments (0.218) (Figure 3). The adjusted R2 value for the top model was 0.60 and R2
values for all candidate models ranged from 0.53 to 0.60. Model validation indicated
homoscedasticity.
Sedimentary Carbon Sources
The mean isotopic carbon values (δ13C) in the surface (top 5cm) of seagrass
sediments on the Central Coast of BC were 18.82 ± 3.23 SD ‰. The average values for
the top 5cm varied among sites, ranging from -17.28‰ in Pruth Bay to -21.48‰ at
Koeye (Figure 4). Mean δ13C values in deeper sediments (15-20cm) were slightly more
depleted, with an average of -19.79 ± 3.84 SD ‰, ranging from -16.71 to –23.22 ‰. Due
to very low % nitrogen values in our sediments, we had limited replicates (n=12) for
δ15N values. With all sites combined, the average δ15N value was 6.83 ± 0.62 SD ‰.

13
Discussion
High Spatial Variability in OC Stocks
Sedimentary OC stocks in eelgrass meadows and adjacent bare sediments on
the Central Coast of British Columbia exhibited substantial local variability along a small
stretch of coastline spanning approximately 5° of latitude. Our results suggest that for
surface OC stocks, the influence of position within a meadow varies among sites. That
is, in three of six meadows, we observed the expected trend of highest OC stocks in the
meadow interior, followed by the edge and adjacent bare sediments (Ricart et al., 2015;
Oreska et al., 2017a). However, in the other three meadows, either the unvegetated or
edge OC stocks were greatest. The latter case suggests that factors influencing OC
stocks (e.g. seagrass density, water motion, grain size) do not always differ between the
interior and edge of a given meadow, and thus OC stocks can be relatively
homogenous. Along these lines, the effect of site was much greater than position within
the meadow for 20cm OC stocks (Table 1), suggesting that over longer time periods,
larger-scale landscape factors are more important than smaller-scale, meadow-level
factors, namely position within the meadow.
Water Motion Best Explains Surface OC Stock Variation
Variation in surface OC stocks was best explained by a negative relationship with
water motion, relative to other key biological and sedimentary factors (% fine sediments
and seagrass complexity). Specifically, meadows with lower water motion exhibited
higher sedimentary OC stocks. These results agree with previous work examining the
role of hydrodynamics on seagrass carbon storage potential, where greater sedimentary
carbon content was associated with lower wave heights (Samper-Villarreal et al., 2016)
and lower wave exposure (Mazarrasa et al., 2017b). Aside from these studies, few
others have examined the role of hydrodynamic factors within the context of blue carbon;
however, the role of seagrasses in influencing fluid dynamics and particle deposition has
been well studied (Koch et al., 2006). Eelgrass canopies can reduce near-bottom mean
velocities by 70 to 90% and wave heights by 45 to 70% compared to an adjacent
unvegetated habitats (Hansen and Reidenbach, 2012). This reduction in water velocity
allows more time for deposition of fine sediments with high organic content. In addition to
14
increasing deposition, seagrasses may also significantly buffer against sediment
resuspension, as much as three-fold compared to unvegetated bottoms (Gacia &
Duarte, 2001). This combination of enhanced deposition and reduced resuspension
increases potential for OC sequestration and storage.
The sites sampled here varied widely in their physical attributes. Choked Pass is
a highly marine-influenced meadow with strong current velocities channelled through
rocky, exposed islets. The Koeye estuary is a narrow river system with large tidal
exchanges that create high currents through the meadow. Both of these sites with high
water motion had relatively low carbon stocks. In contrast, McMullins North and Pruth
Bay are enclosed embayments that experience less water motion and exhibited higher
surface carbon stocks (Figure 2). Thus, our results suggest that local oceanographic
conditions, driven by geomorphology, currents and exposure, influence the water motion
of a meadow, and play a more important role in carbon sequestration than site-level
seagrass canopy attributes or sediment properties. Given that seagrass canopies are
generally thought are to reduce water motion, we expected seagrass canopy complexity
to potentially enhance sediment carbon stocks. Similarly, multiple studies have found
sediment characteristics to be strongly correlated with seagrass sediment carbon
content (Dahl et al., 2016a; Miyajima et al., 2017; Serrano et al., 2015). Instead, water
motion alone dominated, overriding local variation in seagrass and sediment
characteristics, perhaps due to the wide range of water motion experienced among sites,
and particularly high current velocities in some meadows. Differences in water motion
explain much of the variability at the regional level of this study and can inform
management and policy at this scale. However, scaling up to global trends and
international carbon sequestration policy requires examining our trends in light of
emerging values from seagrass habitats spanning the globe.
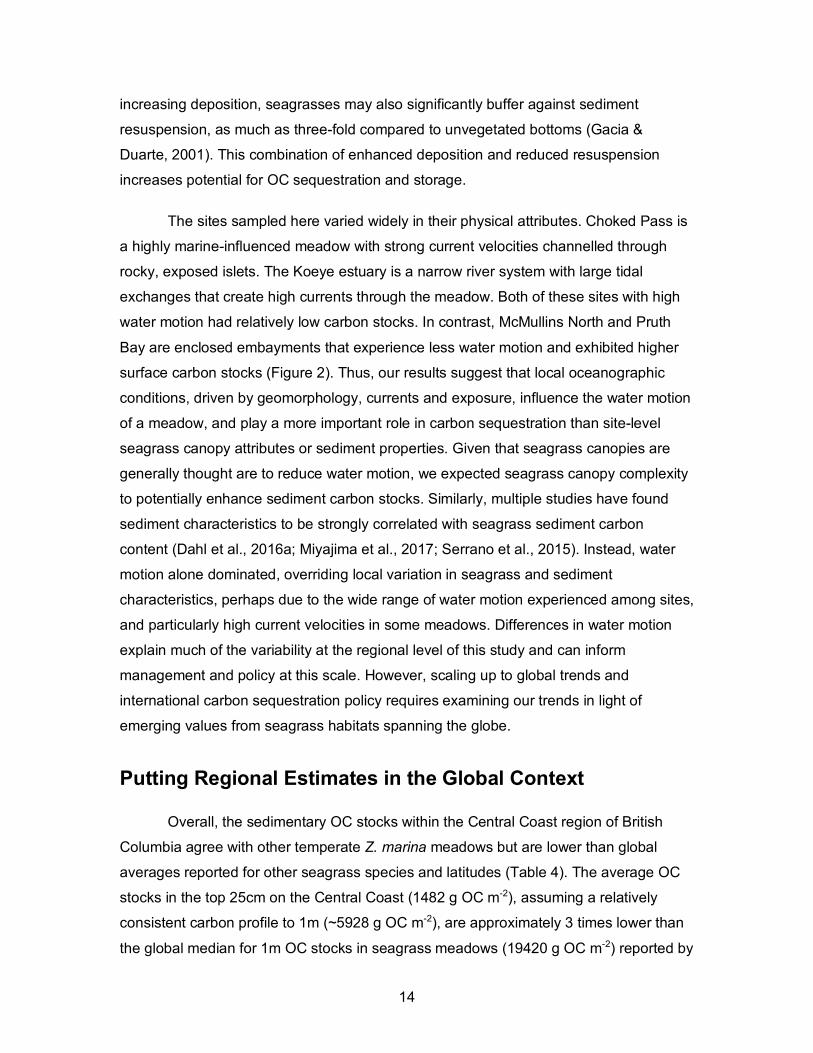
Putting Regional Estimates in the Global Context
Overall, the sedimentary OC stocks within the Central Coast region of British
Columbia agree with other temperate Z. marina meadows but are lower than global
averages reported for other seagrass species and latitudes (Table 4). The average OC
stocks in the top 25cm on the Central Coast (1482 g OC m-2), assuming a relatively
consistent carbon profile to 1m (~5928 g OC m-2), are approximately 3 times lower than
the global median for 1m OC stocks in seagrass meadows (19420 g OC m-2) reported by
15
Fourqurean et al. (2012). Likewise, the average %OC reported here (0.45%) is much
lower than the global median of 1.4% and average of 2.5% (Fourqurean et al., 2012).
Thus, our findings reconfirm the emerging notion that seagrass meadow carbon stocks
can be highly variable and patchy, even at the meadow and regional scale. Due to this
regional variability, observed in our study and others, the global estimates for seagrass
carbon stocks are likely to be overestimates of seagrass blue carbon storage potential
(Johannessen and Macdonald, 2016).
Similar to OC stocks, our OC accumulation rates are within the range of those
reported from other Z. marina meadows, but lower than reported global averages for
seagrasses. OC accumulation rates in this study ranged from 12.6 to 50.5 g OC m-2
year-1. These estimates are similar to those from Z. marina sites near Japan (3.13 –
10.14 g OC m-2 year-1; Miyajima et al., 2015) and in Virginia (36.68 g OC m-2 year-1;
Greiner et al. 2013). Moreover, our values are slightly higher than those reported by
Jankowska et al. (2016) in Baltic Sea eelgrass meadows (0.84 to 3.85 g OC m-2 year-1).
However, the accumulation rates found here are at least 3 times lower than the global
average reported for seagrass (138 g OC m-2 year-1) and at the low end of the range
reported for all seagrass species (45-190 g OC m-2 year-1) (McLeod et al., 2011).
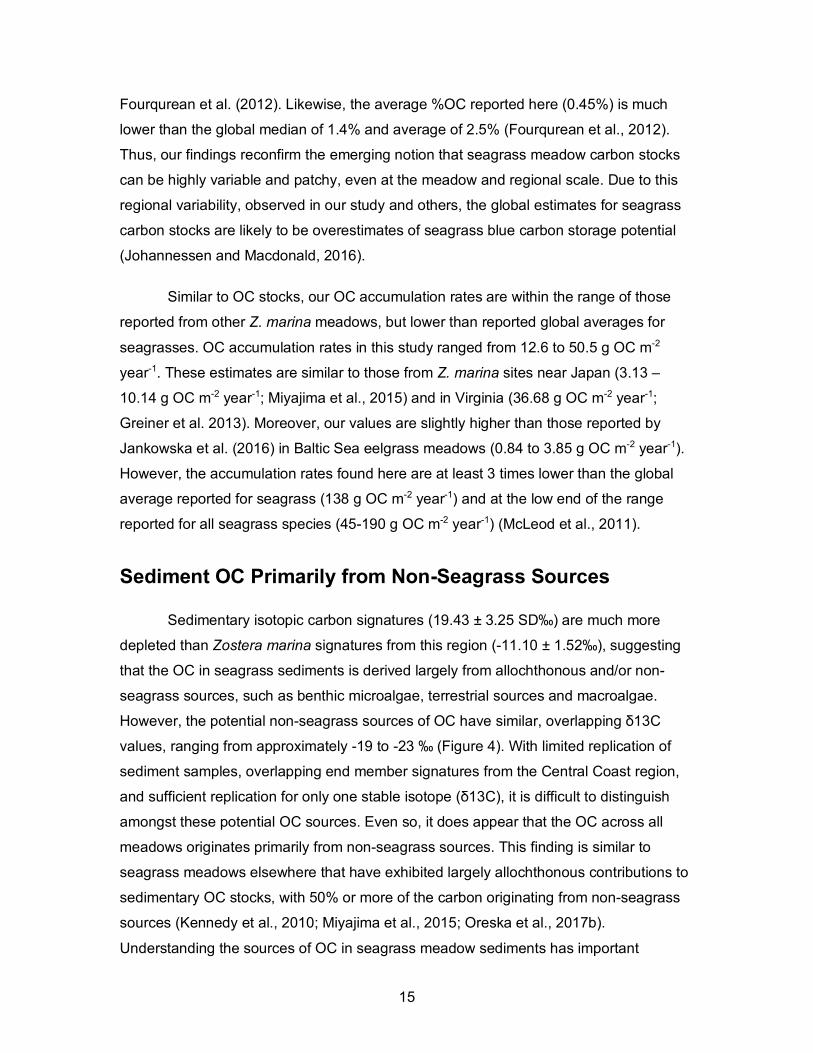
Sediment OC Primarily from Non-Seagrass Sources
Sedimentary isotopic carbon signatures (19.43 ± 3.25 SD‰) are much more
depleted than Zostera marina signatures from this region (-11.10 ± 1.52‰), suggesting
that the OC in seagrass sediments is derived largely from allochthonous and/or non-
seagrass sources, such as benthic microalgae, terrestrial sources and macroalgae.
However, the potential non-seagrass sources of OC have similar, overlapping δ13C
values, ranging from approximately -19 to -23 ‰ (Figure 4). With limited replication of
sediment samples, overlapping end member signatures from the Central Coast region,
and sufficient replication for only one stable isotope (δ13C), it is difficult to distinguish
amongst these potential OC sources. Even so, it does appear that the OC across all
meadows originates primarily from non-seagrass sources. This finding is similar to
seagrass meadows elsewhere that have exhibited largely allochthonous contributions to
sedimentary OC stocks, with 50% or more of the carbon originating from non-seagrass
sources (Kennedy et al., 2010; Miyajima et al., 2015; Oreska et al., 2017b).
Understanding the sources of OC in seagrass meadow sediments has important

16
implications for the long-term persistence OC stocks, as sources that are more refractory
(seagrass, terrestrial) are likely to be more resistant to microbial degradation and persist
for longer than labile sources such as benthic microalgae and macroalgae (Trevathan-
Tackett et al., 2017a; Mazarrasa et al. 2017a). Additionally, isotopic data can provide
important insights into carbon flow and connectivity amongst nearshore ecosystems,
adding credence to the notion of a broad, ecosystem-based approach to coastal
management.
Additional Considerations for Nearshore Carbon Budgets
While water motion clearly plays an important role in determining sedimentary
OC stocks in this region, an array of other factors may also affect OC stocks, as well as
the persistence of carbon in the sediments. Recent literature has highlighted the
importance of molecular composition and recalcitrance of OC sources (litter quality),
sediment mineralogy and microbial activity and diversity in determining the quantity and
quality of carbon sequestered in seagrass meadows (Belshe et al., 2017; Trevathan-
Tackett et al. 2017a,b). Furthermore, it is important to consider and quantify the amount
of seagrass biomass exported out of the meadow, consumed by herbivores and/or
decomposed within the system (Duarte and Cebrián, 1996). The fate of exported
seagrass biomass is often unknown and thus not accounted for in blue carbon studies. If
biomass ends up in the deep sea, it could potentially be considered ‘sequestered’; in
contrast, if seagrass biomass is washed ashore, it is more likely to be re-mineralized and
returned to the atmosphere as CO2 (Duarte and Krause-Jensen, 2017). Benthic
disturbance is also an important factor that can influence OC stocks (Barañano et al.,
2017; Trevathan-Tackett et al. 2018), and may vary substantially among sites. On the
Central Coast of British Columbia, bioturbation by sea otters digging for prey, infaunal
communities, dredging, log boom shading, increasing sedimentation and erosion should
be investigated further to determine their impacts on the carbon sequestration and
storage capacity of nearshore systems.
Implications for Blue Carbon Policy
The low OC stocks and high variability found in our study are not uncommon to
other Zostera marina seagrass meadows (e.g. Rohr et al., 2016; Jankowska et al., 2016,

17
Spooner, 2015). These low and variable values, along with a lack of data on seagrass
meadow extent, present challenges for including them in national and international blue
carbon policies (Lavery et al., 2013; Hejnowicz et al., 2015). No climate change policy
mechanisms are currently in place for seagrass meadows, or other blue carbon habitats,
in British Columbia or Canada, though there is growing interest in markets nationally and
internationally (Hejnowicz et al., 2015; Sutton-Grier and Moore, 2016). Further, there is
potential to consider blue carbon benefits in existing policy frameworks, such as marine
protected area creation (Howard et al., 2017). In British Columbia, this could include
targeting seagrass for their blue carbon contributions within current planning processes
such as the Marine Planning Partnership (MaPP) and the Northern Shelf Bioregion MPA
Initiative. Our results can help contribute to incorporating blue carbon into coastal
planning and management by providing blue carbon estimates for temperate eelgrass
meadows where few data exist. Here, we present a range of OC stocks over various
sediment depths, and OC accumulation rates for Z. marina, including metrics of
uncertainty and variability within and among meadows. We also investigated factors that
may indicate high potential for seagrass carbon sequestration and storage. Our results
suggest that water motion, or other metrics of the hydrodynamic environment, should be
considered when determining potential ‘hot spots’ for OC stocks in temperate regions.
While the blue carbon potential of temperate seagrass meadows may be reduced
compared to tropical species such as those in the Posidonia genus, their capacity to
sequester and store carbon at a regional scale should be considered in conjunction with
other valuable ecosystem services they provide.

18
Conclusions
Here, we characterized the blue carbon potential of six Zostera marina meadows
along a relatively undisturbed stretch of coastline in British Columbia, Canada – a
previously data deficient region for seagrass blue carbon estimates. Sediment OC
stocks exhibited high natural variability, with stocks in the top 20cm ranging from 185 g
OC m-2 to 5147 g OC m-2. In addition to OC stocks, we quantified OC accumulation
rates, which also varied (12.6 – 50.5 g OC m-2 year -1) amongst meadows in relatively
close proximity. Both OC stocks and accumulation rates were similar to values reported
from other Zostera marina meadows but lower than global averages for seagrasses.
Variation in surface OC stocks was best explained by differences in water motion, where
meadows with lower water motion exhibited higher OC stocks. Our results suggest that
larger-scale landscape factors (e.g. water motion) have a greater influence on OC stocks
than finer-scale meadow characteristics (e.g. seagrass canopy complexity and % fine
sediments). These findings highlight substantial variability in seagrass carbon stocks at
local, regional and global scales. The data herein can help contribute to incorporating
blue carbon into coastal planning and management by providing estimates for temperate
eelgrass meadows where few data exist. Further, our findings suggest that water motion
should be considered when determining potential ‘hot spots’ for OC stocks in temperate
regions. While the blue carbon potential of temperate eelgrass meadows may be
reduced relative to other seagrass species and regions, their capacity to sequester and
store carbon at a regional scale should be considered in conjunction with other valuable
ecosystem services they provide.

19
Figures
Figure 1: We sampled sediments within six eelgrass (Zostera marina) meadows
located along the northwest coast of North America (a), on British Columbia’s (b) Central Coast (c). Nine cores were obtained from three positions within each meadow (interior, edge and adjacent bare sediment). Specific sampling locations at each site are shown in Figure A.1. Figure adapted from Keeling et al. (2017).
46
48
50
52
54
56
58
−135 −130 −125
−128.4 −128.2 −128
51.4
51.6
51.8
52
(b) (c)
McMullins Group
Goose Group
Triquet Bay
Pruth Bay
Choked Pass
Koeye Estuary
British Columbia
North America
Calvert Island
20
Figure 2: Surface organic carbon (OC) stocks in the top 5cm of sediment (a) and
deeper OC stocks in the top 20cm (b) at each site sampled on the Central Coast of British Columbia, Canada. The middle line represents the median OC stock for each site, while the lower and upper hinges correspond to the first and third quartiles. The upper and lower whiskers extend to 1.5 times the inter-quartile range, while any points beyond the end of the whiskers are outlying points.
21
Figure 3: Scaled coefficient values (dots) and 95% confidence intervals (lines) for
the three factors included in the generalized linear mixed effects model examining factors driving variation in surface organic carbon (OC) stocks (Table 3). Relative variable importance (RVI) values for each factor were calculated by summing the Akaike weights (Wi) of each model containing that factor. Estimates greater than 0 (dashed line) indicate a positive influence on OC stocks and vice versa. The 95% confidence intervals indicate the precision around the estimate of the effect; if the line crosses zero, there is little confidence in the direction and magnitude of the effect.
Relative Variable Importance
0.814
0.205
0.218
Water Motion
% Fine Sediments
Seagrass Complexity

22
Figure 4: δ13C and δ15N signatures for sediment mixtures from five of the six sites
sampled (orange triangles) and from potential OC sources (green circles). Choked Pass is not shown, as sediment N values were too low to conduct isotopic analyses. Error bars are standard errors for sediment mixtures and standard deviations for sources, for ease of visualization. Benthic diatom signatures are from 51 benthic diatom samples in San Francisco Bay Estuary (Cloern et al., 2002); POM data represent the mean value for the Central Coast of British Columbia, Zostera marina signatures are from Choked Pass, Central Coast, BC (Olson et al. 2015); terrestrial values represent the range reported in Cloern et al. (2002).
PruthBay
McMullinsN
Koeye TriquetBay
GooseSW
Zostera marina
Benthic Diatoms
POM
Terrestrial
Nereocystis
2
3
4
5
6
7
8
9
10
-29 -27 -25 -23 -21 -19 -17 -15 -13 -11 -9
δ15N
(‰)
δ13C (‰)

23
Tables
(a) Response (n=54): Top 5cm Organic Carbon Stock (g OC/m2)
Model K Log L AICc ΔAICc DF Wi adjR2
Site*Position 2 -307.08 674.5 0 19 0.795 0.798
Site 1 -330.393 677.2 2.71 7 0.205 0.522
Null 1 -350.31 704.9 30.34 2 0 0
Position 1 -349.601 708 33.5 4 0 0.0260
(b) Response (n=53): Top 20cm Organic Carbon Stock (g OC/m2)
Model K Log L AICc ΔAICc DF Wi adjR2
Site 1 -384.506 785.5 0 7 1 0.683
Site*Position 2 -374.792 810.6 25.11 19 0 0.781
Null 0 -414.981 834.2 48.7 2 0 0.061
Position 1 -413.322 835.5 49.98 4 0 0
Table 1: Strength of evidence for alternative candidate models explaining variation in (a) surface (5cm) and (b) 20cm organic carbon (OC) stocks. Models with varying numbers of parameters (K) were ranked by differences (∆) in small sample size corrected Akaike Information Criterion (AICc) based on their log likelihoods (Log L) and K. Akaike weights (Wi) were calculated as the relative likelihood of each model (exp(-0.5*ΔAICc) divided by the sum of the relative likelihoods across all models. Adjusted R-squared values (adjR2) were calculated based on the sample size (n) and the number of parameters in the model (K). All values were calculated using the MuMIN package in R.

24
Site Sediment
Accumulation Rate (g/m2´yr)
OC Density (mg OC/
cm3)
CRS OC Accumulation
Rate (g OC/m2´yr)
CIC OC Accumulation
Rate (g OC/m2´yr)
Age of Top
20cm (years)
Age-based OC Stock (g OC/m2
´50 years) McMullins
North 7507.9 (3028.9) 7.4 (1.9) 50.45 (29.06) 25.14 74 (25) 2724.3
Triquet Bay 4056.8 (18054.0) 11.0 (2.4) 41.31 (15.39) 35.44 58 (11) 2230.7
Pruth Bay 4375.8 (2593.1) 10.7 (4.3) 32.31 (14.17) 34.37 65 (38) 1744.7
Koeye 12619.8 (4039.8) 2.0 (1.8) 25.74 (20.14) 39.79 21 (9) 1390.0
Choked Pass 10727.3 (4075.6) 1.8 (1.5) 12.57 (12.46) 9.00 53 (34) 678.8
Goose SW *No excess 210Pb
Table 2: Geochronological analyses (210Pb dating) and elemental analysis of carbon content were used to estimate mean (±SD), sediment accumulation rates, organic carbon (OC) densities, Constant Rate of Supply (CRS) OC accumulation rates, Constant Initial Concentration (CIC) OC accumulation rates, and the age of the top 20cm of sediment. Aged-based (in contrast with depth-based) OC stocks were calculated by multiplying the OC accumulation rate (g OC/m2 ´ year) for each site by the average number of years that 20cm represents (54 years). Note that Goose SW did not have enough excess 210Pb to obtain age or accumulation rate estimates.

25
Response (n=36): Top 5cm Organic Carbon Stock (g OC/m2)
Model K Log L AICc ΔAICc DF Wi adjR2
Water Motion 1 -212.22 433.7 0 4 0.512 0.601
Water Motion + % Fines 2 -212.183 436.4 2.64 5 0.137 0.601 Water Motion + Seagrass
Complexity 2 -212.217 436.4 2.7 5 0.133 0.601
Null 0 -215.063 436.9 3.14 3 0.106 0.532
% Fines 1 -214.796 438.9 5.15 4 0.039 0.539
Water Motion + Seagrass Complexity + % Fines 3 -212.182 439.3 5.53 6 0.032 0.601
Seagrass Complexity 1 -215.062 439.4 5.68 4 0.03 0.532
Table 3: Strength of evidence for alternative candidate models explaining variation in surface (5 cm) organic carbon (OC) stocks. Models with varying numbers of parameters (K) were ranked by differences (∆) in small sample size corrected Akaike Information Criterion (AICc) based on their log likelihoods (Log L) and K. Akaike weights (Wi) were calculated as the relative likelihood of each model (exp(-0.5*ΔAICc) divided by the sum of the relative likelihoods across all models. Adjusted R-squared values (adjR2) were calculated based on the sample size (n) and the number of parameters in the model (K). All values were calculated using the MuMIN package in R.

26
Region Seagrass Species Reference OC Stocks (g OC/m2) Depth (cm) Range
British Columbia Zostera marina This Study
5 83 - 1089 10 123 - 2652 20 21 - 3665 25 185 - 5545 50 1207 - 5073
Baltic Sea Zostera marina Jankowska et al. 2016 10 50.2 - 228 Finland & Denmark Zostera marina Rohr et al. 2016 25 627 - 4324
Northern Europe Zostera marina Dahl et al. 2016 25 500 - 3500 Australia Multiple species Lavery et al. 2013 25 262 - 4833
Asia Multiple Species Miyajima et al. 2015 100 3800 - 12000 Global Multiple Species Fourqurean et al. 2012 100 19420
Mediterranean Sea Posidonia oceanica Serrano et al. 2014 100 1800 - 7400
Table 4: Comparison of organic carbon (OC) stocks from this study (all sites combined) to values obtained from published literature for Zostera marina meadows as well as other seagrass species.
27
References
Bates, D., Maechler, M., Bolker, B., and Walker, S. (2015). Fitting Linear Mixed-Effects Models Using lme4. Journal of Statistical Software, 67(1), 1-48. http://doi:10.18637/jss.v067.i01
Barañano, C., Fernández, E., & Méndez, G. (2017). Clam harvesting decreases the sedimentary carbon stock of a Zostera marina meadow. Aquatic Botany. https://doi.org/10.1016/j.aquabot.2017.12.002
Belshe, E. F., Mateo, M. A., Gillis, L., Zimmer, M., & Teichberg, M. (2017). Muddy Waters: Unintentional Consequences of Blue Carbon Research Obscure Our Understanding of Organic Carbon Dynamics in Seagrass Ecosystems. Frontiers in Marine Science, 4(May), 125. https://doi.org/10.3389/fmars.2017.00125
CEC. (2013). North American Blue Carbon Scoping Study. Montreal, Canada. Comission for Environmental Cooperation. 49pp.
Cloern, J.E., Canuel, E.A. & Harris, D. (2002). Stable carbon and nitrogen isotopic composition of aquatic and terrestrial plants of the San Francisco Bay estuarine systems. Limnology and Oceanography, 47(3), 713-729.
Crooks, S., Tamelander, J., Laffoley, D., March, J. V., Development, S., & Presidency, V. (2011). Mitigating Climate Change through Restoration and Management of Coastal Wetlands and Near-shore Marine Ecosystems Challenges and Opportunities Mitigating Climate Change through Restoration and Management of Coastal Wetlands and Near-shore Marine Ecosystem, (121).
Dahl, M., Deyanova, D., Gütschow, S., Asplund, M. E., Lyimo, L. D., Karamfilov, V., … Gullström, M. (2016a). Sediment characteristics as an important factor for revealing carbon storage in <i>Zostera marina</i> meadows: a comparison of four European areas. Biogeosciences Discussions, (May), 1–30. https://doi.org/10.5194/bg-2016-137
Dahl, M., Deyanova, D., Gütschow, S., Asplund, M. E., Lyimo, L. D., Karamfilov, V., … Gullström, M. (2016b). Sediment properties as important predictors of carbon storage in Zostera marina meadows: A comparison of four European areas. PLoS ONE, 11(12), 1–30. https://doi.org/10.1371/journal.pone.0167493
Dahl, M., Deyanova, D., Lyimo, L. D., Näslund, J., Samuelsson, G. S., Mtolera, M. S. P., … Gullström, M. (2016). Effects of shading and simulated grazing on carbon sequestration in a tropical seagrass meadow. Journal of Ecology, 104(3), 654–664. https://doi.org/10.1111/1365-2745.12564
Duarte, C. M., & Cebrián, J. (1996). The fate of marine autotrophic production. Limnology and Oceanography, 41(8), 1758–1766. https://doi.org/10.4319/lo.1996.41.8.1758
28
Duarte, C. M., & Krause-Jensen, D. (2017). Export from Seagrass Meadows Contributes to Marine Carbon Sequestration. Frontiers in Marine Science, 4(January), 1–7. https://doi.org/10.3389/fmars.2017.00013
Duarte, C. M., Losada, I. J., Hendriks, I. E., Mazarrasa, I., & Marbà, N. (2013). The role of coastal plant communities for climate change mitigation and adaptation. Nature Publishing Group, 3(11), 961–968. https://doi.org/10.1038/nclimate1970
Duarte, C. M., Middelburg, J. J., & Caraco, N. (2005). Major role of marine vegetation on the oceanic carbon cycle. Biogeosciences, 2, 1–8. https://doi.org/10.5194/bgd-1-659-2004
Fourqurean, J. W., Duarte, C. M., Kennedy, H., Marba, N., Holmer, M., Mateo, M. A., … Serrano, O. (2012). Seagrass ecosystems as a globally significant carbon stock. Nature Geosci, 5(7), 505–509. Retrieved from http://dx.doi.org/10.1038/ngeo1477
Gacia, E., & Duarte, C. M. (2001). Sediment Retention by a Mediterranean Posidonia oceanica Meadow: The Balance between Deposition and Resuspension. Estuarine, Coastal and Shelf Science, 52(4), 505–514. https://doi.org/DOI: 10.1006/ecss.2000.0753
Gelman, A. (2008). Scaling regression inputs by dividing by two standard deviations. Statistics in Medicine, 27, 2865–2873. https://doi.org/10.1002/sim
Gillis, L.G.G., Belshe, F.E.E., Ziegler, A. D. D., & Bouma, T. J. J. (2017). Driving forces of organic carbon spatial distribution in the tropical seascape. Journal of Sea Research, 120, 35–40. https://doi.org/10.1016/j.seares.2016.12.006
Gullström, M., Lyimo, L., Dahl, M., Samuelsson, G., Eggertsen, M., Anderberg, E., … Björk, M. (2017). Blue carbon storage in tropical seagrass meadows relates to carbonate stock dynamics, plant-sediment processes and landscape context: insights from the Western Indian Ocean. Ecosystems. https://doi.org/10.1007/s10021-017-0170-8
Hansen, J., & Reidenbach, M. (2012). Wave and tidally driven flows in eelgrass beds and their effect on sediment suspension. Marine Ecology Progress Series, 448, 271-288. http://www.jstor.org/stable/24875863
Hejnowicz, A. P., Kennedy, H., Rudd, M. A., & Huxham, M. R. (2015). Harnessing the climate mitigation, conservation and poverty alleviation potential of seagrasses: prospects for developing blue carbon initiatives and payment for ecosystem service programmes. Frontiers in Marine Science, 2(June), 1–22. https://doi.org/10.3389/fmars.2015.00032
Howard, J., McLeod, E., Thomas, S. … Pidgeon, E. (2017). The potential to integrate blue carbon into MPA design and management. Aquatic Conservation: Marine and Freshwater Ecosystems, 27(S1), 100-115.

29
Jankowska, E., Michel, L. N., Zaborska, A., & Włodarska-Kowalczuk, M. (2016). Sediment carbon sink in low density temperate eelgrass meadows (Baltic Sea). Journal of Geophysical Research: Biogeosciences, 1–17. https://doi.org/10.1002/2016JG003424
Johannessen, S. C., & Macdonald, R. W. (2016). Geoengineering with seagrasses: Is credit due where credit is given? Environmental Research Letters, 11(11), 113001. https://doi.org/10.1088/1748-9326/11/11/113001
Keeling B., Hessing-Lewis M., Housty C., Okamoto D.K., Gregr E.J., & Salomon A.K. (2017). Factors driving spatial variation in egg survival of an ecologically and culturally important forage fish. Aquatic Conservation: Marine and Freshwater Ecosystems, 27, 814–827. https://doi.org/10.1002/aqc.2757
Kennedy, H., Beggins, J., Duarte, C. M., Fourqurean, J. W., Holmer, M., Marbá, N., & Middelburg, J. J. (2010). Seagrass sediments as a global carbon sink: Isotopic constraints. Global Biogeochemical Cycles, 24(4), 1–8. https://doi.org/10.1029/2010GB003848
Koch, E.W., Ackerman, J., Verduin, J.J., van Keulen, M., Larkum, A.W.D., Orth, R.J., & Duarte, C.M. (2006). Fluid Dynamics in Seagrass Ecology—from Molecules to Ecosystems. Seagrasses: Biology, Ecology and Conservation. 193-225. 10.1007/1-4020-2983-7_8.
Lavery, P. S., Mateo, M.-Á. Á., Serrano, O., & Rozaimi, M. (2013). Variability in the Carbon Storage of Seagrass Habitats and Its Implications for Global Estimates of Blue Carbon Ecosystem Service. PLoS ONE, 8(9), e73748. https://doi.org/10.1371/journal.pone.0073748
Macreadie, P. I. I., Baird, M. E. E., Trevathan-Tackett, S. M. M., Larkum, A. W. D. W. D. D., & Ralph, P. J. J. (2014). Quantifying and modelling the carbon sequestration capacity of seagrass meadows - A critical assessment. Marine Pollution Bulletin, 83(2), 430–439. https://doi.org/10.1016/j.marpolbul.2013.07.038
Macreadie, P. I., York, P. H., Sherman, C. D. H., Keough, M. J., Ross, D. J., Ricart, A. M., & Smith, T. M. (2014). No detectable impact of small-scale disturbances on “blue carbon” within seagrass beds. Marine Biology, 161(12), 2939–2944. https://doi.org/10.1007/s00227-014-2558-8
Martinetto, P., Montemayor, D. I., Alberti, J., Costa, C. S. B., & Iribarne, O. (2016). Crab Bioturbation and Herbivory May Account for Variability in Carbon Sequestration and Stocks in South West Atlantic Salt Marshes. Frontiers in Marine Science, 3(July), 1–12. https://doi.org/10.3389/fmars.2016.00122
Mateo, M. a, Romero, J., Pérez, M., Littler, M. M., & Littler, D. S. (1997). Dynamics of Millenary Organic Deposits Resulting from the Growth of the Mediterranean Seagrass Posidonia oceanica. Estuarine, Coastal and Shelf Science, 44(1), 103–110. https://doi.org/10.1006/ecss.1996.0116

30
Mazarrasa, I., Marbà, N., Garcia-Orellana, J., Masqué, P., Arias-Ortiz, A., & Duarte, C. M. (2017a). Dynamics of carbon sources supporting burial in seagrass sediments under increasing anthropogenic pressure. Limnology and Oceanography, in press. https://doi.org/10.1002/lno.10509
Mazarrasa, I., Marbà, N., Garcia-Orellana, J., Masqué, P., Arias-Ortiz, A., & Duarte, C. M. (2017b). Effect of environmental factors (wave exposure and depth) and anthropogenic pressure in the C sink capacity of Posidonia oceanica meadows. Limnology and Oceanography, 62(4), 1436–1450. https://doi.org/10.1002/lno.10510
Mcleod, E., Chmura, G. L., Bouillon, S., Salm, R., Björk, M., Duarte, C. M., … Silliman, B. R. (2011). A blueprint for blue carbon: toward an improved understanding of the role of vegetated coastal habitats in sequestering CO 2. Frontiers in Ecology and the Environment, 9(10), 552–560. https://doi.org/10.1890/110004
Miyajima, T., Hori, M., Hamaguchi, M., Shimabukuro, H., Adachi, H., Yamano, H., & Nakaoka, M. (2015). Geographic variability in organic carbon stock and accumulation rate in sediments of East and Southeast Asian seagrass meadows. Global Biogeochemical Cycles, 1–19. https://doi.org/10.1002/2014GB004979.Received
Miyajima, T., Hori, M., Hamaguchi, M., Shimabukuro, H., & Yoshida, G. (2017). Geophysical constraints for organic carbon sequestration capacity of Zostera marina seagrass meadows and surrounding habitats. Limnology and Oceanography, 62(3), 954–972. https://doi.org/10.1002/lno.10478
Morton, R.A. & White, W.A. (1997). Characteristics of and corrections for core shortening in unconsolidated sediments. Journal of Coastal Research, 13(3), 761-769.
Nellemann, C., Corcoran, E., Duarte, C. M., Valdés, L., De Young, C., Fonseca, L., & Grimsditch, G. (2009). Blue carbon: A Rapid Response Assessment. Environment. Retrieved from http://www.grida.no/files/publications/blue-carbon/BlueCarbon_screen.pdf
Oreska, M. P. J., McGlathery, K. J., & Porter, J. H. (2017). Seagrass blue carbon spatial patterns at the meadow-scale. PLoS ONE, 12(4), 1–18. https://doi.org/10.1371/journal.pone.0176630
Oreska, M. P. J., Wilkinson, G. M., McGlathery, K. J., Bost, M., & McKee, B. A. (2017). Non-seagrass carbon contributions to seagrass sediment blue carbon. Limnology and Oceanography. https://doi.org/10.1002/lno.10718
Pan, Y., Birdsey, R. a, Fang, J., Houghton, R., Kauppi, P. E., Kurz, W. a, … Hayes, D. (2011). A large and persistent carbon sink in the world’s forests. Science (New York, N.Y.), 333(6045), 988–993. https://doi.org/10.1126/science.1201609
31
Pendleton, L., Donato, D. C., Murray, B. C., Crooks, S., Jenkins, W. A., Sifleet, S., … Baldera, A. (2012). Estimating global “blue carbon” emissions from conversion and degradation of vegetated coastal ecosystems. PloS One, 7(9), e43542. https://doi.org/10.1371/journal.pone.0043542
Potouroglou, M., Bull, J. C., Krauss, K. W., Kennedy, H. A., Fusi, M., Daffonchio, D., … Huxham, M. (2017). Measuring the role of seagrasses in regulating sediment surface elevation. Scientific Reports, 7(1), 1–11. https://doi.org/10.1038/s41598-017-12354-y
Ricart, A. M., Pérez, M., & Romero, J. (2017). Landscape configuration modulates carbon storage in seagrass sediments. Estuarine, Coastal and Shelf Science, 185, 69–76. https://doi.org/10.1016/j.ecss.2016.12.011
Ricart, A. M., York, P. H., Rasheed, M. A., Pérez, M., Romero, J., Bryant, C. V., & Macreadie, P. I. (2015). Variability of sedimentary organic carbon in patchy seagrass landscapes. Marine Pollution Bulletin, 100(1), 476–482. https://doi.org/10.1016/j.marpolbul.2015.09.032
Rozaimi, M., Serrano, O., & Lavery, P. S. (2013). Comparison of carbon stores by two morphologically different seagrasses. Journal of the Royal Society of Western Australia, 96(October), 81–83.
Samper-Villarreal, J., Lovelock, C. E., Saunders, M. I., Roelfsema, C., & Mumby, P. J. (2016). Organic carbon in seagrass sediments is influenced by seagrass canopy complexity, turbidity, wave height, and water depth. Limnology and Oceanography, 61(3), n/a-n/a. https://doi.org/10.1002/lno.10262
Schlacher, T. A., & Connolly, R. M. (2014). Effects of acid treatment on carbon and nitrogen stable isotope ratios in ecological samples: A review and synthesis. Methods in Ecology and Evolution, 5(6), 541–550. https://doi.org/10.1111/2041-210X.12183
Serrano, O., Lavery, P. S., Duarte, C. M., Kendrick, G. A., Calafat, A., York, P., … Macreadie, P. (2016a). Can mud (silt and clay) concentration be used to predict soil organic carbon content within seagrass ecosystems? Biogeosciences Discussions, 13, 4915-4926. https://doi.org/10.5194/bg-2015-598
Serrano, O., Ricart, A. M., Lavery, P. S., Mateo, M. A., Arias-Ortiz, A., Masque, P., … Duarte, C. M. (2015). Key biogeochemical factors affecting soil carbon storage in Posidonia meadows. Biogeosciences Discussions, 12(22), 18913–18944. https://doi.org/10.5194/bgd-12-18913-2015
Serrano, O., Ricart, A. M., Lavery, P. S., Mateo, M. A., Arias-Ortiz, A., Masque, P., … Duarte, C. M. (2016b). Key biogeochemical factors affecting soil carbon storage in Posidonia meadows. Biogeosciences, 13, 4581–4594. https://doi.org/10.5194/bg-13-4581-2016

32
Spooner, A.M. 2015. Blue carbon sequestration potential in Zostera marina eelgrass beds of the K’ómoks Estuary, British Columbia. M.S. Thesis, Royal Roads University, Victoria, British Columbia
Sutton-Grier, A. E., & Moore, A. (2016). Leveraging Carbon Services of Coastal Ecosystems for Habitat Protection and Restoration. Coastal Management, 44(3), 259–277. https://doi.org/10.1080/08920753.2016.1160206
Trevathan-Tackett, S. M., Macreadie, P. I., Sanderman, J., Baldock, J., Howes, J. M., & Ralph, P. J. (2017a). A Global Assessment of the Chemical Recalcitrance of Seagrass Tissues: Implications for Long-Term Carbon Sequestration. Frontiers in Plant Science, 8(June), 1–18. https://doi.org/10.3389/FPLS.2017.00925
Trevathan-Tackett, S. M., Seymour, J. R., Nielsen, D. A., Macreadie, P. I., Jeffries, T. C., Sanderman, J., … Ralph, P. J. (2017b). Sediment anoxia limits microbial-driven seagrass carbon remineralization under warming conditions. FEMS Microbiology Ecology, 93(6), 1–15. https://doi.org/10.1093/femsec/fix033

33
Appendix. Supplemental Figures and Tables
Figure A.1: The position of sampling transects (brown lines) within each of the six
Zostera marina meadows sampled (panels) on the Central Coast of British Columbia, Canada. For unvegetated cores, divers swam approximately five meters out from the current edge of the meadow, perpendicular to edge transects 1-3. See Figure 1 for larger study area overview.
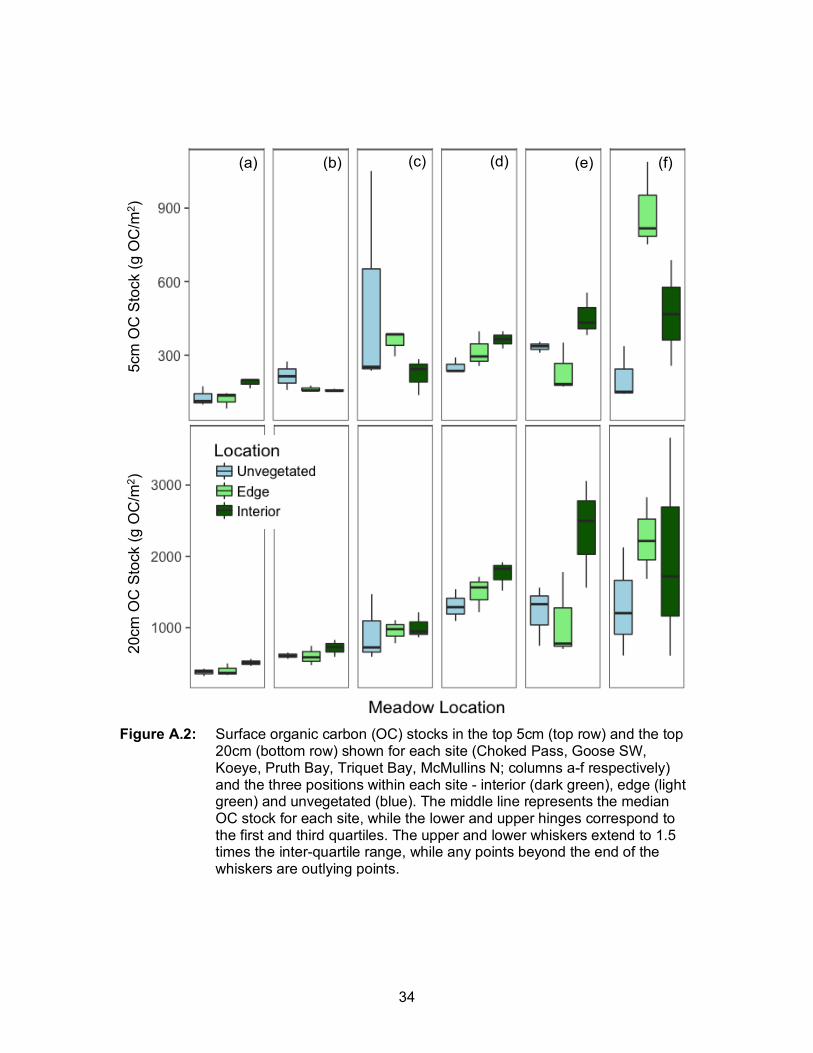
34
Figure A.2: Surface organic carbon (OC) stocks in the top 5cm (top row) and the top 20cm (bottom row) shown for each site (Choked Pass, Goose SW, Koeye, Pruth Bay, Triquet Bay, McMullins N; columns a-f respectively) and the three positions within each site - interior (dark green), edge (light green) and unvegetated (blue). The middle line represents the median OC stock for each site, while the lower and upper hinges correspond to the first and third quartiles. The upper and lower whiskers extend to 1.5 times the inter-quartile range, while any points beyond the end of the whiskers are outlying points.
(a) (b) (c) (d) (e) (f)
5cm
OC
Sto
ck (g
OC
/m2 )
20
cm O
C S
tock
(g O
C/m
2 )

35
Table A.1: Seagrass characteristics (means ± SD) in each of the six meadows sampled in August 2016. PB = Pruth Bay, CP = Choked Pass, KY = Koeye Estuary, TB = Triquet Bay, MC = McMullins N, GO = Goose SW. Meadow areas are derived from unmanned aerial vehicle (UAV) imagery. Densities and canopy heights are averages from quadrats along edge (n=3) and interior (n=3) transects (n=6 transects/meadow). Canopy complexity was calculated by multiplying density ´ canopy height (vertical meters (m) of seagrass/m2). Belowground (BG) biomass is root and rhizome biomass (mg) per cubic centimeter of sediment, while aboveground (AG) biomass is the average mass of an individual shoot.
Site Meadow Size (m2)
Seagrass Density
(shoots m-2) Canopy
Height (m) Canopy
Complexity (m/m2)
BG Biomass (mg/cm3)
AG Biomass (g/shoot)
PB 34982 215.6 (128.1) 80.8 (27.5) 140.99 (61.40) 0.66 (0.37) 0.74 (0.60)
CP 354580 79.6 (13.2) 110.2 (19.5) 86.36 (13.95) 1.25 (0.74) 1.81 (0.91)
KY 26238 125.7 (32.4) 164.1 (38.7) 186.50 (66.37) 0.94 (0.59) 1.21 (0.64)
TB 31074 124.2 (77.1) 98.2 (30.3) 112.50 (35.89) 1.65 (1.15) 1.71 (0.87)
MC 22778 102.9 (37.4) 85.1 (23.3) 99.76 (50.53) 1.17 (0.71) 1.27 (0.57)
GO 215570 107.8 (44.8) 84.9 (20.0) 95.30 (48.53) 1.30 (1.00) 1.05 (0.54)

36
Table A.2: Physical and sediment characteristics (means ± SD) in each of the six meadows sampled in August 2016. PB = Pruth Bay, CP = Choked Pass, KY = Koeye Estuary, TB = Triquet Bay, MC = McMullins North, GO = Goose Southwest. Water depths were calculated by subtracting the tidal height (m) from the recorded water depth (m) during SCUBA surveys; negative depths indicate intertidal, positive depths indicate subtidal. Water motion is the relative dissolution rate of Plaster of Paris blocks in grams lost/hour. Percent (%) fines is the proportion of sediments passed through the 63µm sieve. Woody debris proportion is the proportion of 5cm depth intervals per core containing woody debris deposits. δ13C values are from the top 5cm of sediment, while % organic and inorganic carbon values are per core averages from each site.
Site Chart Datum Depth
(m)
Water Motion
(g lost/hr) % Fines (<63µm)
Woody Debris
Proportion
Top 5cm Sediment δ13C (‰)
% Organic Carbon
% Inorganic Carbon
PB -0.03 (0.87) 0.59 (0.01) 6.17
(2.91) 0.4 (0.4) -17.28 (0.54) 0.57 (0.10) 0.18 (0.24)
CP 3.34 (1.38) 2.48 (0.16) 0.12
(0.05) 0.1 (0.1) -18.77 (2.33) 0.15 (0.02) 0.98 (0.63)
KY 0.16 (0.32) 0.97 (0.14) 0.83
(0.79) 0.3 (0.4) -21.48 (3.39) 0.35 (0.18) 0.96 (1.06)
TB 0.77 (0.87) 1.53 (0.50) 0.98
(0.72) 0.3 (0.4) -18.65 (3.12) 0.69 (0.29) 4.54 (2.68)
MC 0.56 (0.87) 0.70 (0.14) 0.57
(0.27) 0.8 (0.3) -21.07 (0.93) 0.71 (0.37) 1.76 (2.39)
GO 2.45 (1.09) 1.01 (0.02) 0.20
(0.11) 0.5 (0.5) -19.17 (0.81) 0.26 (0.07) 2.70 (2.43)
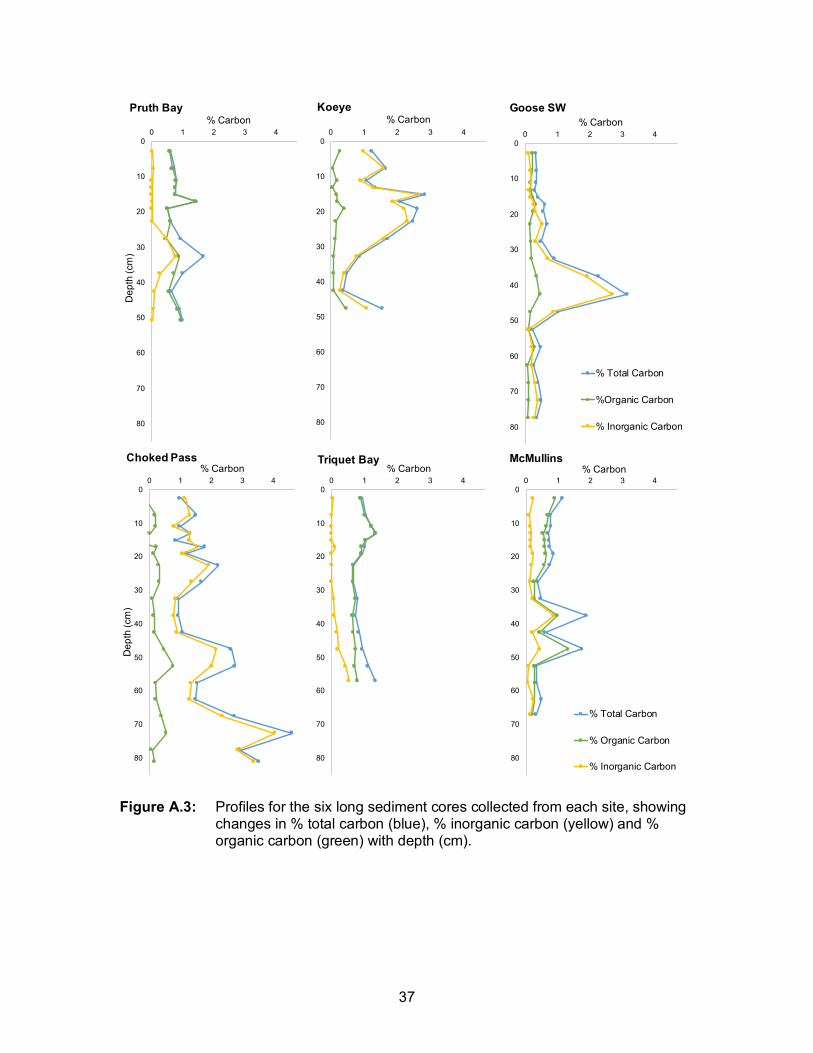
37
Figure A.3: Profiles for the six long sediment cores collected from each site, showing
changes in % total carbon (blue), % inorganic carbon (yellow) and % organic carbon (green) with depth (cm).
0
10
20
30
40
50
60
70
80
0 1 2 3 4D
epth
(cm
)% Carbon
Pruth Bay
0
10
20
30
40
50
60
70
80
0 1 2 3 4% Carbon
Goose SW
% Total Carbon
%Organic Carbon
% Inorganic Carbon
0
10
20
30
40
50
60
70
80
0 1 2 3 4% Carbon
Koeye
0
10
20
30
40
50
60
70
80
0 1 2 3 4
Dep
th (c
m)
% CarbonChoked Pass
0
10
20
30
40
50
60
70
80
0 1 2 3 4% Carbon
Triquet Bay
0
10
20
30
40
50
60
70
80
0 1 2 3 4% Carbon
McMullins
% Total Carbon
% Organic Carbon
% Inorganic Carbon