reduced intracellular sam can increase the expression of ... · reduced intracellular sam can...
TRANSCRIPT

Reduced intracellular SAM can increase the expression of met
gene under the SAM-MetJ mechanism in Escherichia coli
Peng Xia
A Thesis
in
The Department
of
Biology
Presented in Partial Fulfillment of the Requirements
for the Degree of Master of Science at
Concordia University
Montreal, Quebec, Canada
October 2008
© Peng Xia, 2008

1*1 Library and Archives Canada
Published Heritage Branch
395 Wellington Street Ottawa ON K1A0N4 Canada
Bibliotheque et Archives Canada
Direction du Patrimoine de I'edition
395, rue Wellington Ottawa ON K1A0N4 Canada
Your file Votre reference ISBN: 978-0-494-45479-4 Our file Notre reference ISBN: 978-0-494-45479-4
NOTICE: The author has granted a nonexclusive license allowing Library and Archives Canada to reproduce, publish, archive, preserve, conserve, communicate to the public by telecommunication or on the Internet, loan, distribute and sell theses worldwide, for commercial or noncommercial purposes, in microform, paper, electronic and/or any other formats.
AVIS: L'auteur a accorde une licence non exclusive permettant a la Bibliotheque et Archives Canada de reproduire, publier, archiver, sauvegarder, conserver, transmettre au public par telecommunication ou par Plntemet, prefer, distribuer et vendre des theses partout dans le monde, a des fins commerciales ou autres, sur support microforme, papier, electronique et/ou autres formats.
The author retains copyright ownership and moral rights in this thesis. Neither the thesis nor substantial extracts from it may be printed or otherwise reproduced without the author's permission.
L'auteur conserve la propriete du droit d'auteur et des droits moraux qui protege cette these. Ni la these ni des extraits substantiels de celle-ci ne doivent etre imprimes ou autrement reproduits sans son autorisation.
In compliance with the Canadian Privacy Act some supporting forms may have been removed from this thesis.
Conformement a la loi canadienne sur la protection de la vie privee, quelques formulaires secondaires ont ete enleves de cette these.
While these forms may be included in the document page count, their removal does not represent any loss of content from the thesis.
Bien que ces formulaires aient inclus dans la pagination, il n'y aura aucun contenu manquant.

A B S T R A C T
Reduced intracellular SAM can increase the expression of met gene under the
SAM-MetJ mechanism in Escherichia coli
Peng Xia
S-adenosylmethionine(SAM) is synthesized from methionine by SAM synthetase. In
E. coli this enzyme is encoded by metK. Since metK is an essential gene and SAM cannot
cross bacterial cell membranes, it is difficult to study the the role of SAM directly in vivo.
We introduced the SAM transporter gene from Rickettsia (kindly provided by Dr. D.
O.Wood) to study the effect of exogenous supply of SAM on expression of genes of
methionine biosynthesis in E .coli strains carrying a deletion of metK. Such strains could
not make their own SAM but could transport SAM provided in the medium. The effect of
growth with SAM, and SAM starvation on expression of the genes encoding most of
enzymes in methionine biosynthesis, metA, metB, metC, metE, metF, metK, metR, was
studied by means of reporter gene constructs using their promoters fused to lacZ. The
Beta-Galactosidase coded by lacZ will reflect the met genes' expression in the SAM
including medium or non-SAM medium. By using the above system, the effect of SAM
on regulating met genes was studied. The result showed that in rich medium depleting the
SAM supply of the AmetK strain dramatically induced metB and metR (both 19.2 fold).
The other genes were little affected. During growth in minimal medium with methionine
and glucose, depleting the SAM pool had a much greater effect, inducing all the genes
tested 10 fold to 100 fold. Moreover, there is no siganificant increase for all met genes in
metJ deletion strain. These results support the in vitro model of MetJ-SAM repressor
iii

complex binding met gene promoters to block their transcription. Furthmore, result of
studying a metJ deficient mutant IVTNR6 implies that the truncated MetJ in MNR6 retains
a considerable function. All these studies give one step further to understand the
mechanism of regulating met gene expression by MetJ-SAM complex in vivo.

A C K N O W L E D G E M E N T S
1 would like to use this space to express my gratitude to all those who have helped me
to finish this thesis, especially in last year.
First and foremost, I would like to express my sincere appreciation to my thesis
committee members, DnZergers and Dr.Herrington, who provided me extremely valuable
help for revising this thesis. 1 also would like to thank Dr.Brown and Dr.Widden, who
gave their great help to complete this thesis. And I also express my appreciation to
Dr.Titoranko, my external examiner for reviewing my thesis. 1 know without all of you, I
can not finish this thesis.
I also thank my dear husband my little son, David, the true love let me brave to face
any challenges both in research and in life.
Furthermore, I show my thankfulness to Dr.Wood who provided us the SAM
transporter gene in Rickettsia and Rodrigo Reyes, my colleage, who cloned the above
SAM transporter gene into pLTET vector.
V

TABLE OF CONTENTS
List of Figures ix
List of Tables x
1 Introduction 1
1.1 The functions of S-adenosylmethionine (SAM) 1
1.2 Biosynthesises of methionine and SAM 2
1.3 Control of the met regulon 6
1.4 Motivation and Objectives 10
2 Materials and Methods 11
2.1 Bacterial strains and plasmids 11
2.2 Media and growth conditions II
2.2.1 Luria-Bertani medium (LB) 11
2.2.2 Minimal medium (NIV) 14
2.2.3 Carbon source for NIV minimal medium 14
2.2.4 R-topagar 14
2.2.5 SOC medium for electro-transformation 15
2.2.6 Preparation of SAM Stock solution 75
2.2.7 Antibiotics and Supplements 16
2.2.8 Growth of SAM-requiring strains 16
2.3 Solutions: 16
2.3.1 SM buffer 16
2.3.2 Beta-Galactosidase assay solution 17
vi

2.3.3 Southern analysis solution 17
2.4 Enzymes and related buffers 18
2.5 PI phage transduciton 18
2.5.1 PI phage lysate preparation 19
2.5.2 PI phage-mediated transduction 19
2.6 Plasmid isolation and restriction enzyme digestion 19
2.6.1 Plasmid isolation 19
2.6.2 Restriction enzyme digestion 20
2.6.3 DNA gel electrophoresis analysis 20
2.7 Electro-transformation 20
2.8 Plasmid and Constructions 20
2.8.1 AmetK AmetJ double deletion strain (SAD16 AmetJ/pSAM) construction 22
2.8.2 Isolation of methionine non-requiring derivatives ofSAD16/pSAM. 22
2.9 Plasmid and strain verification 25
2.10 Beta-Galactosidase assay 25
2.11 Southern Blotting 26
2.12 Mass spectrometry for checking SAM degradation 27
2.13 Sample preparation for Beta-Galactosidase assay 27
3 Results 30
3.1 Determing the optimal SAM working concentration by Mass spectrum 30
3.2 Construction and verification of plasmids and strains 33
3.2.1 Construction and verification of reporter plasmids 33
vii

3.2.2 MNR6 construction andverification 37
3.2.3 Verification of met J mutant among MNRs 41
3.2A Construction and verification of strain SAD16 A/ne/J/pSAM 44
3.2.5 Construction and verification strain Cu /pSAM/pmet, SAD16/pSAM/pmet,
MNR6/pSAM/pmet, SAD16Ame/.//pSAM/pmet 46
3.3 Result for Beta-Galactosidase in rich medium 47
3.4 Result for Beta-Galactosidase in minimal medium 50
4 Discussion 54
4.1 Regulation of intracellular levels of SAM 55
4.2 The effect of SAM on met gene expression in minimal medium 64
4.3 Comparison the effect of SAM on met gene expression in rich and minimal
medium 65
4.4 Conclusions 67
Reference 68
viii

List of Figures
Figure 1. Regulation of the synthesis of methionine and SAM 3
Figure 2. The construction of pmet 24
Figure 3. Mass spec result for testing SAM degradation 32
Figure 4. PCR products for met gene protomers 36
Figure 5. The probe of southern blot 38
Figure 6. The one insertion strategy of southern blot for MNR mutants 39
Figure 7. Southern blot result for MNR mutants 40
Figure 8. Sequencing result for PCR product of metJ gene of MNR6 42
Figure 9. Approval metJ gene is disrupted in MNR6 mutant by PCR 43
Figure 10. The strain SAD16 AmetJ verification 45
Figure ll.Concerved domain analysis for MeU 61
ix

List of Tables
Table 1. Strains and plasmids were used 12
Table 2. Met gene primer designation and localization 34
Table 3. Primers used to amply met genes and expected size 34
Table 4. Primers used for checking strains 35
Table 5. Effect of SAM starvation in rich medium (LB) 51
Table 6. Effect of SAM starvation in minimal medium (N1V) 53
Table 7. Data comparation between this study and Dr.Hughes's study for metK deficient
strain in rich medium 62
Table 8. The result comparation between this study and Dr.Hughes's study for metJ
deficient strain in rich medium 63
Table 9. The comparation of effect of SAM in rich and minimal medium for
Cu/pSAM/pmetandSAD16/pSAM/pmet 66
X

1 Introduction
1.1 The functions of S-adenosylmethionine (SAM)
S-adenosylmethionine (SAM) is a very versatile metabolite. It serves as donor of
methyl groups in many reactions, reflecting the favorable energetics over the use of
other one carbon unit carriers such as tetrahydrofolic acid (Greene, 1996). SAM is the
methyl donor for DNA, RNA and proteins. The Escherichia coli (E.coli) K-12
genome encodes three DNA methyltransferases, which can transfer methyl group
from SAM, Dam, Dcm and EcoK I ((M.G, 1996). Modification of nucleosides in the
ribosomal RNA (rRNA) and transfer RNA (tRNA) plays an important role in the
maturation of these molecules, with more than 95 different chemical modifications
reported to exist in various organisms (Limbach et al., 1994; Rozenski et al., 1999).
Methylation is a common modification in proteins, occuring at different amino acid
residues in various organisms: lysine, arginine, proline, histidine, alanine, methionine,
glutamic acid, asparagine and glutamine. In bacteria, all of these modifications occur
except the methylation of arginine (Kim, 1980). For example, some ribosomal
proteins and translation factors in E.coli have been found methylated (Lhoest and
Colson, 1981; Young and Bernlohr, 1991).
In E. coli, SAM can work as corepressor for MetJ and together to inhibit met gene
expressions, which are genes in E.coli that encode enzymes in methionine
biosynthesis. This conclusion was confirmed by many in vitro experiments. Recently,
Dr. Hughes's research group showed the reduction in the SAM pool induced the met
l

regulon (LaMonte and Hughes, 2006). This function will be elucidated in the
following part.
In E. coli SAM also is involved in the synthesis of polyamines spermidine by being
the aminopropyl group. SAM is first decarboxylated to S-adenosyl-methiioninamine
catalyzed by SAM decarboxylase (enzyme coded by speD). Then, spermindine
synthase (enzyme coded by speE) catalyzes transfer of the aminopropyl moiety to
putrescine and yields spermine (Roje, 2006). Moreover, SAM has been recognized as
an important precusor in reactions that requires the formation of organic radicals
(Banerjee, 2003).
The product of metK, SAM, is involved in many metabolic pathways, and plays a
variety of biological roles. SAM is best known as the primary methyl group donor in
all organisms. This includes methylation of many cellular constituents, including
DNA, RNA, proteins, and small molecules (Miller et al., 2003). However, it also acts
as a precursor of the polyamines, biotin and lipoate, and is involved in DNA repair
and in signal transduction system involved in the E. coli adaptation response during
chemotaxis (Levit M.N., 1998).
1.2 Biosynthesises of methionine and SAM
The biosynthesis of methionine and S-adenosylmethionine can start with
homoserine, which is the common precursor for some amino acids of the aspartate
family, isoleucine, threonine and methionine (Rodionov DA, 2004). The enzymes
involved are MetA, MetB, MetC, MetE, MetH and MetK (Figure 1). The functions of
2

Homoserine MetA MetA
MetB
MetC
Homocystein MetE
MetH MetF
t CH3-THF -*-
Methionine
MetK
SAM + MetJ —* SAM-MetJ
MetR (activator)
Figure 1. Regulation of the synthesis of methionine and SAM. MetA, B, C, E, H, F, K, R are enzymes involved or related methionine biosynthesis. The blunt end represents the inhibition.
3

the biosynthetic enzymes can be summarized as follows.
The metA gene codes for homoserine O-succinyltransferase (EC2.3.1.46,
90.79minute), which catalyzes the first reaction on the pathway to homocysteine and
methionine. It catalyzes the o-succinylation of homoserine, using succinylCoA and
producing o-succinylhomoserine.The metB gene codes for cystathionine
y-synthase(EC 4.2.99.9, 88.94minute), which catalyzes the displacement of the
succinyl moiety of O-succinyl-L-homoserine by L-cysteine to yield L-cystathionine
and succinate.
The metC gene codes for cystathionine P-lyase (cystathionase)(EC 4.4.1.8,
67.91 minute) which catalyzes the straightforward p elimination that converts
L-cystathionine to L-homocysteine, pyruvate, and ammonia. Two different enzymes
can catalyze the terminal step in methionine biosynthesis, MetE and MetH. MetE and
metH both code for homocysteine-methyltetrahydrofolate methyltransferases, which
introduce the methyl group to homocysteine. These enzymes differ in their catalytic
mechanism. MetE is cobalamin-independent homocysteine transmethylase (EC
2.1.1.14, 86.45minute), which is produced during cell growth in minimal media and
shows an absolute specificity for methyltetrafolic acid modified with polyglutamate.
MetH is a cobalamin-dependent enzyme (EC 2.1.1.13, 90.99minute) and is active
only in media supplemented with vitamin Bi2(Greene, 1996). MetH prefers to accept
methyl group by 5-methyl THF instead of a methyltetrafolic acid modified with
polyglutamate. However, MetE prefers to accept methyl group coming from a
methyltetrafolic acid modified with polyglutamate. This is thought to be consistent
4
with the assumption that the MetH protein is primarily active during cell growth in the
intestinal tract, where anaerobic conditions prevail and cobalamin is available (Greene,
1996).
The metK gene codes for the enzyme SAM synthetase (EC 2.5.1.6, 66.49minute)
which catalyzes the condensation of methionine with the adenosyl group coming from
ATP. This reaction is unusual in that the ATP is cleaved at the 5' carbon forming a
tripolyphosphate enzyme-bound molecule which is released later as pyrophosphate
and phosphate. SAM synthetase is a highly conserved enzyme, being present in all
organisms examined to date. The SAM synthetases of as distant organisms as E. coli
and humans share 57 % sequence identity (Newman et al., 1998). MetK is an essential
gene in E. coli (Wei and Newman, 2002). MetR and MetJ can regulate transcription of
metK, positively and negatively respectively. MetK can also be regulated negatively
by the leucine responsive protein (Lrp) (Newman et al., 1998). For some
Lrp-regulated genes, the presence of leucine in the medium modulates greatly the
action of Lrp (Newman and Lin, 1995). In the metK case, leucine promotes the
transcription of the gene probably by releasing Lrp from the promoter. The strain
MetK84 has a point mutant in the promoter region of the metK gene. This decreases
transcription causing an unusually low level of SAM synthetase, such that the strain
needs leucine to induce the enzyme further (Wei and Newman, 2002).
E. coli is not able to transport SAM from the medium (Holloway et al., 1970). This
has made the study of the effect of variations in intracellular SAM concentration very
difficult (Posnick and Samson, 1999). Indeed, there was no description of a protein
5

capable of transporting SAM in bacteria until 2003, when the product of the gene
RP076 from the alpha proteobacteria Rickettsia prowazekii was described in the study
of Dr. Woods' group (Tucker A.M., 2003; Driskell et al., 2005). They transferred this
transporter to E. coli and showed that it can function in this strain. They were kind
enough to provide us with a plasmid containing SAM transporter gene from Rickettsia
prowazekii. Thus, by designing two primers of this SAM transporter gene and using
clone PCR product method, Rodrigo Reyes in our lab was able to make our pSAM
which contains this SAM transporter gene in pLtetOl, a low copy number expression
vector with a pl5A origin of replication and carrying a Pltet promoter with a
convenient multiple cloning site (Lutz and Bujard, 1997). Reyes also optimized the
function of the transporter in E. co//(Reyes, 2005). Therefore, I can use this plasmid to
study the cellular functions of SAM by investigating the effects of changing the
intracellular SAM concentration in E. coli.
1.3 Control of the met regulon
The pathway of methionine and SAM biosynthesis is controlled by both
regulation of gene expression and feedback inhibition. The enzyme MetA is subject to
feedback inhibition, and the products of the metJ and metR genes are also involved in
regulation of met gene expression. As indicated in Figure 1, both methionine and
5-adenosyImethionine can inhibit the function of the first enzyme of methionine
biosynthesis, MetA, a phenomenon known as feedback inhibition. The feedback
inhibition occurs at early stage of biosynthsis of methionine and SAM. Methionine
6

and SAM exert appreciable inhibitory effect alone when the concentration of
methionine and SAM is high. At a low concentration level of methionine and SAM,
feedback inhibition for melA only happens when these two metabolites combine to
work (Lee et al., 1966).
Besides the negative regulation due to the feedback inhibition, the amount of
methionine biosythesis enzymes made can also be regulated by the level of
transcription. It has been showed that mutations in metJ and metK increased the level
of the methionine biosynthetic enzymes (Lawrence et al., 1968). Purified MetJ protein
was shown to be a DNA-binding protein which protected a region from cleavage by
DNase 1 in the promoter between metB and metJ (Kirby et al., 1986). Consistent with
this is the finding of Shoeman that pure MetJ protein inhibited in vitro transcription of
the metB, metF, metJ, and metL genes and that S-adenosylmethionine enhanced that
inhibition (Shoeman et al., 1985). Belfaiza noticed the presence of repeated octameric
sequences at the 5' ends of four met genes (including the region of the metB-metJ
footprint) and suggested that they are the binding sites for MetJ repressor (Belfaiza et
al., 1986). Results of subsequent studies supported this conclusion and octameric
repeats have been found adjacent to most of the genes of the met regulon (Phillips et
al., 1989). The consensus sequence for these repeats, 5'-AGACGTCT-3', is called the
"MET Box". SimonE.V.Phillips' data supported the hypothesis that the E. coli met
repressor, MetJ with its complex with the corepressor SAM, can bind to synthetic and
natural met operators (Phillips et al., 1989). Because of cooperative interactions
between the bound repressor molecules, the number of adjacent octamers is an
7

important parameter in determining the affinity of the MetJ protein for a given
operator. Highly repressible transcription units (e.g., metB and metF) have more MET
Box repeats than a poorly repressible one (metC) (Holloway et al., 1970; Greene et al.,
1973).
Operator consensus sequences for MetJ-SAM repression [refered from (Phillips et al., 1989)]
Consensus AGACGTCT AGACGTCT AGACGTCT AGACGTCT AGACGTCT
melA AGctaTCT gGAtGTCT AaACGTaT AagCGTaT
62.5% 75% 75% 62.5%
metB AtACGcaa AGAaGTtT AGAtGTCc AGAtGTaT tGACGTCc
50% 75% 75% 75% 75%
metC AGACaTCc AGACGTaT
75% 87.5%
meiE gGAtGaaT AaACtTgc cGcQTCc
50% 50% 50%
met¥ cttCaTCT ttACaTCT gGACGTCT GaACGgaT AGAtGTgc
50% 62.5% 87.5% 62.5% 62.5%
melR AGgatTtT AGcCGTCc AGAtGTtT AcACaTCc
50% 75% 75% 62.5%

In addition to the repression by MetJ, several met genes are also subject to
regulation by a second protein, MetR (the product of metR gene). It was reported that
the native MetR protein from E. coli has a molecular mass of 68 kDa and it functions
as a dimer (Maxon et al., 1990). Moreover, a leucine zipper motif functions in the
dimerization (Neidhardt, 1996). The MetR protein is a member of homologous
bacterial activator proteins known as the LysR family (Henikoff et al., 1990). It binds
to DNA near the promoters of metE and metH and stimulates transcription (Maxon et
al., 1989; Marconi et al., 1991). In addition, MetR increases the expression of metA
and melF genes, and represses its own transcription (Maxon et al., 1989). It also can
counter the MetJ repression of metF (Cowan et al., 1993). Moreover, DNase I
footprints of MetR binding and the effects of several mutations on the response to
MetR protein have identified TGAANN(T/A)NNTTCA as the consensus MetR target
sequence (Greene, 1996). The metR mutants grow rapidly if methionine is fed, while
they grow very slowly on medium supplemented with vitamin B12. The product of the
metR gene is required for an appropriate level of metE expression, and it stimulates
the expression of me///(Urbanowski ML, 1987 ).
In summary, on the one hand, the SAM-MetJ complex, working as repressor, has a
high affinity to sequences known as met boxes AGACGTCT, which are found at the
upstream of the metA, B, C, E, F and R genes. Recently, the met regulon has been
extended tentatively to genes not apparently related to methionine metabolism
(Marines et al., 2006). On the other hand, MetR is an activator for met regulon. It has
a remarkable effect on the stimulation of expression of the two met genes {metE and
9

metH), while it has smaller effects on other genes, which are either inhibitory or
stimulatory.
1.4 Motivation and Objectives
Although many data in vitro proved that SAM can regulate met regulon, the
quantitative details of SAM regulating met gene expression in vivo are little
understood, particularly because SAM until recently could not be provided from
outside of the cell. The recent discovery of the Rickettsia SAM transporter (Driskell et
al., 2005) allows the study of the effects of adding varying amounts of SAM to our
AmetK strain. With Rickettsia SAM transporter gene, AmetK strain can grow normally
in rich medium and it can grow normally in minimal medium when methionine is
provided. If SAM represses methionine biosynthesis, addition of SAM should be
inhibitory unless methionine is also provided. Reyes found this to be true and added
methionine to SAM dependent strain cultures grown in minimal medium (Reyes,
2005). If the methionine requirement of SAM dependent strain reflects the inhibition
of methionine biosynthesis by SAM, it should be possible to isolate deregulated
mutants by screening methionine non-requiring strains.
The availability of an E. coli strain expressing a SAM transporter allows us to
monitor the effect of varying the availability of exogenous SAM on met gene
expression in vivo. The hypothesis of this work is that reducing intracellular SAM can
increase the met gene expression under the SAM-MetJ mechanism. According to this
hypothesis, the following questions will be focused: Is MetJ-SAM mechanism
10

effective in vivo? If so, what are the quantitative data on reducing SAM regulating
met gene expression? Can SAM dependent mutants be isolated, which do not require
methionine to grow in minimal medium? If so, what is their nature?
2 Materials and Methods
2.1 Bacterial strains and plasmids
AH bacterial strains used in this study were derivatives of E.coli K-12 and listed in
Plasmids used are also listed in .
In all cases, the cells used to inoculate liquid cultures came from colonies raised
overnight on agar plates inoculated with transformants stored in 25%(v/v)glycerol at
-80r and streaked for purification.
2.2 Media and growth conditions
2.2.1 Luria-Bertani medium (LB)
Per liter contained:
1) Bacto-peptone 10 g;
2) Yeast extract 5 g;
3) NaC15g;
PH adjusted to 7.0. The media was sterilized by autoclaving.
For LB agar plate, a final concentration of 2% v/w of bacto-agar was added to the
LB liquid before autoclaving it.
n

Table 1. Strains and plasmids were used
Strain name
Cul008
Cu/pSAM
SADI6/pSAM
SAD]6*metJ/pSAM
MNR6/pSAM
S M 1 0 ( V )
XL 1-blue
JWK 3909-1
Plasmid name
pLtetsam (pSAM)
pmetA
pmetB
Genotype
E. coliK-U *ilvA
E. coli K-12 *ilvA
pLtet-SAM transporter
£ coli K-12 *ilvA *metK
pLtet-SAM transporter
SAD16^we/J::kan
SAM requiring and
relative growth rate is low
SAD16 metJ::Tn\0
pLtet-SAM transporter
thi-1 ihr leu ton A lacY
supE
z-ecA::RP4-2-Tc::Mu,
recA 1 endA 1 gyrA96
thi-1 hsdR17 supE44
relAl lac [F'proAB
lacIqZAM15TnlO(Tetr)]
K coli K-12 W3110
AmetJ
pLtetOl carrying the
sam gene from Rickettsia
prowazekii,
pMC1871 carrying the
metA promoter and
operator fused in frame to
a promoterless lacZ gene
pMC1871 carrying the
meiB promoter and
operator fused in frame to
phenotypes
Need isoleucine and
valine
Need isoleucine and
valine; Cmr
Need isoleucine,
valine and SAM in
all medium; need
methionine in
minimal medium;
Cm'
The same as SAD 16
and Kanr grow very
slowly in minimal
medium
The same as SAD 16
except it does not
need methionine in
minimal medium
and it contains Kan'
Kanr
blue/white color
screening
Kan'
Cm'
tet'
let'
Source
L.S.Wiliams
L.S.Wiliams and
Dr.Wood
This work
This work
This work
Kenneth N.Timmis
Stratagene
Dr.Mori Janpan
Rodrigo Reyes
This study
This study
12

pmetC
pmetE
pmetF
pmetK
pmetR
pZl
pLOF
pMC1871
a promoterless lacZ gene
pMC1871 canning the
metC promoter and
operator fused in frame to
a promoterless lacZ gene
pMC1871 carrying the
melE promoter and
operator fused in frame to
a promoterless lacZ gene
pMC1871 carrying the
melF promoter and
operator fused in frame to
a promoterless lacZ
gene
pMC1871 carrying the
metK promoter and
operator fused in frame to
a promoterless lacZ gene
pMC1871 carrying the
melR promoter and
operator fused in frame to
a promoterless lacZ gene
Lac promoter and
operator fused in frame
with lacZ
TnlO based delivery
plasmid with Kanr
tetr
tetr
tetr
tetr
tetr
Cmr
Amp' Kanr
color blue/white
tet'Amp'
This study
This study
This study
This study
This study
N/A
Marta Herrero(Herrero
et ah, 1990)
Pharmacia
13

2.2.2 Minimal medium (NIV)
Per liter contained:
1) (NH4)2S04 2 g ;
2) K2HP04 15 g ;
3) KH2P04 5.25 g ;
4) L-isoleucine 0.5 g ;
5) L-valine 0.5 g.
PH adjusted to 7.0. The media was sterilized by autoclaving.
For minimal medium plates, 2X NIV are prepared and sterilized. Separately 4%
v/w of bacto-agar in water is prepared and sterilized. After autoclaving equal volumes
of both the 2X NIV and the 4% bacto-agar are mixed.
2.2.3 Carbon source for NIV minimal medium
The carbon source, D-glucose, was sterilized separately by filtration and then added
to the NIV. The final concentration was 0.2% (w/v).
2.2.4 R-top agar
1) Bacto-tryptone lOg,
2) Yeast extract 1 g,
3) NaCl 8g,
4) Bacto-agar 8g,
were dissolved in 1 liter distilled water. Sterile CaCl2 (1M) and Glucose (20%, W/V)
14

were added to the medium to the final concentration of 2mM and 0.1 % separately
after autoclaving.
2.2.5 SOC medium for electro-transformation
1) Bacto-tryptone 20g,
2) Yeast extract 5g,
3) NaCI 0.58 g,
4) KC1 0.185 g,
5) MgCl2 2.03 g
6) Glucose 3.6 g
were dissolved in 1 liter distilled water. And this media was sterilized by autoclaving
2.2.6 Preparation of SAM Stock solution
The nutritional supplement of SAM was obtained from a commercial
pharmaceutical brand "FoodScience of Vermont" as 200 mg tablets of SAM-e. The
tablets were ground and dissolved in 1 mM HC1 to a final concentration around 100
mM. The mixture was centrifuged at 4000 rpm for 5 minutes to pellet the insoluble
material and the supernatant was filtered through a 0.4 m pore size filter and stored as
aliquots at -20 °C. An estimate of the real concentration of SAM was obtained by
measuring the absorbance at 260 nm (= 15, 400 M'cm"1). SAM as p-toluenesulfonate
salt was purchased from SIGMA. It was diluted in 1 mM HC1 to a final concentration
of 100 mM, sterilized by filtration and stored as aliquots at -86 °C.
15

2.2.7 Antibiotics and Supplements
Final concentrations used for antibiotics were: 100 jig/ml ampicillin, 25 (ig/ml
chloramphenicol, 40 ug/ml kanamycin and tetracycline at 20 u,g/ml. The supplement
of methionine is used in the minimal medium as 40 u.g/ml.
2.2.8 Growth of SAM-requiring strains
Strains containing the deletion of metK and pSAM were grown in LB with 200 ^M
SAM or in NIV with 200 ^M SAM and 40 ug/ml methionine.
For P-galactosidase assays, cultures were grown overnight with shaking at 37" in
5ml liquid rich and minimal medium with 200u.M SAMe, with the appropriate
antibiotics to select strains, transporter plasmid and reporter plasmid. After chill the
cultures on ice and subculture to the same medium the next day and grew the cells
until they reach the log phase (3-4 hours). Collect some cells and then wash the left
cells with LB or minimal medium to get rid of SAM. Subculture to the same medium
without SAM and starve SAM for 4 hours. Then measure Beta-gal actosidase in
presence or absence of SAM in different strains immediately.
2.3 Solutions:
2.3.1 SM buffer
SM buffer is used for storage and dilution of bacteriophage X stocks. Per liter
contained:
1) NaCl 5.8g;
16

2) MgS04-7H20 2g;
3) lMTrisCl(pH7.5) 50ml;
4) 2% gelatin solution 5mI.
Sterilize the buffer by autoclaving for 20 minutes at 151 b/sq on liquid cycle and store
at room temperature.
2.3.2 Beta-Galactosidase assay solution
Z buffer: per 50 ml contains 0.80g Na2HP04.7H20 (0.06M); 0.28g NaH2P04.H20
(0.04M); 0.5 ml 1M KC1 (0.01M); 0.05 ml 1M MgS04 (0.001 M); 0.135 ml
beta-mercaptoethanol (BME) (0.05M); bring to approximately 40 ml with H20,
dissolve all the salts; adjust the pH to 7.0, store at 4 C.
O-nitrophenyl-D-galactopyraniside (ONPG): 4 mg/ml prepared in 0.1M sodium
phosphate PH 7.5.
1 M Na2C03: 10.6 g Na2C03 was dissolved in 100 ml double distilled water.
2.3.3 Southern analysis solution
Denaturing solution includes:
1) 20gofNaOH,
2) 58.4gNaCl
were dissolved in 1 liter of ultrapure water.
Neutralizing solution includes:
17

1) 78.8 g Tris base,
2) 87.6gNaCl
in 800 mis of ultrapure water. Adjust the pH to 7.4. Add ultrapure water to 1 liter.
20X SSC includes:
1) 175.3 gNaCl,
2) 88.2 g of trisodium citrate (citric acid);
add ultrapure water to 1 liter.
2.4 Enzymes and related buffers
Taq polymerase, pfu DNA polymerase, T4 ligase, Calf Intestine Alkaline
Phosphatase (CIAP) and restriction enzymes were purchased from MBI fermentas
(Montreal, Canada). Kits for plasmid extraction QIAprep Spin Miniprep Kit and
GenElute Plasmid Miniprep Kit were purchased from QIAGEN (Montreal, Canada)
or SIGMA (USA) respectively. DNA mini Kit was obtained from QIAGEN (Montreal,
Canada). QIAquick PCR Purifcation Kit was obtained from QIAGEN (Montreal,
Canada).
2.5 PI phage transduciton
PI phage-mediated transduction is performed as described by (Miller, 1972) with
minor modifications.
18

2.5.1 PI phage lysate preparation
A single colony of donor strain is incubated into LB+Ca2+ overnight at 37°C
without shaking. 0.1ml PI phage (1056 phage/ml) is added to 1ml of overnight culture
and incubated at 37°C for 15-30 minutes to let the phage to infect the donor strain.
Then 3ml LB+Ca2+ and 3ml melt R-top agar are added, and the whole mixture is
poured onto a fresh LB plate. After incubating the plate in an upright position for 8
hours, the phage lysate containing the required gene is collected by centrifuge and
stored at 4°C with the presence of the chloroform.
2.5.2 PI phage-mediated transduction
The recipient strain was harvested and resuspended in 1/10 volume of LB+ Ca2+
when it reached late log phase (OD600=0.7-1.0). 0.1ml of the resuspended culture
was mixed with a dilution of PI phage lysate. The mixture was incubated at 37 °C for
15 minutes, 1ml of SM phage buffer was added and cells were resuspended in 1ml of
LB+ glucose. After incubated at 37°C for 1 hour, 0.2ml aliquot was plated in the
appropriate selection plates.
2.6 Plasmid isolation and restriction enzyme digestion
2.6.1 Plasmid isolation
Plasmid was isolated using QIAprep Spin Miniprep Kit (QIAGEN) or GenElute
Plasmid Miniprep Kit (SIGMA) following manufacturer's instructions.
19

2.6.2 Restriction enzyme digestion
DNA samples were digested by restriction enzymes form MBI fermentas following
manufacturer's instruction.
2.6.3 DNA gel electrophoresis analysis
DNA agarose gel electrophoresis analysis is performed as described (T. Maniatis et
ah, 1989). The final concentration was 1.0% (W/V) agarose.
2.7 Electro-transformation
Electro transformation was carried out using Gene Pulser (Bio-Rad Co.), following
the manufacturer's manual.
2.8 Plasmid and Constructions
1 constructed seven plasmids: pmetA, pmetB, pmetC, pmetE, pmetF, pmetK and
pmetR, which contain the different natural met gene promoter and operator sequences
fused in frame to a promoterless lacZ gene. The vector pMC1871 contains the
promoterless lacZ gene and PCR products containing different met promoters were
cloned into the Sma 1 site (Figure 2).
The strain XL 1-blue list in strain table was used as host for plasmids.
Transformants were selected on LB Tet X-Gal plates, and screened for blue colonies.
The blue colour indicates that the cells are expressing beta gal, suggesting the
recombinant plasmids have an active promoter.
20

The primers for PCR were designed to amplify the promoter sequence for
different met genes. The sequence of primers used and their locations are listed in
Table 2. The PCR reaction was carried in a volume of 50 uL and the mixture
contained luM concentration of each primer, 50 ng of template E. coli Cu 1008
genomic DNA, Reaction buffer [75mM Tris-HCl (pH8.8), 20 mM (NH4)2 S04, 0.1%
Tween 20], 2 mM MgCl2, 300 uM dNTPs, 1 U of pfu DNA Polymerase (Fermentas,
USA). The reaction was performed using the following program:
94 °C 5 min
35 cycles 94 °C 30 s
55 °C 30 s
72 °C 2 min
72 °C 10 min
After amplification, the products were analyzed on a 1% agarose gel and DNA was
purified using QIAquick PCR Purifcation Kit (QIAGEN Montreal, Canada). The
vector pMC1871 was cut by Smal I, and the band was extracted from the gel using
QIAquick® Gel Extraction Kit from Qiagen. The blunt ended PCR products were
cloned into the using T4 DNA ligase.
XL 1-Blue competent cells were transformed by electorporation and selected in
LB tetracycline X-Gal plate. Blue colonies were selected and the plasmids were
extracted and checked using restriction enzyme. Finally the positive plasmids were
sent to sequencing to determine if the appropriate promoter regions were cloned.

2.8.1 AmetK AmetJ double deletion strain (SAD16 AmetJ/pSAM) construction
PI phage was prepared in the deletion strains JWK 3909-1 (metJ:: kanr), kindly
provided by Dr.Mori. PI was then used to infect SAD16/pSAM and transductants
were selected on LB with kanamycin and SAM. The KanR colonies were checked
with PCR using the metJ primers which located upstream and downstream of metJ
gene. Colonies with the metJ deletion will give a 1883 bp product whereas a colony
with a wild type metJ gene will give a 909 bp product.
2.8.2 Isolation of methionine non-requiring derivatives of SAD16/pSAM
From the previous study, we know that E. coli can use externally provided SAM if
it has a transporter (Reyes, 2005). However in minimal medium, addition of SAM is
not sufficient to allow growth of the metK mutant (Reyes, 2005). Methionine must
also be provided. We hypothesized that this is because SAM can inhibit methionine
biosynthesis. Therefore, we tried to select mutants that can grow much faster than
metK mutant alone without methionine in the minimal medium using mini-TnlO
based transposon insertion (Herrero et al., 1990).
Grow metK mutant strain SAD16/pSAM on the LB SAM Cm plates with different
concentrations of Nalidixic acid. SAD16, which can grow under the Nalidixic acid 5
ng/ml after overnight on the above selecting plates, was selected as the recipient strain.
The mini-TNIO donor strain SM10(A.pir)/pLOF was cultured in LB Kan 50 ug/ml
Ampl OOfig/ml. Then mix with recipient using a ratio of 1:4.
Centrifuge down the mixture and put all cells on the surface of LB plates with
22

50uM isopropyl-p-D-thiogalactopyranoside (IPTG) for 8 hours at 37 L~. Then the cells
were suspended in lOmM MgS04 and the appropriate dilutions were plated on
selective medium (NIV GIu, SAMlOOuM, Nal 5ug/ml, Kan 50u.g/ml). We selected
four mutants which can grow much faster than original metK mutant SAD! 6 on this
minimal medium lacking methionine. We called these mutants as methionine
nonrequiring mutants (MNR).
After recombinant plasmids were obtained, all pmet plasmids as well as a control
plasmid pZl were transformed into four strains, namely, wild type (Cu/pSAM),
AmetK strain (SAD16/pSAM), AmetK AmetJ double deletion strain
(SAD16Awe/J/pSAM) and methionine-non requiring mutant (MNR6/pSAM) by
electro-transformation on LB SAM chloramphenicol, tetracycline selected medium.
All these strains include the SAM transporter gene carried on plasmid pLtetOl. All
genetic phenotypes for each strain were verified by PCR using corresponding primers.
23

E.coll chromosom
PrimerF operator ATG
met gene
p.MBl ori
Begining of met gene
Figure 2. The construction of pmet. The operater regions of metA, metB, metC, metE, metF, metK and metR were amplified with two primers. One locates upstream of operater region, another locates inside of met gene. These PCR products were fused in frame with a promoterless lacZ in the vector pMCl 871 at Sma I site.
24

2.9 Plasmid and strain verification
All the plasmids and strains constructed has been verified by using PCRs method
with appropriate primers (Table 4.) The template of these PCRs was prepared by
putting E. coli cells into PCR reaction tubes with autoclaved toothpicks. The cell
density in PCR tubes becomes just visible in pure water. Freeze them at -70°C for 5
min before they were put PCR reagents and put them into PCR thermal cycler.
Table 4.
2.10 Beta-Galactosidase assay
Grow cells overnight. Subculture and allow them to reach OD6oo=0.5 and record
the number. In triplicate, take 100 u.1 of the cell culture and place it in glass tubes.
Then add 900 ul of Z buffer and 1 drop of prewarmed 0.1% SDS and 2 drops of
chloroform were added to each tube and vortex for 10 seconds. Incubate at 28°C for
5min. Add 0.2 ml of ONPG and vortex at 23°C (room temperature). Then record time
in minuites of development of yellow color and stop reaction by adding 0.5ml of 1M
Na2CC»3 and vortex. Read absorbance at 420 and 550 nm and record the number.
Calculate units of Beta-galactosidase activity using following equation:
Units=1000x[ OD420-0.75xOD55o)/(time in min)x(volume used of cell culture)xOD6oo]
reference for method (Miller, 1972).

2.11 Southern Blotting
Southern hybridization was carried out as described previously (Sambrook and
Russell, 2001) with minor modifications. Total genomic DNA from MNR mutants
isolated using Qiagen genomic DNA extracting Kit and around 100 ug DNA were
digested overnight with restriction enzyme HindlM. Digest was precipitated by a
standard ethanol precipitation and DNA was diluted in 30 ul TE buffer. 100 ug of the
digest was separated by standard agarose gel electrophoresis using a 1% agarose gel
and transferred overnight to a Hybond N+ nylon membrane by capillary blotting
using alkaline transfer according the instructions provided by the manufacturer
(Amersham Biosciences).
The DNA probe was generated by digesting pLOF with Mlu\ (Figure 5). The digest
was separated by agarose gel electrophoresis, and a 1500 bp fragment containing the
mini-TNlOkan was purified using Quiagen QuiaexII gel extraction kit. This fragment
(100 ng) was denatured in boiling waterbath for 2 min and immediately transferred on
ice. IX Klenow buffer (supplied by MBI Fermentas), 0.5 mM dNTP (dAGT), 1 ul
DTT (100 mM), 80uCi of [a32P] dCTP (3000 Ci/mmole), 1 ul Klenow fragment and
water were added up to 25 uf and the mixture was incubated at room temperature for
1 hour. Removal of unincorporated dNTPs was done by passing the reaction through a
Sephadex G50 column (Sambrook and Russell, 2001).
Combination of 50 ng of the labeled probe and hybridization solution brought the
final volume to 2.5 ml and the sample was denatured for 5 minutes in boiling water
bath. Hybridization was carried out in glass roller bottles as described by (Sambrook
26

and Russell, 2001). Washing steps were carried out as described previously
(Sambrook and Russell, 2001). The hybridization signal was detected by
autoradiography.
2.12 Mass spectrometry for checking SAM degradation
SAMe from the tablets was put into 5 ml double distilled water (PH=7.0) and final
concentration is lOOuM. The solution was divided into two parts, one part was sent to
pass mass spectrometry immediately and another part was incubated at 37 °C for 20
hours, then pass mass spectrometry. The sample were analyzed with the Q-TOF 2™
(Micromass, USA) mass spectrometer, using electrospray ionization (ESI) (Nano
spray) and tandem mass spectrometry (MS/MS).
2.13 Sample preparation for Beta-Galactosidase assay
To study the effect of SAM on met gene expression, I constructed seven plasmids:
pmetA, pmetB, pmetC, pmetE, pmetF, pmetK and pmetR, which contained the
different natural met gene promoter and operator sequences fused in frame to a
promoterless lacZ gene. Then 1 transformed them together with a control plasmid pZl
into four strains, namely, wild type (Cu/pSAM), AmetK strain (SAD16/pSAM),
AmetK AmetJ double deletion strain (SAD16 AmetJ/pSAM) and methionine-non
requiring mutant (MNR6/pSAM). The pSAM is the plasmid with SAM transporter
gene carried on vector pLtetOl.
To study the effects of SAM starvation in rich medium, 1 grew these four kinds of
strains in LB medium overnight with 200 uM SAM and proper antibiotic (25 u-g/ml
27

chloramphenicol, 20 ug/ml tetracycline for Cu/pSAM/pmet, SAD16/pSAM/pmet and
additional 40 ug/ml kanamycin for SAD 16 Awe/J/pSAM/pmet and
MNR6/pSAM/pmet). In the next day, I chilled the cultures on ice for a least 5 min,
and subcultured them in the same medium with 1/200 dilution for 3-4 hours (OD600
is around 0.5-0.7). These resulting log phase cells were chilled, and divided into two
parts, starved and non-starved samples. Starved samples were prepared by washing
with cold LB medium incubated in LB medium without SAM with proper antibiotics
for 3 hours (Cu/pSAM/pmet) or 4 hours (AmetK strains including
SAD16/pSAM/pmet, SAD16 Ame/J/pSAM/pmet and MNR6/pSAM/pmet).
Non-starved samples were prepared by subcuturing overnight culture to the same LB
medium with SAM and incubated with their starved ones for the same period of time.
The P-galactosidase values of both non-starved and starved samples were assayed at
the same time. For each strain, three parallel samples for each met gene were
measured under the same condition. This whole set experiment was done once to
three times according to different strains (Cu/pSAM/pmet, twice; SAD16/pSAM/pmet,
three times; SAD 16 Ame/J/pSAM/pmet, once; MNR6/pSAM, twice). The average
data of Beta-Galactosidase of each strain under the same condition was used to
represent the expression of each met gene in rich medium.
The similar method was used to study these met gene expression in minimal
medium (NIV). The only difference is to put 40 ug /ml methionine in the the medium
N1V to grow strains. Only two kinds of strains (Cu/pSAM/pmet and
SAD16/pSAM/pmet) were used to study in minimal medium since the other two
28
strains (MNR6/pSAM/pmet and SAD16 AmetJ /pSAM/pmet) grew too slow in
minimal medium to give enough amount of cell to measure Beta-Galactosidase. The
whole process is described as follows.
1 grew these strains (Cu/pSAM/pmet and SAD16/pSAM/pmet) in N1V overnight
with 200 uM SAM, 40 ug /ml methionine and 25 u.g/ml chloramphenicol, 20 jig/ml
tetracycline. In the next day, I chilled the cultures on ice for a least 5 mins, then
subcultured them in the same medium with 1/100 dilution for 3-4 hours (OD600 is
around 0.5-0.7). The resulting log phase cells were chilled, and divided into two parts,
starving and non-starved samples. Starving samples were prepared by washing with
cold N1V+ 40 ug /ml methionine medium, then incubated in the same medium
without SAM with proper antibiotics for 3 hours (Cu/pSAM/pmet) or 4 hours
(SAD16/pSAM). The non-starved samples were prepared by subcuturing overnight
culture to the same N1V, methionine medium with SAM and incubated with their
starved ones for the same period of time. Then the P-galactosidase values of both
non-starved and starved samples were assayed immediately. For each strain, three
parallel samples for each met gene were measured for Beta-Galactosidase under the
same condition. The set of experiments were repeated three times for Cu/pSAM/pmet
and twice for SAD16/pSAM/pmet. The average data of Beta-Galactosidase of each
strain under the same conditions was used to present the expression of each met gene
in minimal medium.
1 have to methion that, in order to achieve similar cell density before measuring
Beta-Galactosidase, "starve" SAM for Cu/pSAM for 3 hours and starve metK
29

deficient strain for 4 hour were used. Actually, although we did not put SAM in the
medium, Cu/pSAM did not starve SAM since it can make SAM itself and it has a
relatively high growth rate. However, for metK deficient strains, since they can not
make SAM and when they grow in the medium without SAM, they had low growth
rate and will use up SAM after 4 hours.
3 Results
3.1 Determing the optimal SAM working concentration by Mass spectrum
SAM is an unstable molecule and it can be easily broken due to heat or alkaline
environment. Since the most strains used in this study are SAM dependent strains and
they have to grow in the medium provided with SAM. The effect of SAM
concentration of the medium on the growth of SAM dependent cell is large. On one
hand, there should be enough SAM to support cell growth and division. On the other
hand, too much SAM cannot be put into the medium, since it would result in a very
acidic medium, which would hinder the cell growth. Therefer, the level of SAM
concentration needs to be studied. I used Mass sprectrum to determine whether
lOOuM SAM is enough to support overnight culture. The result was shown in Figure
3. The ratio ofm/z for SAM is 399, and another compound (m/z 298) is selected to be
used as a reference compand since it is the second highest peak, which is more
accurate to measure and it is a relative stable compound. The middle figure showed
non-incubated SAM under the ESI. From it, we can see that the ratio of peak
30
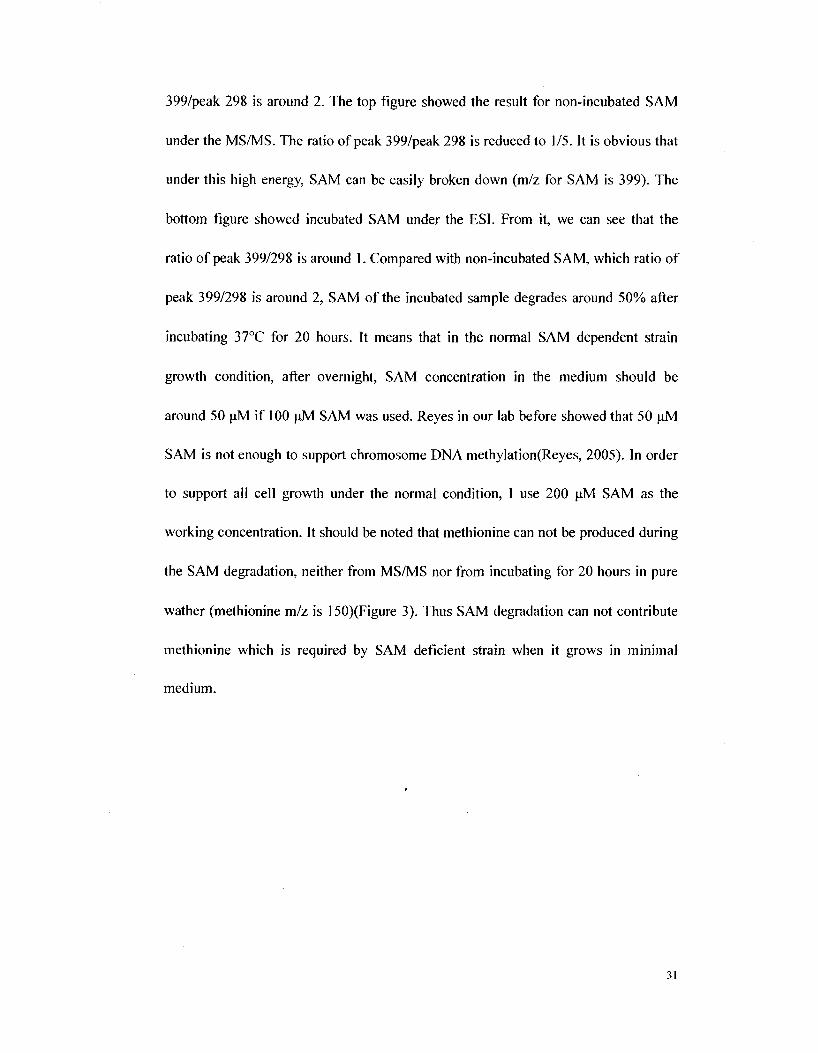
399/peak 298 is around 2. The top figure showed the result for non-incubated SAM
under the MS/MS. The ratio of peak 399/peak 298 is reduced to 1/5. It is obvious that
under this high energy, SAM can be easily broken down (m/z for SAM is 399). The
bottom figure showed incubated SAM under the ESI. From it, we can see that the
ratio of peak 399/298 is around 1. Compared with non-incubated SAM, which ratio of
peak 399/298 is around 2, SAM of the incubated sample degrades around 50% after
incubating 37°C for 20 hours. It means that in the normal SAM dependent strain
growth condition, after overnight, SAM concentration in the medium should be
around 50 uM if 100 uM SAM was used. Reyes in our lab before showed that 50 uM
SAM is not enough to support chromosome DNA methylation(Reyes, 2005). In order
to support all cell growth under the normal condition, I use 200 uM SAM as the
working concentration. It should be noted that methionine can not be produced during
the SAM degradation, neither from MS/MS nor from incubating for 20 hours in pure
wather (methionine m/z is 150)(Figure 3). Thus SAM degradation can not contribute
methionine which is required by SAM deficient strain when it grows in minimal
medium.
31

SAMT_CONTROLMSMS399 42 (1.794) Cm (34:78)
10(h
• #
TOF MSMS 399.00ES+ 7.37e4
B51 113 399.164
SAMT_CONTROL 20 (0.853) Cm (20:65)
100-1
163.139 1B5. ,21199.177
•1 | . l i . | i
SAMT_INCUBATE_20H 6 (0.263) Cm (2:96)
IOOT
r r r r r l T i i'] i f T i
TOF MS ES+ 7.37e4
U~4 i I I 1111111I I n i
TOF MS ES+ 7.37e4
11 i I I 1 1 1 1 11 11 1 1 1 1 i i-m/z 50 75 100 125 150 175 200 225 250 275 300 325 350 375 400 425 450 475 500 525 550 575
Figure 3. Mass spec result for testing SAM degradation. SAM: m/z is 399; the top figure is the result for non-incubated SAM under the MS/MS; the middle figure shows non-incubated SAM under the ESI; the bottom figure shows incubated SAM under the ESI
32
3.2 Construction and verification of plasmids and strains
3.2.1 Construction and verification of reporter plasmids
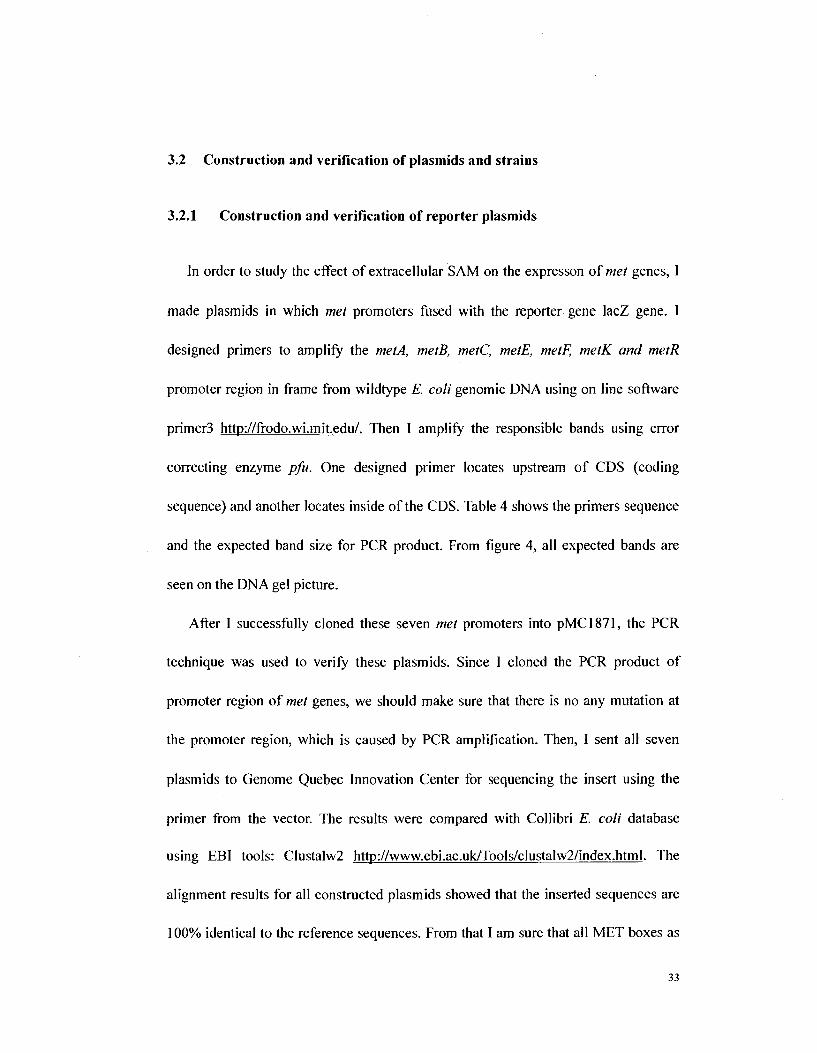
In order to study the effect of extracellular SAM on the expresson of met genes, I
made plasmids in which met promoters fused with the reporter gene lacZ gene. I
designed primers to amplify the metA, metB, metC, metE, metF, metK and metR
promoter region in frame from wildtype E. coli genomic DNA using on line software
primer3 http://frodo.wi.mit.edu/. Then 1 amplify the responsible bands using error
correcting enzyme pfu. One designed primer locates upstream of CDS (coding
sequence) and another locates inside of the CDS. Table 4 shows the primers sequence
and the expected band size for PCR product. From figure 4, all expected bands are
seen on the DNA gel picture.
After ] successfully cloned these seven met promoters into pMC1871, the PCR
technique was used to verify these plasmids. Since I cloned the PCR product of
promoter region of met genes, we should make sure that there is no any mutation at
the promoter region, which is caused by PCR amplification. Then, I sent all seven
plasmids to Genome Quebec Innovation Center for sequencing the insert using the
primer from the vector. The results were compared with Collibri E. coli database
using EBI tools: Clustalw2 http://www.ebi.ac.uk/Tools/clustalw2/index.html. The
alignment results for all constructed plasmids showed that the inserted sequences are
100% identical to the reference sequences. From that 1 am sure that all MET boxes as
33

well as promoter regions of all met gene cloned into pMCl 871 are intact.
Table 2. Met gene primer designation and localization [one primer locates upstream of operater(MET boxes), another primer locates inside of met gene]
Gene name
metA
metB
metC
metE
metF
metK
metR
up primer to ATG
655bp
661bp
584bp
663bp
515bp
612bp
683bp
Down primer to ATG
299bp
225bp
231bp
228bp
256bp
231bp
256bp
Met boxs to ATG
19 bp
71 bp
34bp
71bp
81bp
No met boxes
95bp
Table 3. Primers used to amply met genes and expected size
Met
gene
metA
metB
metC
metE
metF
metR
metK
Forward primer
ACCATTGGTGGGTACTAAACC
CAA TAT GAC GTA GGC CTG AT
GGT ACG TTC TTT AAT ACC TTC G
TTA CCA GAT CCA GCT CTC C
GTG AAG ATC ATC CGT TGG
CTC GTC CAC TTC GTC CAG
GCG AAA CCA CGA GA A A AC TC
Reverse primer
ACAGTAGAAATTATTCAG ATG CTC
AGC ACC ACC TTC CAG TTC
CGC TTG TTG TAA GGA GAA AT
ATG ATC GTA CCA GGC AAA AT
AAT GCC TTT AAT AAT GCT GTG
GCT AAT TTG CGG CAG TAC CT
ACG GGT GAT CTC TTC GAT GT
Expected
bands
934bp
880 bp
833 bp
877 bp
754 bp
922 bp
841 bp
34
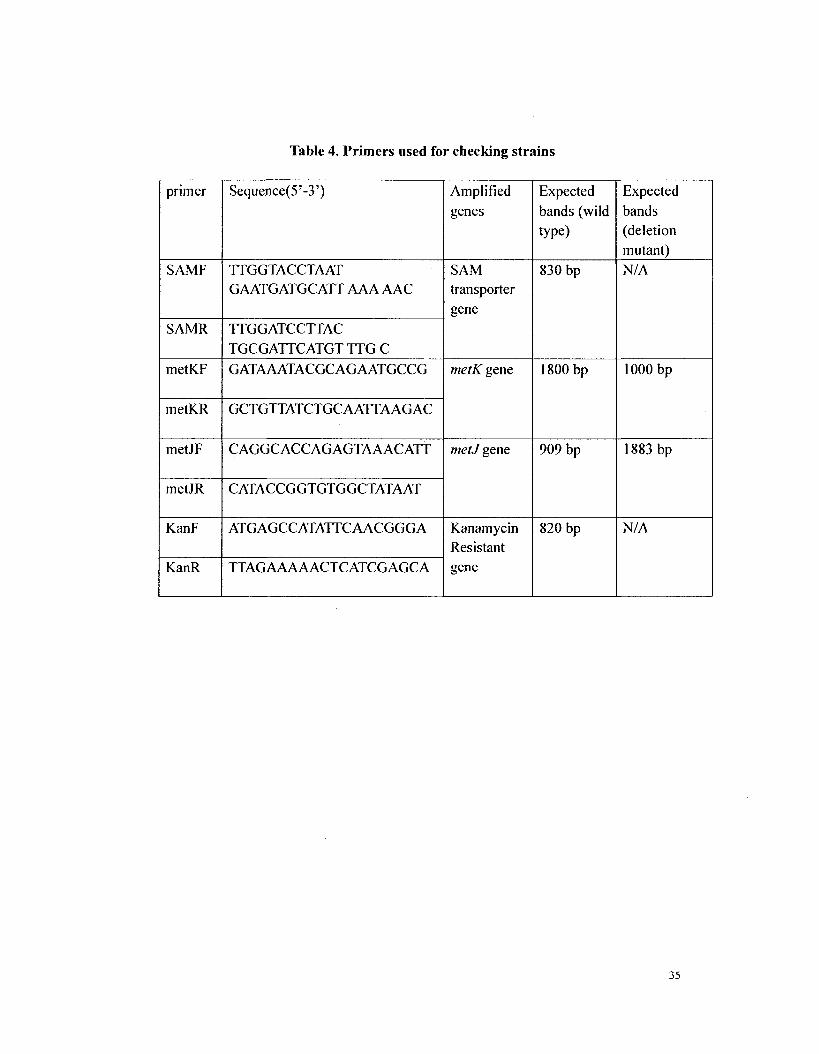
Table 4. Primers used for checking strains
primer
SAMF
SAMR
metKF
metKR
metJF
metJR
KanF
KanR
Sequence(5'-3')
TTGGTACCTAAT GAATGATGCATT AAA AAC
TTGGATCCTTAC TGCGATTCATGT TTG C
GATAAATACGCAGAATGCCG
GCTGTTATCTGCAATTAAGAC
CAGGCACCAGAGTAAACATT
CATACCGGTGTGGCTATAAT
ATGAGCCATATTCAACGGGA
TTAGAAAAACTCATCGAGCA
Amplified genes
SAM transporter gene
metK gene
metJ gene
Kanamycin Resistant gene
Expected bands (wild type)
830 bp
1800bp
909 bp
820 bp
Expected bands (deletion mutant)
N/A
lOOObp
1883 bp
N/A
35

M metA metB metC metE metF metK metR
Figure 4. PCR products for met gene protomers
M: lkb DNA ladder; the expected bands for met genes were showed in Table 3 and all bands from this result match all expected bands. The expect band for metA is 934bp, metB is 880 bp, metC is 833 bp, metE is 877 bp, metF is 754 bp, metK is 922 bp, metR is 841 bp.
36

3.2.2 MNR6 construction and verification
In order to find out why SAM dependent strain can not grow in minimal
medium without methonine, we need study strains, which are SAM dependent and
does not need methionine to grow in the minimal medium. I used miniTnlOKan
insertion to generate this mutant. The details were showed in the chapter 2 (method
part). Prior to finding out which genes were disrupted by TnlO, we should first know
how many TnlO insertions exist on the chromosome of these mutants. To this aim,
southern blot technology was used. It was reported that minTnlOkan used in this
study has a high propobility of causing only one insertion in the chromosome
(Herrero et al., 1990). Thus, 1 chose to use one insertion strategy to design southern
blot to test MNRs strains. HindNl is selected since there is only one site inside
miniTnlOKan. Firstly, I cut genomic DNA of MNRs using Hind\\\ Completely. At the
same time, the probe, Tn 10-transferring sequence, is gotten by Mlu\ cutting from the
pLOF. Then I hybridize the probe with the HindlU treated MNRs genomic DNA. If
there is only one insertion, two hybridization bands would be seen. The diagram of
the probe is shown in Figure 6.
The procedure is showed in method part and the result showed in Figure 7. From
this result, we can see that all MNR mutants have two bands and from the strategy of
southern blot for MNR mutants (Figure 6), we conclude that there is only one TnlO
insertion on the chromosome for all MNRs.
37

plOF/Km
• 5 Kb
NSf M I kb
Probe
Figure 5. The probe of southern blot. The Tn 10 transfer sequence coming from the pLOF which is gotten by Mlul digestion was selected to be the probe of southern blot. M, N, Sf represent the restriction enzyme Mlul, Noil, Sfil respectively.
38

FVobe
Hndlll
L_ H ndl 11 H ndl 11
IS! IS2
• K - miniTnlOKan
Chromosome of MNR mutants
Figure 6. The one insertion strategy of southern blot for MNR mutants. If MNR mutant has only one TnlO insertion, two bands coming from the Hindlll digested products can partially hybridize to the radio labeled probe. So there should be two bands on the film. In the other words, two bands on the southern film can prove that this is only one TnlO insertion in the MNR mutant if the same method were used.
39

MNR2 MNR5 MNR6 MNR7 Control
Figure 7. Southern blot result for MNR mutants.
Control samlple is the probe hybridizes itself.
40

3.2.3 Verification of metJ mutant among MNRs
All MNR mutants cannot make SAM since they contain metK deletion and SAM
has to be provided in any medium for their growth. However, unlike SAD16/pSAM,
they do not need methionine to grow in minimal medium although extracellular SAM
can inhibit methionine biosynthesis. Based on the knowledge that SAM can inhibit
methionine biosynthesis by binding the met regulon repressor MetJ as the corepressor,
there is a chance that metJ mutant could grow without methionine in minimal medium.
In order to verify whether there is metJ mutant among the MNR mutants, 1 used metJ
primers (metJF and metJR), which located upstream and downstream of met J gene to
amply all MNR mutants. The result showed there is a bigger band for MNR6 than
wildtype metJ and the band size that equals wildtype metJ gene plus
TnlO-transferring sequence was gotten. So there is a great chance that metJ gene in
MNR6 is disrupted by miniTnlOKan since PCR product was bigger than wild type
metJ gene 909 bp and the difference band size was matched to miniTnlOKan. The
DNA gel result was shown in Figure 9. In order to know which position was disrupted
in met J gene and whether this insertion mutantion is caused by miniTnlOkan, PCR
product for MNR6 was sequenced using metJF primer. The sequencing result showed
that the 7th to last codon of metJ gene from MNR6 is disrupted. The sequence after
7th to last codon came from the transposon miniTnlOkan. The sequencing result is
shown in Figure 8. From the result of Southern blot, we know that there is only one
miniTnlOkan insertion in MNR6. Thus, by combining all results, 1 can conclude that
41

MNR6 phenotype which it does not need methionine to grow in minimal medium
because met J gene is not functional.
Figure 8
GATTGAGCAAATCCCAAATAGCCGTTAAAATTATATGCATTATCACGCCG ACAGGTGCATTACACGATGTCACGGTAACGCCTGTACGGTAAACTATGCG GGTTTACGGTCAGTACCCACATCAACTGTGTGGTCTGGTCTCAATTTATT GACGAAGAGGATYAAGTATCTCATGGCTGAATGGAGCGGCGAATATATCA GCCCATACGCTGAGCACGGCAAGAAGAGTGAACAAGTCAAAAAGATTACG GTTTCCATTCCTCTTAAGGTGTTAAAAATCCTCACCGATGAACGCACGCG
TCGTCA GGTGAA CAA CCTGCGTCA CGCTA CCAA CA GCGA GCTGCTGTGCG AA CGTTTCTGCA TGCCTTTA CCGGGCAA CCTTTGCCGGA TGATGCCGA TC TGCGTAAA GA GCGCAA CGGCGAAATCCCGGAA GCGGCAAAAGA GATCATG CGTGAGATGGGGATTAACCCCATAAGCGCTAACTTAAGGGTTGTGGTATT ACGCCTGATATGATTTAACGTGCCGATGAATTACTCTCACGATAACTGGT CAGCCATTCTGGTCCATATTGGTAAGCCCGAAGAACTGGATACTTCGGTC
Figure 8. Sequencing result for PCR product of met J gene of MNR6. The italic and bold sequence are completely matched with metJ gene and underline sequence comes from the transposon.
42

M MNR6 M MNR6 Cu
2000 bp-
"l
Figure 9. Approval metJ gene is disrupted in MNR6 mutant by PCR. Using metJF and metJR primers, the expected band of wildtype metJ gene is 909 bp and the expected band for metJ::Tn]0 is 2400 bp.
43

3.2.4 Construction and verification of strain SAD16 AmetJ/pSAM
We know that SAM can bind MetJ and the complex works as the inhibitor to
repress met genes expresson. In order to study the met gene expression influenced by
this mechanism, we need a strain as a negative control which cannot make both SAM
and MetJ. Our SAD16/pSAM is the SAM dependent strain and we need to construct
metJ deletion strain derived from SAD16/pSAM. The PI transduction technology was
used to construct this strain. PI phage from JWK 3909-1 (metJ:: kan) was used to
infect SAD16/pSAM and transductants were selected on LB with kanamycin, SAM.
The tranductant colonies were checked with PCR using the metJ primers (metJF and
metJR). The positive colonies will amplify 1883 bp and the negative clone will
amplify wild type metJ 909 bp. The PCR product gel picture approving the
SAD\6AmetJ/pSAMis shown in Figure 10.
44

M AmetJ AmetK pSAM
2000bp
lOOObp
- • > -
Figure 10. The strain SAD16 AmetJ verification. M: 1 kb DNA ladder. Using metJF and metJR primers, the expected band for AmetJ is 1883 bp( the wildtype is 909 bp). Using metKF and metKR primers, the expected band for AmetK is 1000 bp( the wildtype is 1800 bp). Using SAMF and SAMR primers, the expected band for SAM transporter encoded gene is 830 bp.
45

3.2.5 Construction and verification strain Cu /pSAM/pmet, SAD16/pSAM/pmet,
MNR6/pSAM/pmet, SAD16Am<*//pSAM/pmet
In order to study the met genes expression, I transformed seven pmet plasmids that
contain different met promoter fused to lacZ gene into 4 different strains. They are
wildtype Cu pSAM, which can make SAM itself; SAD16/pSAM, which cannot make
SAM and must use SAM in the medium to support its growth; MNR6/pSAM and
SAD16Awe/J/pSAM, both strains cannot make both SAM and MetJ. The difference
between MNR6/pSAM and SAD16AwefJ/pSAM is that MNR6/pSAM is the met J
insertion strain and SAD16Ame/J/pSAM is the total deletion metJ strain. All
tranformants were verificated by PCR using proper primers. The primer sequences
were shown in Table 3 and Table 4. The SAM-transporter gene for all strains was
verified by amplifying 830 bp band using primers SAMF and SAMR. Deletion of
metK gene in the strain SAD16/pSAM and MNR6/pSAM was verified by amplifying
1000 bp instead of 1800 bp using MetKF and MetKR primers. The miniTnlO
insertion in MNR6 was verified by amplifying 820 bp kanamycin resistant gene using
KanF and KanR primers. Deletion of metJ gene in SAD16 AmetJ was verified by
using metJF and metJR primers and the 1883 bp band was amplified. As for the
verification of pmet, the used primers and expected amplified bands are shown in
Table 3. The all expected bands of strain verification were obtained.
46
3.3 Result for Beta-Galactosidase in rich medium
To study the effects of SAM starvation, I constructed seven met plasmids which
contained the different natural met gene promoter and operator sequences fused in
frame to a promoterless lacZ gene. Then 1 transformed them and a control plasmid
pZl into four strains, wild type (Cu/pSAM), AmetK strain (SAD16/pSAM), tsmetK
AmetJ double deletion strain (SAD16 AmetJ/pSAM) and methionine-non requiring
mutant (MNR6/pSAM). The details of sample preparation and measuring
Beta-Galacdosidase have been shown in chapter 2 (method section). The measured
Beta-Galactosidase coming from the lacZ gene should reflect the expression of met
gene in one particular strain. Through Beta-Gal activity data in the same strain, we
can compare the met gene expression in vivo between treated SAM and starved SAM
conditions. All the data coming from rich medium are shown in Table 5 .
I chose Cu/pSAM/pmet as negative control, which contains the wild type metK
gene and can make intracellular SAM itself. Theoretically, the changed extracellular
SAM should have nearly no effect on regulating met gene expressions in this strain.
The result showed that, for the same met gene, the Beta-Gal units is relatively smaller
in the strain Cu/pSAM/pmet than in other metK deficient strains under both conditions
with and without SAM in rich medium. Moreover, the no SAM /SAM ratio data
showed that all met gene expression has no siganificant increase when starving
extracellular SAM in rich medium. Although both metB and metR increased 3.5 times
after "starving" SAM, which is much smaller than in SAD16pSAMpmet strain (both
increased nearly 20 times after starving SAM). Therefore, we can conclude that
47

reducing exogenous SAM concentration can not significantly increase met gene's
expression in Cu/pSAM/pmet.
The metK defective strain SAD16/pSAM cannot make SAM itself and it needs to
get extracellular SAM to support its growth. In addition, this strain contains the
wildtype MetJ protein. According to the previous in vitro work, met genes can be
inhibited by the MetJ-SAM mechanism, the expression of met gene in
SAD16/pSAM/pmet should be inhibited if SAM is present in the medium. The details
how to grow SAD16/pSAM and how to measure Beta-Galactosidase have been
shown in chapter 2(method part). From the result, we can see that SAM depletion
leads to a nearly 20 times expression of metB and metR. Moreover, it is surprised to
observe that no dramatically influences were seen in other met genes.
MNR6/pSAM is a metKmA metJdefective strain. Theoretically, the expression of
met gene cannot be influenced by the MetJ-SAM mechanism. The growth condition
of MNR6/pSAM was exactly the same as the one of SAD16/pSAM except that
40ng/ml kanamycin was put in the medium. Kanamycin resistant came from the
miniTnlOkan insertion. The details of culture growth were shown in method part. The
results of met gene expression in vivo in MNR6/pSAM in rich medium (Table 5)
showed that, for all the met genes that we tested, depletion of SAM cannot upregulate
their gene expression, except metE, which has a little increase (2.2 times). Some
genes expression became lower, which is probably caused by the influence of SAM
starvation (the explaination is shown in the discussion chapter). The relative higher
Beta-Gal data of all met genes in MNR6/pSAM/pmet than in SAD16/pSAM/pmet
48
with SAM was gotten, except metE. This can explain that met gene expression is
inhibited when both MetJ and SAM exist and no inhibition when only SAM exists.
The data also implied that except the MetJ-SAM mechanism, there is perhaps another
SAM-involving mechanism of regulating metE gene.
As MNR6/pSAM/pmet, SAD16A/»e/J/pSAM/pmet is also a metK and metJ
defective strain. The only difference is that SAD16Awe/J/pSAM/pmet is the total
metJ deletion and MNR6/pSAM/pmet is metJ deficient strain, which is disrupted by
TnlO at the last 7th codon. The growth condition of SAD16Ame/J/pSAM/pmet was
exactly the same as the one of MNR6/pSAM/pmet. The kanamycine resistance of
SAD16Ame/J/pSAM/pmet comes from the deletion of metJ gene instead of coming
from the miniTnlO insertion. The details of culture growth and Beta-Galactosidase
measurement were shown in the method part. The result showed thatm, for all the met
genes, there is no significant increase of Beta-Gal units after depletion of SAM (Table
5). It reconfirms that MetJ-SAM mechanism is not functional in both MetJ and SAM
deficient strain. In addition, the Beta-Gal units for SAD16Ame/J/pSAM/pmet strain
with SAM is more than 10 times higher than SAD16 /pSAM/pmet strain with SAM
for most tested met genes, except metK, which is two fold. Furthermore, we can see
that for both SAM and no SAM conditions, SAD16Awe/J/pSAM/pmet has higher
Beta-Gal unit than MNR6/pSAM/pmet, although they have similar genetic
background. The possible explaination is that the truncated MetJ protein in
MNR6/pSAM/pmet has part of MetF function, such as binding to MET boxes on the
operator region of met genes. This binding somehow influences the met gene
49

expression. Moreover, SAM is not involved in this truncated MetJ binding process.
In summary, from the data in the rich medium, we can conclude that MetJ-SAM
mechanism is functional in vivo. In addition, metB and metR are most sensitive to be
regulated by this mechanism in LB.
3.4 Result for Beta-Galactosidase in minimal medium
Since SAD16Ame?J/pSAM/pmet and MNR6/pSAM/pmet grow very slow in
minimal medium and they cannot provide enough cells to measure Beta-Galactosidase,
1 only studied the effect of SAM in minimla medium NIV for strain Cu/pSAM/pmet
and SAD16/pSAM/pmet. Since SAD16/pSAM/pmet needs both SAM and methionine
in minimal medium, in order to keep the same growth condition, 1 put 40 ug/ml
methionine in minimal medium for Cu/pSAM/pmet. The details of growing strains
and Beta-Galactosidase measurement were shown in method part. The result of
minimal medium is shown in Table 6.
From the result of Cu/pSAM/pmet in minimal medium, depletion exogenous
SAM cannot increase met genes expression significantly (The no SAM/SAM ratio
ranges from 0.5 to 2.8). Cu/pSAM/pmet contains the wild type metK gene and can
make intracellular SAM itself. Theoretically, the changed extracellular SAM should
have almost no effect on regulating met gene expressions in this strain. The Beta-Gal
data here imply that above theory can be applied in Cu/pSAM/pmet in minimal
medium.

Table 5. Effect of SAM starvation in rich medium (LB)
Medium A (LB glucose 200uM SAM with antibiotic) Medium B(LB gluscose no SAM with antibiotic)
Beta-Gal units
Strain
\Medium
plasmids\
pmetA
pmetB
pmetC
pmetE
pmetF
pmetK
pmetR
pZl
Cu/ pSAM/pmet
A
38
8
220
51
125
2463
29
366
B
79
28
311
53
78
6253
101
435
B/
A
2.1
3.5
1.4
1.1
0.6
2.5
3.5
1.2
SAD16/pSAM
/pmet
A
162
22
463
166
7
161
0
692
7
356
201
B
852
429
951
249
9
358
5
740
5
684
9
125
B/
A
5.2
19.
2
2.1
1.5
2.2
1.1
19.
2
0.6
SAD16A/ne/y/pSA
M/pmet
A
1109
5
537
1039
0
1321
8
1844
0
1169
3
1836
2
1769
B
1192
5
676
8147
1240
3
2361
7
1851
5
1294
5
838
B/
A
1.1
1.3
0.8
0.9
1.3
1.6
0.7
0.5
MNR6/pSAM/pmet
A
1128
594
2317
1527
5363
1628
4
2987
589
B
553
268
1918
3308
5486
11741
3108
312
B/A
0.5
0.5
0.8
2.2
1.0
0.7
1.0
0.5
51

For the strain SAD16/pSAM/pmet in minimal medium, the result showed that
except melK, the depletion of exogenous SAM can dramatically increase nearly all
tested met genes' expression (from nearly 10 times to 100 times, according to
different met gene tested). This result strongly supports the MetJ-SAM inhibition
mechanism for met genes. Also this result shows that unlike other met genes, metK
gene has relatively little affected by exogenous SAM.
52

Table 6. Effect of SAM starvation in minimal medium (NIV)
Medium C (NIV Glu 40 ug /ml methionine 200uM SAM with antibiotic) Medium D (NIV Glu 40 ug/ml methionine with antibiotic)
Beta-Gal units Strain
\ . Medium
pla^mids
pmetA pmetB
pmetC pmetE
pmetF pmetK
pmetR
pZl
Cu/pSAM/pmet
C
703 81
1651
1292 2042 3853
984
1463
D
353 201
1795
588 3627
6889
2758
3113
D/C
0.5 2.5
1.1
0.5 1.8 1.8
2.8
2.1
SAD16/pSAM/pmet
C
391 16
407
86 248 3749
478 1512
D
3857 697
10564
8695 11881 15534
8889 1205
D/C
9.9 44.2
26.0
100.8 48.0 4.1
18.6
0.8

4 Discussion
The present work deals with the study of the physiological roles of SAM on
regulating methionine biosythesis by using a SAM transporter. The hypothesis of this
work is that SAM deficiency can increase the expression of genes encoding enzymes
of Met biosynthesis (met genes) under the SAM-MetJ mechanism.
Previous researchers have achieved reduced intracellular SAM level by regulating
its synthesis or degradation indirectly. Wei reduced the internal pool with a mutation
in the metK gene (Wei and Newman, 2002) and Hughes used a plasmid expressing the
SAM hydrolase gene (Hughes, 2006). The role of SAM has not been shown directly
in vivo since exogenously provided SAM cannot cross the E. coli membrane and
metK is an essential gene (Wei and Newman, 2002). Recently, LaMonte and Hughes
circumvented this problem with the use of T3 SAM hydrolase carried on a relatively
high copy vector to lower endogenous SAM levels (LaMonte and Hughes, 2006).
They showed that the ensuing reduction in the cellular SAM pool induced the met
regulon. When SAM-hydrolase is used, SAM pools cannot be completely depleted
since the synthetase is still present. In fact, sudden changes in the intracellular
concentration are not possible since this system requires a change in the concentration
of the protein due to a gradual decrease in SAM. Thus, they could not study the
effects of higher than normal concentrations of SAM. In addition, they studied some
met genes from E. coli and some from Salmonella typhimurium.
The following sections are devoted to the discussion of my own data and
54

comparability with Dr. Hughes group's data on the effect of SAM on methionine
biosynthesis.
4.1 Regulation of intracellular levels of SAM
] used SAM transporter gene to alter the intracellular SAM concentration, which
was obtained from a screen of a cosmid bank of Rickettsia prowazekii (Tucker A.M.,
2003), and cloned into pttetOl vector by Reyes(Reyes, 2005). The SAM transporter
used in this work shows clear advantages over other systems in the rapid regulation of
intracellular concentrations of SAM, being only regulated by the concentration of
SAM in the medium and the amount of the transporter in the cell.
SAM is chemically unstable and it can degrade even at -20°C. In order to examine
the stability of SAM, I tested 100 uM SAM in double distilled water immediately and
incubated at 37°C for 20 hours in mass spectrometry. From the results, I can roughly
estimat that about 50% SAM degraded after incubating 37°C for 20 hours in pure
water. Since it is reported that 50 uM extracellular SAM is not enough to support
chromosome DNA methylation of SAM deficient strain (Reyes, 2005), 1 chose to use
200 uM SAM instead of 100 uM to grow metK deficient strain to make sure cells can
get enough SAM through their growth. Moreover, methionine cannot be produced
after SAM degradation (methionine m/z is 150)(Figure 3). Thus, SAM degradation
cannot contribute methionine which is required by SAM deficient strain when it
grows in minimal medium.
55

4.2 The effect of SAM on met gene expression in LB broth medium
In order to study the effect of SAM on expression of met genes, seven plasmids
which contain met genes promoter fused with lacZ gene in four different strains were
used. All the strains contain SAM transporter. They are wild type strain
Cu/pSAM/pmet which contains the wildtype metK gene, metK deletion strain
SAD16/pSAM/pmet, metK met J double deletion strain SAD16Ame/J/pSAM/pmet and
one of methionine-non requiring mutants, MNR6/pSAM/pmet, which is metK
deletion strain as well as its met J gene is disrupted at the last 7th codon.
In the wild type strain Cu/pSAM/pmet, which contains the wild type SAM pool,
the result shows that reducing exogenous SAM concentration cannot increase met
gene's expression siganificantly. The experimental result of wild type is consistent
with the expected result, which can be explained theorically. Since it contains metK
gene, it has physiological SAM pool inside cells. This intracellular SAM pool has a
big capacity. In Cu/pSAM/pmet even with SAM transporter, the exogenous SAM is
hard to influence intracellular SAM pool. Dr. Hughes group cannot study the effect of
extracullar SAM on metK* strains since instead of using depletion extracullar SAM to
deplete intracellular SAM pool, they used T3 SAM hydrolase to deplete SAM pool.
In the metK defective strain, the result shows that SAM depletion leads to a nearly
20 times increase of expression of metB and metR. We are surprised to observe that no
dramatically influences were seen in other met genes. We got the similar result for
metB and metR (both increase 17 times, after decrease SAM pool) in metK mutant
with Dr. Hughes group's data published at 2006 (Table 7). However, their data also
56

showed that metE and metF derepressed after decreasing SAM pool in metKy^YnS
strains. This may be explained that they used met promoter from S. typhimurium
instead of from E. coli. The difference may be caused by the difference of promoter
sequence between E. coli and S.typhimurium. This also can be explained by different
metK defective strain. Dr.Hughes used metK:\Yn5 strains, which can make enough
SAM to support cell growth since their metK mutant can grow in rich medium without
SAM. However, our AmetK strain cannot make SAM at all and it must get exogenous
SAM to support its growth. The fact that we starved SAM by depletion SAM in the
medium actually can cause its death. When we starved SAM in the medium, the
intracellular SAM pool became lower and lower as AmetK strain continued growing
and dividing within 4 hours, around 3 generations, proved the plating on SAM
plate(Reyes, 2005). When SAM pool became low enough, many SAM-involving
metabolisms in the cells stopped, for example, DNA stop replicating since it need
SAM to initate and ribosome stops making proteins due to the fact that some residues
need to be methylated before start to work. Resulted in many reasons, the cells die of
SAM starvation. So the depletion of SAM can cause AmetK strain grow slow and the
mechanism of gene expression also is influenced and is not efficient as in normal
SAM pool. So if we counted the effect of SAM starvation, actually metB and metR
gene expression should be more than 20 times after depletion SAM. And metE and
metF expression should be higher than they seem to be. Moreover, we have to
mention that when we compare the Beta-Gal units between AmetK
strain(SAD16/pSAM/pmet) with SAM and wild type strain (Cu/pSAM/pmet) without
57

SAM in LB, we found that except metK, all other met genes got much higher units in
AmetK strain than in wild type (Table 5). This represented that even with enough
SAM supply for both strains, nearly all met genes were more repressed in wildtype
strain than AmelK strain, except metK gene. This may be explained that no met box
locates the promoter of the metK gene. Thus the expression of metK has little been
effected by SAM-MetJ mechanism. Moreover, this comparation showed that there is
more concentration of intracellular SAM in wild type strain than that in metK
defective strain. Therefore, we can conclude that in rich medium, SAM transporter
cannot work efficient enough to reach the same SAM pool as in the wild type.
The previous research showed that cells containing metJ allele can produce
constitutive expression of most genes in the met regulon and excess production and
even export of methionine and its metabolites (Usuda and Kurahashi, 2005). To prove
whether MetJ as an aporepressor binds corepressor SAM to become repressor
complex, which can block met genes transcription. We removed the corepressor and
prevented formation of the complex to see whether met genes can be upregulated.
Thus we constructed AmetK AmetJ double strain (SAD16A/we/J/pSAM/pmet) to see
whether in vivo data can support the model of a MetJ-SAM repressor complex. The
results showed that for all the met genes that we tested, depletion of SAM cannot
upregulate. Moreover, the Beta-Gal units for AmetK AmetJ strain
(SAD]6Ame/J/pSAM/pmet) in the medium with SAM is more than 8 times higher
than AmetK strain (SAD16/pSAM/pmet) in the same medium for most tested met
genes, except metK, which is nearly two fold (Table 5). This result is consistent with
58

that of Dr.Hughes* group. Dr.Hughes* group also got more than 10 times expression
of metB, E, F, R of the metJ defective strain than that of those in wild type strain when
there is no T3 SAM hydrolase (
Table 8). It confirms that there is very similar influence of MetJ deficiency on both
met promoter in E.coli and in the S.typhimurium.
We know that AmetK strain needs exogenous supply of SAM in every medium.
Nonetheless, addition of SAM is not sufficient to allow growth of the metK mutant in
minimal medium (Reyes, 2005). Methionine must also be provided, consistent with
the idea that methionine is not a repressor, and SAM inhibits both methionine and
SAM methionine biosynthesis. By using MiniTnlOKan, we selected the mutant that
can grow only with SAM in minimal medium. We called them MNR mutant. MNR6
is one of them.
By sequencing result, we found that the last 7l codon is disrupted in
MNR6mutant (
Figure 8). It means that this mutant is MetJ mutant. We tested met genes expression in
MNR6 mutant. We found that in this mutant, as SAD16A/we/J/pSAM/pmet, depletion
of SAM cannot increase met genes expression in MNR6/pSAM/pmet. Some met
genes expression became lower, which is caused by the influence of SAM starvation.
And nearly for all the met genes, we got relatively high data for MNR6/pSAM/pmet
in the LB with SAM compared to AmetK strain (SAD16/pSAM/pmet) in the same
medium. This also confirms that MetJ is the important molecule for repressor of met
59

genes. Moreover, the data of MNR6/pSAM/pmet in the LB with SAM is much lower
than that of AmetK AmetJ double deletion strain (SAD16Ame/J/pSAM/pmet) for all
the met genes except metB and metK in the same medium (Table 5). All these data
showed that MetJ in MNR6 may work at part of function such as binding to MET
boxes on the promoter region of met genes. This binding somehow influences the met
gene expression. Jn addition, SAM is not involved in this truncated MetJ binding
process. From the 2.2 A resolution of wildtype MetJ crystal structure, one can
conclude that MetJ dimers bind to two MET box site of DNA sequence (He et al.,
1996). However, other recent data suggested that there is a structural basis for the
differences observed in the regulatory effectiveness of MetJ for the various genes of
the met regulon(Augustus et al., 2006). Moreover, SAM as the co-repressor, can lie on
the opposite side of the protein from the DNA-binding motif (Saint-Girons et al.,
1986; Rafferty et al., 1989). From the concerved domain analysis (Figure 11),
although 3D structure showed that SAM binding sites and DNA binding sites locate at
the opposite direction, their primary sequence location is very near. But none of them
locate at C terminal end of MetJ protein. From above, it seems that MNR6 MetJ
mutant has intact corepressor binding sites and DNA binding sites. However, the data
1 showed in this thesis suggested that disrupted C terminal of MetJ will definitely
influence its SAM binding and its repressor function. The possible explanation is that
the disruption of C terminal of MetJ will influence the conformation of corepressor
binding site. And this can lead to SAM can not bind MetJ correctly anymore and MetJ
loses its function for repressor.
60

1 IS 31 « iH 75 91 16 I I, I I L ^ „ J ± l _ J m l J L u „ ^ „ ^ ^ I I i J ) i I
Query seq, ^^^^^mm^^^^^^^^^^^^^^m^^^^^^mmmm aftRHHr binding sitts 4 M t .144 Mi A 11
Df« bindinj jiit 4 M M I I 4 Mi diwizjlim initrfsct M I iiiMiAMMi 1 H 1 i i M M Mi i
Figure 11 Concerved domain analysis for MetJ
The ruler represents the amino acid sequence of MetJ (105 amino acids). Corepressor binding sites:40,43..44,57,60..62,64..66,68,71 ..72; DNA binding sites: 18, 22..26,28,41,53..55; dimerization inferface sites: 10..11,13,20..31,33..34,36..37,40,55,58..59,61..62, 64..66,71
61

Table 7. Data comparation between this study and Dr.Hughes's study for metK deficient strain in rich medium
[the data of Dr.Hughes' study was refered from the published paper (LaMonte and Hughes, 2006) ]
Medium
strain
Met gene-lacZ fusion
Origin of met promoter in
met-lacZ fusion
^ \ . plasmid
ratio ^ \ ^
metA
metB
metC
metE
metF
metK
metR
This study
LB
SAD16/pSAM/pmet
{AmetK)
plasmid
E.coli
No SAM/SAM
5.2
19.2
2.1
1.5
2.2
1.1
19.2
Dr.Hughes's study
YT
metK:: Tn5 cells
chromosome
S.typhimurium
PHBBR2/pBR322a
N/A
16.8
N/A
13.4
14.8
N/A
16.7
a : pHBBR2: T3 SAM hydrolase expression vector, whose backbone vector is pBR322 pBR322: Backbone of expression vector, no T3 SAM hydrolase encoded gene. This
is the negative control.
62

Table 8. The result comparation between this study and Dr.Hughes's study for metJ deficient strain in rich medium
[the data of Dr.Hughes' study was calucated according to the published data (LaMonte and Hughes.
2006) ]
Medium
strain
Met gene-IacZ fusion
Origin of met promoter in
met-lacZ fusion
^ • \ . plasm id
ratio ^ \ ^
metA
metB
metC
melE
metF
metK
metR
This study
LB+200uMSAM
SAD 16 AmetJ
/pSAM/pmet
SAD16/pSAM/pmet
plasmid
E.coli
SAD16Amer//SAD16
68
24
22
8
11
1.7
52
Dr.Hughes's study
YT
metJ:: Tn5/pBR322b
BW5457pBR322
chromosome
S.typhimurium
metJ:: Tn5/ BW545
N/A
16.7
N/A
10
16
N/A
13.4
a : BW545 is the wildtype strain which is used to make metJ:: Tn5 b: pBR322: Backbone of expression vector, no T3 SAM hydrolase encoded gene. This is the negative control.
63

4.2 The effect of SAM on met gene expression in minimal medium
When we grew AmetK strain (SAD16/pSAM) in minimal medium, we found that
we have to put SAM as well as methionine to support cell growth. Thus, when we
checked met gene expression in minimal medium, we always put 40 ug/ml
methionine in the medium for both wild type (Cu/pSAM/pmet) and AmetK cell
growth. The data showed that in wild type strain, depletion exogenous SAM cannot
increase met genes expression. However, when we observe the data of AmetK
strains(SAD16/pSAM/pmet) in the minimal medium, depletion of exogenous SAM
can dramatically increase nearly all tested met genes' expression (from 10 times to
100 times, according to different met gene tested). The data from minimal medium
strongly supports SAM working as corepressor for regulating met genes expression.
Also, we noticed that in minimal medium, nearly all met genes had higher expression
in wild type strain (Cu/pSAM/pmet) in the minimal medium without SAM than in
AmetK strains (SAD16/pSAM/pmet) in the minimal medium with SAM. It means that
SAM pool in AmetK strains in minimal medium is higher than SAM pool in the wild
type. The above result is opposite to that in LB, in which SAM pool in the AmetK
strains is much less compared to wild type strain. Moreover, the above result can be
used to explain why we have to put methionine in the minimal medium to grow
AmetK strains. The reason is that the intracellular SAM pool in AmetK strains is much
higher than wild type, and thus higher SAM pool can inhibit more methionine
biosynthesis. Therefore, we have to put methionine in the medium.
64

4.3 Comparison the effect of SAM on met gene expression in rich and minimal
medium
Other questions arose when we compared the data from rich medium and minimal
medium (Table 9). From the result of no SAM/SAM ratio, we can find that met genes
expressions are more highly regulated by SAM in minimal medium than in rich
medium. It indicates that there is another regulator for methionine biosynthesis in rich
medium. It can also be seen that in wild type strain, except metK, all the other met
genes enzyme activity is much higher in minimal medium without SAM than in LB
without SAM. This result represents that even for wild type strain, intracellular SAM
pool can change in different media. In this dissertation, intracellular SAM pool in LB
is much higher than that in minimal medium in wildtype strain. This phenomenon
may be explained by using the mechanism of leucine responsive protein (Lrp), which
can control the expression of metK gene, since metK gene is induced by leucine and is
repressed by Lrp (Newman et al., 1998). In rich medium, which contains lots of
leucine, Lrp binds to leucine to derepress metK gene expression. However, in minimal
medium, there is no any leucine there, so Lrp can bind the promoter region of metK
and repress its expression. When we compared the data of AmetK strain in rich
medium with SAM and minimal medium with SAM, the result is opposite to that in
wild type strain without SAM in both media. For AmetK strain, nearly all the met
genes have higher expression in LB with SAM than in minimal medium with SAM.
This trend implies that SAM pool is higher in minimal medium than in LB. It can be
explained by the different efficiency of SAM transporter in different medium.
65

Table 9. The comparation of effect of SAM in rich and minimal medium for Cu/pSAM/pmet and SAD16/pSAM/pmet
Medium A (LB glucose 200uM SAM with antibiotic) Medium B(LB gluscose no SAM with antibiotic)
Medium C (NIV Glu 40 ug /ml methionine 200uM SAM with antibiotic) Medium D (NIV Glu 40 ug /ml methionine with antibiotic)
Beta-Gal units
Strain
Medium
plasmid
pmetA
pmetB
pmetC
pmetE
pmetF
pmetK
pmetR
pZl
Cu/
A
38
8
220
51
125
2463
29
366
C
703
81
1651
1292
2042
3853
984
1463
C/A
18.5
10.1
7.5
25.3
16.3
1.6
33.9
4.0
pSAM/pmet
B
79
28
311
53
78
6253
101
435
D
353
201
1795
588
3627
6889
2758
3113
D/B
4.5
7.2
5.8
11.1
46.5
1.1
27.3
7.2
B/A
2.1
3.5
1.4
1.1
0.6
2.5
3.5
1.2
D/C
0.5
2.5
1.1
0.5
1.8
1.8
2.8
2.1
SAD16/pSAM7
A
162
22
463
1667
1610
6927
356
201
C
391
16
407
86
248
3749
478
1512
C/A
2.4
0.7
0.9
0.1
0.2
0.5
1.3
7.5
B
852
429
951
2499
3585
7405
6849
125
D
3857
697
10564
8695
11881
15534
8889
1205
amet
D/B
4.5
1.6
11.1
3.5
3.3
2.1
1.3
9.6
B/A
5.2
19.2
2.1
1.5
2.2
1.1
19.2
0.6
D/C
9.9
44.2
26
100.8
48
4.1
18.6
0.8
66

4.4 Conclusions
From the above, I can reach the following conclusions according to the data I got.
1. In general, all results support the in vitro model of MetJ-SAM repressor
complex binding met gene promoters to block their transcription.
2. AH met genes expressions are more highly regulated by SAM in minimal
medium than in rich medium. It indicates that there is another regulator for
methionine biosynthesis in rich medium.
3. MetK gene is surprisingly highly expressed and relatively little affected by
exogenous SAM.
4. In MNR6, met genes expressions are highly derepressed, which, however, can
not reach the level in AmetJ strain. It suggests that the truncated MetJ in
MNR6 retains the considerable function.
67

Reference
Augustus, A.M., Reardon, P.N., Heller, W.T. and Spicer, L.D. Structural basis for the
differential regulation of DNA by the methionine repressor MetJ. J Biol Chem
281 (2006), pp. 34269-76.
Banerjee, R. Radical carbon skeleton rearrangements: catalysis by coenzyme
B12-dependent mutases. Chem Rev 103 (2003), pp. 2083-94.
Belfaiza, J., Parsot, C , Martel, A., de la Tour, C.B., Margarita, D., Cohen, G.N. and
Saint-Girons, 1. Evolution in biosynthetic pathways: two enzymes catalyzing
consecutive steps in methionine biosynthesis originate from a common
ancestor and possess a similar regulatory region. Proc Natl Acad Sci US A 83
(1986), pp. 867-71.
Cowan, J.M., Urbanowski, M.L., Talmi, M. and Stauffer, G.V. Regulation of the
Salmonella typhimurium metF gene by the MetR protein. J Bacteriol 175
(1993), pp. 5862-6.
Driskell, L.O., Tucker, A.M., Winkler, H.H. and Wood, D.O. Rickettsial
metK-encoded methionine adenosyltransferase expression in an Escherichia
coli metK deletion strain. J Bacteriol 187 (2005), pp. 5719-22.
Greene, R.C., Escherichia coli and Salmonella: cellular and molecular biology, 2nd
Edition ed. American Society for Microbiology Press, Washington D.C.
(1996).

Greene, R.C., Hunter, J.S. and Coch, E.H. Properties of metK mutants of Escherichia
coli K-12. JBacleriol 115 (1973), pp. 57-67.
He, Y.Y., Stockley, P.G. and Gold, L. In vitro evolution of the DNA binding sites of
Escherichia coli methionine repressor, MetJ. JMol Biol 255 (1996), pp. 55-66.
Henikoff, S., Wallace, J.C. and Brown, J.P. Finding protein similarities with
nucleotide sequence databases. Methods Enzymol 183 (1990), pp. 111-32.
Herrero, M., de Lorenzo, V. and Timmis, K.N. Transposon vectors containing
non-antibiotic resistance selection markers for cloning and stable
chromosomal insertion of foreign genes in gram-negative bacteria. J Bacteriol
172 (1990), pp. 6557-67.
Holloway, C.T., Greene, R.C. and Su, C.H. Regulation of S-adenosylmethionine
synthetase in Escherichia coli. J Bacteriol 104 (1970), pp. 734-47.
Hughes, J.A. In vivo hydrolysis of S-adenosyl-L-methionine in Escherichia coli
increases export of 5-methylthioribose. Can J Microbiol 52 (2006), pp.
599-602.
Kim, P.W.K.a.S.: Protein methylation. A Wiley-lnterscience Publication, John Wiley
& Sons, N.Y. (1980).
Kirby, T.W., Hindenach, B.R. and Greene, R.C. Regulation of in vivo transcription of
the Escherichia coli K-12 metJBLF gene cluster. J Bacteriol 165 (1986), pp.
671-7.
LaMonte, B.L. and Hughes, J.A. In vivo hydrolysis of S-adenosylmethionine induces
the met regulon of Escherichia coli. Microbiology 152 (2006), pp. 1451-9.
69

Lawrence, D.A., Smith, D.A. and Rowbury, R.J. Regulation of methionine synthesis
in Salmonella typhimurium: mutants resistant to inhibition by analogues of
methionine. Genetics 58 (1968), pp. 473-92.
Lee, L.W., Ravel, J.M. and Shive, W. Multimetabolite control of a biosynthetic
pathway by sequential metabolites. J Biol Chem 241 (1966), pp. 5479-80.
Levit M.N., L.Y.a.S.J.B., Molecular Microbiology (1998).
Lhoest, J. and Colson, C. Cold-sensitive ribosome assembly in an Escherichia coli
mutant lacking a single methyl group in ribosomal protein L3. Eur J Biochem
121 (1981), pp. 33-7.
Limbach, P.A., Crain, P.F. and McCloskey, J.A. Summary: the modified nucleosides
ofRNA. Nucleic Acids Res 22 (1994), pp. 2183-96.
Lutz, R. and Bujard, H. Independent and tight regulation of transcriptional units in
Escherichia coli via the LacR/O, the TetR/O and AraC/Il-12 regulatory
elements. Nucleic Acids Res 25 (1997), pp. 1203-10.
M.G, M.: Methylation of DNA. In: F.C, N. (F.C, N.)F.C, N.s), Escherichia coli and
Salmonella: cellular and molecular biology. American Society for
Microbiology Press, Washington B.C. (1996), pp. p. 782-791.
Marconi, R., Wigboldus, J., Weissbach, H. and Brot, N. Transcriptional start and
MetR binding sites on the Escherichia coli metH gene. Biochem Biophys Res
Commun 175 (1991), pp. 1057-63.
Marines, F., Manfield, I.W., Stead, J.A., McDowall, K.J. and Stockley, P.G.
Transcript analysis reveals an extended regulon and the importance of
70

protein-protein co-operativity for the Escherichia coli methionine repressor.
Biochem J396 (2006), pp. 227-34.
Maxon, M.E., Redfield, B., Cai, X.Y., Shoeman, R., Fujita, K., Fisher, W., Stauffer,
G., Weissbach, H. and Brot, N. Regulation of methionine synthesis in
Escherichia coli: effect of the MetR protein on the expression of the metE and
metR genes. Proc Natl Acad Sci USA86 (1989), pp. 85-9.
Maxon, M.E., Wigboldus, J., Brot, N. and Weissbach, H. Structure-function studies
on Escherichia coli MetR protein, a putative prokaryotic leucine zipper protein.
Proc Natl Acad Sci USAS7 (1990), pp. 7076-9.
Miller: Experiments in molecular genetics. Cold Spring Harbor Laboratory Press,
Cold Spring Harbor, N.Y. (1972).
Miller, D.J., Ouellette, N., Evdokimova, E., Savchenko, A., Edwards, A. and
Anderson, W.F. Crystal complexes of a predicted
S-adenosylmethionine-dependent methyltransferase reveal a typical AdoMet
binding domain and a substrate recognition domain. Protein Sci 12 (2003), pp.
1432-42.
Neidhardt, F.C., Escherichia coli and Salmonella: cellular and molecular biology.
American Society for Microbiology Press, Washington D.C. (1996).
Newman, E.B., Budman, L.I., Chan, E.C., Greene, R.C., Lin, R.T., Woldringh, C.L.
and D'Ari, R. Lack of S-adenosylmethionine results in a cell division defect in
Escherichia coli. JBacteriol 180 (1998), pp. 3614-9.
71

Newman, E.B. and Lin, R. Leucine-responsive regulatory protein: a global regulator
of gene expression in E. coli. Annu Rev Microbiol. 49 (1995), pp. 747-75.
Phillips, S.E., Manfield, I., Parsons, I., Davidson, B.E., Rafferty, J.B., Somers, W.S.,
Margarita, D., Cohen, G.N., Saint-Girons, 1. and Stockley, P.G. Cooperative
tandem binding of met repressor of Escherichia coli. Nature 341 (1989), pp.
711-5.
Posnick, L.M. and Samson, L.D. Influence of S-adenosylmethionine pool size on
spontaneous mutation, dam methylation, and cell growth of Escherichia coli. J
Bacteriol 181 (1999), pp. 6756-62.
Rafferty, J.B., Somers, W.S., Saint-Girons, I. and Phillips, S.E. Three-dimensional
crystal structures of Escherichia coli met repressor with and without
corepressor. Nature 341 (1989), pp. 705-10.
Reyes, R.: Studies on a strain of Escherichia coli K-12 dependent on an exogenous
supply of S-adenosylmethionine, Biology department. Concordia University
(2005).
Rodionov DA, V.A., Mironov AA, Gelfand MS. Comparative genomics of the
methionine metabolism in Gram-positive bacteria: a variety of regulatory
systems. Nucleic Acids Res 32 (2004), pp. 3340-53.
Roje, S. S-Adenosyl-L-methionine: beyond the universal methyl group donor.
Phytochemistry 67 (2006), pp. 1686-98.
Rozenski, J., Crain, P.F. and McCloskey, J.A. The RNA Modification Database: 1999
update. Nucleic Acids Res 27 (1999), pp. 196-7.
72
Saint-Girons, I., Belfaiza, J., Guillou, Y., Perrin, D., Guiso, N., Barzu, O. and Cohen,
G.N. Interactions of the Escherichia coli methionine repressor with the metF
operator and with its corepressor, S-adenosylmethionine. J Biol Chem 261
(1986), pp. 10936-40.
Sambrook, J. and Russell, D.W., Molecular cloning : a laboratory manual, 3rd ed.
Cold Spring Harbor Laboratory Press, Cold Spring Harbor, N.Y. (2001).
Shoeman, R., Coleman, T., Redfield, B., Greene, R.C., Smith, A.A., Saint-Girons, I.,
Brot, N. and Weissbach, H. Regulation of methionine synthesis in Escherichia
coli: effect of metJ gene product and S-adenosylmethionine on the in vitro
expression of the metB, metL and met J genes. Biochem Biophys Res Commun
133 (1985), pp. 731-9.
Tucker A.M., W.H.H., Driskell L.O. and Wood D.O. S-adenosylmethionine transport
in Rickettsia prowazekii. J. Bacteriol 185 (2003), pp. 3031-3035.
Urbanowski ML, S.L., Plamann LS, Stauffer GV. A new methionine locus, metR, that
encodes a trans-acting protein required for activation of metE and metH in
Escherichia coli and Salmonella typhimurium. J Bacteriol 169 (1987 ), pp.
1391-7..
Usuda, Y. and Kurahashi, O. Effects of deregulation of methionine biosynthesis on
methionine excretion in Escherichia coli. Appl Environ Microbiol 71 (2005),
pp. 3228-34.
Wei, Y. and Newman, E.B. Studies on the role of the metK gene product of
Escherichia coli K-12. Mol Microbiol 43 (2002), pp. 1651-6.
73

Young, C.C. and Bernlohr, R.W. Elongation factor Tu is methylated in response to
nutrient deprivation in Escherichia coli. JBacteriol 173 (1991), pp. 3096-100.