reduced ghg emissions due to compost production and ...orgprints.org/17480/4/17480.pdf · 14...
TRANSCRIPT

Reduced GHG emissions due to compost production and compost use in Egypt
Comparing two scenarios
B. Luske

© [2010] Louis Bolk Instituut
Reduced GHG emissions due to compost production and
compost use in Egypt, Comparing two scenarios, B.
Luske. 2010-016 LbD. 30 pages.

Preface 3
Preface
This study was carried out by B. Luske, a representative of The Louis Bolk Institute, on request of Soil and More
International BV (SMI).
SMI is specialized in the field of composting as an emission reduction methodology and carbon footprint calculations
of products. SMI is often asked by costumers to clarify the emission reduction potential of its composting projects in
various developing countries. Furthermore, costumers are interested in the emission reduction which can be reached
by substituting chemical fertilizers with compost. SMI requested for a science based study where these two topics
are clarified with a case study, which resulted in this document.

Contents 5
Contents
Summary 7
1 Introduction 9
1.1 Compost and climate 9
1.2 Research objective 9
1.3 Research questions 9
2 Methods 11
2.1 Approach 11
2.2 System boundaries 11
2.3 Functional unit 11
2.4 Emission calculations 13
2.4.1 Baseline scenario 13
2.4.2 Compost scenario 14
2.4.2.1 Input materials 15
2.4.2.2 Emissions during composting 16
2.4.2.3 Compost application 17
3 Results 19
3.1 Carbon footprint of compost at farm gate 19
3.2 Carbon footprint of citrus in the baseline and the compost scenario 19
4 Conclusions and discussion 23
4.1 Approach taken to illustrate emission reduction 23
4.2 Emissions due to compost use versus the baseline scenario 23
4.3 Other effects of compost use 24
References 25
Annex 1: Soil emissions 29
Direct and indirect emissions of nitrous oxide 29


Summary 7
Summary
Composting has been acknowledged as an emission reduction methodology by the UNFCCC. The emission
reduction reached by a composting project is determined by comparing the composting scenario with the applicable
baseline scenario. The objective of this study was on the one hand to clarify the emission reduction methodology of a
composting facility in Egypt and on the other hand to extend this methodology with an example to illustrate the effect
of compost use on greenhouse gas emissions. In this study, the emissions in a scenario where compost originating
from a compost facility near Alexandria is used on a citrus farm in Egypt, were compared with a hypothetical baseline
scenario where organic waste is not recycled and chemical fertilizer is used on the farm. The results show that the
composting scenario causes significant lower emissions than the baseline scenario. This is mainly due to the
avoidance of methane emissions from organic waste dumping, but also emissions due to chemical fertilizer
production are avoided. The third reason for lower emission in the composting scenario is soil carbon sequestration.
The composting scenario on the other hand also causes extra emissions due the transportation of biomass and fuel
use for windrow turning. Although not showed in this study, it must be mentioned that compost has other beneficial
effects, like improving soil fertility, improving the buffering capacity and reducing the risk for pathogens.


Introduction 9
1 Introduction
1.1 Compost and climate
Composting is acknowledged by the UNFCCC as one of the few emission reduction methodologies related to
agriculture (methodology number AM0025, www.unfccc.int/methodologies/PAmethodologies/index.html). The
methodology stimulates recycling of organic waste. By composting, organic matter originating from multiple waste
streams is going through a process which kills pathogens. It results in compost which contains stable organic
material which is useful for agricultural fields as a soil conditioner. Soil fertility, structure, water holding capacity and
buffering capacity are all improved by this means.
Composting is only acknowledged as an emission reduction project if the “baseline scenario” in a specific country
causes significant greenhouse gas emissions (UNFCCC/CCNUCC, 2008). This is for instance the case in Egypt,
where most of the waste is land filled or illegally dumped. When organic waste is land filled, a fermentation or rotting
process will start due to a lack of oxygen. During fermentation microbes will emit methane, a greenhouse gas which
is ca 25 times stronger than carbon dioxide. The new composting scenario, “avoids” the emission of methane for a
substantial part, but on the other hand causes more emissions due to the transport of biomass and fuel use on the
composting facility. The emissions of N2O due to microbial activities may also be higher during composting than
during fermentation, which were taken into account in the study.
1.2 Research objective
The objective of the study was to clarify the emission reduction methodology of composting projects and to extend
this method with compost usage in a case study. Both reduced and increased emissions are taken into account in
the assessments.
1.3 Research questions
The following research questions were distinguished:
1. How is the emission reduction of a composting facility calculated?
2. What is the carbon footprint of 1 ton of compost at farm gate?
3. How does the carbon footprint of citrus look like in two different scenarios: one with and one without
compost?


Methods 11
2 Methods
2.1 Approach
To illustrate the beneficial effect of composting on climate, the greenhouse gas emissions of two different situations
were compared:
1. a baseline scenario where organic waste is land filled and agriculture uses chemical nitrogen fertilizer
2. a second scenario where different organic waste materials are processed into compost which is used for
organic farming.
In the baseline scenario, organic waste is not used for recycling, but is transported to a landfill, or illegally dumped.
Furthermore, the agricultural fields are fertilized with ammonium nitrate in the baseline scenario.
In the second scenario, waste materials included in the baseline scenario are used for composting at a composting
facility near Alexandria. This composting facility is founded by Soil & More International and is acknowledged as an
emission reduction project by TUEV-Nord.
In the comparison, the compost and the chemical fertilizer are used on a hypothetical citrus farm, located in the
southern desert of Egypt (near Minia).
2.2 System boundaries
In both scenarios the organic waste fractions are taken into consideration. In the baseline the waste fraction is
dumped and land filled where anaerobe fermentation takes place and methane is emitted. In the second scenario,
organic waste is transported to the composting facility and composted in windrows according to the Controlled
Microbial Composting (CMC) method.
Emissions due to transport, production of ammonium nitrate, methane emission during anaerobe fermentation and
composting, nitrous oxide emissions during composting, direct and indirect emissions due to fertilizer application and
soil carbon sequestration are all taken into account. The system boundaries are illustrated in figure 1.
2.3 Functional unit
The functional unit is 1 ton of citrus at farm gate produced at a hypothetical desert farm in Egypt.

12 Reduced GHG emissions due to compost production and compost use in Egypt
Figure 1. System boundaries for the baseline (upper) and the composting scenario (lower).

Methods 13
2.4 Emission calculations
2.4.1 Baseline scenario
It is assumed that a part of the organic waste materials were not recycled in the baseline scenario. Most of the waste
materials in Egypt are land filled or illegally dumped. It was assumed that the waste was transported over 10 km (one
way) by truck with a diesel consumption of 0,3 l per km and a truckload of 15 ton. The emissions due to transport
amount to 0,22 kg CO2/ton waste. Due to anaerobical decomposition of the organic waste, methane is emitted. The
UNFCCC published a methodology to calculate the greenhouse gas emissions from solid waste disposal sites,
based on a research of Oonk et al., 1994 (www.unfccc.int). The methodology differentiates the fraction degradable
organic (DOC) carbon for different organic waste types. Per waste type the percentage of waste which is land filled
or dumped is multiplied with the fraction degradable carbon. Together with the waste type quantities, the amount of
carbon dumped was calculated (table 1).
Table 1. Waste materials parameters in the baseline scenario.
Material type Waste type
quantities (ton)
% to landfill or
illegally dumped
Degradable Organic
Carbon (DOC)
DOC in waste
Rice Straw 1.324 55% 0,3 218,46
Wood shavings 785 60% 0,3 141,30
Chicken manure 2.389 50% 0,17 203,07
Cow manure 20.028 80% 0,17 2.723,81
Clay 11.916 0% 0 -
Green waste 5.211 80% 0,17 708,70
Total 41.653 3.995,33
It was determined that 77% of the organic carbon present in the waste which was land filled decomposes
anaerobically. The fraction of methane in the emission to air amounted 50%. The landfills and illegal dumping sites
near Alexandria are relatively shallow, with depth less than 5 meters. Therefore the methane correction factor (MCF)
for these type of landfills is 0,4 (IPCC, 2006). The total greenhouse gas emission of the baseline scenario was
calculated by multiplying the amount of degradable carbon and the warming potential of 251 for methane and the
values displayed in table 2. In total the greenhouse gas emissions of the baseline scenario amounted to 20.509 ton
CO2e.
1 The IPCC also reported a global warming potential of 21 over a time horizon of 100 years.

14 Reduced GHG emissions due to compost production and compost use in Egypt
Table 2. Degradable carbon in organic waste and methane emissions due to land filling in the baseline scenario.
DOC in all
waste types
fraction DOC
which can
decompose
(DOCf)
Fraction of
methane in
gas
Correction
factor
Global
warming
potential
methane
Methane
correction
factor shallow,
unmanaged
land fills
Emission ton
CO2e
3.995,33 0,77 0,5 16/12 25 0,4 20.509,4
In total, 41.653 tons of waste was composted at the facility. This means that for the baseline scenario that if one ton
of waste was illegally dumped or fermented at landfills the emission would have been 492 kg CO2e/ton waste.
In literature different emission factors for the production of ammonium nitrate have been published and are in
between 3,0 and 7,0 kg CO2e/kg N (Davis & Hacklund, 1999; Kongshaug 1998; Kramer 1999; Elsayed, 2003;
Kuesters & Jenssen 1998; Wood & Cowie, 2004). In this research the most conservative value is used.
It was assumed that the production of ammonium nitrate took place within Egypt and was transported by truck over
400 km (one way), with a fuel use of 0,3 l diesel per km and a truckload of 20 tons. Ammonium nitrate consists for
34% out of pure N. The emission factor for diesel amount to 2,68 kg CO2/l diesel. The emission due to transportation
of 1 kg of ammonium nitrate to the farm amounts therefore 0,9 kg CO2e/kg N2.
It was assumed that fertilizers are applied by fertigation, where fertilizers are applied together with the irrigation
water. This is often the case in Egypt. It was assumed that 150 l diesel and 230 kWh per hectare was used for this
purpose. The emission factor used for electricity on the Egyptian grid amounted to 0,467 kg CO2/kWh (www.iea.org).
The average application rate for the production of citrus 200 kg N/ha (El Kadi & Kamh, 2004) with an average yield of
14,7 ton/ha (www.faostat.com).
Soil nitrous oxide emissions were calculated according to the Tier 1 method defined by the IPCC (see annex 1). For
the baseline scenario no other soil effects were assumed that relate to greenhouse gas emissions.
2.4.2 Compost scenario
The compost facility in Alexandria composted 41.653 tons of organic waste in the period November 2008 until
September 2009. The total amount of compost produced during this period was 17.560 tons, this means that 42% of
the input material was eventually turned into compost.
The input materials are put into windrows of two meters high and 3 meters wide. In total the composting process
takes 6 weeks, and the rows are turned several times. For irrigation and turning purposes, the facility uses diesel,
which amounted to 60.308 liters during November 2008 until September 2009.
2 (2,68 kg CO2e/l x 800 km x 0,3 l/km x 1/0,34 )/20.000 kg = 0,09 kg CO2e/kg

Methods 15
Table 3. Diesel use during the different production phases of compost.
l/ton compost
transport of input materials 6,37
diesel use composting facility 3,43
diesel use transport of compost to the farm 5,62
Total 15,42
2.4.2.1 Input materials
The input materials which are used are rice straw, wood shavings, chicken and cow manure, clay and green waste
(water hyacinth from irrigation channels). The input materials are transported from different origins towards the
composting facility.
• Rice straw originates from farms that are located in the Lower Nile Valley, the region where most of the
Egyptian rice production takes place. This is relatively close to Alexandria. The one way distance was
estimated being 25 kilometers from the rice farms towards the composting facility. The annual yield of rice
and rice straw in Egypt amounts to 8,2 and 3,9 ton/ha (Ehab El Saeidy, 2004). Traditionally farmers used
these farm residues as fuel for cooking and baking practices. The farmers stored the residues on the roofs
of their houses or on the fields. This traditional way of handling residues caused several problems because
pest infestations and the risk for destructive fires. The Egyptian Ministry of Agriculture therefore obliged
famers to burn their residues immediately after harvest operations (in 1996). It resulted in severe air
pollution in the region and soon (in 1999) the Ministry of Environment applied a law which prohibited the
burning of residues on their fields (EEAA, 1994).
• It was estimated that the wood shavings were transported for 200 km (one way). The origin of the wood
shavings is uncertain.
• It was estimated that the poultry manure was transported 25 km (one way) towards the composting facility.
Poultry has been the fastest growing industry in Egypt (Hosny, 2006). Recently there has been a general
trend towards more multi story and the establishment of large scale poultry production facilities. Most of the
feed ingredients are imported into Egypt and chicken manure is often dumped or land filled. However, this
way of manure handling can be a risk for pest and disease distribution (Axtell, 1999). By the composting
process and high temperatures that are reached, possible pathogens in the manure are destroyed.
• Cow manure originates from nearby dairy farms. In Egypt, mostly buffalos and local Baladi cows are bred.
The cows are kept in corrals where shade is provided. The sundried dung is collected and often dumped or
used as organic fertilizer. It is estimated that the manure is transported over 25 km (one way) towards the
composting facility.
• Clay used for the compost, originates from the Nile Delta. It is estimated that the clay is transported over 25
km (one way) towards the composting facility.
• The green waste in the form of water hyacinth that is used for composting originates from nearby irrigation
channels. Water hyacinth is a pest that has invaded irrigated channels and lakes in Egypt. The invasive

16 Reduced GHG emissions due to compost production and compost use in Egypt
species causes every year a significant loss of water due to evapotranspiration (Fayad et al, 2001). It also
prevents the water from flowing freely. The water hyacinths are harvested and transported towards the
composting facility over a distance of approximately 25 km (one way).
Table 4. Input materials of the compost facility in Alexandria.
Material Ton Origin Return distance Ton/truck
Rice Straw 1.324 Nile delta 50 12,05
Wood Shavings 785 Wood industry 400 4,72
Chicken Manure 2.389 Nile delta 50 6,53
Cow Manure 20.028 Nile delta 50 6,36
Clay 11.916 Nile delta 50 7,12
Green waste 5.211 Irrigation channels 50 6,32
Total 41.653
2.4.2.2 Emissions during composting
During the composting process, small amounts of methane (CH4) and nitrous oxide (N2O) are released by
microorganisms. N2O is released during denitrification of nitrite and nitrate. Methane is released during anaerobe
circumstances when organic compounds are used by microorganisms. The level of N2O and CH4 emissions are
related with the types of organic materials that are composted, the type of composting, the amount of material and
the processing circumstances (moisture, temperature and structure). Especially aeration significantly influences
methane emissions (Heres et al., 2007). Apart from that there are different measuring methods (continue versus
momentous measuring) which may affect the emissions which are measured.
Studies on windrow composting therefore give very different results for CH4 and N2O emissions. Andersen et al.
(2010) measured 2,4 kg CH4-C and 0,06 kg N2O-N during composting of one ton garden waste, which means an
emission of ca 303 kg CO2e/ton compost. Hao et al. (2004) measured 4,8 kg CH4-C and 0,08 N2O-N kg per ton
waste composted, which amount to a total emission of 563 kg CO2e per ton compost. Hellebrand (1998) measured
an emission of 0,08 kg CH4-C and 0,054 kg N2O-N per ton waste composted (0,04% of the initial carbon was emitted
as CH4 and 0,5% of the initial nitrogen was lost as N2O-N), which amount to a total emission of 94,7 kg CO2e/ton
compost.
In the Netherlands, the emissions of nitrous oxide and methane have been extensively monitored in several
composting facilities which use different composting methodologies. Table 5 displays the maximum and minimum
values that have been monitored (Heres et al., 2007).
According to Benner et al. (2007) the emissions amount to 0,2 kg methane and 0,11 kg nitrous oxide per ton organic
waste, which amounts to 90 kg CO2e/ton compost. The results from different studies displayed in table 6 illustrate
that there is no golden rule to quantify the amount of greenhouse gas emissions due to composting. In this study, the

Methods 17
maximum values measured in Heres et al. (2007) were used. This value has been chosen, because the compost is
managed actively and turning activities take place regularly. Also because of low precipitation in the region (the
compost is irrigated instead), anaerobic circumstances are rare. However, it must be mentioned that no
measurements on nitrous oxide and methane emissions have been carried out.
Table 5. Emissions of CH4 and N2O due to composting in The Netherlands (Heres et al, 2007).
Type of gas Minimum
measured
(kg/ton
waste)
Maximum
measured
(kg/ton
waste)
Minimum
(in kg
CO2e/ton
waste)
Maximum (in
kg CO2e/ton
waste)
Minimum (in
kg CO2e/ton
compost)
Maximum (in
kg CO2e/ton
compost)
Methane (CH4) 0,08 0,30 2,00 7,50 4,74 17,79
Nitrous oxide (N2O) 0,04 0,10 11,92 29,80 28,27 70,68
Table 6. Emissions due to composting in different studies.
Study Kg CO2e/ton compost due to
methane and nitrous oxide emissions
Material
Andersen et al., 2010 303,8 Garden waste
Hao et al., 2004 563,2 Cattle manure
Hellenbrand, 1998 94,7 Grass and green waste
Benner et al., 2007 89,6 GFT
Heres et al., 2007 33-88 GFT
2.4.2.3 Compost application
In 2009 most of the compost was transported towards a new organic farm in the desert close to Minia. The average
distance over which the compost was transported amounted to 880 km (one way). Due to the application of compost
on reclaimed desert soils, the soil organic matter content is increased. Recent research showed that the application
of 47,6 ton compost/ha/yr over 30 years on organic arable fields in Egypt, resulted in an average carbon
sequestration of 0,88 ton C/ha/yr (or 3,23 ton CO2/ha/yr) (Luske & Van der Kamp, 2009). With this information it was
calculated that by the application of one ton of compost 67,79 kg CO2 was sequestered.
In other studies values in the same order of magnitude were found; in between 0 and 22% of the applied carbon in
the compost was sequestered (Saft & Kortman, 2004). It must be mentioned that the application rate, soil
management, temperature, moisture level and crop types all affect this sequestration ratio. Because the
circumstances in Egypt are very specific, it was decided to use the measured data in reclaimed Egyptian desert soils
(Luske & Van der Kamp, 2009), although the measurements only covered a period of 30 years.

18 Reduced GHG emissions due to compost production and compost use in Egypt
It was assumed that the farm in Minia used 20 ton of compost/ha/yr which was applied manually. While in the
baseline fertigation was assumed, fuel and electricity use for irrigation were added in the composting scenario. Due
to the increasing Soil Organic Matter, it was assumed that 10% less irrigation water was needed, so fuel and
electricity use for irrigation practices also decreased. While organic farms often have lower yields, it was assumed
that the yield per hectare was 20% lower than the baseline scenario.

Results 19
3 Results
3.1 Carbon footprint of compost at farm gate
Based on the above mentioned data and assumptions, the carbon footprint of compost was calculated. For the
production of one ton of compost in total 129,35 kg CO2e were emitted (table 7). Most of the emissions actually
occurred during the composting process. It must be noted however that the level of methane and nitrous oxide
emissions are very dependent on management of the compost site and waste types that are used; they can be lower,
but also much higher.
Table 7. Carbon footprint of compost before application.
Source of emission Emission
transport of organic waste (kg CO2e/ton) 17,07
diesel use composting facility (kg CO2e/ton) 9,21
methane and nitrous oxide emissions during composting (kg CO2e/ton) 88,00
transport to the field (kg CO2e/ton or kg) 15,07 +
total (kg CO2e/ton compost) 129,35
total nitrogen in compost3 (kg N/ton compost) 7,27
kg CO2e/kg N 17,79
3.2 Carbon footprint of citrus in the baseline and the compost scenario
Based on the above mentioned data and assumptions the carbon footprint of citrus was calculated for both scenarios
until farm gate. Citrus fertilized with compost has a carbon footprint of 162 kg CO2/ton. Citrus fertilized with
ammonium nitrate has a much larger carbon footprint amounting to 1.813 kg CO2e/ton (table 8, figure 3). The
emissions due to fermentation of waste have the largest impact, but even if these are excluded, the carbon footprint
from the compost scenario also remains lower (table 8, figure 2). If the amount of compost applied is increased to 30
ton/ha (instead of 20 ton/ha), both scenarios show equal emission levels.
When comparing the emissions per hectare, the differences are even larger.
3 A dry weight of 78% and a N% of 0,93 for compost were assumed.

20 Reduced GHG emissions due to compost production and compost use in Egypt
Table 8. Emissions per hectare or per ton of citrus at farm gate in the two scenarios.
Compost scenario
(kg CO2e/ha)
Baseline scenario
(kg CO2e/ha)
Compost scenario
(kg CO2e/ton
citrus)
Baseline scenario
(kg CO2e/ton
citrus)
production of ammonium nitrate - 1.406,00 - 95,65
transport of organic waste 341,42 116,31 29,03 7,91
fuel use composting facility 184,17 - 15,66 -
emissions during composting 1.760,00 - 149,66 -4
emissions during fermentation - 23.446,95 - 1.595,03
transport to the field 301,39 18,93 25,63 1,29
irrigation/fertigation 458,65 509,61 39,00 34,67
soil nitrous oxide emissions after
application
476,79 1.147,30 18,15 78,05
soil carbon sequestration 1.355,80- - 115,29- -
total excl. fermentation 2.166,61 3.198,15 161,84 217,56
total incl. fermentation 2.166,61 29.843,25 161,84 1.812,59
4 It was assumed that due to anaerobe circumstances, nitrous oxide emissions were marginal on landfills.

Results 21
Figure 2. Greenhouse gas emissions for the production of 1 ton of citrus, when fermentation of waste on landfills is
excluded from the analysis.
Figure 3. Greenhouse gas emissions for the production of 1 ton of citrus, when fermentation of waste on landfills is
included in the analysis.


Conclusions 23
4 Conclusions and discussion
4.1 Approach taken to illustrate emission reduction
This research explains the approach for determining the emission reduction of composting projects. As displayed, the
calculated emissions of a new scenario (with a composting facility) are compared with a baseline scenario. This
approach is used by the UNFCCC for determination of the emission reduction which is reached by other kind of
emission reduction projects. The additionality of the project and extra emission due to the project are also taken into
account. Additionality and the baseline scenario of emission reduction projects are always topics of discussion,
because both are hypothetical situations and cannot be checked in reality.
In this research, the same approach has been used to illustrate the climate effects of the usage of compost. For this
purpose a system comparison has been done where emission due to compost production, application, transport, are
compared with a hypothetical baseline scenario which has no waste recycling and uses chemical fertilizers.
4.2 Emissions due to compost use versus the baseline scenario
The result of the study show that composting of organic waste and compost usage result in a significant reduction of
greenhouse gas emissions compared with the baseline scenario. The reduction is mainly reached due to avoiding
methane emissions from land filling or dumping the organic waste in the baseline scenario. However, not all methane
emission could be avoided. Within the windrows sometimes anaerobic circumstances can occur, which cause
methane emissions. The amount of methane emitted within the windrows is highly dependent on the management of
the composting process and the same accounts for the emission of nitrous oxide during composting. On the basis of
literature studies it was determined that composting results in 90% less emission than the baseline scenario (149
instead of 1559 kg CO2e/ton citrus).
In the second place, the composting scenario reduces emissions due to avoidance of nitrogen fertilizer production.
Worldwide, the fertilizer industry uses a significant amount of the available fossil fuels and electricity, especially for
the production of nitrate fertilizers. Often the production plants also emit nitrous oxide. Reducing the use of nitrogen
fertilizers automatically reduces the emissions related to the production of chemical fertilizers.
On top of the avoidance of methane emissions and the production of chemical fertilizers, compost use reduces
emission due to the sequestration of carbon in the soil. The rate of soil carbon sequestration which was used is this
study was 3,23 kg CO2e/ha, based on earlier studies in Egypt (see section 2.4.2.3). One should realize that this value
is very site specific and will also be influenced by soil characteristics, climate, crops, soil management etc.
Soil nitrous oxide emissions due to fertilization are also lowered due to compost use, but it must be mentioned that
this effect is uncertain. Based on literature the direct emission factor for soil nitrous oxide emissions has been
determined being 0,7% instead of 1%. At this moment the specific soil microbial interactions are not well understood
in relation with soil nitrous oxide emissions. There might be a trade-off between soil carbon sequestration and nitrous
oxide emissions. More research is needed to draw conclusions about this topic.
Apart from lower emission in the composting scenario, some sources actually cause more emissions than the
baseline scenario. For example the transportation of biomass and fuel use on the compost facility for windrow turning
causes increased emissions.

24 Reduced GHG emissions due to compost production and compost use in Egypt
The results indicate that the carbon footprint per kg N of compost (18 kg CO2/kg N) is higher than for ammonium
nitrate 3-7 kg CO2/kg N). It must be mentioned however that compost is a very different product than chemical
fertilizers. Compost use enhances soil fertility and the amount of nitrogen which needs to be applied as compost will
be less than applied as chemical fertilizers (as is the case in the analysis), due to the buffering of nutrients by
compost. Chemical fertilizer use will affect soil fertility in a negative way and nutrients are more easily leached.
The baseline scenario chosen in this study is relatively conservative, because a shallow landfill has been assumed
with a methane correction factor of 0,4. The IPCC determined this 0,8 for landfills that are deeper, which means that
the methane emissions are doubled of the baseline scenario. Furthermore it is assumed that landfills do not emit any
nitrous oxide.
4.3 Other effects of compost use
This research illustrates the emission reduction which can be used due to compost used. There are other benefits
related to compost use that are not illustrated with this analysis, which are displayed here in a nutshell:
By improving the soil organic carbon level, at the same time the buffering capacity for water and nutrients is improved
and in general soil fertility, including soil biodiversity, is increased. This will also result natural suppression of pests
and diseases in the field. A good composting process reaches high temperatures which reduces the risk for
pathogens. By this means regional waste streams are recycled, nutrient leaching is reduced, water use is reduced,
soil fertility is maintained or improved and local living conditions are improved.

References 25
References
Andersen et al. (2010). Quantification of greenhouse gas emissions from windrow composting of garden
waste. Journal of Environmental Quality 39: 713-724.
Axtell, R.C.(1999). Poultry Integrated Pest Management: Status and Future. Integrated Pest Management
Reviews. Volume 4, Number 1 / March, 1999. 53-73
B. Luske & J. van der Kamp (2009). Carbon sequestration potential of reclaimed desert soils in Egypt. Louis Bolk
Institute & Soil and More International, The Netherlands.
Benner et al. (2007). CO2-kentallen afvalscheiding. CE, Delft. 36 pp.
Davis, J. & Hacklund, C. (1999). Life Cycle Inventory (LCI) of fertiliser production. fertiliser products used in
Sweden and Western Europe. SIK-Report No. 654. Masters Thesis, Chalmers University of Technology.
EEAA. (1994). Egyptian Environmental Affairs Agency, Law 4/1994 for the Environment Protection. The Public
Authority for the Official Press, Cairo, Egypt.
Ehab El Saeidy, (2004). Renewable Energy in Agriculture in Egypt Technological Fundamentals of Briquetting
Cotton Stalks as a Biofuel. Dissertation Landwirtschaftlich-Gärtnerischen Fakultät, Humboldt-Universität, Berlin.
El Kadi & Kamh, (2004). Fertilization of fruit trees grown in newly reclaimed areas of Egypt with potassium as
SOP balanced with nitrogen and phosphorus. IPI regional workshop on Potassium and Fertigation development
in West Asia and North Africa ; Rabat, Morocco, 24-28 November, 2004.
Elsayed, et al. (2003). Carbon and energy balances for a range of biofuel options. Report by Resources
Research Unit, Sheffield Hallam University for DTI Sustainable Energy Programmes.
Farid A. Hosny (2006). Poultry sector country review. FAO Animal production and Health Division. 47 pp
Fayad et al. (2001). Ongoing cctivities in the biological control of water hyacinth in Egypt. Biological and
integrated control of water hyacinth Eichhornia crassipes. ACIAR Proceedings 10, 4 pp.
Gerke et al. (1999). Modeling long-term compost application effects on nitrate leaching. Plant and Soil, Vol 213,
Nr 1-2,: 75-92.

26 Reduced GHG emissions due to compost production and compost use in Egypt
Grant et al. (2003). Life Cycle Assessment of waste and resource recovery options (including energy from
waste). RMIT –Centre for Design, Nolan_ ITU, Melbourne.
Hao et al. (2004). Carbon, nitrogen balances and greenhouse gas emission during cattle feedlot manure
composting. Journal of Environmental Quality 33: 37-44.
Hellenbrand, H. J. (1998). Emission of nitrous oxide and other trace gases during composting of grass and
green waste. Journal of Agricultural Engineering Res. 69 pp 365-375.
Heres et al. (2007). Onderzoek bepalen kentallen methaan en lachgas composteerbedrijven. TAUW, Deventer.
32 pp.
Hogg et al. (2002). Economic analysis of options for managing biodegradable waste. Report to the European
Commission, EUNOMIA Research and Consulting, Scuola Agraria del Parco di Monza, HDRA Consultant, ZREU
and LDK ECO.
IPCC, 2006. (2006). IPCC Guidelines for national greenhouse gas inventories. Volume 4 agriculture, forestry
and other land use, Chapter 11: N2O emissions from managed soils, and CO2 emissions from lime and urea
application. 54 pp.
Kongshaug, G. (1998). Energy consumption and greenhouse gas emissions in fertilizer production. IFA
Technical Conference, Marrakech, Morocco, 28 September-1 October, 1998, 18pp.
Kramer et al. (1999). Total greenhouse gas emissions related to the Dutch crop production system.
Agriculture, Ecosystems and Environment, 72, 9-16.
Kuesters, J. & Jenssen, T. (1998). Selecting the right fertilizer from an environmental Life Cycle Perspective.
IFA Technical Conference, Marrakech, Morocco, 28 September-1 October, 1998, 7pp.
Oonk et al. (1994). Validation of landfill gas formation models; EWAB 9427, Novem, Utrecht.
Saft & Kortman (2004). Nadere beschouwing van de LCA voor gft-afval uit het MER-LAP. IVAM, Amsterdam.50
pp.
UNFCCC/CCNUCC, 2008. Methodological tool. Tool to determine methane emissions avoided from disposal
of waste at a solid waste disposal site. EB 41 Report, Annex 10. CDM Executive board, 9 pp.

References 27
Vogt et al. (2002). Ökobilanz bioabfallverwertung-untersuchungen zur umweltverträglichkeit von systemen
zur verwertung von biologisch-organischen abfällen. Deutsche Bundesstiftung Umwelt/Ifeu.
Wahba, M. M. (2007). Infleunce of compost on morphological and chemical properties of sandy soils, Egypt.
Journal of Applied Sciences Research 3 (11): 1490-1493.
Wanas, S. A. & W. M. Omran, (2006). Advantages of applying various compost types to different layers of
sandy soil: 1. Hydro-physical properties. Journal of Applied Sciences Research 2 (12): 1298-1303.
Wesseling et al. (2009). The effect of soil texture and organic amendments on the hydrological behavior of
coarse-textured soils. Soil Use and Management 25, 274-283.
Wood & Cowie (2004). A review of greenhouse gas emission factors for fertiliser production. IEA Bioenergy
Task 38. Pp 20.
www.faostat.com
www.iea.org October 2007. Foreign Electricity Emission Factors, 1999-2002
www.unfccc.int
www.unfccc.int/methodologies/PAmethodologies/index.html


Annex 1. Soil emissions 29
Annex 1: Soil emissions
Direct and indirect emissions of nitrous oxide
Due to the application of fertilizers, and activities of soil microorganisms, the available nitrogen can be released into
the air in the form of nitrous oxide (N2O). Nitrous is a powerful greenhouse gas with a global warming potential of
298, being 298 times stronger as CO2 (IPCC, 2006). In several studies it was taken into account that in the case of
compost nitrous oxide emissions are lower than in the case of mineral fertilizers, due to the presence of stable soil
aggregates (0,7 instead of 1%) (Saft & Kortman, 2004; Hogg et al., 2002; Vogt et al., 2002, Grant et al., 2003).
According to the Intergovernmental Panel on Climate Change (IPCC) direct and indirect emissions of nitrous oxide
should be taken into account.
Direct emissions take place directly from the soil due to microbial processes that are stimulated by nitrogen
fertilization. Indirect emissions take place later; when volatilized nitrogen is deposited elsewhere and is released as
nitrous oxide by soil microorganisms and when leached nitrogen appears in surface water and is processed into
nitrous oxide also by microorganisms. While compost improves the water holding capacity of soils (Wahba, 2007;
Wanas & Omran, 2006; Wesselink et al., 2009; Gerke et al, 1999), it was assumed that the run-off of nitrogen was
marginalized.
The calculation methodology supplied by the IPCC is very rough and not specified for different regions or soil types.
This is due to the fact that the microbial processes are very complex. Many parameters affect the microbial
processes and the parameters also interfere with each other. This makes it complicated to define site specific
formulas for nitrous oxide emissions. The formulas given below originate from the Good Practice Guidelines of the
IPCC and are on a Tier 1 level. The default emission factors have been reviewed and changed in order to specify it
for the Egyptian circumstances (table 9).
Direct emissions
The following formula is applied to calculate the direct emissions from agricultural soils:
CO2-eq (kg/ha) =∑ Eij/ha*EFij*44/28*298
Eij=netto amount of N applied by source i on soil type j (therefore volatilized N is deducted)
EFij=emission factor of source i on soil type j
44/28= conversion factor of N2O-N to N2O
298= GWP value of N2O
30 Reduced GHG emissions due to compost production and compost use in Egypt
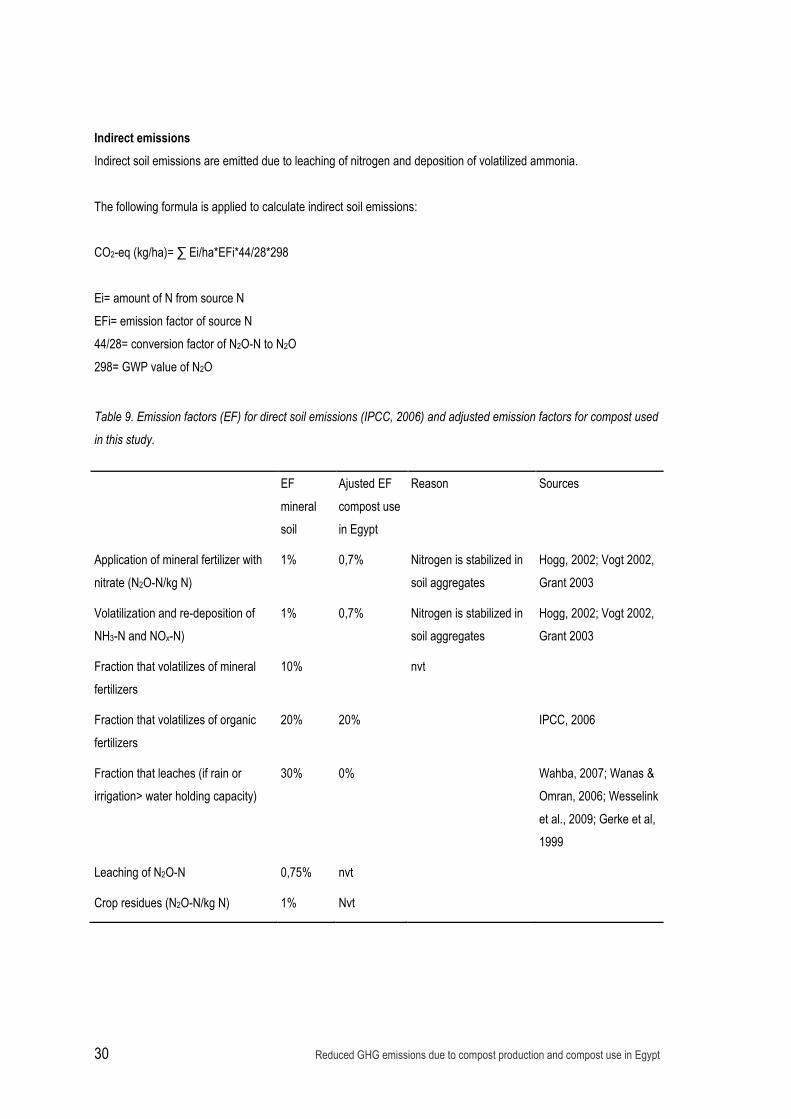
Indirect emissions
Indirect soil emissions are emitted due to leaching of nitrogen and deposition of volatilized ammonia.
The following formula is applied to calculate indirect soil emissions:
CO2-eq (kg/ha)= ∑ Ei/ha*EFi*44/28*298
Ei= amount of N from source N
EFi= emission factor of source N
44/28= conversion factor of N2O-N to N2O
298= GWP value of N2O
Table 9. Emission factors (EF) for direct soil emissions (IPCC, 2006) and adjusted emission factors for compost used
in this study.
EF
mineral
soil
Ajusted EF
compost use
in Egypt
Reason Sources
Application of mineral fertilizer with
nitrate (N2O-N/kg N)
1% 0,7% Nitrogen is stabilized in
soil aggregates
Hogg, 2002; Vogt 2002,
Grant 2003
Volatilization and re-deposition of
NH3-N and NOx-N)
1% 0,7% Nitrogen is stabilized in
soil aggregates
Hogg, 2002; Vogt 2002,
Grant 2003
Fraction that volatilizes of mineral
fertilizers
10% nvt
Fraction that volatilizes of organic
fertilizers
20% 20% IPCC, 2006
Fraction that leaches (if rain or
irrigation> water holding capacity)
30% 0% Wahba, 2007; Wanas &
Omran, 2006; Wesselink
et al., 2009; Gerke et al,
1999
Leaching of N2O-N 0,75% nvt
Crop residues (N2O-N/kg N) 1% Nvt