redalyc.use of residual powder obtained from organic waste to
TRANSCRIPT

Dyna
ISSN: 0012-7353
Universidad Nacional de Colombia
Colombia
Soto-Izquierdo, Indara; Antonio-Ramalho, Marcio
Use of residual powder obtained from organic waste to partially replace cement in
concrete
Dyna, vol. 83, núm. 195, febrero, 2016, pp. 147-155
Universidad Nacional de Colombia
Medellín, Colombia
Available in: http://www.redalyc.org/articulo.oa?id=49644128019
How to cite
Complete issue
More information about this article
Journal's homepage in redalyc.org
Scientific Information System
Network of Scientific Journals from Latin America, the Caribbean, Spain and Portugal
Non-profit academic project, developed under the open access initiative
© The author; licensee Universidad Nacional de Colombia. DYNA 83 (195), pp. 147-155. February, 2016 Medellín. ISSN 0012-7353 Printed, ISSN 2346-2183 Online
DOI: http://dx.doi.org/10.15446/dyna.v83n195.44725
Use of residual powder obtained from organic waste to partially replace cement in concrete
Indara Soto-Izquierdo a & Marcio Antonio-Ramalho b
a Departamento de Ciências Exatas e Tecnológicas, Universidade Estadual de Santa Cruz, Ilhéus, Brasil. [email protected]
b Departamento de Engenharia de Estruturas, Universidade de São Paulo, São Paulo, Brasil. [email protected],br
Received: August 1rd, 2014. Received in revised form: May 15th, 2015. Accepted: January 28th, 2016.
Abstract The main objective of this research is to investigate the feasibility of using the residual powder obtained from organic waste to replace a part of Portland cement during concrete production. The chemical and physical properties of the organic residual powder were first investigated using scanning transmission electron microscopy (STEM) and energy dispersive X-ray spectroscopy (EDS). The replacement ratios of cement have also been studied for 0%, 5%, 10%, 15%, and 20% of the residual powder by weight. Moreover, we evaluated the compressive strength, specific gravity, water absorption, and voids content of the concrete specimens that were modified with different concentrations of the residual powder. Results indicate that 5% residual powder concentration resulted in better physical and mechanical properties of the modified concrete when compared with the reference concrete. At this concentration, the addition of residual powder act as fillers in concrete, reducing the amount of voids and causing a higher density in the material. Keywords: residual powder; organic waste; cement; concrete; mechanical properties.
Utilización de polvo de residuos orgánicos como sustitución parcial del cemento en el hormigón
Resumen El objetivo principal de este trabajo es estudiar la viabilidad de utilizar el polvo obtenido a partir de residuos orgánicos para substituir parte del cemento Portland en la producción del hormigón. Inicialmente fueron evaluadas las propiedades químicas y físicas del polvo residual usando un microscopio electrónico de transmisión (TEM) y aplicando la espectroscopía de dispersión de energía de rayos X, (EDS). Los porcentajes del residuo remplazando el cemento fueron 0%, 5%, 10%, 15%, y 20%, en peso. Para los ejemplares de hormigón modificado con las concentraciones del polvo fueron evaluadas la resistencia a compresión, peso específico, absorción de agua, e índice de vacíos. Los resultados mostraron que 5% del polvo residual mejoraron las propiedades físicas y mecánicas del hormigón con relación a los ejemplares de referencia. Por lo tanto, el polvo puede actuar como fíler en la pasta de cemento, disminuyendo el número de vacíos e aumentando la densidad y resistencia del material. Palabras clave: polvo residual; residuos orgánicos; cemento; concreto; propiedades mecánicas.
1. Introduction The construction industry uses approximately 14% to
50% of the natural resources extracted and is considered to be the second most significant contributor of carbon dioxide emissions [1]. As such, given the increasing environmental concerns, alternative materials using waste materials are a workaround solution to achieve sustainability in the construction industry.
Municipal solid waste (MSW) is defined as materials that are generated as a result of numerous activities in areas with human settlements [2]. Currently, incineration is one of the most commonly used solutions for waste management in developed and industrialized countries. For example, in Europe, the percentage of MSW incinerated has grown from approximately 15% in 1995 to 20% in 2009 [3]. In Japan, about 80% of MSW is being incinerated and reused [4]. China is continuing to build incineration plants for MSW each year in cities like Shenzhen,

Soto-Izquierdo & Antonio-Ramalho / DYNA 83 (195), pp. 147-155. February, 2016.
148
Beijing, and Shanghai in order to generate electricity [5]. Countries like Belgium, Holland, Germany, and France have established laws and regulations for using municipal waste incinerated in construction [6].
In principle, the combustion of solid waste during the incineration process generates ashes, a new form of residue. This has been investigated as a potential raw material for the manufacture of cement by Lin et al. [7], Singhal et al. [8], Chen et al. [9] and Rodriguez et al. [10]. In Al-Rawas et al.’s research [11], incinerator ash was used at 0%, 10%, 20% and 30% replacement by weight for cement and with a w/c ratio of 0.70. Specimens prepared using 20% incinerator ash replacement for cement yielded a higher compressive strength than the control mix after 14 and 28 days of curing. Wu et al. [12] analyzed the feasibility of adding incinerated ash in the production of Portland cement. According to their study, good quality clinker can be obtained by heating the crude mixture at 1200 °C for 2 h with a 30% replacement of ash.
Incineration is a common practice to tackle the solid waste disposal issue. However, a chemical decomposition process may be an alternative method for this problem. Some researchers have studied this process to treat urban waste such as Jeronimo [13], Carneiro [14], Goyal et al. [15] and Kejun et al. [16]. This process is currently only being applied only to organic wastes. At the end of the process a residual powder is formed. As such, one of the potential uses of this recycled material is in the construction industry. An economic recycling approach will favor the effective use of nonrenewable natural resources and energy and prevent the dumping of toxic materials in the environment.
This paper discusses the suitability of the destination for residual powder obtained from organic waste, and the feasibility of incorporating the residual powder to replace a cement part in concrete. First, the chemical composition and particle size of the residual powder has been analyzed using scanning transmission electron microscopy (STEM) and Energy dispersive X-ray spectroscopy (EDS). Based on the results obtained, we assessed whether the residual powder is inert, noncontaminating, and suitable for use in concrete. Then, the residual powder was incorporated in the concrete with 5%, 10%, 15%, and 20% ratios. During the analysis, the water to cement ratio (w/c) and aggregates to cement ratio (a/c) were 0.70 and 10, respectively. Moreover, we analyzed the physical and mechanical properties of the concrete that were obtained by replacing a part of cement with the residual powder. According to the results obtained, incorporating 5% residual powder in cement will favor an increase in the density of the mixture and also improve the mechanical properties of the concrete. This could be ascribed to the small size of the particles that tend to occupy the voids in the cement paste.
2. Materials and experimental methodology
2.1. Materials and their properties
The cement used in this study was CPV ARI RS (high early
strength Portland cement sulfate resisting), produced by Holcim. The physical, chemical, and mechanical characteristics of the cement, as summarized in Table 1, comply with the requirements of the Brazilian standard for cement [17].
Table 1. Physical, chemical, and mechanical properties of the cement CP V ARI RS
Properties Chemical
composition (%)
Physical and Mechanical properties of cement and limits of Brazilian standards
specifications for cement
Property Test
results Limits of
NBR. SiO2 19.20
Al2O3 5.97 Fineness-Blaine measurement (cm2/gm)
4 743 ≥3000
Fe2O3 3.03 Fineness-Retained # 200 (%)
0.07 ≤6.0
CaO 63.47 Initial setting time (minutes)
110 ≥60
MgO 0.59 Final setting time (minutes)
163 ≤600
SO3 2.76 Le Chatelier Expansion (mm)
2.21 ≤5.0
K2O 0.83 Specific gravity 3.12 -
Na2O 0.17 3 days Compressive strength (Mpa)
44.40 ≥24
Free CaO 2.19 7 days Compressive strength (Mpa)
47.90 >34
Alkali equivalent
0.71 28 days Compressive strength (Mpa)
52.20 -
Source: The authors
Figure 1. Comparison between the sand used in this study and that recommended by the Brazilian standard NBR 7211, 1987. Source: Adapted from [18]
The fine aggregates used were sand and stone powders of
basaltic origin, while the coarse aggregate is the zero graduation crushed rock basalt . These materials are readily available on the market and were used under the same conditions in which they are usually employed during construction.
According to the results of the granulometric analysis, the sand used in this study meets the requirements of the Brazilian standard [18] and can be classified as fine sand in zone 2, as shown in Fig. 1.
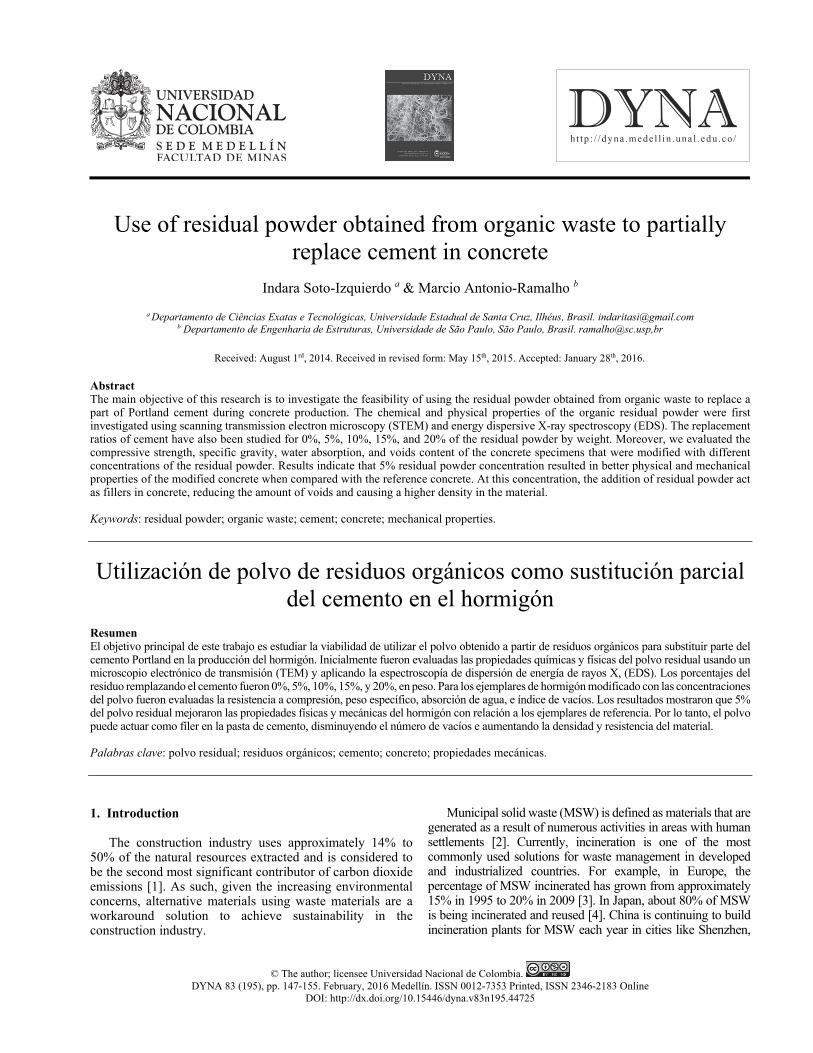
Fig. 2 shows the granulometric distribution of the stone powder, which conforms with the specifications recommended by the Brazilian standard [18] for the granulometric range of zone 4. Hence, it can be regarded as coarse sand.
Soto-Izquierdo & Antonio-Ramalho / DYNA 83 (195), pp. 147-155. February, 2016.
149
Figure 2. Comparison between the stone powder used in this study and that specified by the Brazilian standard NBR 7211, 1987. Source: Adapted from [18]
Table 2. Physical characteristics of sand and stone powder
Materials Specific gravity (g/cm3)
Bulk density (kg/m3)
Fineness modulus
Maximum diameter
(mm)
Powdery Material
(%) Sand 2.62 2.59 2.15 2.40 0.31
Stone powder 2.80 2.80 3.64 4.80 12.58
Source: The authors
Table 3. Physical properties of the gravel
Properties Sieves (mm) Gravel
% Retained accumulated
12.5 0.0 9.5 0.5 6.3 48.3 4.8 86.0 2.4 98.8
Bottom 100.0 Maximum diameter (mm) 9.50 Fineness modulus 5.85 Specific gravity (g/cm3) 2.86 Bulk density (g/cm3) 2.70
Source: The authors The results of the characterization of the fine aggregates
are presented in Table 2. Table 3 shows the physical properties of the gravel.
2.2. Residual powder from organic waste Furthermore, we analyzed the chemical and physical
properties of the residual powder generated from the organic waste, including the chemical composition, particle size, analysis of heavy metals, bulk density, fineness modulus, and particle size. Table 4 summarizes the different tests and the methodology adopted for each of the trials.
2.3. Generation of residual powder from organic waste
In a typical process, all the received urban waste materials
were placed on a magnetic mat for the extraction of metallic materials. Subsequently, all the inorganic materials, such as wood, glass, plastics, rubber, and batteries, were manually
Table 4. Tests and methodology adopted to characterize the organic residual powder
Material Test Experimental Methodology
Residual powder from organic waste
Analysis of the shape and size
Scanning Transmission Electron Microscope (STEM)
Chemical analysis Energy Dispersive X-ray Spectrometer (EDS)
Analysis of heavy metals Atomic emission spectroscopy (AES)
Specific gravity (g/cm3) NM 23. 2001 Specific surface area NBR 11579. 2012 Granulometric analysis NM 248. 2003
Source: The authors
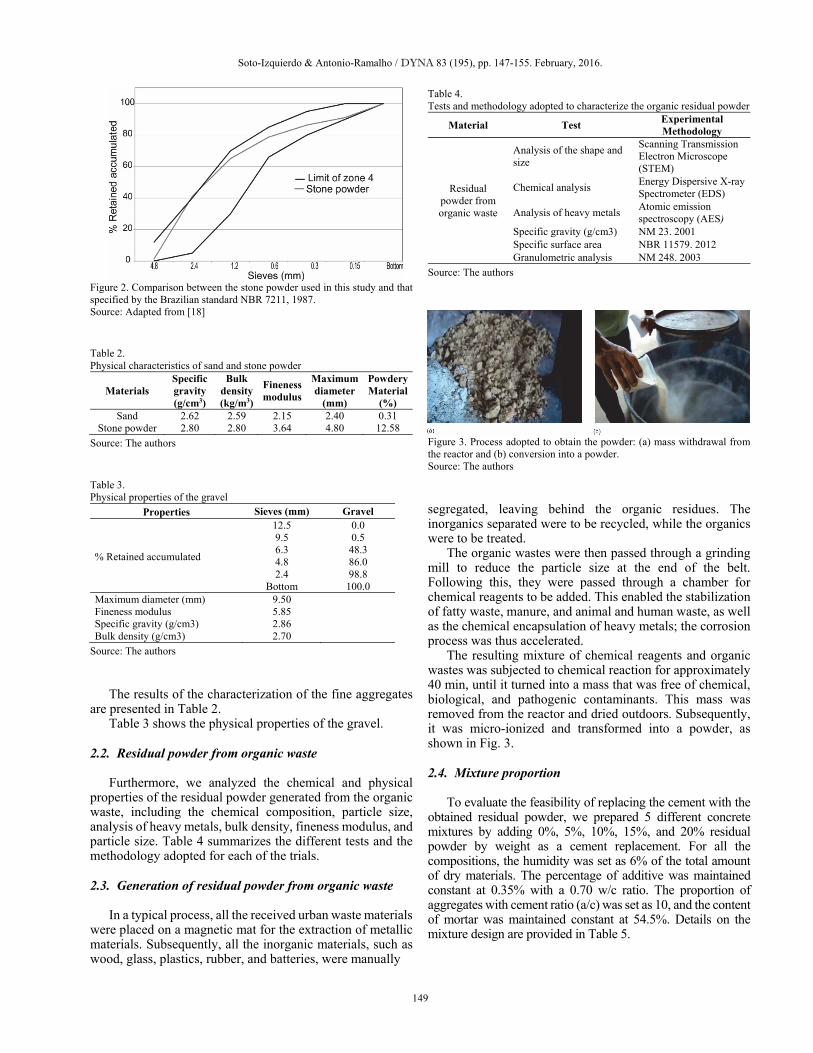
Figure 3. Process adopted to obtain the powder: (a) mass withdrawal from the reactor and (b) conversion into a powder. Source: The authors
segregated, leaving behind the organic residues. The inorganics separated were to be recycled, while the organics were to be treated.
The organic wastes were then passed through a grinding mill to reduce the particle size at the end of the belt. Following this, they were passed through a chamber for chemical reagents to be added. This enabled the stabilization of fatty waste, manure, and animal and human waste, as well as the chemical encapsulation of heavy metals; the corrosion process was thus accelerated.
The resulting mixture of chemical reagents and organic wastes was subjected to chemical reaction for approximately 40 min, until it turned into a mass that was free of chemical, biological, and pathogenic contaminants. This mass was removed from the reactor and dried outdoors. Subsequently, it was micro-ionized and transformed into a powder, as shown in Fig. 3.
2.4. Mixture proportion
To evaluate the feasibility of replacing the cement with the
obtained residual powder, we prepared 5 different concrete mixtures by adding 0%, 5%, 10%, 15%, and 20% residual powder by weight as a cement replacement. For all the compositions, the humidity was set as 6% of the total amount of dry materials. The percentage of additive was maintained constant at 0.35% with a 0.70 w/c ratio. The proportion of aggregates with cement ratio (a/c) was set as 10, and the content of mortar was maintained constant at 54.5%. Details on the mixture design are provided in Table 5.

Soto-Izquierdo & Antonio-Ramalho / DYNA 83 (195), pp. 147-155. February, 2016.
150
Table 5. Mix proportion for 1 m3 of concrete (kg)
Materials Refer. 5% 10% 15% 20%
Cement 205.10 194.85 184.60 174.34 164.08 Organic powder - 10.25 20.50 30.76 41.02 Gravel 1025.6 Stone dust 615.39 Sand 410.21 H2O 143.60 136.40 129.20 122.00 114.90 w/c 0.70 Proportion of aggregates (cement aggregate)
1:10
Additive in relation to the mass of cement (%)
0.35
Content of mortar (%)
54.50
Moisture 6.00 Source: The authors
Figure 4. Cylindrical specimens of dimension 5 cm x 10 cm. Source: The authors
2.5. Mixture and analysis of concrete For the analysis, cylindrical specimens with a 5 cm diameter
and 10 cm height were produced, as shown in Fig. 4. A total of 8 specimens were prepared for each type of concrete.
In a typical process, the raw materials were mixed together at a temperature of 25±3 °C and relative humidity of 55±15% for 5 min using a mechanical mixer (G.Paniz) to obtain a homogeneous mixture. The photographs of the mixing process are shown in Fig. 5.
The order of collocation of the materials is as follows: 1st step–mixing and homogenization of the coarse and fine aggregates, 2nd step–addition of half the amount of water required for the process, 3rd step–addition of the cement and the homogenization of the mixture,
Figure 51. Mixing process: (a) mixing and homogenization of the materials and (b) final homogenization of the mixture. Source: The authors
Figure 6. Equipment used for assessing the physical properties of the specimens: (a) drying of the specimen in the greenhouse, (b) determining the mass of the specimen using a hydrostatic weighing-machine and (c) compression test in the ELE machine. Source: The authors
4th step–addition of the remaining water, along with the additive, 5th step–addition of the residual powder obtained from the organic waste, 6th step–final homogenization of the mixture. We evaluated the physical characteristics of the
concrete specimens, including density, water absorption, and void content, according to the Brazilian standard [19]. In addition, the surface texture and compressive strength of the concrete specimens were determined according to the Brazilian standard [20]. The specimens were dried in the greenhouse (Quimis). The density of the specimens was evaluated using a hydrostatic weighing-machine (Mettler, accurate to 0.1 g, maximum capacity of 24 000 g). The compressive strength of the specimen was determined using a computerized machine (ELE) with an Autotest model. The surface structure of the specimens was rectified using an appropriate processing machine to obtain regular and smooth surfaces. Fig.6 presents the details of these tests and the equipment used.

Soto-Izquierdo & Antonio-Ramalho / DYNA 83 (195), pp. 147-155. February, 2016.
151
3. Results and discussion
3.1. Organic residual powder The microstructure of the residual powder was observed
using STEM. The corresponding images are shown in Fig. 7. The residual powder particles are composed of grains of different sizes and shapes. Some have a circular aspect, while some are lamellar with overlapping layers. Moreover, small particles are adhered on the surface.
The images obtained with the Image J program were used to measure the particle size. The corresponding results are summarized in Table 6. The particles in the residual powder have a broad size distribution is especially beneficial for using this material as concrete filler as it is expected to allow better filling of the voids in the cementitious matrix.
The chemical composition of the powder was determined using EDS. Fig. 8 illustrates the EDS spectra of three different organic residual powder samples. Table 7 summarizes the corresponding results obtained by averaging the values detected from three different organic residual powder samples. The proportions of sodium, magnesium, aluminum, silicon, phosphorus, sulfur, and chlorine are lower than 1%. The most abundant elements are carbon, oxygen, and calcium. Carbon is the fundamental element present in
Figure 2. STEM images of the organic residual powder: (a) sample 1, (b) sample 2, and (c) sample 3. Source: The authors
Table 6. Particle size of the organic residual powder
Sample 1 (µm) Sample 2 (µm) Sample 3 (µm) 3.88 2.94 4.56 3.50 4.36 6.37 5.03 2.08 3.82 5.31 2.75 2.79 1.89 5.27 7.31 2.18 2.26 3.69 2.89 2.95 2.16 1.75 1.59 1.34 2.74 2.07 1.47 1.70 2.89 1.84 5.46 1.63 2.13 5.17 3.06 1.69 2.95 4.56 3.95
Average 3.28 3.16 3.26 Source: The authors
Figure 8. EDS spectra of three different samples of organic residual powder: (a) sample 1, (b) sample 2, and (c) sample 3. Source: The authors
Table 7 Chemical composition of the organic residual powder
Element Type % Element (by mass) % Atoms C 21.37 29.50 O 58.19 61.00 Na 0.28 0.21 Mg 1.19 0.83 Al 0.21 0.13 Si 0.32 0.19 P 0.07 0.04 S 0.06 0.03 Cl 0.34 0.17 Ca 18.00 7.90
Total 100 100 Source: The authors
all animal and vegetable origin substances, while the abundance of oxygen indicates the nonmetallic and highly reactive nature of the material that easily forms compounds, especially oxides of the material.
Further analysis of heavy metals in the residual powder reveals the presence of different elements, listed in Table 8; < LOD (lower limit of detection) implies a very low concentration of the metal that is below the limit of precise quantification. The elements chromium, arsenic, cadmium, lead, and mercury, which are typically considered to be heavy elements, are found in very low concentrations. This
Table 8 Heavy metals present in the organic residual powder
Metals Values (mg/l)
Maximum Limit (mg/l)
Copper 7.76 - Chrome < LOD 5.0 Arsenic < LOD 1.0
Cadmium < LOD 0.5 Lead < LOD 1.0
Cobalt < LOD - Phosphorus 72.59 -
Nickel < LOD - Zinc 15.41 -
Mercury < LOD 0.1 Source: The authors

Soto-Izquierdo & Antonio-Ramalho / DYNA 83 (195), pp. 147-155. February, 2016.
152
Table 9. Physical characterization of the organic residual powder
Physical Properties Values Fineness-Retained # 200 (%) 0.20 Fineness-Retained # 325 (%) 1.50 Specific surface (cm2/g) 4.37 Specific gravity (g/cm3) 0.72
Source: The authors
Table 10. Physical characteristics of concrete with the organic residual powder
Concrete
Specific density – hardened state
(g/cm3)
Water absorption (%)
Void index – hardened state
(%)
Mean Sd CV (%)
Mean Sd CV (%)
Mean Sd CV (%)
Ref. 2.78 0.051 1.88 4.81 0.23 4.96 10.85 0.49 4.55 5% w. p 2.81 0.047 1.67 4.76 0.25 5.25 10.81 0.45 4.16 10% w.p 2.76 0.052 1.88 4.80 0.27 5.62 10.86 0.50 4.60 15% w.p 2.69 0.050 1.85 5.02 0.28 5.54 10.92 0.41 3.75 20% w.p 2.67 0.045 1.68 5.94 0.30 5.05 11.11 0.46 4.14
Source: The authors
complies with the limits highlighted in Appendix F of the Brazilian standard [21], which identifies hazardous waste. Based on these results, the residual powder obtained from organic waste can be rated “Not Dangerous Class II A Inert waste.”
Table 9 shows the test values with respect to the physical characterization of the organic residual powder. The test for specific gravity, specific surface, and granulometric analyses were performed according to the Brazilian standards [22], [23] and [24], respectively.
3.2. Concrete
Table 10 shows the physical characteristics of the
concrete with 0%, 5%, 10%, 15%, and 20% levels by weight of residual powder substituting the cement. The results include the mean, standard deviation (Sd), and coefficient of variation (CV) for each of the concrete.
The concrete with 5% organic residual powder exhibited a higher specific mass value. Hence, the concrete had a smaller value of water absorption and void content due to the refinement of the pores in the cement paste. The concrete with a higher ratio of organic residual powder (10%, 15%, and 20%) had lower performance in terms of its physical properties when compared with the reference concrete. This could be attributed to the less packaging that the mixture had.
Furthermore, we performed a detailed analysis of the compression strength of concrete using the Bootstrap technique. With this study, we obtained confidence intervals for the mean, standard deviation, and coefficient of variation of the study population with a 95% reliability, as shown in Table 11. Confidence intervals for populations were more informative than a result of only one value for a reduced number of observations because they provided a range of plausible values for an unknown parameter. Thus, one can better interpret the results and form the basis for decisions with a minimum level of risk. The Bootstrap method was
Table 11. Compressive strength of the concrete with organic residual powder
Concrete Compressive strength (MPa)
Average Sd CV (%) Lower Upper Lower Upper Lower Upper
Reference 32.96 34.28 0.65 1.17 1.97 3.41 5% waste powder
33.69 34.98 0.51 1.33 1.51 3.80
10% waste powder
27.40 28.95 0.66 1.60 2.40 5.52
15% waste powder
19.31 20.63 0.63 1.17 3.26 5.67
20% waste powder
9.54 10.93 0.47 1.24 4.92 11.34
Source: The authors
Figure 9. Box plot of the concrete’s compression strength data with organic residual powder. Source: The authors
applied with 5,000 resampling. The procedure is described in Appendix A.
The concrete with 5% residual powder showed superior results, and was better than that of the reference specimen. On the other hand, the use of higher concentrations of residual powder did not show satisfactory results, with the resistance being lower than in the concrete without organic residue.
For a better understanding of the results, we have made a box plot of the average resistance values of each concrete, which is shown in Fig. 9. The addition of 5% organic residual powder by weight that replaced the cement improved the cement binder; the size was decreased as was the number of pores. This resulted in a stronger concrete with lesser porosity.
The difference between the two means was analyzed using the Bootstrap technique. Therefore, the magnitude of these differences will be evaluated showing the number of times that the average compressive strength was statistically equal and different for a confidence level of 95%. This procedure is detailed in Appendix B.
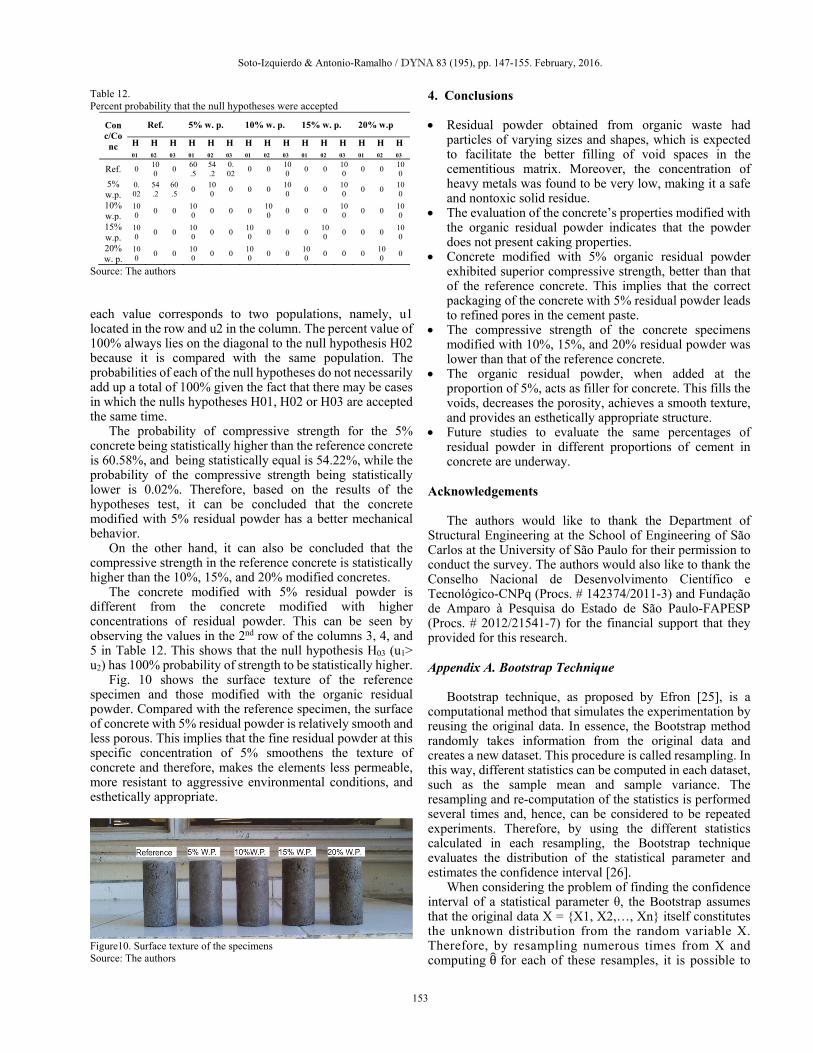
Table 12 shows the percentage probability that the null hypotheses H01, H02, and H03 were accepted. In the matrix,
Soto-Izquierdo & Antonio-Ramalho / DYNA 83 (195), pp. 147-155. February, 2016.
153
Table 12. Percent probability that the null hypotheses were accepted
Conc/Conc
Ref. 5% w. p. 10% w. p. 15% w. p. 20% w.p
H01
H02
H03
H01
H02
H03
H01
H02
H03
H01
H02
H03
H01
H02
H03
Ref. 0 100
0 60.5
54.2
0.02
0 0 100
0 0 100
0 0 100
5% w.p.
0.02
54.2
60.5
0 100
0 0 0 100
0 0 100
0 0 100
10% w.p.
100
0 0 100
0 0 0 100
0 0 0 100
0 0 100
15% w.p.
100
0 0 100
0 0 100
0 0 0 100
0 0 0 100
20% w. p.
100
0 0 100
0 0 100
0 0 100
0 0 0 100
0
Source: The authors
each value corresponds to two populations, namely, u1 located in the row and u2 in the column. The percent value of 100% always lies on the diagonal to the null hypothesis H02 because it is compared with the same population. The probabilities of each of the null hypotheses do not necessarily add up a total of 100% given the fact that there may be cases in which the nulls hypotheses H01, H02 or H03 are accepted the same time.
The probability of compressive strength for the 5% concrete being statistically higher than the reference concrete is 60.58%, and being statistically equal is 54.22%, while the probability of the compressive strength being statistically lower is 0.02%. Therefore, based on the results of the hypotheses test, it can be concluded that the concrete modified with 5% residual powder has a better mechanical behavior.
On the other hand, it can also be concluded that the compressive strength in the reference concrete is statistically higher than the 10%, 15%, and 20% modified concretes.
The concrete modified with 5% residual powder is different from the concrete modified with higher concentrations of residual powder. This can be seen by observing the values in the 2nd row of the columns 3, 4, and 5 in Table 12. This shows that the null hypothesis H03 (u1> u2) has 100% probability of strength to be statistically higher.
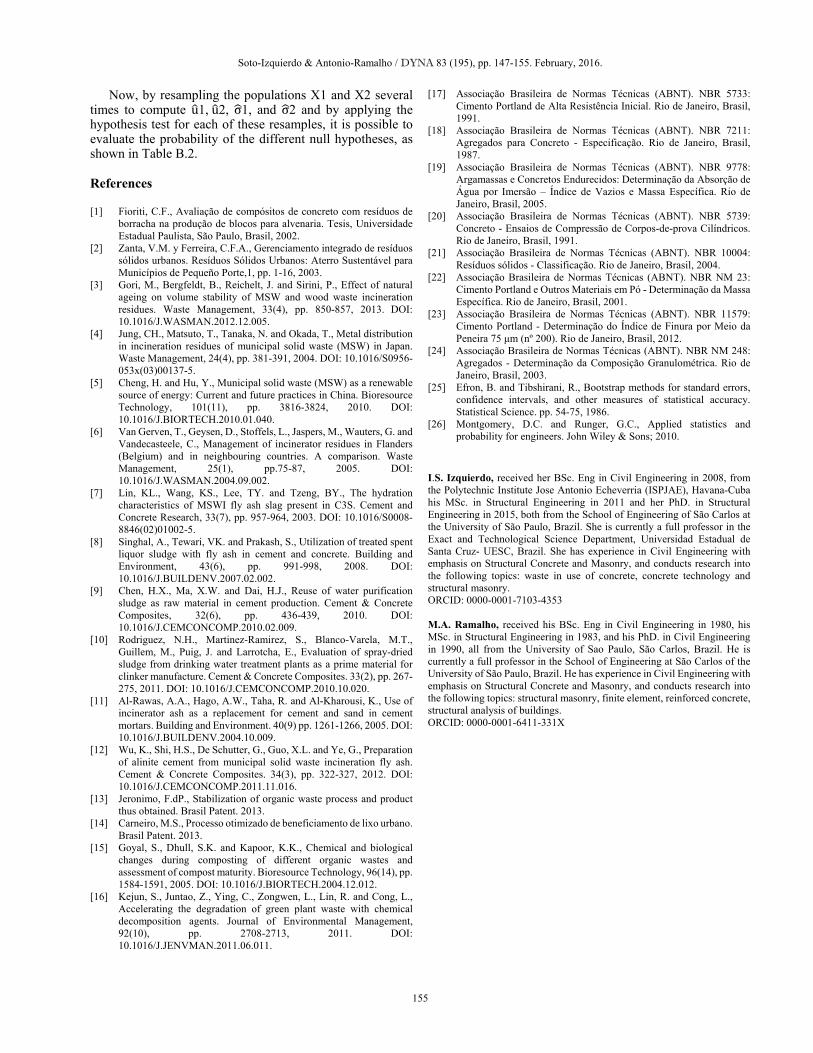
Fig. 10 shows the surface texture of the reference specimen and those modified with the organic residual powder. Compared with the reference specimen, the surface of concrete with 5% residual powder is relatively smooth and less porous. This implies that the fine residual powder at this specific concentration of 5% smoothens the texture of concrete and therefore, makes the elements less permeable, more resistant to aggressive environmental conditions, and esthetically appropriate.
Figure10. Surface texture of the specimens Source: The authors
4. Conclusions
Residual powder obtained from organic waste had particles of varying sizes and shapes, which is expected to facilitate the better filling of void spaces in the cementitious matrix. Moreover, the concentration of heavy metals was found to be very low, making it a safe and nontoxic solid residue.
The evaluation of the concrete’s properties modified with the organic residual powder indicates that the powder does not present caking properties.
Concrete modified with 5% organic residual powder exhibited superior compressive strength, better than that of the reference concrete. This implies that the correct packaging of the concrete with 5% residual powder leads to refined pores in the cement paste.
The compressive strength of the concrete specimens modified with 10%, 15%, and 20% residual powder was lower than that of the reference concrete.
The organic residual powder, when added at the proportion of 5%, acts as filler for concrete. This fills the voids, decreases the porosity, achieves a smooth texture, and provides an esthetically appropriate structure.
Future studies to evaluate the same percentages of residual powder in different proportions of cement in concrete are underway.
Acknowledgements The authors would like to thank the Department of
Structural Engineering at the School of Engineering of São Carlos at the University of São Paulo for their permission to conduct the survey. The authors would also like to thank the Conselho Nacional de Desenvolvimento Científico e Tecnológico-CNPq (Procs. # 142374/2011-3) and Fundação de Amparo à Pesquisa do Estado de São Paulo-FAPESP (Procs. # 2012/21541-7) for the financial support that they provided for this research.
Appendix A. Bootstrap Technique
Bootstrap technique, as proposed by Efron [25], is a
computational method that simulates the experimentation by reusing the original data. In essence, the Bootstrap method randomly takes information from the original data and creates a new dataset. This procedure is called resampling. In this way, different statistics can be computed in each dataset, such as the sample mean and sample variance. The resampling and re-computation of the statistics is performed several times and, hence, can be considered to be repeated experiments. Therefore, by using the different statistics calculated in each resampling, the Bootstrap technique evaluates the distribution of the statistical parameter and estimates the confidence interval [26].
When considering the problem of finding the confidence interval of a statistical parameter θ, the Bootstrap assumes that the original data X = {X1, X2,…, Xn} itself constitutes the unknown distribution from the random variable X. Therefore, by resampling numerous times from X and computing θ for each of these resamples, it is possible to

Soto-Izquierdo & Antonio-Ramalho / DYNA 83 (195), pp. 147-155. February, 2016.
154
Table A.1. Bootstrap procedure for calculating the confidence interval using the percentile method
Step 0: Conduct the experiment. Suppose that the original data is given by.
xnnXXXXX 1321 ...,,,
Step 1: Resampling. Draw a random sample of n values, with replacement, from
X. the Bootstrap resample is.
xnX 1* ?...,??,?,
In this step is possible that some of the original data appear more than once and others not at all.
Step 2. Calculation of the Bootstrap estimate. Calculate the statistic *θ, which can be the mean, the variance, etc.
Step 3. Repetition. Repeat Steps 1 and 2 a large number of times to obtain a total
of B Bootstrap estimates .θ.....θ,θ **2
*1 B
Step 4. Confidence interval with percentile method. The %α1100
Bootstrap confidence interval is **21
θ,θ qq ,where
2/1 Bq , 112 qBq and α is of significance level.
Source: The authors
obtain a Bootstrap distribution for θ, which approximates the distribution of θ. Using this, a confidence interval can be derived for θ. This procedure is described in Table A.1.
Appendix B. Inference on the difference between the two
means estimated using the Bootstrap method Traditionally, the test of hypotheses is used to study the
difference in the parameters of two populations. In essence, this method involves testing the equality of two parameters, according to a predetermined threshold probability. Thus, a significance level is defined to create a critical region. This critical region defines the set of all outcomes, which, if they occur, will lead us to decide that there is a difference between the parameters (negative result). In contrast, an outcome outside of the critical region will lead us to decide that there is no difference between the parameters (positive result) [26].
The Bootstrap method can estimate a range of likely values of the unknown population parameter, instead of only one value. Therefore, by calculating the hypothesis test of each value of the range, it is possible to evaluate the probability of either acceptance or rejection of the null hypotheses. This probability is more informative than a simple result of the hypothesis test, which either rejects or does not reject the null hypotheses.
The test of hypothesis considers the difference in means u1 and u2 of two normal distributions, where the variances σ1 and σ2 are unknown and not necessarily equal, i.e., σ1 ≠ σ2. Different null hypotheses, such as H01: u1<u2, H02: u1=u2 and H03: u1>u2, can be analyzed. A t-statistic is used to test these hypotheses. The solution obtained using the four-step hypothesis-testing procedure is as shown in Table B.1.
Table B.1. Hypothesis test for the difference between two means
Step 0. Evaluate the parameters of interest 1u , 2u , 1 , 2 , 1n and
2n of original data,
Where:
1n and 2n are sample size of populations 1 and 2,
respectively.
Step 1. Null hypothesis 2101 : uuH , 2102 : uuH and
2103 : uuH
Step 2. Define significance level .
Step 3. The test statistic.
2
22
1
21
210
ˆˆ
ˆˆ
nn
uut
with degrees of freedom given by
1
ˆ
1
ˆ
ˆˆ
2
2
2
22
1
2
1
21
2
2
22
1
21
n
n
n
n
nnv
Step 4. Accept H01 if vtt ,0
Accept H02 if vtt ,2/0 or if vtt ,2/0
Accept H03 if vtt ,0
Source: The authors
Table B.2. Probability of the null hypotheses with the Bootstrap method
Step 0: The original data are given by.
1111312111 ...,,, xnnXXXXX
2122322212 ...,,, xnnXXXXX
Step 1: Resampling. Draw a random sample from X1 and X2, the Bootstrap resamples are:
11
*1 ?...,??,?, xnX
21
*2 ?...,??,?, xnX
Step 2. Calculate the statistics 1u , 2u , 1 and 2 .
Step 3. Decide to either reject the null hypothesis or not reject it, according to Table B.1.
If the null hypotheses is true H01 then Z1=Z1+1. If the null hypotheses is true H02 then Z2=Z2+1. If the null hypotheses is true H03 then Z3=Z3+1. where Z1,Z2 and Z3 are counters of the number of times that the
null hypotheses H01, H02 and H03 are true. The initial value of Z1, Z2 and Z3 are equal to zero.
Step 3. Repetition. Repeat Steps 1, 2 and 3 a large number of times to obtain a total
of B Bootstrap estimates. Step 4. Calculate the probability of the null hypothesis H01, H02 and H03, as.
B
ZPH 1
01 *100(%) , B
ZPH 2
02 *100(%) , B
ZPH 3
03 *100(%)
Source: The authors
Soto-Izquierdo & Antonio-Ramalho / DYNA 83 (195), pp. 147-155. February, 2016.
155
Now, by resampling the populations X1 and X2 several times to compute u1,u2, σ1, and σ2 and by applying the hypothesis test for each of these resamples, it is possible to evaluate the probability of the different null hypotheses, as shown in Table B.2.
References
[1] Fioriti, C.F., Avaliação de compósitos de concreto com resíduos de
borracha na produção de blocos para alvenaria. Tesis, Universidade Estadual Paulista, São Paulo, Brasil, 2002.
[2] Zanta, V.M. y Ferreira, C.F.A., Gerenciamento integrado de resíduos sólidos urbanos. Resíduos Sólidos Urbanos: Aterro Sustentável para Municípios de Pequeño Porte,1, pp. 1-16, 2003.
[3] Gori, M., Bergfeldt, B., Reichelt, J. and Sirini, P., Effect of natural ageing on volume stability of MSW and wood waste incineration residues. Waste Management, 33(4), pp. 850-857, 2013. DOI: 10.1016/J.WASMAN.2012.12.005.
[4] Jung, CH., Matsuto, T., Tanaka, N. and Okada, T., Metal distribution in incineration residues of municipal solid waste (MSW) in Japan. Waste Management, 24(4), pp. 381-391, 2004. DOI: 10.1016/S0956-053x(03)00137-5.
[5] Cheng, H. and Hu, Y., Municipal solid waste (MSW) as a renewable source of energy: Current and future practices in China. Bioresource Technology, 101(11), pp. 3816-3824, 2010. DOI: 10.1016/J.BIORTECH.2010.01.040.
[6] Van Gerven, T., Geysen, D., Stoffels, L., Jaspers, M., Wauters, G. and Vandecasteele, C., Management of incinerator residues in Flanders (Belgium) and in neighbouring countries. A comparison. Waste Management, 25(1), pp.75-87, 2005. DOI: 10.1016/J.WASMAN.2004.09.002.
[7] Lin, KL., Wang, KS., Lee, TY. and Tzeng, BY., The hydration characteristics of MSWI fly ash slag present in C3S. Cement and Concrete Research, 33(7), pp. 957-964, 2003. DOI: 10.1016/S0008-8846(02)01002-5.
[8] Singhal, A., Tewari, VK. and Prakash, S., Utilization of treated spent liquor sludge with fly ash in cement and concrete. Building and Environment, 43(6), pp. 991-998, 2008. DOI: 10.1016/J.BUILDENV.2007.02.002.
[9] Chen, H.X., Ma, X.W. and Dai, H.J., Reuse of water purification sludge as raw material in cement production. Cement & Concrete Composites, 32(6), pp. 436-439, 2010. DOI: 10.1016/J.CEMCONCOMP.2010.02.009.
[10] Rodriguez, N.H., Martinez-Ramirez, S., Blanco-Varela, M.T., Guillem, M., Puig, J. and Larrotcha, E., Evaluation of spray-dried sludge from drinking water treatment plants as a prime material for clinker manufacture. Cement & Concrete Composites. 33(2), pp. 267-275, 2011. DOI: 10.1016/J.CEMCONCOMP.2010.10.020.
[11] Al-Rawas, A.A., Hago, A.W., Taha, R. and Al-Kharousi, K., Use of incinerator ash as a replacement for cement and sand in cement mortars. Building and Environment. 40(9) pp. 1261-1266, 2005. DOI: 10.1016/J.BUILDENV.2004.10.009.
[12] Wu, K., Shi, H.S., De Schutter, G., Guo, X.L. and Ye, G., Preparation of alinite cement from municipal solid waste incineration fly ash. Cement & Concrete Composites. 34(3), pp. 322-327, 2012. DOI: 10.1016/J.CEMCONCOMP.2011.11.016.
[13] Jeronimo, F.dP., Stabilization of organic waste process and product thus obtained. Brasil Patent. 2013.
[14] Carneiro, M.S., Processo otimizado de beneficiamento de lixo urbano. Brasil Patent. 2013.
[15] Goyal, S., Dhull, S.K. and Kapoor, K.K., Chemical and biological changes during composting of different organic wastes and assessment of compost maturity. Bioresource Technology, 96(14), pp. 1584-1591, 2005. DOI: 10.1016/J.BIORTECH.2004.12.012.
[16] Kejun, S., Juntao, Z., Ying, C., Zongwen, L., Lin, R. and Cong, L., Accelerating the degradation of green plant waste with chemical decomposition agents. Journal of Environmental Management, 92(10), pp. 2708-2713, 2011. DOI: 10.1016/J.JENVMAN.2011.06.011.
[17] Associação Brasileira de Normas Técnicas (ABNT). NBR 5733: Cimento Portland de Alta Resistência Inicial. Rio de Janeiro, Brasil, 1991.
[18] Associação Brasileira de Normas Técnicas (ABNT). NBR 7211: Agregados para Concreto - Especificação. Rio de Janeiro, Brasil, 1987.
[19] Associação Brasileira de Normas Técnicas (ABNT). NBR 9778: Argamassas e Concretos Endurecidos: Determinação da Absorção de Água por Imersão – Índice de Vazios e Massa Específica. Rio de Janeiro, Brasil, 2005.
[20] Associação Brasileira de Normas Técnicas (ABNT). NBR 5739: Concreto - Ensaios de Compressão de Corpos-de-prova Cilíndricos. Rio de Janeiro, Brasil, 1991.
[21] Associação Brasileira de Normas Técnicas (ABNT). NBR 10004: Resíduos sólidos - Classificação. Rio de Janeiro, Brasil, 2004.
[22] Associação Brasileira de Normas Técnicas (ABNT). NBR NM 23: Cimento Portland e Outros Materiais em Pó - Determinação da Massa Específica. Rio de Janeiro, Brasil, 2001.
[23] Associação Brasileira de Normas Técnicas (ABNT). NBR 11579: Cimento Portland - Determinação do Índice de Finura por Meio da Peneira 75 μm (nº 200). Rio de Janeiro, Brasil, 2012.
[24] Associação Brasileira de Normas Técnicas (ABNT). NBR NM 248: Agregados - Determinação da Composição Granulométrica. Rio de Janeiro, Brasil, 2003.
[25] Efron, B. and Tibshirani, R., Bootstrap methods for standard errors, confidence intervals, and other measures of statistical accuracy. Statistical Science. pp. 54-75, 1986.
[26] Montgomery, D.C. and Runger, G.C., Applied statistics and probability for engineers. John Wiley & Sons; 2010.
I.S. Izquierdo, received her BSc. Eng in Civil Engineering in 2008, from the Polytechnic Institute Jose Antonio Echeverria (ISPJAE), Havana-Cuba his MSc. in Structural Engineering in 2011 and her PhD. in Structural Engineering in 2015, both from the School of Engineering of São Carlos at the University of São Paulo, Brazil. She is currently a full professor in the Exact and Technological Science Department, Universidad Estadual de Santa Cruz- UESC, Brazil. She has experience in Civil Engineering with emphasis on Structural Concrete and Masonry, and conducts research into the following topics: waste in use of concrete, concrete technology and structural masonry. ORCID: 0000-0001-7103-4353 M.A. Ramalho, received his BSc. Eng in Civil Engineering in 1980, his MSc. in Structural Engineering in 1983, and his PhD. in Civil Engineering in 1990, all from the University of Sao Paulo, São Carlos, Brazil. He is currently a full professor in the School of Engineering at São Carlos of the University of São Paulo, Brazil. He has experience in Civil Engineering with emphasis on Structural Concrete and Masonry, and conducts research into the following topics: structural masonry, finite element, reinforced concrete, structural analysis of buildings. ORCID: 0000-0001-6411-331X