redalyc.identification and hydrocarbon expulsion history simulation
TRANSCRIPT

Revista Mexicana de Ciencias Geológicas
ISSN: 1026-8774
Universidad Nacional Autónoma de México
México
Jiang, Fujie; Pang, Xiongqi; Guo, Jigang; Zhou, Xinhuai; Zhou, Xiaohui; Liu, Dandan; Wang, Pengwei
Identification and hydrocarbon expulsion history simulation of the effective source rocks in the
Dongying Formation, Paleogene, Bohai Sea area, eastern China
Revista Mexicana de Ciencias Geológicas, vol. 30, núm. 2, 2013, pp. 355-370
Universidad Nacional Autónoma de México
Querétaro, México
Available in: http://www.redalyc.org/articulo.oa?id=57228307008
How to cite
Complete issue
More information about this article
Journal's homepage in redalyc.org
Scientific Information System
Network of Scientific Journals from Latin America, the Caribbean, Spain and Portugal
Non-profit academic project, developed under the open access initiative

Hydrocarbon expulsion, Dongying Formation, Bohai Sea area, eastern China 355
ABSTRACT
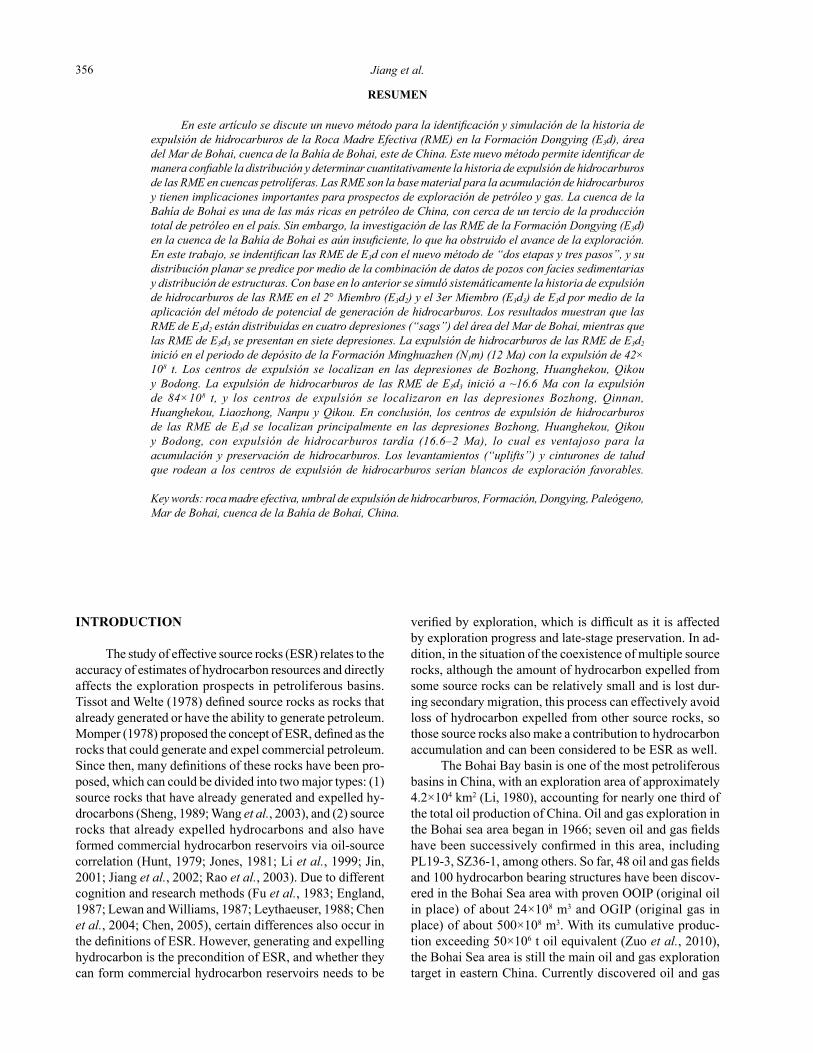
This paper discusses a new method for identification and simulation of the hydrocarbon expulsion history of Effective Source Rocks (ESR) in the Dongying Formation (E3d), Bohai sea area, Bohai Bay basin, eastern China. This new method enables us to reliably identify the distribution and quantitatively determine the hydrocarbon expulsion history of ESR in petroliferous basins. ESR are the material basis for hydrocarbon accumulation, having important implications for oil and gas exploration prospects. The Bohai Bay basin is one of the most petroliferous basins in China, with nearly one third of the total oil production of the country. However, insufficient research on the ESR in the Dongying Formation (E3d), Bohai sea area, Bohai Bay basin obstructs further exploration. In this paper, ESR of E3d are identified with the new “two-stage and three-step” method, and their planar distribution is predicted by combining well data with sedimentary facies, and structure distribution. On that basis, the hydrocarbon expulsion history of ESR in the 2nd Member (E3d2) and 3rd Member (E3d3) of E3d was systematically simulated by using the hydrocarbon generation potential method. The results show that the ESR of E3d2 are distributed in four sags of Bohai Sea area, while the ESR of E3d3 occur in seven sags. Hydrocarbon expulsion from the ESR of E3d2 began during the deposition period of the Minghuazhen Formation (N1m) (12 Ma) with a hydrocarbon expulsion quantity of 42×108 t. The hydrocarbon expulsion centers were located in the Bozhong, Huanghekou, Qikou and Bodong sags. Hydrocarbon expulsion from the ESR of E3d3 began around 16.6 Ma ago (hydrocarbon expulsion quantity of 84×108 t), and the hydrocarbon expulsion centers were located in the Bozhong, Qinnan, Huanghekou, Liaozhong, Nanpu and Qikou sags. In conclusion, the hydrocarbon expulsion centers of the ESR of E3d are mainly located in Bozhong, Huanghekou, Qikou and Bodong sags, with late-stage hydrocarbon expulsion (16.6–2 Ma), which is advantageous to hydrocarbon accumulation and preservation. The uplifts and slope belts around the hydrocarbon expulsion centers would be favorable exploration targets.
Key words: effective source rocks (ESR), hydrocarbon expulsion threshold, Dongying Formation, Paleogene, Bohai Sea, Bohai Bay basin, China.
Identification and hydrocarbon expulsion history simulation of the effective source rocks in the Dongying Formation, Paleogene,
Bohai Sea area, eastern China
Fujie Jiang1,2,*, Xiongqi Pang1,2, Jigang Guo1,2, Xinhuai Zhou3, Xiaohui Zhou4, Dandan Liu3, and Pengwei Wang1,2
1State Key Laboratory of Petroleum Resources and Prospecting, China University of Petroleum, Beijing 102249, China.
2Basin and Reservoir Research Center, China University of Petroleum, Beijing 102249, China.3Tianjin Branch of CNOOC China Limited, Tianjin 300452, China.
4Sinopec Geophysical Research Institute, Nanjing in Jiangsu Province 210014, China.* [email protected]
Revista Mexicana de Ciencias Geológicas, v. 30, núm. 2, 2013, p. 355-370
Jiang, F., Pang, X.,Guo, J., Zhou, X., Zhou, X., Liu, D., Wang, P., 2013, Identification and hydrocarbon expulsion history simulation of the effective source rocks in the Dongying Formation, Paleogene, Bohai Sea area, eastern China: Revista Mexicana de Ciencias Geológicas, v. 30, núm. 2, p. 355-370.
Jiang et al.356
INTRODUCTION
The study of effective source rocks (ESR) relates to the accuracy of estimates of hydrocarbon resources and directly affects the exploration prospects in petroliferous basins. Tissot and Welte (1978) defined source rocks as rocks that already generated or have the ability to generate petroleum. Momper (1978) proposed the concept of ESR, defined as the rocks that could generate and expel commercial petroleum. Since then, many definitions of these rocks have been pro-posed, which can could be divided into two major types: (1) source rocks that have already generated and expelled hy-drocarbons (Sheng, 1989; Wang et al., 2003), and (2) source rocks that already expelled hydrocarbons and also have formed commercial hydrocarbon reservoirs via oil-source correlation (Hunt, 1979; Jones, 1981; Li et al., 1999; Jin, 2001; Jiang et al., 2002; Rao et al., 2003). Due to different cognition and research methods (Fu et al., 1983; England, 1987; Lewan and Williams, 1987; Leythaeuser, 1988; Chen et al., 2004; Chen, 2005), certain differences also occur in the definitions of ESR. However, generating and expelling hydrocarbon is the precondition of ESR, and whether they can form commercial hydrocarbon reservoirs needs to be
verified by exploration, which is difficult as it is affected by exploration progress and late-stage preservation. In ad-dition, in the situation of the coexistence of multiple source rocks, although the amount of hydrocarbon expelled from some source rocks can be relatively small and is lost dur-ing secondary migration, this process can effectively avoid loss of hydrocarbon expelled from other source rocks, so those source rocks also make a contribution to hydrocarbon accumulation and can been considered to be ESR as well.
The Bohai Bay basin is one of the most petroliferous basins in China, with an exploration area of approximately 4.2×10⁴ km2 (Li, 1980), accounting for nearly one third of the total oil production of China. Oil and gas exploration in the Bohai sea area began in 1966; seven oil and gas fields have been successively confirmed in this area, including PL19-3, SZ36-1, among others. So far, 48 oil and gas fields and 100 hydrocarbon bearing structures have been discov-ered in the Bohai Sea area with proven OOIP (original oil in place) of about 24×108 m3 and OGIP (original gas in place) of about 500×108 m3. With its cumulative produc-tion exceeding 50×106 t oil equivalent (Zuo et al., 2010), the Bohai Sea area is still the main oil and gas exploration target in eastern China. Currently discovered oil and gas
RESUMEN
En este artículo se discute un nuevo método para la identificación y simulación de la historia de expulsión de hidrocarburos de la Roca Madre Efectiva (RME) en la Formación Dongying (E3d), área del Mar de Bohai, cuenca de la Bahía de Bohai, este de China. Este nuevo método permite identificar de manera confiable la distribución y determinar cuantitativamente la historia de expulsión de hidrocarburos de las RME en cuencas petrolíferas. Las RME son la base material para la acumulación de hidrocarburos y tienen implicaciones importantes para prospectos de exploración de petróleo y gas. La cuenca de la Bahía de Bohai es una de las más ricas en petróleo de China, con cerca de un tercio de la producción total de petróleo en el país. Sin embargo, la investigación de las RME de la Formación Dongying (E3d) en la cuenca de la Bahía de Bohai es aún insuficiente, lo que ha obstruido el avance de la exploración. En este trabajo, se indentifican las RME de E3d con el nuevo método de “dos etapas y tres pasos”, y su distribución planar se predice por medio de la combinación de datos de pozos con facies sedimentarias y distribución de estructuras. Con base en lo anterior se simuló sistemáticamente la historia de expulsión de hidrocarburos de las RME en el 2° Miembro (E3d2) y el 3er Miembro (E3d3) de E3d por medio de la aplicación del método de potencial de generación de hidrocarburos. Los resultados muestran que las RME de E3d2 están distribuidas en cuatro depresiones (“sags”) del área del Mar de Bohai, mientras que las RME de E3d3 se presentan en siete depresiones. La expulsión de hidrocarburos de las RME de E3d2 inició en el periodo de depósito de la Formación Minghuazhen (N1m) (12 Ma) con la expulsión de 42×108 t. Los centros de expulsión se localizan en las depresiones de Bozhong, Huanghekou, Qikou y Bodong. La expulsión de hidrocarburos de las RME de E3d3 inició a ~16.6 Ma con la expulsión de 84×108 t, y los centros de expulsión se localizaron en las depresiones Bozhong, Qinnan, Huanghekou, Liaozhong, Nanpu y Qikou. En conclusión, los centros de expulsión de hidrocarburos de las RME de E3d se localizan principalmente en las depresiones Bozhong, Huanghekou, Qikou y Bodong, con expulsión de hidrocarburos tardía (16.6–2 Ma), lo cual es ventajoso para la acumulación y preservación de hidrocarburos. Los levantamientos (“uplifts”) y cinturones de talud que rodean a los centros de expulsión de hidrocarburos serían blancos de exploración favorables.
Key words: roca madre efectiva, umbral de expulsión de hidrocarburos, Formación, Dongying, Paleógeno, Mar de Bohai, cuenca de la Bahía de Bohai, China.

Hydrocarbon expulsion, Dongying Formation, Bohai Sea area, eastern China 357
N
0 25 50km
Oil Fieldand GasUplift
FaultStructural unit boundaryTanlu Fault Zone
Profile PositionA A,
PL19-3
Sag
Beijing
Bohai BayBasin
4030`
°41
00`°
4000`
°39
30`°
3900`
°38
30`°
3800`
°37
30`°
3700`
°
118° 119°118 30`° 120°119 30`° 121°120 30`° 122°121 30`°117 30`°
Tang
Gu
Tang Shan
Qing Huangdao
Jin Xi
Ying Kou
Jin Zhou
Lv ShunDa Lian
Peng Lai
Lai Zhou
Shaleitian Uplift
Huanghekou Sag
Shaleitian Sag
Qikou
Sag
Bozhong Sag
Nanpu Sag
Lower UpliftBonan
LaizhouwanSag
Lower Uplift
Laibei
Qingdong
Sag
Weibei UpliftN( )
Weibei Uplift S( )
Lainan Sag
Kendo
ng Q
ingt
uozi
Uplift
Miao
xiUpl
iftN()
Miaoxi UpliftS( )
Mia
oxi
Sag
Chenbei Lower Uplift
Chengbei Sag
Chengzikou Uplift
Shijiutuo Uplift
Qinnan Sag
Qinnan UpliftLiao
xi S
agLiao
zhon
gSa
gLiao
dong
Sag
Liaoxi UpliftS( )
Liaoxi
Uplift
Liaodo
ngUpli
ftBodong
Lower
Uplift
Liaoxi
Upl
ift
Bodo
ng S
ag
A
A ,
0123456789
10
Alt
itud
ekm/
N Q2 1m -
N1 2m
N1g
E3 1 2s +E3d
0 5 10km
A A’
Qinnan SagQinnan Uplift Bozhong Sag Bodong SagBodong
Lower Uplift Miaoxi Uplift MiaoxiSag
E2 3sE -E2 4 1S k
PL19
-3SZ36-1
GEOLOGICAL SETTING
Geographic location and tectonic framework
The Bohai Sea area is located between the Tanlu and Cangdong faults, belongs to the seaward extension part of four primary structural units, including Liaohe and Huanghua depressions, Chengning uplift and Jiyang depres-sion. The Bohai Sea area contains mainly 15 sags and 16 uplifts (Figure 1, Zhang, 2000; Tang et al., 2011).
Affected by Caledonian, Indosinian and Yanshanian
fields show an unbalanced geological distribution, with shallow buried fields being more abundant than deep buried ones, and fields are locally distributed. The main reason is the complex geological conditions and inadequate research on source rocks, especially the research of ESR, which handicaps further exploration. A new method for identifica-tion and hydrocarbon expulsion history simulation of ESR in E3d, Bohai Sea area is discussed in this paper. This new method enables us to reliably recognize the distribution and quantitatively determine the hydrocarbon expulsion history of ESR in petroliferous basins.
Figure 1. Distribution of tectonic units and profile structural characteristics of Bohai Sea area.
Jiang et al.358
PinaceaeBetulaceaeSporotra-poiditesmionr
--
JuglandaceaeBetulaceae
-
UlmipollenitesPiceaepollenitesTsugaepollenites
--
Quercoidites Meliaceoidit-Epherdripites Rutaceoipolls-
PolypodiaceaesportesQuercoiditesmicrohenriciQuercoiditesminutus
-
EphedripitesUlmipollenitesQuercoidites
--
EphedripitesUlmipollenitesRhoipitesSchizaeoisporites
--
-
UlmoideipitesMomipitesPodocapidites
--
ParaalnipollenitesBetulaepollenitesplicoidesAquilapollenites
--
-
Taxodiacaepolleniteselongatus Alnipollenites- -
24.627.4
30.3
32.8
3 .5 8
50 5.
42 0.
12.0
5.1
2.0
16.6
54.9
65.0
3 .8 0
N1g
N1 2m
N2 1m
E1 3k
E1k2
E1k1
E2 4s
E2 3s
E2 2s
E2 1s
E3 3d
E3 2d
E3 1d
Min
ghua
zhen
Gua
ntao
Don
gyin
gSh
ahej
ieK
ongd
ian
Mio
cene
Pliocene
Neo
gene
Pale
ogen
e
Olig
ocen
eE
ocen
ePa
laoc
ene
Pingyuan Qp 231-676
0-1204
0-2334
0-893
0-1658
0-1757
0-1555
0-2348
0-825
Quaternary
GeologicAge(Ma)
Strata
Formation SymbolLithology Thickness
(m)Sporopollen
diversitySporopollenassemblage
Basin structureevolution stagePhase Cycle
0-512
0-841
0-1021
0-791
Basement
SourceRock Reservoir Cap Rock
Riftingphase I
Post-riftingphase I
Synrifting stagePost-fault therm
al subsidence stage
Riftingphase Ⅱ
Riftingphase Ⅲ
Riftingphase Ⅳ
Post-riftingphase Ⅱ
DolostoneLimestoneMudstoneSandstoneConglomerate Source Rock Cap RockReservoirPre-Paleocene
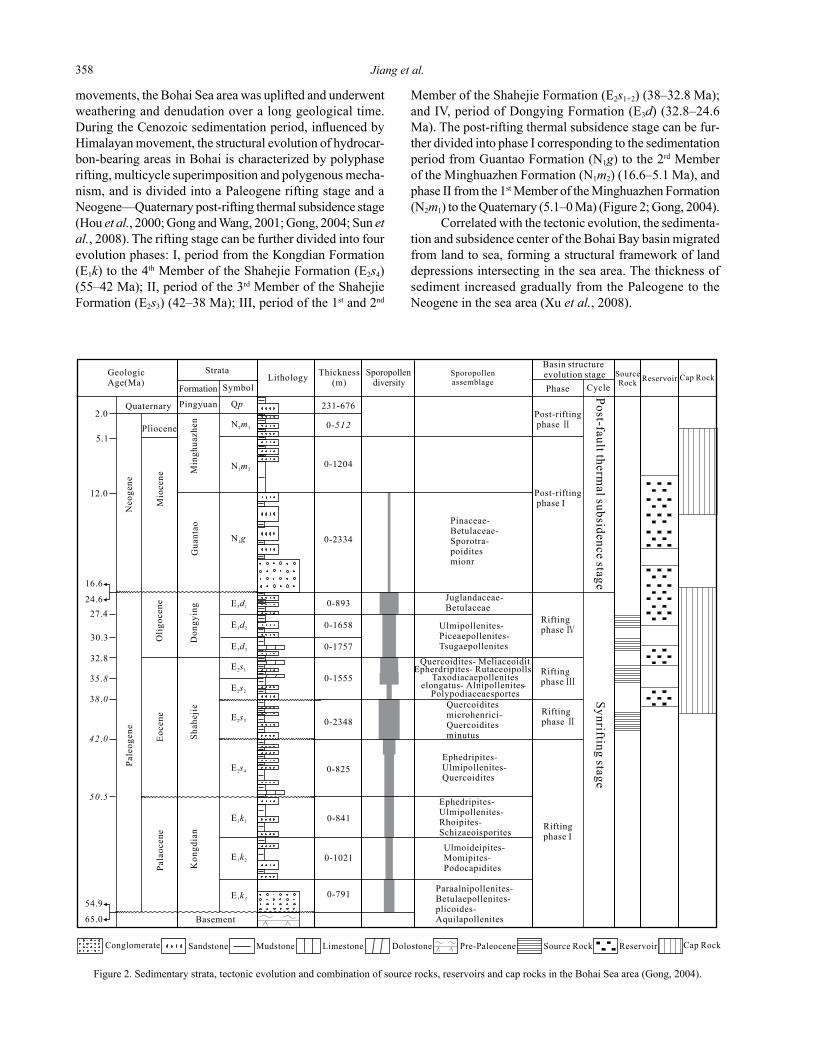
Figure 2. Sedimentary strata, tectonic evolution and combination of source rocks, reservoirs and cap rocks in the Bohai Sea area (Gong, 2004).
movements, the Bohai Sea area was uplifted and underwent weathering and denudation over a long geological time. During the Cenozoic sedimentation period, influenced by Himalayan movement, the structural evolution of hydrocar-bon-bearing areas in Bohai is characterized by polyphase rifting, multicycle superimposition and polygenous mecha-nism, and is divided into a Paleogene rifting stage and a Neogene—Quaternary post-rifting thermal subsidence stage (Hou et al., 2000; Gong and Wang, 2001; Gong, 2004; Sun et al., 2008). The rifting stage can be further divided into four evolution phases: I, period from the Kongdian Formation (E1k) to the 4th Member of the Shahejie Formation (E2s4) (55–42 Ma); II, period of the 3rd Member of the Shahejie Formation (E2s3) (42–38 Ma); III, period of the 1st and 2nd
Member of the Shahejie Formation (E2s1+2) (38–32.8 Ma); and IV, period of Dongying Formation (E3d) (32.8–24.6 Ma). The post-rifting thermal subsidence stage can be fur-ther divided into phase I corresponding to the sedimentation period from Guantao Formation (N1g) to the 2rd Member of the Minghuazhen Formation (N1m2) (16.6–5.1 Ma), and phase II from the 1st Member of the Minghuazhen Formation (N2m1) to the Quaternary (5.1–0 Ma) (Figure 2; Gong, 2004).
Correlated with the tectonic evolution, the sedimenta-tion and subsidence center of the Bohai Bay basin migrated from land to sea, forming a structural framework of land depressions intersecting in the sea area. The thickness of sediment increased gradually from the Paleogene to the Neogene in the sea area (Xu et al., 2008).

Hydrocarbon expulsion, Dongying Formation, Bohai Sea area, eastern China 359
Sedimentary strata
The sedimentary formations in the Bohai sea area mainly include Paleogene, Neogene and Quaternary sedi-ments from bottom to top (Figure 2; Gong, 2004). Rift valley sedimentation is preserved in the Paleogene strata, which indicate that lake basins with lacustrine sedimentation were well developed. In the Neogene, lakes basically disap-peared, and deposition was characterized by fluvial plain and shore-shallow lake environments. Quaternary strata are mainly marine deposits. According to lithologic features, the whole Cenozoic basin-filling sequence can be divided into six formations from the bottom up (Figure 2, Gong, 2004): Kongdian(E1k), Shahejie (E2s) and Dongying formations (E3d) of Paleogene age, Guantao (N1g) and Minghuazhen formations (N1+2m) of Neogene age, and the Pingyuan Formation (Qp) of Quaternary age (Figure 2, Gong, 2004).
Introduction to oil and gas geology, and characteristics of source rocks
Reservoirs in the Bohai Sea area are mainly distributed around Bozhong, Huanghekou and Liaozhong sags, and the biggest offshore reservoir PL19-3 is situated at the Bonan lower uplift between the Bozhong and Huanghekou sags (Figure 1). Industrial oil flows have been found in Shahejie, Dongying, Guantao and Minghuazhen formations, and they are mainly in the 1st Member of the Dongying Formation and in the Guantao Formation, where the discovered oil and gas reserve is roughly 50% of total discovered reserve (Zuo et al., 2010). The distribution of main source rocks, reservoirs and caprocks in the Bohai Sea area is shown in Figure 2.
Four sets of source rocks are developed in the Bohai Sea area: the 3rd Member of the Shahejie Formation (E2s3), the 1st and 2nd Members of the Shahejie Formation (E2s1+2), the 3rd Member of Dongying Formation (E3d3), and the 2nd Member of Dongying Formation (E3d2) (Figure 2, Gong, 2004). So far, due to its deep burial depth, 58 wells have been drilled in the source rocks of E2s3, and the bottom boundary is deepest in the Bozhong sag (8000 m) and it exceeds 3000 m in most of the sea area.
The source rocks of E2s1+2 are extensively distributed, but their thickness is rather low with an average thickness less than 200 m. The lithology of the source rocks of E2s1+2
is mainly dark mudstone deposits, and their maximum burial depth can reach 6000 m in the Bozhong sag.
The dark mudstones of E3d have a large thickness and a wide distribution range. The sedimentary facies include fan delta, braided river delta, sublacustrine fan, and lake (Xu, 1981). Lacustrine deposit systems are widely distributed and two main subsidence centers formed in the Bozhong and Liaozhong sags (Deng et al., 2011). The lithology is thick dark gray-blackish mudstone interbedded with thin sandstone. Deep and semi-deep lake deposits were developed in the deep depressed part of all sags, and shore-
shallow lake deposits were distributed in the slope part of lake basins. The maximum strata thickness is 1080 m, with an average of about 600 m. The maximum burial depth is 5500 m in the Bozhong sag. The sedimentary facies of E3d2
correspond to fan delta, braided river delta, meandering river delta, reticular river delta, sublacustrine fan, and lake. Semi-deep to deep lake deposits developed in the deep depressed part of sags. The lithology assemblage contains mainly thick-bedded, grayish-black and black mudstone interbedded with thin sandstone; the subsidence center was located in the Bozhong sag. The maximum strata thickness is 1650 m with an average thickness of about 800 m, and on the whole, the burial depth is around 1000 to 4500 m.
Many studies of source rocks of the Shahejie Formation have been conducted (Chi, 2001; Hu et al., 2001; Wang and Zhang, 2003; Jiang et al., 2010a), while systematic and further research on the source rocks of E3d is rare (Li et al., 2001; Huang and Li, 2002). With recent exploration prac-tices, oil and gas discoveries in E3d has increased greatly (Wang et al., 2006). Therefore, the comprehensive study of the effectiveness and hydrocarbon supply capacity of the source rocks in E3d and their variation in different sags is of great geologic significance for furthering the recognition of oil and gas sources and expanding the exploration extent in the Bohai Sea area. Especially, with the development of seismic exploration in recent years, plenty of geologic and geochemical data of source rocks have been obtained, ena-bling systematic evaluation of source rocks. Aiming at the existing problems in exploration, combining with the new recognition of the regional structural evolution history and sedimentary facies distribution, by systematically analyzing drilling data and geochemical data, in this paper the ESR of E3d are identified and their hydrocarbon expulsion history is outlined. The study provides reference information on oil and gas resource potential to guide exploration directions in the Bohai Sea area.
METHODS
Determination of ESR
Many methods for determining ESR have been pro-posed, including identification through simulation ex-periments, identification based on a lower limit of organic carbon content, and identification using analysis of the hydrocarbon content in closely sampled core samples (Jiang et al., 2010b). However, the applications of these methods are limited by core availability, experimental analysis cost, sample amount and experiment conditions, which leads to poor maneuverability and lopsided results. This paper dis-cusses a new method for identification of the ESR in E3d, named the “two-stage and three-step method” (Jiang et al., 2010b). This new method enables us to reliably determine distribution of ESR in petroliferous basins. The process of this method is as follows:
Jiang et al.360
TOCRo
TOC
TOC TOC
TOC
/%
Method: Collect statistics fordark mudstones thicknessand distribution characterand set up database of themwith exploratory wells andlogging information.
Stage 2: Geological analysis
Step 1: According to hydrocarbon
expulsion threshold theory confirm
hydrocarbon expulsion threshold
with hydrocarbon-generated
potential method so that those
dark mudstones that do not cross
the threshold can be rejected
,
.
Stage 2: Geological analysisStep 2: According to threshold chartreject thickness of those darkmudstones that have crossed thehydrocarbon expulsion thresholdbut have not expelled hydrocarbonby using relationship between organicmatter abundance kerogen type andevolution degree so that effectivesource rocks thickness can be obtained
,
,
.
Can discharge hydrocarbonCan not discharge hydrocarbon
Confirm hydrocarbonexpulsion threshold with
hydrocarbon-generated potential method
Hydrocarbon expulsion threshold chart
Ro
Ro Ro
Stage 1 Geological statistics:
b)
a)
c)
SRI=75
SRI=50
SRI=25
SRI=0
Ro/%
Critical line
sequence numberof dark mudstone
Z0 : hydrocarbon expulsionthreshold
Z0 : hydrocarbon expulsionthreshold
(S S )/TOC1 2+ (mg g )/ TOC
Hydrocarbonexpulsionthreshold
Dep
thor
Ro)
(
S2S1 HCIO
HCIP
qe
#1-1
#2-1
#2-3
#2-4
#2-6
#2-7
#2-8
#2-9
#3-2#3-3
#3-4#3-5
#3-6
#3-7#3-8
#4-1
#4-3
#1-1
#1-2
#2-1#2-2
#2-3#2-4
#2-5#2-6#2-7
#2-8
#2-9
#3-1
#3-2
#3-3
#3-4
#3-5
#3-6
#3-7 #3-8
#4-1#4-2 #4-3
#2-1#2-2
#2-3
#2-4#2-5
#2-6
#2-7#2-8
#2-9
#3-1#3-2
#3-3
#3-4#3-5
#3-6
#3-7#3-8
#4-1#4-2
#4-3
#1-1#1-2
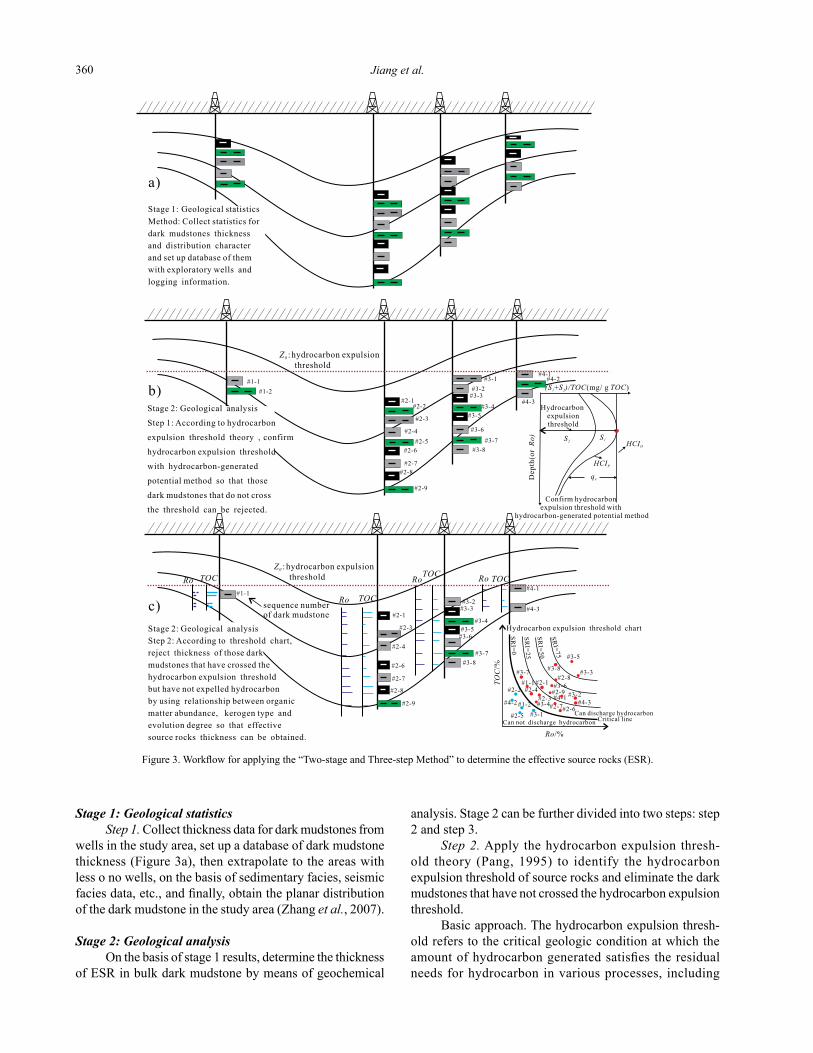
analysis. Stage 2 can be further divided into two steps: step 2 and step 3.
Step 2. Apply the hydrocarbon expulsion thresh-old theory (Pang, 1995) to identify the hydrocarbon expulsion threshold of source rocks and eliminate the dark mudstones that have not crossed the hydrocarbon expulsion threshold.
Basic approach. The hydrocarbon expulsion thresh-old refers to the critical geologic condition at which the amount of hydrocarbon generated satisfies the residual needs for hydrocarbon in various processes, including
Stage 1: Geological statistics Step 1. Collect thickness data for dark mudstones from
wells in the study area, set up a database of dark mudstone thickness (Figure 3a), then extrapolate to the areas with less o no wells, on the basis of sedimentary facies, seismic facies data, etc., and finally, obtain the planar distribution of the dark mudstone in the study area (Zhang et al., 2007).
Stage 2: Geological analysis On the basis of stage 1 results, determine the thickness
of ESR in bulk dark mudstone by means of geochemical
Figure 3. Workflow for applying the “Two-stage and Three-step Method” to determine the effective source rocks (ESR).

Hydrocarbon expulsion, Dongying Formation, Bohai Sea area, eastern China 361
Hydrocarbon expulsionratio (mg/g )TOC
Hydrocarbon expulsionrate (mg/g /100m)TOC
Hydrocarbon expulsionefficiency (%)( + )/ (mg/g )S S TOC TOC1 2
Dep
th (m
)
(a) TypeⅠ
(b)TypeⅡ
(c)Type Ⅲ
2750m
2800m
2880m
0 250 500 750 1000 0 0 0250 500 750 25 50 75 25 50 750
1000
2000
3000
4000
5000
0
1000
2000
3000
4000
5000
0
1000
2000
3000
4000
5000
0
1000
2000
3000
4000
50000
1000
2000
3000
4000
5000
0
1000
2000
3000
4000
5000
0
1000
2000
3000
4000
5000
0
1000
2000
3000
4000
5000
0
1000
2000
3000
4000
5000
0
1000
2000
3000
4000
5000
0
1000
2000
3000
4000
5000
0
1000
2000
3000
4000
5000
0 250 500 750 1000
0 250 500 750
0 250 500 750
0 100 200 300
0 20 40 60 0 20 40 60
0 20 40 60 0 20 40 60
total organic content (TOC) ratio could be used to deline-ate the potential of source rocks to generate hydrocarbons. In other words, it could reflect volumes of hydrocarbons generated by per unit of TOC in the source rocks. Zhou and Pang (2002) called the (S1+S2)/TOC ratio as Hydrocarbon Generation Potential Index. Hydrocarbon expulsion begins (Figure 3b) when the index starts to decrease and the critical geologic condition is defined as the hydrocarbon expulsion threshold. Those dark mudstones that have not crossed the hydrocarbon expulsion threshold could be reasonably eliminated after determining the hydrocarbon expulsion threshold.
Different types of organic matter in source rocks will result in differences in hydrocarbon generation potential and hydrocarbon expulsion (Pang, 1995). The organic matter types of source rocks in the study area can be classified into three groups: Type I kerogen is mainly located in the center of the sag, Type III is distributed in the edge of the sag, and type II is located between them (Li et al.,2001; Chi, 2001; Wang et al.,2004). Thus, in this paper, three hydrocarbon expulsion geological models are established. The models are
self-adsorption, interstitial water dissolution, oil dissolu-tion (gas), capillary blockage, etc. Consequently, lots of oil and gas can be expelled and can migrate in separate phases during the burial process (Pang, 1995). It is obvious that only dark mudstones that had crossed the hydrocarbon expulsion threshold could possibly expel hydrocarbons, and the hydrocarbon generation potential method can be used for discrimination (Zhou and Pang, 2002; Jiang et al., 2007). The method is theoretically based on the principle of conservation of matter, namely that the amount of organic matter in the source rocks remains constant before and after hydrocarbon generation and migration. A decrease in the amount of the organic matter can occur as result of substance exchange between the source rocks and the surroundings. In terms of Rock-Eval pyrolysis, S1 repre-sents free volatile hydrocarbons thermally flushed from a rock sample at 300 °C, S2 represents products of cracking during standard Rock-Eval pyrolysis temperatures (300–600 °C), and the sum (S1+S2) is generally used to signify the content of hydrocarbon in source rocks (Espitalie et al., 1977; Tissot and Welte,1978,1984). Thus, the (S1+S2)/
Figure 4. Hydrocarbon expulsion models of different types of organic matter in E3d in the Bohai Sea area.

Jiang et al.362
(S +S )/TOC(mg/g TOC)1 2 Expelled HC( )mg/g TOC
1000
2000
3000
4000
5000
Dep
th(m
) Expulsion curve
Residual curve
Expulsion threshold
1000
2000
3000
4000
5000
Qp
QeQr
based on the type of kerogen (Figure 4), using a database of 1234 Rock-Eval pyrolysis analysis of samples from the Dongying Formation, Bohai Sea area (Table 1).
Step 3. Determine the ESR that have crossed the hydrocarbon expulsion threshold using the hydrocarbon expulsion threshold chart.
Basic approach. The abundance of organic matter in source rocks is strongly heterogeneous. Therefore, the bulk dark mudstone which has crossed the hydrocarbon expulsion threshold may still contain some parts that can-not expel hydrocarbons due to poor quality. These kinds of dark mudstones can be calibrated using a hydrocarbon expulsion threshold identification chart. The effective thickness of source rocks can be determined by using the correlation chart of organic matter abundance, kerogen type and thermal evolution degree, which can get rid of the dark mudstone that cannot expel hydrocarbon due to their poor quality (Figure 3c). Data calibration and mapping are performed to get the planar thickness distribution of ESR by using the ratio of the obtained ESR to the formation thick-ness in wells. Hydrocarbon Source Rock Index (SRI) charts are used in this paper (Pang, 2003). The SRI represents the percentage of the actually expelled hydrocarbon compared to the amount of hydrocarbon that would be expelled from optimal source rocks. Source rocks of the semi lacustrine to deep lacustrine facies of the Qing Shankou Formation, deposited in Songliao Basin, are considered to be the best ones in the China eastern continental sedimentary basin because they have the highest organic matter abundance and high to very high organic matter maturity. Therefore, source rocks of Qing Shankou Formation were utilized as a standard in the evaluation of source rocks, being termed as the optimal source rocks. The equation to calculate the SRI is as follows:
(1)
Where Qp and Qrm represent the hydrocarbon gen-eration amount of source rocks and the critical saturation amount of residual hydrocarbons, respectively; Qem repre-sents the amount of hydrocarbon expulsion from optimal source rocks.
Values of SRI<0 mean that the amount of hydrocarbons
generated in rocks is less than the critical saturation amount of residual hydrocarbons, and thus the rocks are non-source rocks; on the contrary, rocks are considered source rocks when SRI >0. The larger the SRI, the better the quality of source rocks (Figure 3c). A statistical analysis of numerous geologic data undertaken by Pang (1995) shows that the hydrocarbon generation, retention and expulsion amount is determined by TOC, vitrinite reflectance (Ro) and source rock type. Based on this recognition, Pang (1995) established the relation chart of SRI versus the above three parameters to distinguish source rocks from non-source rocks.
Method for hydrocarbon expulsion history simulation
The hydrocarbon generation potential method (Zhou and Pang, 2002; Pang et al., 2005) is used for the reconstruc-tion of hydrocarbon generation and expulsion processes. When no hydrocarbon has been expelled, the hydrocarbon potential of source rocks is known as initial hydrocarbon generation potential index (HCIo); when hydrocarbon expul-sion begin, the hydrocarbon potential decreases gradually and the hydrocarbon potential can be known as residual hydrocarbon generation potential index (HCIp). The dif-ferentials between the maximum hydrocarbon generation potential index and the residual hydrocarbon generation potential index is the hydrocarbon expulsion ratio qe, which is the hydrocarbon amount expelled per unit of or-ganic carbon, since source rocks crossed the hydrocarbon expulsion threshold, in mg/g. Qe represents the cumulative hydrocarbon expulsion amount of source rocks in geological history, Qr represents the residual hydrocarbon amount in source rocks (unit: g), and Qp is the hydrocarbon generation amount of source rocks (unit: g) (Pang et al., 2005, Figure 5).
The hydrocarbon generation potential index represents the hydrocarbon expulsion ratio of source rocks, and the profile area represents the cumulative hydrocarbon expul-sion amount of source rocks in geological history. Based on this principle, the equatuions for calculating the hydrocarbon
Layer S1+S2 (mg/g) TOC (%) (S1+S2)/TOC(mg/g TOC)
Number of samples
min – maxaverage
min – maxaverage
min – maxaverage
E3d2 0.51 – 46.86.48
0.50 – 4.151.74
65 – 876358
765
E3d3 0.67 – 50.37.56
0.50 – 5.512.32
87 – 913496
469
Table1. Rock-Eval pyrolysis of source rocks in the Dongying Formation, Bohai Sea area. S1+S2: hydrocarbon content; TOC: total organic carbon.
Figure 5. Operational models for the quantification of hydrocarbon ex-pulsion (Pang et al., 2005).

Hydrocarbon expulsion, Dongying Formation, Bohai Sea area, eastern China 363
1.0
0.8
0.6
0.4
0.2
0
0.330.37
0.42
Meandering river delta
Shoreshallow
lake sandy beach bars
Reticular river delta
Braided river delta
Sublacustrine fan
Shore-shallow
lake
Semi-deep lake
0.41
0.55
0.68
0.85
Shore-shallow lake sandy beach bars
Braided river delta
Sublacustrine fan
Shore-shallow
lake
Semi-deep lake
Rat
io o
f dar
k m
udst
one
thic
knes
s to
form
atio
n th
ickn
ess
1.0
0.8
0.6
0.4
0.2
0
0.18
0.26
0.57
0.72
0.91a)E d3 2 b)E d3 3
Figure 6. Relationship between the ratio of dark mudstone thickness to formation thickness and sedimentary facies in E3d2 and E3d3 in the Bohai sea area.
expulsion intensity and hydrocarbon expulsion amount are as follows:
(2)
(3)
Where Ehc represents the hydrocarbon expulsion intensity in t/km2; qe(z) represents the hydrocarbon expul-sion ratio per unit of organic carbon in mg/g; Qe represents the hydrocarbon expulsion amount in t; Z represents the burial depth in m; Z0 represents the hydrocarbon expulsion threshold; ρ(z) represents the density of source rocks in g/cm3; TOC represents the organic carbon mass fraction in wt%; H represents the thickness of source rocks in m; S(n) represents the area of source rocks in m2.
The hydrocarbon potential evolution of source rocks in each geological epoch can be simulated by combining the hydrocarbon generation potential index of source rocks with the burial history results. Combined with organic mat-ter abundance, organic matter type, as well as evolution degree, the hydrocarbon expulsion process of source rocks in each geological epoch can be simulated.
RESULTS
Distribution of ESR in the E3d in the Bohai Sea area
Distribution of dark mudstone and source rocks in E3d So far, 165 wells have been drilled in the E3d2 and 36
wells have been drilled in the E3d3 of the Bohai Sea area. The results show that the dark mudstone thickness of E3d2 ranges from 2 to 814 m, averaging 180 m, and that the thickness
of E3d3 ranges from 3.5 to 496 m with a mean thickness of 143 m. Considering that these unevenly drilled wells are mainly located on uplifts, the relationship between the dark mudstone thickness and sedimentary facies is obtained by evaluating the ratio of the dark mudstone thickness to the formation thickness in wells and sedimentary facies (Figure 6). For the area of the dark mudstone with less wells, thick-ness can be predicted from sedimentary facies and strata thickness. Finally, the map view distribution of the dark mudstone of E3d can be derived (Figure 7).
The results suggest that the dark mudstone in E3d2
is widely distributed throughout the area. The maximum thickness is 700 m in Bozhong sag, much thicker than that of 500 m in Liaozhong sag, 400 m in Qikou sag and about 400 m in Huanghekou sag (Figure 7a). Compared with that in E3d2, the distribution of dark mudstone in E3d3 is rela-tively limited in some regions. It is distributed mainly in Bozhong and Liaozhong sags, with maximum thicknesses of 700 m and 600 m respectively. The thickness of E3d3 dark mudstone is relatively small or only appears in deep depressions of other sags (Figure 7b). As a whole, although the dark mudstone thickness in E3d is large, the percentage of ESR, which is of great importance for the further explo-ration, remains unclear.
Determination whether the dark mudstone has crossed the hydrocarbon expulsion threshold. According to the hydrocarbon expulsion threshold depth (Figure 4), the dark mudstone that has not crossed the hydrocarbon expulsion threshold can be directly eliminated, thus the dark mudstone thickness which has crossed the hydrocarbon expulsion threshold can be determined.
Determination of the dark mudstone that cannot expel hydrocarbon using the hydrocarbon expulsion threshold chart. Typical wells with sufficient geochemical data and

Jiang et al.364
N
0 25 50km
Thickness contour of dark mudstones, m
Survey area boundary
Coastline
Basin boundary
200
0
00
0
0
0
0
0
300
300
400 200
500 300
200
300
100200
100
300200
100
200
100
200
300
400
400
500
200
300
300
400500
400
500
300
0
400600
600
500
200100
100
100
N
0 25 50km
Thickness contour of dark mudstones, m
Survey area boundary
Coastline
Basin boundary
200
0
0
0
0
0
0
400
200200300
100 200
100
100200
300
400
200
300
300
0
300
600200100
200 200
100
0
100
100
200
100200
100
100200
200
200
1000
100
200
400
100
200
200
0
030
0
0
100
00
200
100
a)E3d2 a)E3d3
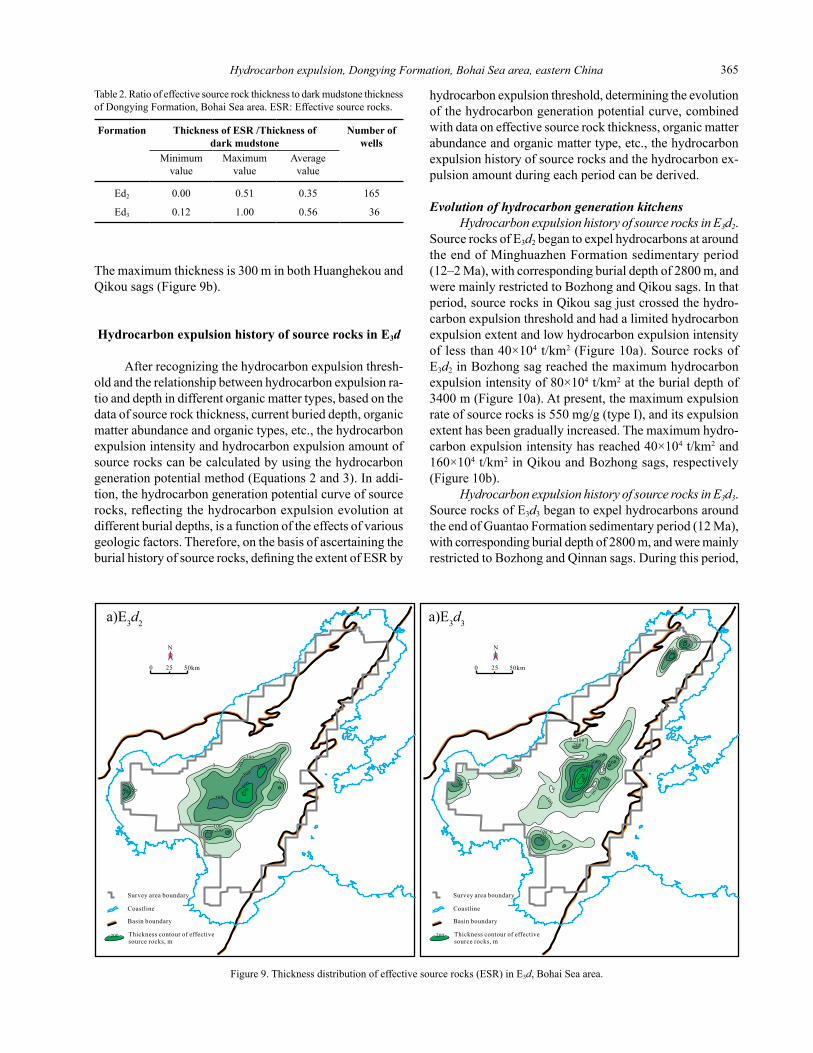
lithologic profiles were selected for statistical analysis, and actual hydrocarbon expulsion determination charts of typical wells in different strata were established (Figure 8) to discriminate whether dark mudstones have crossed the hydrocarbon expulsion threshold. In addition, combining the results of the dark mudstone that have not crossed the hydrocarbon expulsion threshold as described above, a comprehensive data table (Table 2) of the percentage of ESR in the bulk dark mudstones in each stratum can be obtained. Based on the distribution of dark mudstone, the distribution characteristics of the ESR in E3d can be determined in map view (Figure 9).
The ESR in E3d2 is distributed in Bozhong, Huanghekou
and Qikou sags (Figure 9a). In other sags, there is no ESR in E3d2 due to the relatively shallow burial depth in most cases. In addition, although have crossed the hydrocarbon expulsion threshold, a part of source rocks still cannot expel hydrocarbon due to the relatively low organic matter abundance and low evolution degree, which limits the dis-tribution of ESR. The ESR thickness in E3d2 has a maximum of 500 m in Bozhong sag and 300 m in Huanghekou sag. Although the maximum ESR thickness in Qikou sag is 400 m, it has a relatively limited distribution. The distribution of the ESR in E3d3 is relatively wider in Bozhong, Huanghekou, Liaozhong and Qikou sags. The maximum thickness is 600 m in Bozhong sag and 400 m in the north of Liaozhong sag.
Figure 7. Thickness distribution of dark mudstone of E3d in the Bohai Sea area.
0.5
1.0
1.5
2.0
2.5
3.0
Ro(%)0.5 1.0 1.5 2.0
Ro(%)0.5 1.0 1.5 2.0
00 0
0.5
1.0
1.5
2.0
2.5
3.0
0
E d3 2 E d3 3
TOC
(%)
SRI<0, Non-hydrocarbon source rocks; Poor source rocks; 25~50, Medium source rocks;50~75, Good source rocks; >75, The best source rocks
0~25,
QK17-1-1JZ16-2-1BZ31-1-1LD5-2-1
QK17-1-1BZ25-1-5QK18-1-1JZ16-2-1
SRI=25
SRI=0
SRI=50SRI=50
SRI=25SRI=0
Figure 8. Hydrocarbon expulsion discrimination chart of typical single wells in E3d in the Bohai sea area.
Hydrocarbon expulsion, Dongying Formation, Bohai Sea area, eastern China 365
N
0 25 50km
Thickness contour of effective source rocks, m
Survey area boundary
Coastline
Basin boundary
200
0
400
500
200
300
300200
100
300
400
200
400
300
200
0
100
N
0 25 50km
Survey area boundary
Coastline
Basin boundary
Thickness contour of effective source rocks, m
200
0
300
100
400
200
300
0
100
200
100
200
0
500600
0
0100
200300
0
200
0
200
0
100300
100300
a)E3d2 a)E3d3
Figure 9. Thickness distribution of effective source rocks (ESR) in E3d, Bohai Sea area.
The maximum thickness is 300 m in both Huanghekou and Qikou sags (Figure 9b).
Hydrocarbon expulsion history of source rocks in E3d
After recognizing the hydrocarbon expulsion thresh-old and the relationship between hydrocarbon expulsion ra-tio and depth in different organic matter types, based on the data of source rock thickness, current buried depth, organic matter abundance and organic types, etc., the hydrocarbon expulsion intensity and hydrocarbon expulsion amount of source rocks can be calculated by using the hydrocarbon generation potential method (Equations 2 and 3). In addi-tion, the hydrocarbon generation potential curve of source rocks, reflecting the hydrocarbon expulsion evolution at different burial depths, is a function of the effects of various geologic factors. Therefore, on the basis of ascertaining the burial history of source rocks, defining the extent of ESR by
hydrocarbon expulsion threshold, determining the evolution of the hydrocarbon generation potential curve, combined with data on effective source rock thickness, organic matter abundance and organic matter type, etc., the hydrocarbon expulsion history of source rocks and the hydrocarbon ex-pulsion amount during each period can be derived.
Evolution of hydrocarbon generation kitchens Hydrocarbon expulsion history of source rocks in E3d2.
Source rocks of E3d2 began to expel hydrocarbons at around the end of Minghuazhen Formation sedimentary period (12–2 Ma), with corresponding burial depth of 2800 m, and were mainly restricted to Bozhong and Qikou sags. In that period, source rocks in Qikou sag just crossed the hydro-carbon expulsion threshold and had a limited hydrocarbon expulsion extent and low hydrocarbon expulsion intensity of less than 40×104 t/km2 (Figure 10a). Source rocks of E3d2 in Bozhong sag reached the maximum hydrocarbon expulsion intensity of 80×104 t/km2 at the burial depth of 3400 m (Figure 10a). At present, the maximum expulsion rate of source rocks is 550 mg/g (type I), and its expulsion extent has been gradually increased. The maximum hydro-carbon expulsion intensity has reached 40×104 t/km2 and 160×104 t/km2 in Qikou and Bozhong sags, respectively (Figure 10b).
Hydrocarbon expulsion history of source rocks in E3d3. Source rocks of E3d3 began to expel hydrocarbons around the end of Guantao Formation sedimentary period (12 Ma), with corresponding burial depth of 2800 m, and were mainly restricted to Bozhong and Qinnan sags. During this period,
Formation Thickness of ESR /Thickness of dark mudstone
Number of wells
Minimum value
Maximum value
Average value
Ed2 0.00 0.51 0.35 165
Ed3 0.12 1.00 0.56 36
Table 2. Ratio of effective source rock thickness to dark mudstone thickness of Dongying Formation, Bohai Sea area. ESR: Effective source rocks.

Jiang et al.366
N
0 25 50km
Hydrocarbon expulsion4 2 intensity isoline, 10 t/km
Survey area boundary
Coastline
Basin boundary
40
800
40
0
N
0 25 50km
Hydrocarbon expulsion4 2 intensity isoline, 10 t/km
Survey area boundary
Coastline
Basin boundary
40
8040
40
120
160
0
0
a) 2.0 Ma b) 0 Ma
Figure 10. Evolution of hydrocarbon expulsion intensities of source rocks of E3d2, Bohai Sea area.
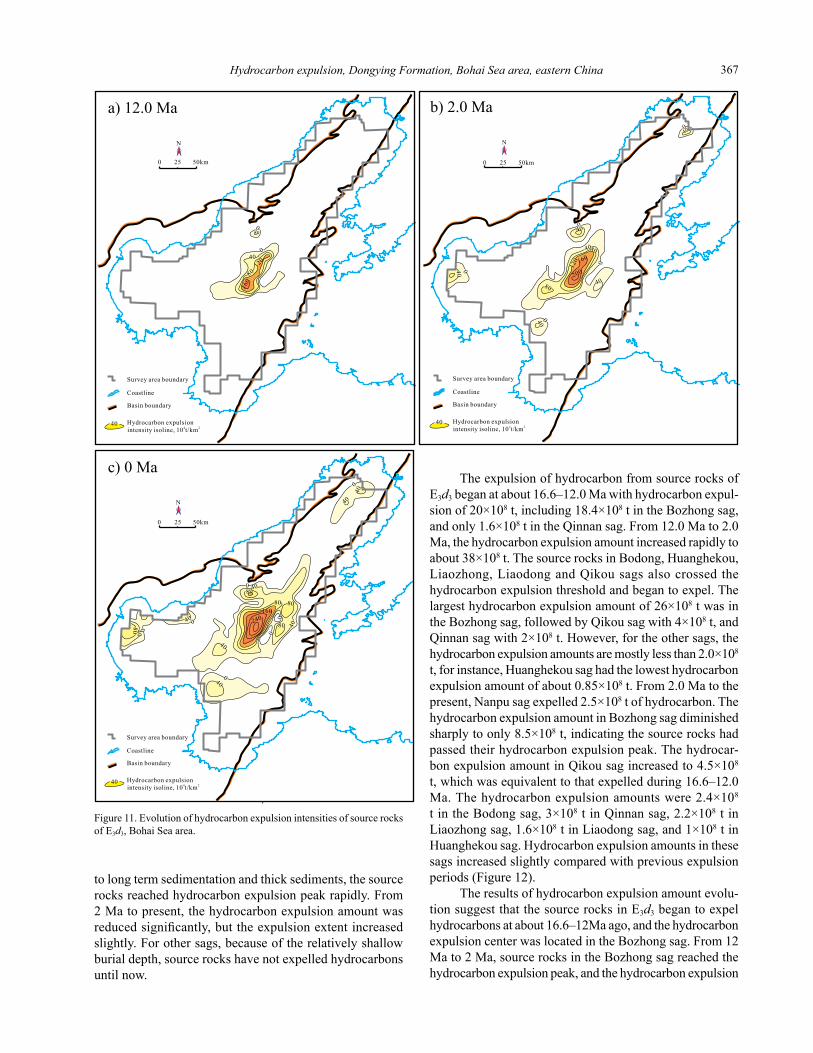
the maximum hydrocarbon expulsion intensity was 160×104 t/km2 in the Bozhong sag and 40×104 t/km2 in the Qinnan sag (Figure 11a). By the end of Minghuazhen Formation sedi-mentary period, when the average burial depth was around 3400 m, source rocks reached their maximum hydrocarbon expulsion rate and their extent was increasing. There was hydrocarbon expulsion in the Bozhong, Qinnan, Qikou, and Huanghekou sags and in the northern part of the Liaozhong sag, and the maximum hydrocarbon expulsion intensity in Bozhong sag was 200×104 t/km2. A small difference of the maximum hydrocarbon expulsion intensity existed in other sags with a maximum hydrocarbon expulsion intensity range of 40×104 – 80×104 t/km2, whereas their hydrocarbon expul-sion extents were slightly different (Figure 11b). The source rocks of E3d3 have expelled hydrocarbons in large areas, and Bozhong, Bodong and Qinnan sags are characterized by continuous hydrocarbon expulsion, with a hydrocarbon expulsion rate of 550 mg/g (type I). The accumulative maximum hydrocarbon expulsion intensity was 280×104 t/km2 in Bozhong sag and 80×104 t/km2 in Bodong and Qinnan sags. Hydrocarbon expulsion in Qikou, Liaozhong and Huanghekou sags also occurs over wide areas, but their maximum hydrocarbon expulsion intensity varies little and mainly ranges from 40×104 to 80×104 t/km2 (Figure 11c).
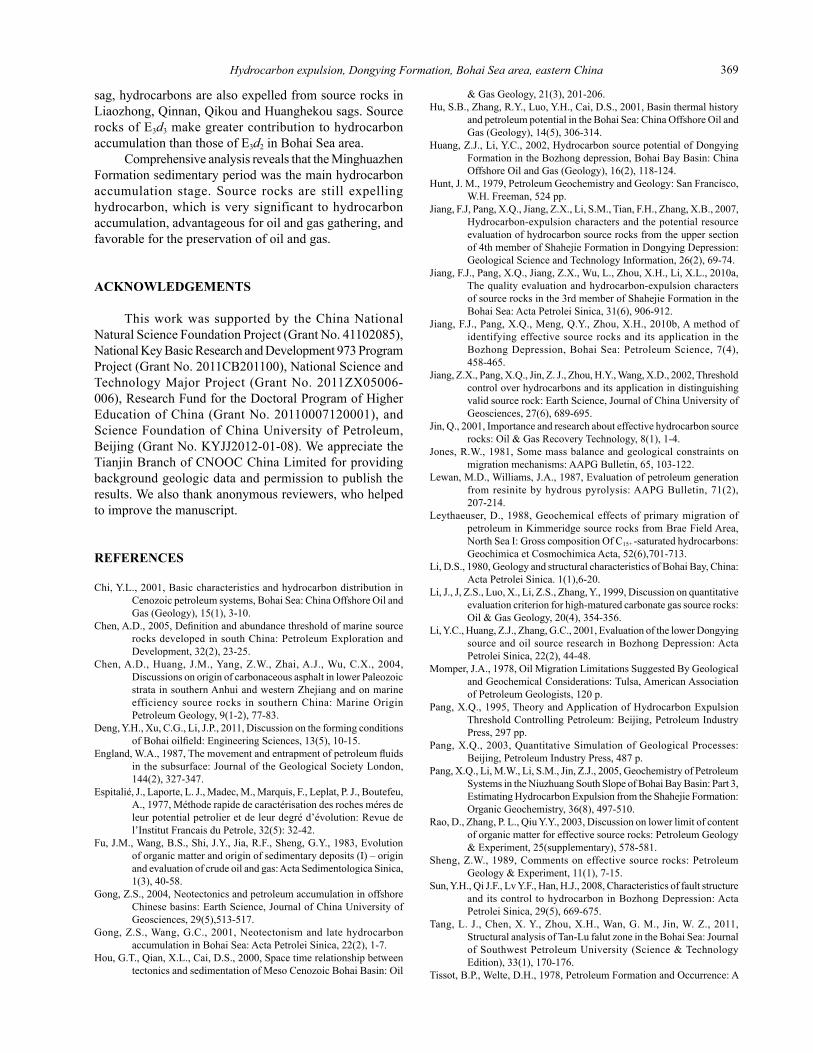
Evolution of hydrocarbon expulsion amount variationHydrocarbon expulsion intensity reflects the migra-
tion evolution of hydrocarbon expulsion centers of source rocks in each period, and the expelled amount is the best indicator of the amount of hydrocarbons supplied from
source rocks. Through volume integration of hydrocarbon expulsion intensity of source rocks in each period, total amount of hydrocarbons expelled from these two sets of source rocks in E3d was obtained. Accumulative average thickness, accumulative areas of hydrocarbon expulsion, and expelled volume of hydrocarbons for source rocks of E3d in different geological times are reported in Table 3.
Evolution of hydrocarbon expulsion amount of source rocks in E3d. The hydrocarbon expulsion amount of source rocks of E3d2 was 27×108 t during about 12–2 Ma, with 25×108 t hydrocarbon derived from the Bozhong sag, mak-ing up 90% of the total expulsion amount. The amounts of hydrocarbon expulsion in Bodong and Qikou sags were only 0.65×10⁸ t and 1.0×10⁸ t, respectively, indicating that the expulsion center of the source rocks in E3d2 was Bozhong sag during this period. Influenced by sedimentary environment and burial conditions, the source rocks of E3d2 in Bozhong sag had a relatively high evolution degree and a large expulsion extent. During the sedimentation period of 2.0–0 Ma, the total hydrocarbon expulsion amount was 15×108 t, including 8×10⁸ t in Bozhong sag, 2.5×10⁸ t in Huanghekou sag, 4×10⁸ t in Qikou sag, and 0.6×10⁸ t in Bodong sag. These results suggest that the hydrocarbon ex-pulsion of the source rocks in E3d2 was relatively scattered in this period, and the expulsion amount remarkably increased in Qikou and Huanghekou sags (Figure 12). The evolution of the expulsion amount indicate that the source rocks of E3d2 began to expel hydrocarbons in the Minghuazhen Formation sedimentary period, and that the hydrocarbon expulsion center was mainly located in Bozhong sag. Due
Hydrocarbon expulsion, Dongying Formation, Bohai Sea area, eastern China 367
N
0 25 50km
Hydrocarbon expulsion4 2 intensity isoline, 10 t/km
Survey area boundary
Coastline
Basin boundary
40
160
120
0
40
80
0
40
a) 12.0 Ma
N
0 25 50km
Hydrocarbon expulsion4 2 intensity isoline, 10 t/km
Survey area boundary
Coastline
Basin boundary
40
4080
200
160
040
0404080
0
040
120
040
b) 2.0 Ma
12000
N
0 25 50km
Hydrocarbon expulsion4 2 intensity isoline, 10 t/km
Survey area boundary
Coastline
Basin boundary
40
80
80 4004080
040
0
40
040
00
4080
80160
240
40
40
0
c) 0 Ma
to long term sedimentation and thick sediments, the source rocks reached hydrocarbon expulsion peak rapidly. From 2 Ma to present, the hydrocarbon expulsion amount was reduced significantly, but the expulsion extent increased slightly. For other sags, because of the relatively shallow burial depth, source rocks have not expelled hydrocarbons until now.
The expulsion of hydrocarbon from source rocks of E3d3 began at about 16.6–12.0 Ma with hydrocarbon expul-sion of 20×108 t, including 18.4×10⁸ t in the Bozhong sag, and only 1.6×10⁸ t in the Qinnan sag. From 12.0 Ma to 2.0 Ma, the hydrocarbon expulsion amount increased rapidly to about 38×108 t. The source rocks in Bodong, Huanghekou, Liaozhong, Liaodong and Qikou sags also crossed the hydrocarbon expulsion threshold and began to expel. The largest hydrocarbon expulsion amount of 26×108 t was in the Bozhong sag, followed by Qikou sag with 4×10⁸ t, and Qinnan sag with 2×10⁸ t. However, for the other sags, the hydrocarbon expulsion amounts are mostly less than 2.0×10⁸ t, for instance, Huanghekou sag had the lowest hydrocarbon expulsion amount of about 0.85×10⁸ t. From 2.0 Ma to the present, Nanpu sag expelled 2.5×10⁸ t of hydrocarbon. The hydrocarbon expulsion amount in Bozhong sag diminished sharply to only 8.5×10⁸ t, indicating the source rocks had passed their hydrocarbon expulsion peak. The hydrocar-bon expulsion amount in Qikou sag increased to 4.5×10⁸ t, which was equivalent to that expelled during 16.6–12.0 Ma. The hydrocarbon expulsion amounts were 2.4×10⁸ t in the Bodong sag, 3×10⁸ t in Qinnan sag, 2.2×10⁸ t in Liaozhong sag, 1.6×10⁸ t in Liaodong sag, and 1×10⁸ t in Huanghekou sag. Hydrocarbon expulsion amounts in these sags increased slightly compared with previous expulsion periods (Figure 12).
The results of hydrocarbon expulsion amount evolu-tion suggest that the source rocks in E3d3 began to expel hydrocarbons at about 16.6–12Ma ago, and the hydrocarbon expulsion center was located in the Bozhong sag. From 12 Ma to 2 Ma, source rocks in the Bozhong sag reached the hydrocarbon expulsion peak, and the hydrocarbon expulsion
Figure 11. Evolution of hydrocarbon expulsion intensities of source rocks of E3d3, Bohai Sea area.

Jiang et al.368
30
25
15
10
20
(16.6~12.0) Ma
(12.0~2.0) Ma
(2.0~0) Ma
5
0
30
25
15
10
20
5
0
30
25
15
10
20
5
0
Bodong
Bozhong
8H
ydro
carb
on e
xpul
sion
qua
ntity
/10
t
Chengbei
Huanghek
ou
Laizhouwan
Liaoxi
Liaozh
ong
Liaodong
Miaoxi
Qikou
Qinnan
Qingdong
Shanan
Nanpu
E d3 3
E d3 2
extent increased to seven hydrocarbon expulsion sags. From 2 Ma to present, although the amount of hydrocarbon expul-sion diminished sharply in the Bozhong sag, it increased slightly in other sags, indicating that the source rocks in medium to small sags just entered their hydrocarbon expul-sion peak during this period.
CONCLUSIONS
Dark mudstones of E3d in Bohai Sea area are widely distributed with large thickness, being the thickness of E3d2 dark mudstone larger than that of E3d3. However, the effective source rocks of E3d have a limited distribution. ESR of E3d2 are mainly located in Bozhong, Huanghekou, Qikou and Bodong sags, with an average thickness of 200 m; while ESR distribution of E3d2 is relatively broad, mainly in Bozhong, Bodong, Huanghekou, Liaozhong, Qinnan, Qikou and Nanpu sags, with an average thickness of 230 m.
The hydrocarbon expulsion history simulation results indicate that the source rocks of E3d2 began to expel hydrocarbons at around 12–2 Ma (Minghuazheng Formation sedimentary period). So far, the cumulative hydrocarbon expulsion amount is 41.95×10⁸ t, with the hydrocarbon expulsion center mainly located in the Bozhong sag, from where the hydrocarbon expulsion accounts for over 90%,
whereas the hydrocarbon expulsion amount is very small in Bodong, Huanghekou and Qikou sags. Source rocks of E3d3 began to expel hydrocarbons at about 16.6–12 Ma (Guantao Formation sedimentary period). So far, the cumulative hydrocarbon expulsion amount has been 83.75×10⁸ t. In addition to the hydrocarbon expulsion center of Bozhong
Category E3d2 E3d3
23 – 12 MaCumulative average expulsion thickness (m) 0 51 Cumulative expulsion area (km2) 0 3879 Expelled volume of hydrocarbons (108 t) 0 20.03
12 – 2 MaCumulative average expulsion thickness (m) 120 105 Cumulative expulsion area (km2) 7914 8190 Expelled volume of hydrocarbons (108 t) 26.68 38.03
2 – 0 MaCumulative average expulsion thickness (m) 211 146 Cumulative expulsion area (km2) 14167 16282 Expelled volume of hydrocarbons (108 t) 15.27 25.69
Total expelled volume of hydrocarbons (108 t) 41.95 83.75
Table 3 Characteristics of hydrocarbon expulsion for source rocks of the Dongying Formation in the Bohai Sea area in different geological times.
Figure 12. Evolution of hydrocarbon expulsion amount from the effective source rocks (ESR) of Dongying Formation in different sags.
Hydrocarbon expulsion, Dongying Formation, Bohai Sea area, eastern China 369
sag, hydrocarbons are also expelled from source rocks in Liaozhong, Qinnan, Qikou and Huanghekou sags. Source rocks of E3d3 make greater contribution to hydrocarbon accumulation than those of E3d2 in Bohai Sea area.
Comprehensive analysis reveals that the Minghuazhen Formation sedimentary period was the main hydrocarbon accumulation stage. Source rocks are still expelling hydrocarbon, which is very significant to hydrocarbon accumulation, advantageous for oil and gas gathering, and favorable for the preservation of oil and gas.
ACKNOWLEDGEMENTS
This work was supported by the China National Natural Science Foundation Project (Grant No. 41102085), National Key Basic Research and Development 973 Program Project (Grant No. 2011CB201100), National Science and Technology Major Project (Grant No. 2011ZX05006-006), Research Fund for the Doctoral Program of Higher Education of China (Grant No. 20110007120001), and Science Foundation of China University of Petroleum, Beijing (Grant No. KYJJ2012-01-08). We appreciate the Tianjin Branch of CNOOC China Limited for providing background geologic data and permission to publish the results. We also thank anonymous reviewers, who helped to improve the manuscript.
REFERENCES
Chi, Y.L., 2001, Basic characteristics and hydrocarbon distribution in Cenozoic petroleum systems, Bohai Sea: China Offshore Oil and Gas (Geology), 15(1), 3-10.
Chen, A.D., 2005, Definition and abundance threshold of marine source rocks developed in south China: Petroleum Exploration and Development, 32(2), 23-25.
Chen, A.D., Huang, J.M., Yang, Z.W., Zhai, A.J., Wu, C.X., 2004, Discussions on origin of carbonaceous asphalt in lower Paleozoic strata in southern Anhui and western Zhejiang and on marine efficiency source rocks in southern China: Marine Origin Petroleum Geology, 9(1-2), 77-83.
Deng, Y.H., Xu, C.G., Li, J.P., 2011, Discussion on the forming conditions of Bohai oilfield: Engineering Sciences, 13(5), 10-15.
England, W.A., 1987, The movement and entrapment of petroleum fluids in the subsurface: Journal of the Geological Society London, 144(2), 327-347.
Espitalié, J., Laporte, L. J., Madec, M., Marquis, F., Leplat, P. J., Boutefeu, A., 1977, Méthode rapide de caractérisation des roches méres de leur potential petrolier et de leur degré d’évolution: Revue de l’Institut Francais du Petrole, 32(5): 32-42.
Fu, J.M., Wang, B.S., Shi, J.Y., Jia, R.F., Sheng, G.Y., 1983, Evolution of organic matter and origin of sedimentary deposits (I) – origin and evaluation of crude oil and gas: Acta Sedimentologica Sinica, 1(3), 40-58.
Gong, Z.S., 2004, Neotectonics and petroleum accumulation in offshore Chinese basins: Earth Science, Journal of China University of Geosciences, 29(5),513-517.
Gong, Z.S., Wang, G.C., 2001, Neotectonism and late hydrocarbon accumulation in Bohai Sea: Acta Petrolei Sinica, 22(2), 1-7.
Hou, G.T., Qian, X.L., Cai, D.S., 2000, Space time relationship between tectonics and sedimentation of Meso Cenozoic Bohai Basin: Oil
& Gas Geology, 21(3), 201-206.Hu, S.B., Zhang, R.Y., Luo, Y.H., Cai, D.S., 2001, Basin thermal history
and petroleum potential in the Bohai Sea: China Offshore Oil and Gas (Geology), 14(5), 306-314.
Huang, Z.J., Li, Y.C., 2002, Hydrocarbon source potential of Dongying Formation in the Bozhong depression, Bohai Bay Basin: China Offshore Oil and Gas (Geology), 16(2), 118-124.
Hunt, J. M., 1979, Petroleum Geochemistry and Geology: San Francisco, W.H. Freeman, 524 pp.
Jiang, F.J, Pang, X.Q., Jiang, Z.X., Li, S.M., Tian, F.H., Zhang, X.B., 2007, Hydrocarbon-expulsion characters and the potential resource evaluation of hydrocarbon source rocks from the upper section of 4th member of Shahejie Formation in Dongying Depression: Geological Science and Technology Information, 26(2), 69-74.
Jiang, F.J., Pang, X.Q., Jiang, Z.X., Wu, L., Zhou, X.H., Li, X.L., 2010a, The quality evaluation and hydrocarbon-expulsion characters of source rocks in the 3rd member of Shahejie Formation in the Bohai Sea: Acta Petrolei Sinica, 31(6), 906-912.
Jiang, F.J., Pang, X.Q., Meng, Q.Y., Zhou, X.H., 2010b, A method of identifying effective source rocks and its application in the Bozhong Depression, Bohai Sea: Petroleum Science, 7(4), 458-465.
Jiang, Z.X., Pang, X.Q., Jin, Z. J., Zhou, H.Y., Wang, X.D., 2002, Threshold control over hydrocarbons and its application in distinguishing valid source rock: Earth Science, Journal of China University of Geosciences, 27(6), 689-695.
Jin, Q., 2001, Importance and research about effective hydrocarbon source rocks: Oil & Gas Recovery Technology, 8(1), 1-4.
Jones, R.W., 1981, Some mass balance and geological constraints on migration mechanisms: AAPG Bulletin, 65, 103-122.
Lewan, M.D., Williams, J.A., 1987, Evaluation of petroleum generation from resinite by hydrous pyrolysis: AAPG Bulletin, 71(2), 207-214.
Leythaeuser, D., 1988, Geochemical effects of primary migration of petroleum in Kimmeridge source rocks from Brae Field Area, North Sea I: Gross composition Of C15+ -saturated hydrocarbons: Geochimica et Cosmochimica Acta, 52(6),701-713.
Li, D.S., 1980, Geology and structural characteristics of Bohai Bay, China: Acta Petrolei Sinica. 1(1),6-20.
Li, J., J, Z.S., Luo, X., Li, Z.S., Zhang, Y., 1999, Discussion on quantitative evaluation criterion for high-matured carbonate gas source rocks: Oil & Gas Geology, 20(4), 354-356.
Li, Y.C., Huang, Z.J., Zhang, G.C., 2001, Evaluation of the lower Dongying source and oil source research in Bozhong Depression: Acta Petrolei Sinica, 22(2), 44-48.
Momper, J.A., 1978, Oil Migration Limitations Suggested By Geological and Geochemical Considerations: Tulsa, American Association of Petroleum Geologists, 120 p.
Pang, X.Q., 1995, Theory and Application of Hydrocarbon Expulsion Threshold Controlling Petroleum: Beijing, Petroleum Industry Press, 297 pp.
Pang, X.Q., 2003, Quantitative Simulation of Geological Processes: Beijing, Petroleum Industry Press, 487 p.
Pang, X.Q., Li, M.W., Li, S.M., Jin, Z.J., 2005, Geochemistry of Petroleum Systems in the Niuzhuang South Slope of Bohai Bay Basin: Part 3, Estimating Hydrocarbon Expulsion from the Shahejie Formation: Organic Geochemistry, 36(8), 497-510.
Rao, D., Zhang, P. L., Qiu Y.Y., 2003, Discussion on lower limit of content of organic matter for effective source rocks: Petroleum Geology & Experiment, 25(supplementary), 578-581.
Sheng, Z.W., 1989, Comments on effective source rocks: Petroleum Geology & Experiment, 11(1), 7-15.
Sun, Y.H., Qi J.F., Lv Y.F., Han, H.J., 2008, Characteristics of fault structure and its control to hydrocarbon in Bozhong Depression: Acta Petrolei Sinica, 29(5), 669-675.
Tang, L. J., Chen, X. Y., Zhou, X.H., Wan, G. M., Jin, W. Z., 2011, Structural analysis of Tan-Lu falut zone in the Bohai Sea: Journal of Southwest Petroleum University (Science & Technology Edition), 33(1), 170-176.
Tissot, B.P., Welte, D.H., 1978, Petroleum Formation and Occurrence: A

Jiang et al.370
Zhang, G.C., 2000, Tectonic framework and prolific hydrocarbon depressions in Bohai Bay: China Offshore Oil and Gas (Geology), 14(2), 93-99.
Zhang,Y., Wang, P.J., Chen, W.L., Liu, W.Z., Tang, H.F., 2007, Identification and mapping of the effective source rocks –take the Kongquehe Area of the Tarim Basin as an example: Journal of Jilin University (Earth Science Edition), 37(3), 463-468.
Zhou, J., Pang, X.Q., 2002, A method for calculating the quantity of hydrocarbon generation and expulsion: Petroleum Exploration and Development, 29(1), 24-27.
Zuo, Y.H., Qiu, N.S., Pang, X.Q., Li, J.P., Guo, Y.H., Jiang, F.J., 2010, Hydrocarbon kitchen evolution of Es3 source rock of the Bohai offshore area, North China: Chinese Journal of Geophysics, 53(10), 2415-2426.
Manuscript received: November 27, 2012Corrected manuscript received: March, 7, 2013Manuscript accepted: March 13, 2013
New Approach to Oil and Gas Exploration : New York, Springer-Verlag, 486 p.
Tissot,B.P., Welte, D.H.,1984,Petroleum Formation and Occurrence: New York, Springer-Verlag, 699 p.
Wang, F.Y., Li, Y.B., Zeng, H.S., Shi, Y.L., 2006, Factors to control GOR and its exploration implications in Bozhong Depression, Bohai Bay Basin: China Offshore Oil And Gas,18(5), 289-296.
Wang, G.C., Zhang, H.H., 2003, Gas resource of Bohai Bay and its surrounding areas: Petroleum Geology & Experiment, 25(5), 439-444.
Wang, P.R., Zhang, D.J., Song, F.Q., Xu, G.J., Li, Y.C., Fu, N., Guo, Y.H., 2004, The comprehensive geochemical parameters for distinguishing three sets of source rock in Bozhong depression: China offshore Oil and Gas, 2004, 16(3), 157-160.
Wang, Y.S., Jin, Q., Zhu, G.Y., Guo, C.C., 2003, Characterization of the effective source rocks in the Shahejie Formation of the Jiyang Depression: Petroleum Exploration and Development, 30(3), 53-55.
Xu, C.G., Yu, S., Lin, C.S., Wang, X., Wang, Y.C., Li, H.Y., 2008, Structural styles of the Paleogene lacustrine basin margin and their control on sedimentary sequences in Bohai Sea Area: Journal of Palaeogeography, 10(6), 627-635.
Xu, H.D.,1981, Stratigraphy and sedimentary features of Paleogene sediment of Bohai Bay basin: Marine Geological Research, 1(2), 10-27.