redacted page 1 solar 4 all monthly activity report
TRANSCRIPT

REDACTEDSolar 4 All Monthly Activity Report - December 2020
Page 1
Site Property OwnerCost per Project
($k)
NPV of 20 Year
Lease Cost ($k)EPC Contractor Site Location Address
Segment 1a
Linden PSE&G N/A ASP South Wood Avenue, Linden, NJ 07036
Yardville PSE&G N/A ACE Broad Street, Hamilton, NJ 08611
Silver Lake PSE&G N/A JFC 410 Silver Lake Avenue, Edison, NJ 08817
Trenton PSE&G N/A SunEdison 500-520 Brunswick Avenue, Trenton, NJ 08638
Central HQ PSE&G N/A Solis (Solyndra) 472 Weston Canal Road, Franklin, NJ 08873
Edison Training PSE&G N/A Henkle & McCoy 234 Pierson Avenue, Edison, NJ 08837
Thorofare PSE&G N/A SunEdison Jessup Road, Thorofare, NJ 08086
Hackensack PSE&G N/A JFC 194-210 South River Street, Hackensack NJ 07601
Metro/Clifton PSE&G N/A Gloria Solar 150 Circle Ave, Clifton, NJ 07011
S. DivHQ Moorestown PSE&G N/A Vanguard 360 New Albany Road, Moorestown, NJ
Segment 1b
CPP Bayonne CenterPoint Properties $1,402 ASP 30-100 Pulaski Street, Bayonne, NJ 07002
Matrix - Stults Rd Matrix Development Group $2,228 Pro-Tech 45 Stults Rd, 'South Brunswick, NJ 08810
Rider Rider University $642 Alteris 2083 Lawrenceville Road, Lawrenceville, NJ 08648
NJMC / Kearny Landfill NJ Meadowland Commission $2,561 Sundurance 932 Bellville Turnpike, Kearny, Hudson County NJ 07032
Mill Creek Judith Tucci $3,189 Juwi 600 Irick Road, Westampton, NJ 08060
Food Bank Community Food Bank of NJ $772 Mercury 31 Evans Terminal, Hillside, NJ 07250
Raritan Center Summit Associates Inc. $1,729 ASP 45 Fernwood Avenue and 110 Fieldcrest Avenue, Edison, NJ 08818
BlackRock-Matrix Granite South Brunswick, LLC $1,800 Pro-Tech 140 Docks Corner Road, South Brunswick, NJ 08810
Segment 1c
Matrix Bldg A & B Matrix Development $15,444 $2,191 enXco 1000 & 1050 Amboy Ave, Perth Amboy, NJ 08861
Barringer Newark Public Schools $3,257 $635 Mercury 90 Parker St, Newark, NJ 07104
Park Newark Public Schools $3,341 $482 Mercury 120 Manchester Place, Newark, NJ 07104-1704
Camden (NWK) Newark Public Schools $5,728 $971 ALM 281 & 321 Camden Street Newark, New Jersey 07103
New Central HS Newark Public Schools $2,843 $495 LB Electric 246 18th Ave, Newark, NJ 07108
Segment 2
Pole-Attached PSE&G N/A Riggs-Distler Various
Notes:
"Cost per Project" corresponds to projects that have been placed in service.
"NPV of 20 Year Lease Cost" is derived using an annual discount rate of 5.07%
Regarding Segment 2 (Pole-attached): Riggs Distler is the installation contractor, not an EPC contractor
"Cost per Projec"t includes AFUDC

REDACTEDSolar 4 All Monthly Activity Report - December 2020
Page 2
Site
Segment 1a
Linden
Yardville
Silver Lake
Trenton
Central HQ
Edison Training
Thorofare
Hackensack
Metro/Clifton
S. DivHQ Moorestown
Segment 1b
CPP Bayonne
Matrix - Stults Rd
Rider
NJMC / Kearny Landfill
Mill Creek
Food Bank
Raritan Center
BlackRock-Matrix
Segment 1c
Matrix Bldg A & B
Barringer
Park
Camden (NWK)
New Central HS
Segment 2
Pole-Attached
Owner location Type of customer Status of the installationCapacity of Project
(MW-DC)
80 Park Plaza, Newark, NJ 07102 Utility Commercial Operation 3.20
80 Park Plaza, Newark, NJ 07102 Utility Commercial Operation 4.30
80 Park Plaza, Newark, NJ 07102 Utility Commercial Operation 2.02
80 Park Plaza, Newark, NJ 07102 Utility Commercial Operation 1.26
80 Park Plaza, Newark, NJ 07102 Utility Commercial Operation 0.92
80 Park Plaza, Newark, NJ 07102 Utility Commercial Operation 0.71
80 Park Plaza, Newark, NJ 07102 Utility Commercial Operation 0.72
80 Park Plaza, Newark, NJ 07102 Utility Commercial Operation 1.05
80 Park Plaza, Newark, NJ 07102 Utility Commercial Operation 0.73
80 Park Plaza, Newark, NJ 07102 Utility Commercial Operation 1.07
1808 Swift Drive, Oak Brook, IL 60523-1501 Warehouse Commercial Operation 1.70
Forsgate Drive CN 4000, Cranbury, NJ 08512 Warehouse Commercial Operation 2.98
2083 Lawrenceville Road, Lawrenceville, NJ 08548 University Commercial Operation 0.74
One DeKorte Park Plaza, Lyndhurst, NJ 07071 Landfill Commercial Operation 3.00
4 St. Albans Place, Haworth, NJ 07641 Private Landowner Commercial Operation 3.82
31 Evans Terminal Rd, Hillside, New Jersey 07250 Warehouse Commercial Operation 1.07
Raritan Plaza I, Edison, NJ 08818 Warehouse Commercial Operation 2.22
BlackRock, 40 E. 52nd Street, New York, NY 10022 Warehouse Commercial Operation 2.97
Forsgate Drive CN 4000, Cranbury, NJ 08512 Warehouse Commercial Operation 2.86
Newark Public Schools, 2 Cedar Street, Newark NJ 07102-3051 Public Schools Commercial Operation 0.65
Newark Public Schools, 2 Cedar Street, Newark NJ 07102-3051 Public Schools Commercial Operation 0.51
Newark Public Schools, 2 Cedar Street, Newark NJ 07102-3051 Public Schools Commercial Operation 0.91
Newark Public Schools, 2 Cedar Street, Newark NJ 07102-3051 Public Schools Commercial Operation 0.50
80 Park Plaza, Newark, NJ 07102 Utility Commercial Operation 37.10

REDACTEDSolar 4 All Monthly Activity Report - December 2020
Page 3
Site
Segment 1a
Linden
Yardville
Silver Lake
Trenton
Central HQ
Edison Training
Thorofare
Hackensack
Metro/Clifton
S. DivHQ Moorestown
Segment 1b
CPP Bayonne
Matrix - Stults Rd
Rider
NJMC / Kearny Landfill
Mill Creek
Food Bank
Raritan Center
BlackRock-Matrix
Segment 1c
Matrix Bldg A & B
Barringer
Park
Camden (NWK)
New Central HS
Segment 2
Pole-Attached
Equipment installed (Inverters; Panels)
Six Sunny Central SC500-HE-US inverters; 7,766 Suntech STP280-24/Vd, 3,718 STP275-24/Vd panels
Eight Advanced Energy Solaron 3159500-0001A2 inverters, one Solaron 250 inveters; 5,640 Suntech STP270-24/VD, 4,368 STP275-24/VD, 1,512 STP280-24/VD panels
Three SMA Sunny Central SC 500U, one SC 250U inverters; 3,514 Sharp ND-224UC1, 5,236 ND-U235F1
Three Satcon PowerGate Plus PVS-500 inverters; 5,496 Yingli Solar YL230b-29b panels
10 SMA Tripower 15kw inverters, 29 SMA Tripower 20kw Inverters; 4,180 Solyndra SL-001-182U, 648 Solar World SW240MONO panels
7 50kw SMA Tripower inverters, 1 30kw SMA Inverter, 4 24kw SMA Inverter, 10 15kw SMA Inverter; 3,164 Gloria Solar GSM6-225D-E1 panels
One Advanced Energy Solaron-500kW, one Solaron-250kW inverters; 2,618 SunTech STP275-24Vd panels
Two Advanced Energy Solaron-500kW, 4,472 MX Solar MX-60-235 panels
Four Satcon Powergate Plus PVS-75, two PVS-135 inverters; 3,122 Gloria Solar GSM6-235D-E1 panels
Three Advanced Energy PVP 260 Inverters; one PVP 100 and one PVP 50 Inverter. 4,563 MX60-235 panels
15 SolarEdge SE100KUS inverters and three SolarEdge SE33.3KUS inverters; 7,730 Trina Solar TSM-220PA05 panels
Five Solaron 3159500-1001AD inverters; 12,684 Kyocera K0235GX-LPB panels
Two AEI inverters; 2,640 Suntech STP-280 panels
Seven Advanced Energy Solaron inverters 2x500kW, 3x333kW, 2x250kW; 12,506 Kyocera KD240GX-LFB panels
Seven SMA America SC500U inverters; 29,400 Solar Frontier SF-130-L panels
121 ProHarvest HiQ Inverters; 4,667 Trina Solar TSM-230PA05 panels
235 ProHarvest HiQ inverters; 7,098 Hyundai HIS-M230SG, 2,604 HIS-M227SG panels
Five AE Solaron 3159000-1001AJ inverters; 12,376 Upsolar UP-M240P panels
300 ProHarvest HiQ inverters; 10,395 Suntech STP275-24VD panels
73 ProHarvest HiQ inverters; 2,310 Suntech STP280-24VB-1 panels
One Satcon PowerGate Plus PVS-375, 8 ProHarvest HiQ inverters; 1,440 Sunpower PL-SUN-SPR-305-U, 264 Suntech STP270-24/VB-1 panels
101 ProHarvest HiQ Inverters; 3,264 ET Solar ET-P672280 panels
58 ProHarvest HiQ inverters; 1,857 Suntech STP270-24/VB-1 panels
Suntech STP200-18/UB-1, STP205-18/UD, STP210-18/UB-1, STP215-20/WD, STP220-20/WD, STP225-20/WD, Trina Solar TSM-220PA05, TSM-225PA05, TSM-235PA05, TSM-240PA05

REDACTED Page 4
Solar 4 All Monthly Activity Report - December 2020
December 2020 Monthly Update
SegmentEnergy Produced
(MWh AC)Net Energy Sales ($) SREC's Sold
SREC Revenue
($)
Capacity Sold
(MW-days)
Net Capacity Sales
($)
Business Interruption
Insurance Recovery ($)
Investment
($)
Program Expenses
($)
Projects Completed / Seg 2
Panels InstalledMW Installed
Pole-attached Units
Communicating
Segment 1a 687 11,737$ 3,093 721,290$ - -$ $0 $0 $131,758 0 0.0
Segment 1b 886 15,925$ 3,565 831,360$ - -$ $0 ($197,122) $392,486 0 0.0
Segment 1c 183 3,378$ 892 208,015$ - -$ $0 $0 $91,377 0 0.0
Segment 2 1,808 33,251$ 5,573 1,299,627$ - -$ $0 $108,349 $850,865 0 0.000 158,655
Program Total 3,564 64,290$ 13,123 3,060,292$ - -$ $0 ($88,773) $1,466,486 0 0.000
Solar 4 All Year-to-Date Activity Report
Year-to-Date Update through December 2020
SegmentEnergy Produced
(MWh AC)Net Energy Sales ($) SREC's Sold
SREC Revenue
($)
Capacity Sold
(MW-days)
Net Capacity Sales
($)
Business Interruption
Insurance Recovery ($)
Investment
($)
Program Expenses
($)
Projects Completed / Seg 2
Panels InstalledMW Installed
Segment 1a 19,602 354,813$ 16,502 4,505,015$ 729.6 68,839$ $0 $1,993 $657,915 0 0.0
Segment 1b 22,148 398,257$ 22,023 5,064,061$ 866.4 82,401$ $0 $1,595,614 $1,951,981 0 0.0
Segment 1c 5,877 108,490$ 5,870 1,349,072$ 273.6 27,324$ $0 $7,253 $725,101 0 0.0
Segment 2 36,049 655,720$ 35,451 8,154,430$ 1,626.4 152,160$ $0 $370,997 $5,477,159 0 0.000
YTD Program Total 83,676 1,517,280$ 79,846 19,072,578$ 3,496.0 330,723$ $0 $1,975,857 $8,812,156 0 0
Solar 4 All Program-to-Date Activity Report
Program-to-Date through December 2020
SegmentEnergy Produced
(MWh AC)Net Energy Sales ($) SREC's Sold
SREC Revenue
($)
Capacity Sold
(MW-days)
Net Capacity Sales
($)
Business Interruption
Insurance Recovery ($)
Investment
($)
Program Expenses
($)
Projects Completed / Seg 2
Panels InstalledMW Installed
Segment 1a 181,877 $6,066,238 182,375 $39,708,566 15,316.7 $2,286,339 $320,277 $92,803,214 $7,687,103 10 16.0
Segment 1b 205,874 $7,451,568 205,833 $42,718,718 16,886.7 $2,807,758 $457,127 $81,253,395 $20,497,890 8 18.5
Segment 1c 59,133 $1,956,470 58,485 $12,655,455 5,958.6 $812,967 $0 $35,916,074 $7,613,107 6 5.4
Segment 2 341,207 $13,739,044 358,017 $78,743,621 33,520.0 $5,163,194 $0 $278,675,107 $32,781,563 167,497 37.1
Program-to-date Total 788,091 $29,213,320 804,710 $173,826,360 71,682.0 $11,070,259 $777,404 $488,647,790 $68,579,663 167,521 77.0
Notes:
1) "SREC's Sold" and "SREC Revenue" includes vintage year 2011 through 2021 SRECs
2) Monthly "Pole-attached Units Installed" & "Pole-attached MW Installed" are preliminary estimates and subject to change. Adjustments to prior months will be reflected in YTD values.
Capacity specified in certain previously filed capacity reports represented gross installed capacity. The values shown in the table above account for net installed capacity (total installs minus total removals).
3) "Pole Attached Units Communicating" represents the average, daily number of panels that communicated during the month.
4) The columns "Energy Produced" and "SRECs Sold" do not sync because of the timing of SREC auctions, through which SRECs are sold.
5) Business interruption insurance recovery received for lost energy sales and SREC sales due to Superstorm Sandy

REDACTED Page 5
0
50000
100000
150000
200000
250000
300000
350000
400000
450000
0
2000
4000
6000
8000
10000
12000
14000
16000
Sep
- D
ec '0
9
Jan
- M
ar '1
0
Ap
r -
Jun
'10
Jul -
Sep
'10
Oct
- D
ec '1
0
Jan
- M
ar '1
1
Ap
r -
Jun
'11
Jul -
Sep
'11
Oct
- D
ec '1
1
Jan
- M
ar '1
2
Ap
r -
Jun
'12
Jul -
Sep
'12
Oct
- D
ec '1
2
Jan
- M
ar '1
3
Ap
r -
Jun
'13
Jul -
Sep
'13
Oct
- D
ec '1
3
Jan
- M
ar '1
4
Ap
r -
Jun
'14
Jul -
Sep
'14
Oct
- D
ec '1
4
Jan
-Mar
'15
Ap
r-Ju
n '1
5
Jul-
Sep
'15
Oct
-De
c '1
5
Jan
-Mar
'16
Ap
r-Ju
n '1
6
Jul-
Sep
'16
Oct
-De
c '1
6
Jan
-Mar
'17
Ap
r-Ju
n '1
7
Jul-
Sep
'17
Oct
-De
c '1
7
Jan
-Mar
'18
Ap
r-Ju
n '1
8
Jul-
Sep
'18
Oct
-De
c '1
8
Jan
-Mar
'19
Ap
r-Ju
n '1
9
Jul-
Sep
'19
Oct
-De
c '1
9
Jan
-Mar
'20
Ap
r-Ju
n '2
0
Jul-
Sep
'20
Oct
-De
c '2
0
Cu
mu
lati
ve M
Wh
Qu
arte
rly
MW
h
PSE&G Pole-Attached Solar: Quarterly Performance vs. PV Watts @ 80% of 0.77
Actual Quarterly Production MWh Predicted kWh PV Watts v1 @ 80% of 0.77 derate
Cumulative Production kWh Cumulative Predicted kWh PV Watts v1 @ 80% of 0.77 derate

REDACTED Page 6
Total S4A Fleet Performance:
Seg2 (Pole Attached Solar):
Ongoing maintenance of existing installations continues.
December weather conditions were not favorable for solar production. Actual monthly production compared to plan is -14.77%.
Development of communications network continues.

REDACTED
Municipality Total Installed Total kWdc
Allentown Boro 51 10.99
Audubon Boro 477 102.03
Audubon Park Boro 41 8.54
Barrington Boro 339 73.58
Bayonne City 1,583 361
Belleville Twp 761 177.32
Bellmawr Boro 938 202.32
Bergenfield Boro 420 94.72
Berkeley Heights Twp 5 1.2
Beverly City 260 54.78
Bloomfield Twp 996 235.49
Bogota Boro 181 42.61
Bordentown City 60 12.89
Bordentown Twp 800 171.98
Bound Brook Boro 375 85.82
Branchburg Twp 22 5.28
Bridgewater Twp 1,609 361.7
Brooklawn Boro 219 46.21
Burlington City 1,198 254.39
Burlington Twp 1,179 246.93
Caldwell Boro 190 44.89
Camden City 5,178 1,130.28
Carlstadt Boro 637 148.9
Carteret Boro 1,511 325.43
Cedar Grove Twp 504 118.39
Cherry Hill Twp 2,919 625.24
Chesterfield Twp 385 83
Cinnaminson Twp 1,199 251.55
Clark Twp 622 138.93
Cliffside Park Boro 276 65.3
Clifton City 2,974 693.43
Collingswood Boro 654 140.78
Cranbury Twp 258 56.55
Cranford Twp 674 151.23
Cresskill Boro 2 0.44
Delanco Twp 291 60.4
Delran Twp 607 127.42
Deptford Twp 1,615 351
Dumont Boro 424 94.97
Dunellen Boro 278 62.62
East Amwell Twp 2 0.41
East Brunswick Twp 1,933 423.7
East Newark Boro 27 6
East Orange City 1,184 279.32
East Rutherford Boro 416 97.4
Eastampton Twp 289 60.19
Edgewater Boro 107 24.95
Edgewater Park Twp 503 103.76
Edison Twp 4,415 965.27
Elizabeth City 2,970 651.68
Elizabeth City 250 55.68
PSE&G Pole-Attached -- Summary by Municipality -- December 2020
*Latest installation date 1/4/21
*Installs pending municipal data updates
not included in total Count of Panels by Municipality*Net of removals
Panel Report
Page 7 of 16

REDACTED
Municipality Total Installed Total kWdc
PSE&G Pole-Attached -- Summary by Municipality -- December 2020
Elmwood Park Boro 712 163.61
Emerson Boro 259 57.86
Englewood City 771 177.97
Englewood Cliffs Boro 239 56.59
Essex Fells Twp 59 13.86
Evesham Twp 723 153.63
Ewing Twp 2,319 499.31
Fair Lawn Boro 1,023 228.3
Fairfield Twp Ess 1006 235.05
Fairview Boro 245 57.23
Fanwood Boro 247 56.95
Fieldsboro Boro 63 13.96
Florence Twp 855 180.89
Fort Lee Boro 624 147.17
Franklin Twp Som 2680 581.67
Franklin Twp Som 82 18.55
Garfield City 576 134.23
Garwood Boro 231 52.59
Glen Ridge Boro 13 3.1
Glen Rock Boro 132 29.73
Gloucester City 747 160.43
Gloucester Twp 1639 353.57
Green Brook Twp 277 62.71
Guttenberg Town 20 4.77
Hackensack City 1322 306.55
Haddon Heights Boro 341 75.3
Haddon Twp 869 186.63
Haddonfield Boro 152 34.2
Hainesport Twp 449 95.98
Haledon Boro 117 26.34
Hamilton Twp Mer 6299 1357.61
Harrison Town 239 54.31
Hasbrouck Heights 355 83.1
Haworth Boro 35 8.04
Hawthorne Boro 419 92.89
Highland Park Boro 463 102.99
Hillsborough Twp 1541 339.37
Hillsborough Twp 0 0
Hillsdale Boro 13 3.06
Hillside Twp 589 129.89
Hillside Twp 3 0.62
Hi-Nella Boro 50 10.72
Hoboken City 243 57.34
Hohokus Boro 34 7.56
Hopewell Boro 69 16.18
Hopewell Twp Mer 466 102.87
Irvington Town 1,006 224.27
Jersey City 3678 836.54
Kearny Town 0 0
Kearny Town 1157 259.82
Kenilworth Boro 309 68.97
*Latest installation date 1/4/21
*Installs pending municipal data updates
not included in total Count of Panels by Municipality*Net of removals
Panel Report
Page 8 of 16

REDACTED
Municipality Total Installed Total kWdc
PSE&G Pole-Attached -- Summary by Municipality -- December 2020
Lawnside Boro 245 52.85
Lawrence Twp Mer 1387 299.95
Leonia Boro 178 41.67
Lincoln Park Boro 5 1.17
Linden City 2279 488.48
Little Falls Twp 403 93.81
Little Ferry Boro 430 99.36
Livingston Twp 0 0
Livingston Twp 428 101.3
Lodi Boro 601 139.53
Lumberton Twp 426 89.1
Lyndhurst Twp 849 198.81
Magnolia Boro 372 83.15
Mansfield Twp Bur 520 108.05
Manville Boro 576 130.2
Maple Shade Twp 1160 244.75
Maplewood Twp 362 81.62
Maywood Boro 199 46.93
Medford Lakes Boro 28 5.9
Medford Twp 553 115.55
Merchantville Boro 188 40.38
Metuchen Boro 525 116.43
Middlesex Boro 890 199.58
Midland Park Boro 74 17.47
Millburn Twp 7 1.66
Millstone Boro 36 7.9
Milltown Boro 2 0.44
Monroe Twp Mid 3 0.63
Montclair Twp 682 162.58
Montgomery Twp 19 4.25
Montgomery Twp 710 156.37
Moonachie Boro 349 79.47
Moorestown Twp 1031 220.6
Mount Ephraim Boro 335 71.34
Mount Holly Twp 504 106.8
Mount Laurel Twp 978 206.84
Mountainside Boro 287 66.04
National Park Boro 344 75.22
New Brunswick City 1,568 338.32
New Milford Boro 286 64.93
Newark City 7,255 1626.36
North Arlington Boro 494 114.15
North Bergen Twp 1156 270.44
North Brunswick Twp 1714 375.45
North Caldwell Twp 175 40.44
North Haledon Boro 48 11.05
North Hanover Twp 0 0
North Plainfield Boro 534 120.33
Nutley Town 522 122.97
Oaklyn Boro 264 55.61
Old Tappan Boro 7 1.68
*Latest installation date 1/4/21
*Installs pending municipal data updates
not included in total Count of Panels by Municipality*Net of removals
Panel Report
Page 9 of 16

REDACTED
Municipality Total Installed Total kWdc
PSE&G Pole-Attached -- Summary by Municipality -- December 2020
Oradell Boro 92 20.42
Orange City 540 128.25
Palisades Park Boro 396 93.38
Palmyra Boro 402 83.99
Paramus Boro 671 151.98
Park Ridge Boro 0 0
Passaic City 1003 234.11
Paterson City 3062 697.26
Paulsboro Boro 6 1.24
Pemberton Twp 88 18.34
Pennington Boro 79 18.38
Pennsauken Twp 3,172 667.63
Perth Amboy City 1,410 307.14
Piscataway Twp 2609 567.42
Plainfield City 1532 342.24
Plainsboro Twp 218 47.91
Princeton Boro 45 10.23
Princeton Twp 112 24.47
Prospect Park Boro 106 23.8
Rahway City 1346 303.49
Raritan Boro 271 59.58
Ridgefield Boro 337 78.72
Ridgefield Park Village 375 88.74
Ridgewood Village 130 29.4
River Edge Boro 262 60.01
River Vale Twp 10 2.2
Riverside Twp 546 113.66
Riverton Boro 107 23.17
Rochelle Park Twp 247 56.74
Rocky Hill Boro 17 3.73
Roseland Boro 135 32.12
Roselle Boro 605 134.56
Roselle Park Boro 291 66.93
Runnemede Boro 552 119.78
Rutherford Boro 197 43.86
Saddle Brook Twp 12 2.55
Saddle Brook Twp 293 66.63
Saddle River Boro 4 0.96
Scotch Plains Twp 634 144.69
Secaucus Town 940 219.23
Somerdale Boro 370 80.16
Somerville Boro 663 145.28
South Bound Brook Boro 196 43.27
South Brunswick Twp 1398 305.34
South Brunswick Twp 475 102.26
South Hackensack Twp 202 46.97
South Orange Village Twp 97 22.92
South Plainfield Boro 2111 467.38
Southampton Twp 759 159.33
Springfield Twp Bur 419 87.68
Springfield Twp Uni 27 6.18
*Latest installation date 1/4/21
*Installs pending municipal data updates
not included in total Count of Panels by Municipality*Net of removals
Panel Report
Page 10 of 16

REDACTED
Municipality Total Installed Total kWdc
PSE&G Pole-Attached -- Summary by Municipality -- December 2020
Tavistock Boro 1 0.22
Teaneck Twp 703 161.91
Tenafly Boro 294 67.31
Teterboro Boro 146 34.23
Totowa Boro 693 158.57
Trenton City 4,497 981.28
Union City 24 5.57
Union Twp Uni 1913 424.98
Upper Freehold Twp 75 16.06
Verona Boro 175 41.77
Voorhees Twp 301 66
Waldwick Boro 153 34.27
Wallington Boro 264 61.64
Wallington Boro 5 1.17
Warren Twp 51 10.9
Washington Twp Ber 92 20.73
Washington Twp Glo 36 7.76
Washington Twp Mer 343 73.31
Watchung Boro 306 68.14
Wayne Twp 1252 286.78
Weehawken Twp 3 0.72
West Caldwell Twp 504 118.96
West Deptford Twp 1 0.2
West Deptford Twp 1,629 350.99
West New York Town 30 6.8
West Orange Twp 1017 237.57
West Paterson Boro 300 69.12
West Windsor Twp 640 139.88
Westampton Twp 410 86.06
Westfield Town 1107 258.79
Westville Boro 496 105.56
Westwood Boro 212 46.99
Willingboro Twp 709 146.91
Winfield Twp 15 3.07
Woodbridge Twp 5538 1208.5
Woodbury City 873 190.42
Woodbury Heights Boro 263 57.11
Woodcliff Lake Boro 66 15.56
Woodlynne Boro 142 29.92
Wood-Ridge Boro 340 80
Wyckoff Twp 46 11
TOTAL 167,792 37,154
*Latest installation date 1/4/21
*Installs pending municipal data updates
not included in total Count of Panels by Municipality*Net of removals
Panel Report
Page 11 of 16

REDACTED
Allentown Boro 3
Audubon Boro 7
Barrington Boro 7
Bayonne City 21
Belleville Twp 14
Bellmawr Boro 18
Bergenfield Boro 6
Beverly City 3
Bloomfield Twp 17
Bogota Boro 3
Bordentown City 1
Bordentown Twp 14
Bound Brook Boro 5
Branchburg Twp 1
Bridgewater Twp 46
Brooklawn Boro 6
Burlington City 17
Burlington Twp 18
Caldwell Boro 3
Camden City 64
Carlstadt Boro 13
Carteret Boro 19
Cedar Grove Twp 8
Cherry Hill Twp 63
Chesterfield Twp 15
Cinnaminson Twp 19
Clark Twp 13
Cliffside Park Boro 3
Clifton City 41
Collingswood Boro 10
Cranbury Twp 8
Cranford Twp 11
Delanco Twp 3
Delran Twp 12
Deptford Twp 32
Dumont Boro 6
Dunellen Boro 4
East Brunswick Twp 38
East Newark Boro 1
East Orange City 16
East Rutherford Boro 6
Eastampton Twp 8
Edgewater Boro 5
Edgewater Park Twp 6
Edison Twp 81
Elizabeth City 45
Elmwood Park Boro 12
Emerson Boro 7
Englewood City 17
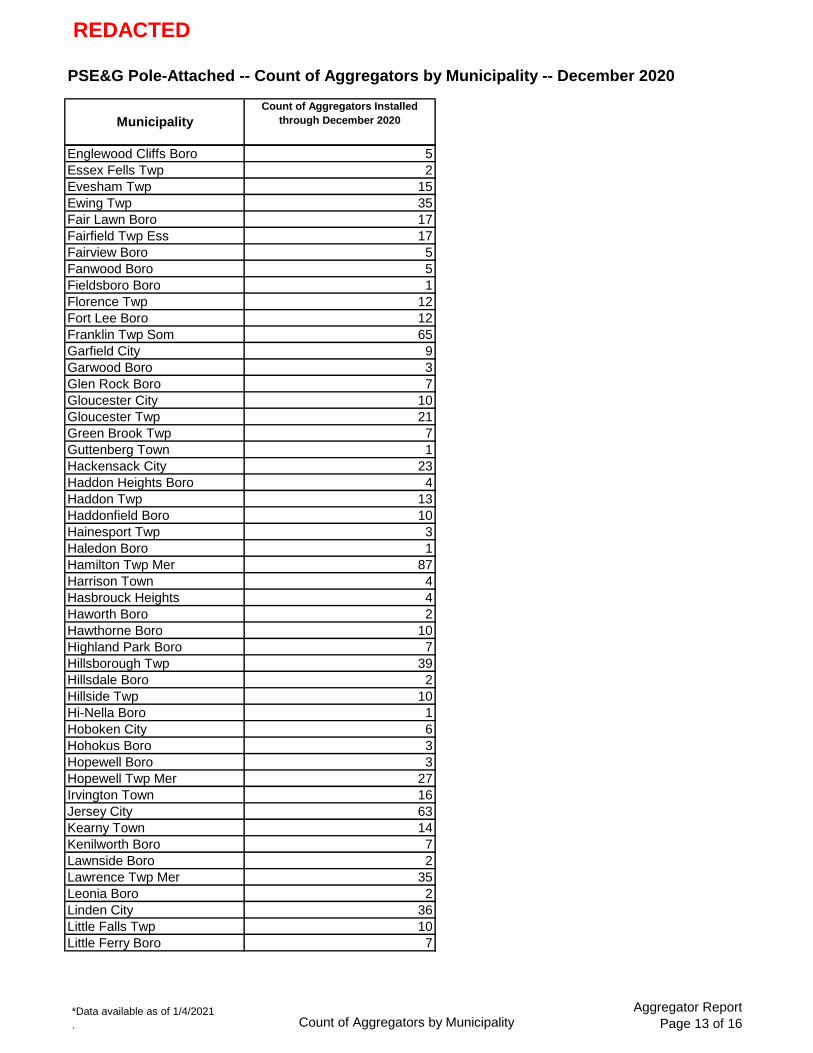
PSE&G Pole-Attached -- Count of Aggregators by Municipality -- December 2020
Municipality
Count of Aggregators Installed
through December 2020
*Data available as of 1/4/2021
. Count of Aggregators by MunicipalityAggregator Report
Page 12 of 16
REDACTED
PSE&G Pole-Attached -- Count of Aggregators by Municipality -- December 2020
Municipality
Count of Aggregators Installed
through December 2020
Englewood Cliffs Boro 5
Essex Fells Twp 2
Evesham Twp 15
Ewing Twp 35
Fair Lawn Boro 17
Fairfield Twp Ess 17
Fairview Boro 5
Fanwood Boro 5
Fieldsboro Boro 1
Florence Twp 12
Fort Lee Boro 12
Franklin Twp Som 65
Garfield City 9
Garwood Boro 3
Glen Rock Boro 7
Gloucester City 10
Gloucester Twp 21
Green Brook Twp 7
Guttenberg Town 1
Hackensack City 23
Haddon Heights Boro 4
Haddon Twp 13
Haddonfield Boro 10
Hainesport Twp 3
Haledon Boro 1
Hamilton Twp Mer 87
Harrison Town 4
Hasbrouck Heights 4
Haworth Boro 2
Hawthorne Boro 10
Highland Park Boro 7
Hillsborough Twp 39
Hillsdale Boro 2
Hillside Twp 10
Hi-Nella Boro 1
Hoboken City 6
Hohokus Boro 3
Hopewell Boro 3
Hopewell Twp Mer 27
Irvington Town 16
Jersey City 63
Kearny Town 14
Kenilworth Boro 7
Lawnside Boro 2
Lawrence Twp Mer 35
Leonia Boro 2
Linden City 36
Little Falls Twp 10
Little Ferry Boro 7
*Data available as of 1/4/2021
. Count of Aggregators by MunicipalityAggregator Report
Page 13 of 16

REDACTED
PSE&G Pole-Attached -- Count of Aggregators by Municipality -- December 2020
Municipality
Count of Aggregators Installed
through December 2020
Livingston Twp 24
Lodi Boro 11
Lumberton Twp 12
Lyndhurst Twp 12
Magnolia Boro 5
Mansfield Twp Bur 15
Manville Boro 9
Maple Shade Twp 12
Maplewood Twp 7
Maywood Boro 7
Medford Lakes Boro 3
Medford Twp 24
Merchantville Boro 1
Metuchen Boro 10
Middlesex Boro 9
Midland Park Boro 6
Millstone Boro 1
Montclair Twp 16
Montgomery Twp 36
Moonachie Boro 5
Moorestown Twp 18
Mount Ephraim Boro 4
Mount Holly Twp 9
Mount Laurel Twp 27
Mountainside Boro 8
National Park Boro 6
New Brunswick City 25
New Milford Boro 6
Newark City 106
North Arlington Boro 8
North Bergen Twp 22
North Brunswick Twp 25
North Caldwell Twp 9
North Haledon Boro 3
North Plainfield Boro 7
Nutley Town 8
Oaklyn Boro 3
Old Tappan Boro 1
Oradell Boro 3
Orange City 9
Palisades Park Boro 5
Palmyra Boro 7
Paramus Boro 24
Passaic City 17
Paterson City 46
Pemberton Twp 6
Pennington Boro 3
Pennsauken Twp 50
Perth Amboy City 24
*Data available as of 1/4/2021
. Count of Aggregators by MunicipalityAggregator Report
Page 14 of 16

REDACTED
PSE&G Pole-Attached -- Count of Aggregators by Municipality -- December 2020
Municipality
Count of Aggregators Installed
through December 2020
Piscataway Twp 55
Plainfield City 25
Plainsboro Twp 10
Princeton Boro 9
Princeton Twp 16
Prospect Park Boro 1
Rahway City 17
Raritan Boro 6
Ridgefield Boro 4
Ridgefield Park Village 5
Ridgewood Village 9
River Edge Boro 5
River Vale Twp 1
Riverside Twp 3
Riverton Boro 3
Rochelle Park Twp 5
Rocky Hill Boro 4
Roseland Boro 10
Roselle Boro 10
Roselle Park Boro 5
Runnemede Boro 8
Rutherford Boro 8
Saddle Brook Twp 7
Saddle River Boro 1
Scotch Plains Twp 12
Secaucus Town 17
Somerdale Boro 6
Somerville Boro 8
South Bound Brook Boro 2
South Brunswick Twp 46
South Hackensack Twp 3
South Orange Village Twp 5
South Plainfield Boro 41
Southampton Twp 23
Springfield Twp Bur 13
Teaneck Twp 17
Tenafly Boro 11
Teterboro Boro 2
Totowa Boro 11
Trenton City 55
Undefined Municipality 0
Union City 2
Union Twp Uni 28
Upper Freehold Twp 2
Verona Boro 3
Voorhees Twp 7
Waldwick Boro 10
Wallington Boro 2
Warren Twp 5
*Data available as of 1/4/2021
. Count of Aggregators by MunicipalityAggregator Report
Page 15 of 16

REDACTED
PSE&G Pole-Attached -- Count of Aggregators by Municipality -- December 2020
Municipality
Count of Aggregators Installed
through December 2020
Washington Twp Ber 6
Washington Twp Glo 1
Washington Twp Mer 8
Watchung Boro 13
Wayne Twp 52
West Caldwell Twp 9
West Deptford Twp 29
West New York Town 3
West Orange Twp 27
West Paterson Boro 9
West Windsor Twp 22
Westampton Twp 9
Westfield Town 25
Westville Boro 4
Westwood Boro 5
Willingboro Twp 17
Woodbridge Twp 87
Woodbury City 13
Woodbury Heights Boro 2
Woodcliff Lake Boro 5
Woodlynne Boro 2
Wood-Ridge Boro 4
Wyckoff Twp 5
TOTAL 3,125
*Data available as of 1/4/2021
. Count of Aggregators by MunicipalityAggregator Report
Page 16 of 16