red hat enterprise linux 7 developer guide
TRANSCRIPT
Red Hat Enterprise Linux 7
Developer Guide
Introduction to application development tools in RHEL 7
Last Updated: 2022-01-21


Red Hat Enterprise Linux 7 Developer Guide
Introduction to application development tools in RHEL 7
Eva-Lotte GebhardtRed Hat Customer Content [email protected]
Olga TikhomirovaRed Hat Customer Content [email protected]
Zuzana ZoubkováRed Hat Customer Content [email protected]
Vladimír SlávikRed Hat Customer Content Services

Legal Notice
Copyright © 2022 Red Hat, Inc.
The text of and illustrations in this document are licensed by Red Hat under a Creative CommonsAttribution–Share Alike 3.0 Unported license ("CC-BY-SA"). An explanation of CC-BY-SA isavailable athttp://creativecommons.org/licenses/by-sa/3.0/. In accordance with CC-BY-SA, if you distribute this document or an adaptation of it, you mustprovide the URL for the original version.
Red Hat, as the licensor of this document, waives the right to enforce, and agrees not to assert,Section 4d of CC-BY-SA to the fullest extent permitted by applicable law.
Red Hat, Red Hat Enterprise Linux, the Shadowman logo, the Red Hat logo, JBoss, OpenShift,Fedora, the Infinity logo, and RHCE are trademarks of Red Hat, Inc., registered in the United Statesand other countries.
Linux ® is the registered trademark of Linus Torvalds in the United States and other countries.
Java ® is a registered trademark of Oracle and/or its affiliates.
XFS ® is a trademark of Silicon Graphics International Corp. or its subsidiaries in the United Statesand/or other countries.
MySQL ® is a registered trademark of MySQL AB in the United States, the European Union andother countries.
Node.js ® is an official trademark of Joyent. Red Hat is not formally related to or endorsed by theofficial Joyent Node.js open source or commercial project.
The OpenStack ® Word Mark and OpenStack logo are either registered trademarks/service marksor trademarks/service marks of the OpenStack Foundation, in the United States and othercountries and are used with the OpenStack Foundation's permission. We are not affiliated with,endorsed or sponsored by the OpenStack Foundation, or the OpenStack community.
All other trademarks are the property of their respective owners.
Abstract
This document describes different features and utilities that make Red Hat Enterprise Linux 7 anideal enterprise platform for application development.

. . . . . . . . . . . . . . . . . . . . . . . . . . . . . . . . . . . . . . . . . . . . . . . . . . . . . . . . . . . . . . . . . . . . . . . . . . . . . . . . . . . . . . . . . . . . . . . . . . . . . . . . . . . . . . . . . . . . . . . . . . . . . . . . . . . . . . . . . . . . . . . . . . . . . . . . . . . . . . . . . . . . . . . . . . . . . . . . . . . . . . . . . . . . . . . . . . . . . . . . . . . . . . . . . . . . . . . . . . . . . . . . . . . . . . . . . . . . . . . . . . . . . . . . . . . . . . . . . . . . . . . . . . . . . . . . . . . . . . . .
. . . . . . . . . . . . . . . . . . . . . . . . . . . . . . . . . . . . . . . . . . . . . . . . . . . . . . . . . . . . . . . . . . . . . . . . . . . . . . . . . . . . . . . . . . . . . . . . . . . . . . . . . . . . . . . . . . . . . . . . . . . . . . . . . . . . . . . . . . . . . . . . . . . . . . . . . . . . . . . . . . . . . . . . . . . . . . . . . . . . . . . . . . . . . . . . . . . . . . . . . . . . . . . . . . . . . . . . . . . . . . . . . . . . . . . . . . . . . . . . . . . . . . . . . . . . . . . . . . . . . . . . . . . . . . . . . . . . . . . .
. . . . . . . . . . . . . . . . . . . . . . . . . . . . . . . . . . . . . . . . . . . . . . . . . . . . . . . . . . . . . . . . . . . . . . . . . . . . . . . . . . . . . . . . . . . . . . . . . . . . . . . . . . . . . . . . . . . . . . . . . . . . . . . . . . . . . . . . . . . . . . . . . . . . . . . . . . . . . . . . . . . . . . . . . . . . . . . . . . . . . . . . . . . . . . . . . . . . . . . . . . . . . . . . . . . . . . . . . . . . . . . . . . . . . . . . . . . . . . . . . . . . . . . . . . . . . . . . . . . . . . . . . . . . . . . . . . . . . . . .
. . . . . . . . . . . . . . . . . . . . . . . . . . . . . . . . . . . . . . . . . . . . . . . . . . . . . . . . . . . . . . . . . . . . . . . . . . . . . . . . . . . . . . . . . . . . . . . . . . . . . . . . . . . . . . . . . . . . . . . . . . . . . . . . . . . . . . . . . . . . . . . . . . . . . . . . . . . . . . . . . . . . . . . . . . . . . . . . . . . . . . . . . . . . . . . . . . . . . . . . . . . . . . . . . . . . . . . . . . . . . . . . . . . . . . . . . . . . . . . . . . . . . . . . . . . . . . . . . . . . . . . . . . . . . . . . . . . . . . . .
. . . . . . . . . . . . . . . . . . . . . . . . . . . . . . . . . . . . . . . . . . . . . . . . . . . . . . . . . . . . . . . . . . . . . . . . . . . . . . . . . . . . . . . . . . . . . . . . . . . . . . . . . . . . . . . . . . . . . . . . . . . . . . . . . . . . . . . . . . . . . . . . . . . . . . . . . . . . . . . . . . . . . . . . . . . . . . . . . . . . . . . . . . . . . . . . . . . . . . . . . . . . . . . . . . . . . . . . . . . . . . . . . . . . . . . . . . . . . . . . . . . . . . . . . . . . . . . . . . . . . . . . . . . . . . . . . . . . . . . .
. . . . . . . . . . . . . . . . . . . . . . . . . . . . . . . . . . . . . . . . . . . . . . . . . . . . . . . . . . . . . . . . . . . . . . . . . . . . . . . . . . . . . . . . . . . . . . . . . . . . . . . . . . . . . . . . . . . . . . . . . . . . . . . . . . . . . . . . . . . . . . . . . . . . . . . . . . . . . . . . . . . . . . . . . . . . . . . . . . . . . . . . . . . . . . . . . . . . . . . . . . . . . . . . . . . . . . . . . . . . . . . . . . . . . . . . . . . . . . . . . . . . . . . . . . . . . . . . . . . . . . . . . . . . . . . . . . . . . . . .
. . . . . . . . . . . . . . . . . . . . . . . . . . . . . . . . . . . . . . . . . . . . . . . . . . . . . . . . . . . . . . . . . . . . . . . . . . . . . . . . . . . . . . . . . . . . . . . . . . . . . . . . . . . . . . . . . . . . . . . . . . . . . . . . . . . . . . . . . . . . . . . . . . . . . . . . . . . . . . . . . . . . . . . . . . . . . . . . . . . . . . . . . . . . . . . . . . . . . . . . . . . . . . . . . . . . . . . . . . . . . . . . . . . . . . . . . . . . . . . . . . . . . . . . . . . . . . . . . . . . . . . . . . . . . . . . . . . . . . . .
. . . . . . . . . . . . . . . . . . . . . . . . . . . . . . . . . . . . . . . . . . . . . . . . . . . . . . . . . . . . . . . . . . . . . . . . . . . . . . . . . . . . . . . . . . . . . . . . . . . . . . . . . . . . . . . . . . . . . . . . . . . . . . . . . . . . . . . . . . . . . . . . . . . . . . . . . . . . . . . . . . . . . . . . . . . . . . . . . . . . . . . . . . . . . . . . . . . . . . . . . . . . . . . . . . . . . . . . . . . . . . . . . . . . . . . . . . . . . . . . . . . . . . . . . . . . . . . . . . . . . . . . . . . . . . . . . . . . . . . .
. . . . . . . . . . . . . . . . . . . . . . . . . . . . . . . . . . . . . . . . . . . . . . . . . . . . . . . . . . . . . . . . . . . . . . . . . . . . . . . . . . . . . . . . . . . . . . . . . . . . . . . . . . . . . . . . . . . . . . . . . . . . . . . . . . . . . . . . . . . . . . . . . . . . . . . . . . . . . . . . . . . . . . . . . . . . . . . . . . . . . . . . . . . . . . . . . . . . . . . . . . . . . . . . . . . . . . . . . . . . . . . . . . . . . . . . . . . . . . . . . . . . . . . . . . . . . . . . . . . . . . . . . . . . . . . . . . . . . . . .
. . . . . . . . . . . . . . . . . . . . . . . . . . . . . . . . . . . . . . . . . . . . . . . . . . . . . . . . . . . . . . . . . . . . . . . . . . . . . . . . . . . . . . . . . . . . . . . . . . . . . . . . . . . . . . . . . . . . . . . . . . . . . . . . . . . . . . . . . . . . . . . . . . . . . . . . . . . . . . . . . . . . . . . . . . . . . . . . . . . . . . . . . . . . . . . . . . . . . . . . . . . . . . . . . . . . . . . . . . . . . . . . . . . . . . . . . . . . . . . . . . . . . . . . . . . . . . . . . . . . . . . . . . . . . . . . . . . . . . . .
. . . . . . . . . . . . . . . . . . . . . . . . . . . . . . . . . . . . . . . . . . . . . . . . . . . . . . . . . . . . . . . . . . . . . . . . . . . . . . . . . . . . . . . . . . . . . . . . . . . . . . . . . . . . . . . . . . . . . . . . . . . . . . . . . . . . . . . . . . . . . . . . . . . . . . . . . . . . . . . . . . . . . . . . . . . . . . . . . . . . . . . . . . . . . . . . . . . . . . . . . . . . . . . . . . . . . . . . . . . . . . . . . . . . . . . . . . . . . . . . . . . . . . . . . . . . . . . . . . . . . . . . . . . . . . . . . . . . . . . .
. . . . . . . . . . . . . . . . . . . . . . . . . . . . . . . . . . . . . . . . . . . . . . . . . . . . . . . . . . . . . . . . . . . . . . . . . . . . . . . . . . . . . . . . . . . . . . . . . . . . . . . . . . . . . . . . . . . . . . . . . . . . . . . . . . . . . . . . . . . . . . . . . . . . . . . . . . . . . . . . . . . . . . . . . . . . . . . . . . . . . . . . . . . . . . . . . . . . . . . . . . . . . . . . . . . . . . . . . . . . . . . . . . . . . . . . . . . . . . . . . . . . . . . . . . . . . . . . . . . . . . . . . . . . . . . . . . . . . . . .
. . . . . . . . . . . . . . . . . . . . . . . . . . . . . . . . . . . . . . . . . . . . . . . . . . . . . . . . . . . . . . . . . . . . . . . . . . . . . . . . . . . . . . . . . . . . . . . . . . . . . . . . . . . . . . . . . . . . . . . . . . . . . . . . . . . . . . . . . . . . . . . . . . . . . . . . . . . . . . . . . . . . . . . . . . . . . . . . . . . . . . . . . . . . . . . . . . . . . . . . . . . . . . . . . . . . . . . . . . . . . . . . . . . . . . . . . . . . . . . . . . . . . . . . . . . . . . . . . . . . . . . . . . . . . . . . . . . . . . . .
. . . . . . . . . . . . . . . . . . . . . . . . . . . . . . . . . . . . . . . . . . . . . . . . . . . . . . . . . . . . . . . . . . . . . . . . . . . . . . . . . . . . . . . . . . . . . . . . . . . . . . . . . . . . . . . . . . . . . . . . . . . . . . . . . . . . . . . . . . . . . . . . . . . . . . . . . . . . . . . . . . . . . . . . . . . . . . . . . . . . . . . . . . . . . . . . . . . . . . . . . . . . . . . . . . . . . . . . . . . . . . . . . . . . . . . . . . . . . . . . . . . . . . . . . . . . . . . . . . . . . . . . . . . . . . . . . . . . . . . .
. . . . . . . . . . . . . . . . . . . . . . . . . . . . . . . . . . . . . . . . . . . . . . . . . . . . . . . . . . . . . . . . . . . . . . . . . . . . . . . . . . . . . . . . . . . . . . . . . . . . . . . . . . . . . . . . . . . . . . . . . . . . . . . . . . . . . . . . . . . . . . . . . . . . . . . . . . . . . . . . . . . . . . . . . . . . . . . . . . . . . . . . . . . . . . . . . . . . . . . . . . . . . . . . . . . . . . . . . . . . . . . . . . . . . . . . . . . . . . . . . . . . . . . . . . . . . . . . . . . . . . . . . . . . . . . . . . . . . . . .
. . . . . . . . . . . . . . . . . . . . . . . . . . . . . . . . . . . . . . . . . . . . . . . . . . . . . . . . . . . . . . . . . . . . . . . . . . . . . . . . . . . . . . . . . . . . . . . . . . . . . . . . . . . . . . . . . . . . . . . . . . . . . . . . . . . . . . . . . . . . . . . . . . . . . . . . . . . . . . . . . . . . . . . . . . . . . . . . . . . . . . . . . . . . . . . . . . . . . . . . . . . . . . . . . . . . . . . . . . . . . . . . . . . . . . . . . . . . . . . . . . . . . . . . . . . . . . . . . . . . . . . . . . . . . . . . . . . . . . . .
. . . . . . . . . . . . . . . . . . . . . . . . . . . . . . . . . . . . . . . . . . . . . . . . . . . . . . . . . . . . . . . . . . . . . . . . . . . . . . . . . . . . . . . . . . . . . . . . . . . . . . . . . . . . . . . . . . . . . . . . . . . . . . . . . . . . . . . . . . . . . . . . . . . . . . . . . . . . . . . . . . . . . . . . . . . . . . . . . . . . . . . . . . . . . . . . . . . . . . . . . . . . . . . . . . . . . . . . . . . . . . . . . . . . . . . . . . . . . . . . . . . . . . . . . . . . . . . . . . . . . . . . . . . . . . . . . . . . . . . .
. . . . . . . . . . . . . . . . . . . . . . . . . . . . . . . . . . . . . . . . . . . . . . . . . . . . . . . . . . . . . . . . . . . . . . . . . . . . . . . . . . . . . . . . . . . . . . . . . . . . . . . . . . . . . . . . . . . . . . . . . . . . . . . . . . . . . . . . . . . . . . . . . . . . . . . . . . . . . . . . . . . . . . . . . . . . . . . . . . . . . . . . . . . . . . . . . . . . . . . . . . . . . . . . . . . . . . . . . . . . . . . . . . . . . . . . . . . . . . . . . . . . . . . . . . . . . . . . . . . . . . . . . . . . . . . . . . . . . . . .
Table of Contents
PREFACE
PART I. SETTING UP A DEVELOPMENT WORKSTATION
CHAPTER 1. INSTALLING THE OPERATING SYSTEMAdditional Resources
CHAPTER 2. SETTING UP TO MANAGE APPLICATION VERSIONSAdditional Resources
CHAPTER 3. SETTING UP TO DEVELOP APPLICATIONS USING C AND C++Additional Resources
CHAPTER 4. SETTING UP TO DEBUG APPLICATIONSAdditional Resources
CHAPTER 5. SETTING UP TO MEASURE PERFORMANCE OF APPLICATIONSAdditional Resources
CHAPTER 6. SETTING UP TO DEVELOP APPLICATIONS USING JAVA
CHAPTER 7. SETTING UP TO DEVELOP APPLICATIONS USING PYTHONPython versions corresponding to Red Hat Software Collections packagesAdditional Resources
CHAPTER 8. SETTING UP TO DEVELOP APPLICATIONS USING C# AND .NET COREAdditional Resources
CHAPTER 9. SETTING UP TO DEVELOP CONTAINERIZED APPLICATIONSAdditional Resources
CHAPTER 10. SETTING UP TO DEVELOP WEB APPLICATIONSAdditional Resources
PART II. COLLABORATING ON APPLICATIONS WITH OTHER DEVELOPERS
CHAPTER 11. USING GITInstalled DocumentationOnline Documentation
PART III. MAKING AN APPLICATION AVAILABLE TO USERS
CHAPTER 12. DISTRIBUTION OPTIONSRPM PackagesSoftware CollectionsContainersAdditional Resources
CHAPTER 13. CREATING A CONTAINER WITH AN APPLICATIONPrerequisitesProcedureAdditional Resources
CHAPTER 14. CONTAINERIZING AN APPLICATION FROM PACKAGESPrerequisitesProcedure
8
9
1010
1111
1212
1313
1414
15
161616
1717
1818
1919
20
212121
22
2323232323
24242425
262626
Table of Contents
1

. . . . . . . . . . . . . . . . . . . . . . . . . . . . . . . . . . . . . . . . . . . . . . . . . . . . . . . . . . . . . . . . . . . . . . . . . . . . . . . . . . . . . . . . . . . . . . . . . . . . . . . . . . . . . . . . . . . . . . . . . . . . . . . . . . . . . . . . . . . . . . . . . . . . . . . . . . . . . . . . . . . . . . . . . . . . . . . . . . . . . . . . . . . . . . . . . . . . . . . . . . . . . . . . . . . . . . . . . . . . . . . . . . . . . . . . . . . . . . . . . . . . . . . . . . . . . . . . . . . . . . . . . . . . . . . . . . . . . . . .
. . . . . . . . . . . . . . . . . . . . . . . . . . . . . . . . . . . . . . . . . . . . . . . . . . . . . . . . . . . . . . . . . . . . . . . . . . . . . . . . . . . . . . . . . . . . . . . . . . . . . . . . . . . . . . . . . . . . . . . . . . . . . . . . . . . . . . . . . . . . . . . . . . . . . . . . . . . . . . . . . . . . . . . . . . . . . . . . . . . . . . . . . . . . . . . . . . . . . . . . . . . . . . . . . . . . . . . . . . . . . . . . . . . . . . . . . . . . . . . . . . . . . . . . . . . . . . . . . . . . . . . . . . . . . . . . . . . . . . . .
. . . . . . . . . . . . . . . . . . . . . . . . . . . . . . . . . . . . . . . . . . . . . . . . . . . . . . . . . . . . . . . . . . . . . . . . . . . . . . . . . . . . . . . . . . . . . . . . . . . . . . . . . . . . . . . . . . . . . . . . . . . . . . . . . . . . . . . . . . . . . . . . . . . . . . . . . . . . . . . . . . . . . . . . . . . . . . . . . . . . . . . . . . . . . . . . . . . . . . . . . . . . . . . . . . . . . . . . . . . . . . . . . . . . . . . . . . . . . . . . . . . . . . . . . . . . . . . . . . . . . . . . . . . . . . . . . . . . . . . .
Additional Information
PART IV. CREATING C OR C++ APPLICATIONS
CHAPTER 15. BUILDING CODE WITH GCC15.1. RELATIONSHIP BETWEEN CODE FORMS
PrerequisitesPossible Code FormsHandling of Code Forms in GCCAdditional Resources
15.2. COMPILING SOURCE FILES TO OBJECT CODEPrerequisitesProcedureAdditional Resources
15.3. ENABLING DEBUGGING OF C AND C++ APPLICATIONS WITH GCCEnabling the Creation of Debugging Information with GCCAdditional Resources
15.4. CODE OPTIMIZATION WITH GCCCode Optimization with GCCAdditional Resources
15.5. HARDENING CODE WITH GCCRelease Version OptionsDevelopment OptionsAdditional Resources
15.6. LINKING CODE TO CREATE EXECUTABLE FILESPrerequisitesProcedureAdditional Resources
15.7. C++ COMPATIBILITY OF VARIOUS RED HAT PRODUCTSAdditional Resources
15.8. EXAMPLE: BUILDING A C PROGRAM WITH GCCPrerequisitesStepsAdditional Resources
15.9. EXAMPLE: BUILDING A C++ PROGRAM WITH GCCPrerequisitesProcedure
CHAPTER 16. USING LIBRARIES WITH GCC16.1. LIBRARY NAMING CONVENTIONS
Additional Resources16.2. STATIC AND DYNAMIC LINKING
Comparison of static and dynamic linkingReasons for static linkingAdditional Resources
16.3. USING A LIBRARY WITH GCCCompiling Code That Uses a LibraryLinking Code That Uses a LibraryCompiling and Linking Code Which Uses a Library in One StepAdditional Resources
16.4. USING A STATIC LIBRARY WITH GCCPrerequisitesProcedure
16.5. USING A DYNAMIC LIBRARY WITH GCC
26
27
282828282828292929292929303030313131313131313132323232323333333333
35353535353636363737373737383839
Red Hat Enterprise Linux 7 Developer Guide
2

. . . . . . . . . . . . . . . . . . . . . . . . . . . . . . . . . . . . . . . . . . . . . . . . . . . . . . . . . . . . . . . . . . . . . . . . . . . . . . . . . . . . . . . . . . . . . . . . . . . . . . . . . . . . . . . . . . . . . . . . . . . . . . . . . . . . . . . . . . . . . . . . . . . . . . . . . . . . . . . . . . . . . . . . . . . . . . . . . . . . . . . . . . . . . . . . . . . . . . . . . . . . . . . . . . . . . . . . . . . . . . . . . . . . . . . . . . . . . . . . . . . . . . . . . . . . . . . . . . . . . . . . . . . . . . . . . . . . . . . .
. . . . . . . . . . . . . . . . . . . . . . . . . . . . . . . . . . . . . . . . . . . . . . . . . . . . . . . . . . . . . . . . . . . . . . . . . . . . . . . . . . . . . . . . . . . . . . . . . . . . . . . . . . . . . . . . . . . . . . . . . . . . . . . . . . . . . . . . . . . . . . . . . . . . . . . . . . . . . . . . . . . . . . . . . . . . . . . . . . . . . . . . . . . . . . . . . . . . . . . . . . . . . . . . . . . . . . . . . . . . . . . . . . . . . . . . . . . . . . . . . . . . . . . . . . . . . . . . . . . . . . . . . . . . . . . . . . . . . . . .
. . . . . . . . . . . . . . . . . . . . . . . . . . . . . . . . . . . . . . . . . . . . . . . . . . . . . . . . . . . . . . . . . . . . . . . . . . . . . . . . . . . . . . . . . . . . . . . . . . . . . . . . . . . . . . . . . . . . . . . . . . . . . . . . . . . . . . . . . . . . . . . . . . . . . . . . . . . . . . . . . . . . . . . . . . . . . . . . . . . . . . . . . . . . . . . . . . . . . . . . . . . . . . . . . . . . . . . . . . . . . . . . . . . . . . . . . . . . . . . . . . . . . . . . . . . . . . . . . . . . . . . . . . . . . . . . . . . . . . . .
. . . . . . . . . . . . . . . . . . . . . . . . . . . . . . . . . . . . . . . . . . . . . . . . . . . . . . . . . . . . . . . . . . . . . . . . . . . . . . . . . . . . . . . . . . . . . . . . . . . . . . . . . . . . . . . . . . . . . . . . . . . . . . . . . . . . . . . . . . . . . . . . . . . . . . . . . . . . . . . . . . . . . . . . . . . . . . . . . . . . . . . . . . . . . . . . . . . . . . . . . . . . . . . . . . . . . . . . . . . . . . . . . . . . . . . . . . . . . . . . . . . . . . . . . . . . . . . . . . . . . . . . . . . . . . . . . . . . . . . .
. . . . . . . . . . . . . . . . . . . . . . . . . . . . . . . . . . . . . . . . . . . . . . . . . . . . . . . . . . . . . . . . . . . . . . . . . . . . . . . . . . . . . . . . . . . . . . . . . . . . . . . . . . . . . . . . . . . . . . . . . . . . . . . . . . . . . . . . . . . . . . . . . . . . . . . . . . . . . . . . . . . . . . . . . . . . . . . . . . . . . . . . . . . . . . . . . . . . . . . . . . . . . . . . . . . . . . . . . . . . . . . . . . . . . . . . . . . . . . . . . . . . . . . . . . . . . . . . . . . . . . . . . . . . . . . . . . . . . . . .
PrerequisitesLinking a Program Against a Dynamic LibraryUsing an rpath Value Stored in the Executable FileUsing the LD_LIBRARY_PATH Environment VariablePlacing the Library into the Default Directories
16.6. USING BOTH STATIC AND DYNAMIC LIBRARIES WITH GCCPrerequisitesIntroductionSpecifying the static libraries by fileUsing the -Wl optionAdditional Resources
CHAPTER 17. CREATING LIBRARIES WITH GCC17.1. LIBRARY NAMING CONVENTIONS
Additional Resources17.2. THE SONAME MECHANISM
PrerequisitesProblem IntroductionThe soname MechanismReading soname from a File
17.3. CREATING DYNAMIC LIBRARIES WITH GCCPrerequisitesProcedureAdditional Resources
17.4. CREATING STATIC LIBRARIES WITH GCC AND ARPrerequisitesProcedureAdditional Resources
CHAPTER 18. MANAGING MORE CODE WITH MAKE18.1. GNU MAKE AND MAKEFILE OVERVIEW
PrerequisitesGNU makeMakefile Details
Typical MakefileAdditional resources
18.2. EXAMPLE: BUILDING A C PROGRAM USING A MAKEFILEPrerequisitesProcedure
Additional Resources18.3. DOCUMENTATION RESOURCES FOR MAKE
Installed DocumentationOnline Documentation
CHAPTER 19. USING THE ECLIPSE IDE FOR C AND C++ APPLICATION DEVELOPMENTUsing Eclipse to Develop C and C++ ApplicationsAdditional Resources
PART V. DEBUGGING APPLICATIONS
CHAPTER 20. DEBUGGING A RUNNING APPLICATION20.1. ENABLING DEBUGGING WITH DEBUGGING INFORMATION
20.1.1. Debugging InformationAdditional Resources
3939393940404040414141
42424242424242434343434444444445
4646464646464747474748484849
505050
51
52525252
Table of Contents
3

20.1.2. Enabling Debugging of C and C++ Applications with GCCEnabling the Creation of Debugging Information with GCCAdditional Resources
20.1.3. Debuginfo PackagesPrerequisitesDebuginfo Packages
20.1.4. Getting debuginfo Packages for an Application or Library using GDBPrerequisitesProcedureAdditional Resources
20.1.5. Getting debuginfo Packages for an Application or Library ManuallyPrerequisitesProcedureAdditional Resources
20.2. INSPECTING THE APPLICATION’S INTERNAL STATE WITH GDB20.2.1. GNU Debugger (GDB)
GDB CapabilitiesDebugging Requirements
20.2.2. Attaching GDB to a ProcessPrerequisitesStarting a Program with GDBAttaching GDB to an Already Running ProcessAttaching an Already Running GDB to an Already Running ProcessAdditional Resources
20.2.3. Stepping through Program Code with GDBPrerequisitesGDB Commands to Step Through the CodeAdditional Resources
20.2.4. Showing Program Internal Values with GDBPrerequisitesGDB Commands to Display the Internal State of a ProgramAdditional Resources
20.2.5. Using GDB Breakpoints to Stop Execution at Defined Code LocationsPrerequisitesUsing Breakpoints in GDBAdditional Resources
20.2.6. Using GDB Watchpoints to Stop Execution on Data Access and ChangesPrerequisitesUsing Watchpoints in GDBAdditional Resources
20.2.7. Debugging Forking or Threaded Programs with GDBPrerequisitesDebugging Forked Programs with GDBDebugging Threaded Programs with GDBAdditional Resources
20.3. RECORDING APPLICATION INTERACTIONS20.3.1. Useful Tools for Recording Application Interactions
Additional Resources20.3.2. Monitoring an Application’s System Calls with strace
PrerequisitesProcedureNotesAdditional Resources
525253535353535353545454545656565656565656575757575858595959596060606061616161
6262626262636363656565656666
Red Hat Enterprise Linux 7 Developer Guide
4

. . . . . . . . . . . . . . . . . . . . . . . . . . . . . . . . . . . . . . . . . . . . . . . . . . . . . . . . . . . . . . . . . . . . . . . . . . . . . . . . . . . . . . . . . . . . . . . . . . . . . . . . . . . . . . . . . . . . . . . . . . . . . . . . . . . . . . . . . . . . . . . . . . . . . . . . . . . . . . . . . . . . . . . . . . . . . . . . . . . . . . . . . . . . . . . . . . . . . . . . . . . . . . . . . . . . . . . . . . . . . . . . . . . . . . . . . . . . . . . . . . . . . . . . . . . . . . . . . . . . . . . . . . . . . . . . . . . . . . . .
. . . . . . . . . . . . . . . . . . . . . . . . . . . . . . . . . . . . . . . . . . . . . . . . . . . . . . . . . . . . . . . . . . . . . . . . . . . . . . . . . . . . . . . . . . . . . . . . . . . . . . . . . . . . . . . . . . . . . . . . . . . . . . . . . . . . . . . . . . . . . . . . . . . . . . . . . . . . . . . . . . . . . . . . . . . . . . . . . . . . . . . . . . . . . . . . . . . . . . . . . . . . . . . . . . . . . . . . . . . . . . . . . . . . . . . . . . . . . . . . . . . . . . . . . . . . . . . . . . . . . . . . . . . . . . . . . . . . . . . .
. . . . . . . . . . . . . . . . . . . . . . . . . . . . . . . . . . . . . . . . . . . . . . . . . . . . . . . . . . . . . . . . . . . . . . . . . . . . . . . . . . . . . . . . . . . . . . . . . . . . . . . . . . . . . . . . . . . . . . . . . . . . . . . . . . . . . . . . . . . . . . . . . . . . . . . . . . . . . . . . . . . . . . . . . . . . . . . . . . . . . . . . . . . . . . . . . . . . . . . . . . . . . . . . . . . . . . . . . . . . . . . . . . . . . . . . . . . . . . . . . . . . . . . . . . . . . . . . . . . . . . . . . . . . . . . . . . . . . . . .
. . . . . . . . . . . . . . . . . . . . . . . . . . . . . . . . . . . . . . . . . . . . . . . . . . . . . . . . . . . . . . . . . . . . . . . . . . . . . . . . . . . . . . . . . . . . . . . . . . . . . . . . . . . . . . . . . . . . . . . . . . . . . . . . . . . . . . . . . . . . . . . . . . . . . . . . . . . . . . . . . . . . . . . . . . . . . . . . . . . . . . . . . . . . . . . . . . . . . . . . . . . . . . . . . . . . . . . . . . . . . . . . . . . . . . . . . . . . . . . . . . . . . . . . . . . . . . . . . . . . . . . . . . . . . . . . . . . . . . . .
. . . . . . . . . . . . . . . . . . . . . . . . . . . . . . . . . . . . . . . . . . . . . . . . . . . . . . . . . . . . . . . . . . . . . . . . . . . . . . . . . . . . . . . . . . . . . . . . . . . . . . . . . . . . . . . . . . . . . . . . . . . . . . . . . . . . . . . . . . . . . . . . . . . . . . . . . . . . . . . . . . . . . . . . . . . . . . . . . . . . . . . . . . . . . . . . . . . . . . . . . . . . . . . . . . . . . . . . . . . . . . . . . . . . . . . . . . . . . . . . . . . . . . . . . . . . . . . . . . . . . . . . . . . . . . . . . . . . . . . .
. . . . . . . . . . . . . . . . . . . . . . . . . . . . . . . . . . . . . . . . . . . . . . . . . . . . . . . . . . . . . . . . . . . . . . . . . . . . . . . . . . . . . . . . . . . . . . . . . . . . . . . . . . . . . . . . . . . . . . . . . . . . . . . . . . . . . . . . . . . . . . . . . . . . . . . . . . . . . . . . . . . . . . . . . . . . . . . . . . . . . . . . . . . . . . . . . . . . . . . . . . . . . . . . . . . . . . . . . . . . . . . . . . . . . . . . . . . . . . . . . . . . . . . . . . . . . . . . . . . . . . . . . . . . . . . . . . . . . . . .
20.3.3. Monitoring the Application’s Library Function Calls with ltracePrerequisitesProcedureAdditional Resources
20.3.4. Monitoring the Application’s System Calls with SystemTapPrerequisitesProcedureAdditional Resources
20.3.5. Using GDB to Intercept Application System CallsPrerequisitesStopping Program Execution on System Calls with GDB
Additional Resources20.3.6. Using GDB to Intercept the Handling of Signals by Applications
PrerequisitesStopping the Program Execution on Receiving a Signal with GDBAdditional Resources
CHAPTER 21. DEBUGGING A CRASHED APPLICATION21.1. CORE DUMPS
PrerequisitesDescription
21.2. RECORDING APPLICATION CRASHES WITH CORE DUMPSProcedureAdditional Resources
21.3. INSPECTING APPLICATION CRASH STATES WITH CORE DUMPSPrerequisitesProcedureAdditional Resources
21.4. DUMPING PROCESS MEMORY WITH GCOREPrerequisitesProcedure
Additional resources21.5. DUMPING PROTECTED PROCESS MEMORY WITH GDB
PrerequisitesProcedureAdditional Resources
PART VI. MONITORING PERFORMANCE
CHAPTER 22. VALGRIND22.1. VALGRIND TOOLS22.2. USING VALGRIND22.3. ADDITIONAL INFORMATION
CHAPTER 23. OPROFILE23.1. USING OPROFILE23.2. OPROFILE DOCUMENTATION
CHAPTER 24. SYSTEMTAP24.1. ADDITIONAL INFORMATION
CHAPTER 25. PERFORMANCE COUNTERS FOR LINUX (PCL) TOOLS AND PERF25.1. PERF TOOL COMMANDS25.2. USING PERF
67676768686868696969697070707070
71717171717172727272747474747575757575
76
77777878
797981
8282
838383
Table of Contents
5
. . . . . . . . . . . . . . . . . . . . . . . . . . . . . . . . . . . . . . . . . . . . . . . . . . . . . . . . . . . . . . . . . . . . . . . . . . . . . . . . . . . . . . . . . . . . . . . . . . . . . . . . . . . . . . . . . . . . . . . . . . . . . . . . . . . . . . . . . . . . . . . . . . . . . . . . . . . . . . . . . . . . . . . . . . . . . . . . . . . . . . . . . . . . . . . . . . . . . . . . . . . . . . . . . . . . . . . . . . . . . . . . . . . . . . . . . . . . . . . . . . . . . . . . . . . . . . . . . . . . . . . . . . . . . . . . . . . . . . . .APPENDIX A. REVISION HISTORY 86
Red Hat Enterprise Linux 7 Developer Guide
6

Table of Contents
7

PREFACEThis document describes the different features and utilities that make Red Hat Enterprise Linux 7 anideal enterprise platform for application development.
Red Hat Enterprise Linux 7 will cease to be updated after the release of RHEL 7.9. Check the ProductLife Cycle of Red Hat Software Collections for Red Hat Enterprise Linux 7 for information on the currentstatus of RHEL 7 products.
Red Hat Enterprise Linux 7 Developer Guide
8

PART I. SETTING UP A DEVELOPMENT WORKSTATIONRed Hat Enterprise Linux 7 supports development of custom applications. To allow developers to do so,the system must be set up with the required tools and utilities. This chapter lists the most common usecases for development and the items to install.
PART I. SETTING UP A DEVELOPMENT WORKSTATION
9

CHAPTER 1. INSTALLING THE OPERATING SYSTEMBefore setting up for specific development needs, the underlying system must be set up.
1. Install Red Hat Enterprise Linux in the Workstation variant. Follow the instructions in theRed Hat Enterprise Linux Installation Guide.
2. While installing, pay attention to software selection. Select the Development and Creative Workstation system profile and enable the installation of Add-ons appropriate for yourdevelopment needs. The relevant Add-ons are listed in each of the following sections focusingon various types of development.
3. To develop applications that cooperate closely with the Linux kernel such as drivers, enableautomatic crash dumping with kdump during the installation.
4. After the system itself is installed, register it and attach the required subscriptions. Follow theinstructions in Red Hat Enterprise Linux System Administrator’s Guide, Chapter 7., Registeringthe System and Managing Subscriptions.The following sections list the particular subscriptions that must be attached for the respectivetype of development.
5. More recent versions of development tools and utilities are available as Red Hat SoftwareCollections. For instructions on accessing Red Hat Software Collections, see Red Hat SoftwareCollections Release Notes, Chapter 2., Installation.
Additional Resources
Red Hat Enterprise Linux Installation Guide — Subscription Manager
Red Hat Subscription Management
Red Hat Enterprise Linux 7 Package Manifest
Red Hat Enterprise Linux 7 Developer Guide
10

CHAPTER 2. SETTING UP TO MANAGE APPLICATIONVERSIONS
Effective version control is essential to all multi-developer projects. Red Hat Enterprise Linux isdistributed with Git, a distributed version control system.
1. Select the Development Tools Add-on during the system installation to install Git.
2. Alternatively, install the git package from the Red Hat Enterprise Linux repositories after thesystem is installed.
# yum install git
3. To get the latest version of Git supported by Red Hat, install the rh-git227 component fromRed Hat Software Collections.
# yum install rh-git227
4. Set the full name and email address associated with your Git commits:
$ git config --global user.name "full name"$ git config --global user.email "email_address"
Replace full name and email_address with your actual name and email address.
5. To change the default text editor started by Git, set the value of the core.editor configurationoption:
$ git config --global core.editor command
Replace command with the command to be used to start the selected text editor.
Additional Resources
Chapter 11, Using Git
CHAPTER 2. SETTING UP TO MANAGE APPLICATION VERSIONS
11

CHAPTER 3. SETTING UP TO DEVELOP APPLICATIONS USINGC AND C++
Red Hat Enterprise Linux best supports development using the fully compiled C and C++ programminglanguages.
1. Select the Development Tools and Debugging Tools Add-ons during the system installationto install the GNU Compiler Collection (GCC) and GNU Debugger (GDB) as well as otherdevelopment tools.
2. Latest versions of GCC, GDB, and the associated tools are available as a part of the Red HatDeveloper Toolset toolchain component.
# yum install devtoolset-9-toolchain
NOTE: Red Hat Developer Toolset is shipped as a Software Collection. The scl utility allows youto use it, running commands with the Red Hat Developer Toolset binaries used in preference tothe Red Hat Enterprise Linux system equivalent.
3. The Red Hat Enterprise Linux repositories contain many libraries widely used for thedevelopment of C and C++ applications. Install the development packages of the librariesneeded for your application using the yum package manager.
4. For graphical-based development, install the Eclipse integrated development environment.The C and C++ languages are directly supported. Eclipse is available as part of Red HatDeveloper Tools. For the actual installation procedure, see Using Eclipse.
Additional Resources
Red Hat Developer Toolset User Guide — Chapter 1., Red Hat Developer Toolset Components
Red Hat Enterprise Linux 7 Developer Guide
12

CHAPTER 4. SETTING UP TO DEBUG APPLICATIONSRed Hat Enterprise Linux offers multiple debugging and instrumentation tools to analyze andtroubleshoot internal application behavior.
1. Select the Debugging Tools and Desktop Debugging and Performance Tools Add-onsduring the system installation to install the GNU Debugger (GDB), Valgrind, SystemTap,ltrace, strace, and other tools.
2. For the latest versions of GDB, Valgrind, SystemTap, strace, and ltrace, install Red HatDeveloper Toolset. This installs memstomp, too.
# yum install devtoolset-9
NOTE: Red Hat Developer Toolset is shipped as a Software Collection. The scl utility allows youto use it, running commands with the Red Hat Developer Toolset binaries used in preference tothe Red Hat Enterprise Linux system equivalent.
3. The memstomp utility is available only as a part of Red Hat Developer Toolset. In case installingthe whole Developer Toolset is not desirable and memstomp is required, install only itscomponent from Red Hat Developer Toolset.
# yum install devtoolset-9-memstomp
4. Install the yum-utils package in order to use the debuginfo-install tool:
# yum install yum-utils
5. To debug applications and libraries available as part of Red Hat Enterprise Linux, install theirrespective debuginfo and source packages from the Red Hat Enterprise Linux repositoriesusing the debuginfo-install tool. This applies to core dump file analysis, too.
6. Install kernel debuginfo and source packages required by the SystemTap application. See theSystemTap Beginners Guide, Chapter 2.1.1., Installing SystemTap .
7. To capture kernel dumps, install and configure kdump. Follow the instructions in the KernelCrash Dump Guide, Chapter 7.2., Installing and Configuring kdump.
8. Make sure SELinux policies allow the relevant applications to run not only normally but indebugging situations, too. See SELinux User’s and Administrator’s Guide, Section 11.3., FixingProblems.
Additional Resources
Section 20.1, “Enabling Debugging with Debugging Information”
SystemTap Beginners Guide
CHAPTER 4. SETTING UP TO DEBUG APPLICATIONS
13

CHAPTER 5. SETTING UP TO MEASURE PERFORMANCE OFAPPLICATIONS
Red Hat Enterprise Linux includes several applications that can help a developer identify the causes ofapplication performance loss.
1. Select the Debugging Tools, Development Tools, and Performance Tools Add-ons duringthe system installation to install the tools OProfile, perf, and pcp.
2. Install the tools SystemTap, which allows some types of performance analysis, and Valgrind,which includes modules for performance measurement.
# yum install valgrind systemtap systemtap-runtime
NOTE: Red Hat Developer Toolset is shipped as a Software Collection. The scl utility allows youto use it, running commands with the Red Hat Developer Toolset binaries used in preference tothe Red Hat Enterprise Linux system equivalent.
3. Run a SystemTap helper script for setting up the SystemTap environment.
# stap-prep
NOTE
Running this script installs very large kernel debuginfo packages.
4. For more frequently updated versions of SystemTap, OProfile, and Valgrind, install the RedHat Developer Toolset package perftools.
# yum install devtoolset-9-perftools
Additional Resources
Red Hat Developer Toolset User Guide — Part IV., Performance Monitoring Tools
Red Hat Enterprise Linux 7 Developer Guide
14

CHAPTER 6. SETTING UP TO DEVELOP APPLICATIONSUSING JAVA
Red Hat Enterprise Linux supports the development of applications in Java.
1. During the system installation, select the Java Platform Add-on to install OpenJDK as thedefault Java version.Alternatively, follow the instructions in the Installation Guide for Red Hat CodeReady Studio,Chapter 2.2, Installing OpenJDK 1.8.0 on RHEL to install OpenJDK separately.
2. For an integrated graphical development environment, install the Eclipse-based Red HatCodeReady Studio, which offers extensive support for Java development. Follow theinstructions in the Installation Guide for Red Hat CodeReady Studio .
CHAPTER 6. SETTING UP TO DEVELOP APPLICATIONS USING JAVA
15

CHAPTER 7. SETTING UP TO DEVELOP APPLICATIONS USINGPYTHON
The Python language version 2.7.5 is available as part of Red Hat Enterprise Linux.
Newer versions of the Python interpreter and libraries (including a newer version of Python 2.7)are available as Red Hat Software Collections packages. Install the package with the desiredversion according to the table below.
# yum install package
Python versions corresponding to Red Hat Software Collections packages
Version Package
Python 2.7 python27
Python 3.6 rh-python36
Python 3.8 rh-python38
The python27 software collection is an updated version of the Python 2 packages in RHEL 7.
2. Install the Eclipse integrated development environment which supports development in thePython language. Eclipse is available as part of Red Hat Developer Tools. For the actualinstallation procedure, see Using Eclipse.
Additional Resources
Red Hat Software Collections Hello-World — Python
Red Hat Software Collections
Red Hat Enterprise Linux 7 Developer Guide
16

CHAPTER 8. SETTING UP TO DEVELOP APPLICATIONSUSING C# AND .NET CORE
Red Hat supports the development of applications targeting .NET Core.
Install .NET Core for Red Hat Enterprise Linux, which includes runtime, compilers, andadditional tools. Follow the instructions in the Getting Started Guide for .NET Core .
Additional Resources
.NET Core for Red Hat Enterprise Linux Overview
.NET Core for Red Hat Enterprise Linux Documentation
CHAPTER 8. SETTING UP TO DEVELOP APPLICATIONS USING C# AND .NET CORE
17

CHAPTER 9. SETTING UP TO DEVELOP CONTAINERIZEDAPPLICATIONS
Red Hat supports the development of containerized applications based on Red Hat Enterprise Linux,Red Hat OpenShift , and a number of other Red Hat products.
Red Hat Container Development Kit (CDK) provides a Red Hat Enterprise Linux virtualmachine that runs a single-node Red Hat OpenShift 3 cluster. It does not support OpenShift 4.Follow the instructions in the Red Hat Container Development Kit Getting Started Guide,Chapter 1.4., Installing CDK.
Red Hat CodeReady Containers (CRC) brings a minimal OpenShift 4 cluster to your localcomputer, providing a minimal environment for development and testing purposes. CodeReadyContainers is mainly targeted at running on developers' desktops.
Red Hat Development Suite provides Red Hat tools for the development of containerizedapplications in Java, C, and C++. It consists of Red Hat JBoss Developer Studio, OpenJDK,Red Hat Container Development Kit, and other minor components. To install DevSuite, followthe instructions in the Red Hat Development Suite Installation Guide .
.NET Core 3.1 is a general-purpose development platform for building high-quality applicationsthat run on the OpenShift Container Platform versions 3.3 and later. For installation and usageinstructions, see the .NET Core Getting Started Guide Chapter 2., Using .NET Core 3.1 on RedHat OpenShift Container Platform.
Additional Resources
Red Hat CodeReady Studio — Getting Started with Container and Cloud-based Development
Product Documentation for Red Hat Container Development Kit
Product Documentation for OpenShift Container Platform
Red Hat Enterprise Linux Atomic Host — Overview of Containers in Red Hat Systems
Red Hat Enterprise Linux 7 Developer Guide
18

CHAPTER 10. SETTING UP TO DEVELOP WEB APPLICATIONSRed Hat Enterprise Linux supports development of web applications by being the platform for theirdeployment.
The topic of web development is too broad to be captured with a few simple instructions. This sectionoffers only the best supported paths for the development of web applications on Red HatEnterprise Linux.
To set up your environment for developing traditional web applications, install the Apache webserver, PHP runtime, and MariaDB database server and tools.
# yum install httpd mariadb-server php-mysql php
Alternatively, more recent versions of these applications are available as components of Red HatSoftware Collections.
# yum install httpd24 rh-mariadb102 rh-php73
Additional Resources
Red Hat Software Collections
Red Hat Developer portal Cheat Sheet — Advanced Linux Commands Cheat Sheet (setting upa LAMP stack)
CHAPTER 10. SETTING UP TO DEVELOP WEB APPLICATIONS
19

PART II. COLLABORATING ON APPLICATIONS WITH OTHERDEVELOPERS
This documentation part provides a short introduction to the version control system, Git.
Red Hat Enterprise Linux 7 Developer Guide
20

CHAPTER 11. USING GITEffective revision control is essential to all multi-developer projects. It allows all developers in a team tocreate, review, revise, and document code in a systematic and orderly manner. Red HatEnterprise Linux 7 is distributed with an open-source revision control system, Git.
A detailed description of Git and its features is beyond the scope of this book. For more informationabout this revision control system, see the resources listed below.
Installed Documentation
Linux manual pages for Git and tutorials:
$ man git$ man gittutorial$ man gittutorial-2
Note that many Git commands have their own manual pages.
Git User’s Manual — HTML documentation for Git is located at /usr/share/doc/git-1.8.3/user-manual.html.
Online Documentation
The online version of the Pro Git book provides a detailed description of Git, its concepts and itsusage — Pro Git Book
The online version of the Linux manual pages for Git — Pro Git Reference Sheet
CHAPTER 11. USING GIT
21

PART III. MAKING AN APPLICATION AVAILABLE TO USERSThere are multiple ways of making an application available to its users. This guide describes the mostcommon methods:
Packaging an application as an RPM package
Packaging an application as a software collection
Packaging an application as a container
Red Hat Enterprise Linux 7 Developer Guide
22

CHAPTER 12. DISTRIBUTION OPTIONSRed Hat Enterprise Linux offers three methods of distribution for third-party applications.
RPM PackagesRPM Packages are the traditional method of distributing and installing software.
RPM Packages are a mature technology with multiple tools and widely disseminated knowledge.
Applications are installed as part of the system.
The installation tools greatly assist in resolving dependencies.
NOTE
Only one version of a package can be installed, making multiple application versioninstallations difficult.
To create an RPM package, follow the instructions in the RPM Packaging Guide, Packaging Software.
Software CollectionsA Software Collection is a specially prepared RPM package for an alternative version of an application.
A Software Collection is a packaging method used and supported by Red Hat.
It is built on top of the RPM package mechanism.
Multiple versions of an application can be installed at once.
For more information, see Red Hat Software Collections Packaging Guide, What Are SoftwareCollections?
To create a software collection package, follow the instructions in the Red Hat Software CollectionsPackaging Guide, Packaging Software Collections.
ContainersDocker-formatted containers are a lightweight virtualization method.
Applications can be present in multiple independent versions and instances.
They can be prepared easily from an RPM package or Software Collection.
Interaction with the system can be precisely controlled.
Isolation of the application increases security.
Containerizing applications or their components enables the orchestration of multiple instances.
Additional Resources
Red Hat Software Collections Packaging Guide — What Are Software Collections?
CHAPTER 12. DISTRIBUTION OPTIONS
23

CHAPTER 13. CREATING A CONTAINER WITH ANAPPLICATION
This section describes how to create a docker-formatted container image from a locally built application.Making your application available as a container is advantageous when you wish to use orchestration fordeployment. Alternatively, containerizing effectively solves conflicts of dependencies.
Prerequisites
Understanding of containers
An application built locally from source
Procedure
1. Decide which base image to use.
NOTE
Red Hat recommends starting with a base image that uses Red HatEnterprise Linux as its foundation. Refer to the Base Image in the Red HatContainer Catalog for further information.
2. Create a workspace directory.
3. Prepare your application as a directory containing all of the application’s required files. Place thisdirectory inside the workspace directory.
4. Write a Dockerfile that describes the steps required to create the container.Refer to the Dockerfile Reference for information about how to create a Dockerfile thatincludes your content, sets default commands to run, and opens necessary ports and otherfeatures.
This example shows a minimal Dockerfile that contains the my-program/ directory:
Place this Dockerfile into the workspace directory.
5. Build a container image from the Dockerfile:
# docker build .(...)Successfully built container-id
During this step, note the container-id of the newly created container image.
6. Add a tag to the image to identify the registry where you want the container image to be stored.See Getting Started with Containers — Tagging Images .
# docker tag container-id registry:port/name
FROM registry.access.redhat.com/rhel7USER rootADD my-program/ .
Red Hat Enterprise Linux 7 Developer Guide
24

Replace container-id with the value shown in the output of the previous step.
Replace registry with the address of the registry you want to push the image to, port with theport of the registry (omit if not needed), and name with the name of the image.
For example, if you are running a registry using the docker-distribution service on your localsystem with an image named myimage, the tag localhost:5000/myimage would enable thatimage to be pushed to the registry.
7. Push the image to the registry so it can be pulled from that registry later.
# docker push registry:port/name
Replace the tag parts with the same values as the ones used in the previous step.
To run your own Docker registry, see Getting Started with Containers — Working with Dockerregistries.
Additional Resources
OpenShift Container Platform — Develop: Images
Red Hat Enterprise Linux Atomic Host — Recommended Practices for Container Development
Dockerfile Reference
Docker Documentation — Get Started, Part 2: Containers
Red Hat Enterprise Linux Atomic Host — Getting Started with Containers
Red Hat Container Catalog listing — Base Images
CHAPTER 13. CREATING A CONTAINER WITH AN APPLICATION
25

CHAPTER 14. CONTAINERIZING AN APPLICATION FROMPACKAGES
For multiple reasons, it may be advantageous to distribute an application packaged in an RPM packageas a container.
Prerequisites
Understanding of containers
An application packaged as one or more RPM packages
ProcedureTo containerize an application from RPM packages, see Getting Started with Containers — CreatingDocker images.
Additional Information
OpenShift Container Platform — Creating Images
Red Hat Enterprise Linux Atomic Host — Getting Started with Containers
Product Documentation for Red Hat Enterprise Linux Atomic Host
Docker Documentation — Get Started, Part 2: Containers
Docker Documentation — Dockerfile reference
Red Hat Container Catalog listing — Base Images
Red Hat Enterprise Linux 7 Developer Guide
26

PART IV. CREATING C OR C++ APPLICATIONSRed Hat offers multiple tools for creating applications using the C and C++ languages. This part of thebook lists some of the most common development tasks.
PART IV. CREATING C OR C++ APPLICATIONS
27

CHAPTER 15. BUILDING CODE WITH GCCThis chapter describes situations where source code must be transformed into executable code.
15.1. RELATIONSHIP BETWEEN CODE FORMS
Prerequisites
Understanding of the concepts of compiling and linking
Possible Code FormsWhen using the C and C++ languages, there are three forms of code:
Source code written in the C or C++ language, present as plain text files.The files typically use extensions such as .c, .cc, .cpp, .h, .hpp, .i, .inc. For a complete list ofsupported extensions and their interpretation, see the gcc manual pages:
$ man gcc
Object code, created by compiling the source code with a compiler. This is an intermediateform.The object code files use the .o extension.
Executable code, created by linking object code with a linker.Linux application executable files do not use any file name extension. Shared object (library)executable files use the .so file name extension.
NOTE
Library archive files for static linking also exist. This is a variant of object code which usesthe .a file name extension. Static linking is not recommended. See Section 16.2, “Staticand dynamic linking”.
Handling of Code Forms in GCCProducing executable code from source code requires two steps, which require different applications ortools. GCC can be used as an intelligent driver for both compilers and linkers. This allows you to use asingle command gcc for any of the required actions. GCC automatically selects the actions required(compiling and linking), as well as their sequence:
1. Source files are compiled to object files.
2. Object files and libraries are linked (including the previously compiled sources).
It is possible to run GCC such that only step 1 happens, only step 2 happens, or both steps 1 and 2happen. This is determined by the types of inputs and requested types of output.
Because larger projects require a build system which usually runs GCC separately for each action, it ishelpful to always consider compilation and linking as two distinct actions, even if GCC can perform bothat once.
Additional Resources
Section 15.2, “Compiling Source Files to Object Code”
Red Hat Enterprise Linux 7 Developer Guide
28

Section 15.6, “Linking Code to Create Executable Files”
15.2. COMPILING SOURCE FILES TO OBJECT CODE
To create object code files from source files and not an executable file immediately, GCC must beinstructed to create only object code files as its output. This action represents the basic operation of thebuild process for larger projects.
Prerequisites
C or C++ source code file(s)
GCC installed on the system
Procedure
1. Change to the directory containing the source code file(s).
2. Run gcc with the -c option:
$ gcc -c source.c another_source.c
Object files are created, with their file names reflecting the original source code files: source.cresults in source.o.
NOTE
With C++ source code, replace the gcc command with g++ for convenienthandling of C++ Standard Library dependencies.
Additional Resources
Section 15.5, “Hardening Code with GCC”
Section 15.4, “Code Optimization with GCC”
Section 15.8, “Example: Building a C Program with GCC”
15.3. ENABLING DEBUGGING OF C AND C++ APPLICATIONS WITHGCC
Because debugging information is large, it is not included in executable files by default. To enabledebugging of your C and C++ applications with it, you must explicitly instruct the compiler to createdebugging information.
Enabling the Creation of Debugging Information with GCCTo enable the creation of debugging information with GCC when compiling and linking code, use the -goption:
$ gcc ... -g ...
Optimizations performed by the compiler and linker can result in executable code which is hardto relate to the original source code: variables may be optimized out, loops unrolled, operationsmerged into the surrounding ones etc. This affects debugging negatively. For an improved
CHAPTER 15. BUILDING CODE WITH GCC
29

debugging experience, consider setting the optimization with the -Og option. However,changing the optimization level changes the executable code and may change the actualbehaviour so as to remove some bugs.
The -fcompare-debug GCC option tests code compiled by GCC with debug information andwithout debug information. The test passes if the resulting two binary files are identical. Thistest ensures that executable code is not affected by any debugging options, which furtherensures that there are no hidden bugs in the debug code. Note that using the -fcompare-debugoption significantly increases compilation time. See the GCC manual page for details about thisoption.
Additional Resources
Section 20.1, “Enabling Debugging with Debugging Information”
Using the GNU Compiler Collection (GCC) — 3.10 Options for Debugging Your Program
Debugging with GDB — 18.3 Debugging Information in Separate Files
The GCC manual page:
$ man gcc
15.4. CODE OPTIMIZATION WITH GCC
A single program can be transformed into more than one sequence of machine instructions. An optimalresult can be achieved if more resources are allocated for analysis of the code during compilation.
Code Optimization with GCCWith GCC, it is possible to set the optimization level using the -Olevel option. This option accepts a setof values in place of the level.
Level Description
0 Optimize for compilation speed - no code optimization (default)
1, 2, 3 Increasing optimization effort for code execution speed
s Optimize for resulting file size
fast Level 3 plus disregard for strict standards compliance to allow for additional optimizations
g Optimize for debugging experience
For release builds, the optimization option -O2 is recommended.
During development, the -Og option is more useful for debugging the program or library in somesituations. Because some bugs manifest only with certain optimization levels, ensure to test theprogram or library with the release optimization level.
GCC offers a large number of options to enable individual optimizations. For more information, see thefollowing Additional Resources.
Red Hat Enterprise Linux 7 Developer Guide
30

Additional Resources
Using GNU Compiler Collection — 3.11 Options That Control Optimization
Linux manual page for GCC:
$ man gcc
15.5. HARDENING CODE WITH GCC
When the compiler transforms source code to object code, it can add various checks to preventcommonly exploited situations and thus increase security. Choosing the right set of compiler optionscan help produce more secure programs and libraries, without changes to the source code.
Release Version OptionsThe following list of options is the recommended minimum for developers targeting Red HatEnterprise Linux:
$ gcc ... -O2 -g -Wall -Wl,-z,now,-z,relro -fstack-protector-strong -D_FORTIFY_SOURCE=2 ...
For programs, add the -fPIE and -pie Position Independent Executable options.
For dynamically linked libraries, the mandatory -fPIC (Position Independent Code) optionindirectly increases security.
Development OptionsThe following options are recommended to detect security flaws during development. Use these optionsin conjunction with the options for the release version:
$ gcc ... -Walloc-zero -Walloca-larger-than -Wextra -Wformat-security -Wvla-larger-than ...
Additional Resources
Defensive Coding Guide
Red Hat Developer blog post — Memory Error Detection Using GCC
15.6. LINKING CODE TO CREATE EXECUTABLE FILES
Linking is the final step when building a C or C++ application. Linking combines all object files andlibraries into an executable file.
Prerequisites
One or more object files
GCC is installed on the system
Procedure
1. Change to the directory containing the object code files.
2. Run gcc:
$ gcc ... objectfile.o another_object.o ... -o executable-file
CHAPTER 15. BUILDING CODE WITH GCC
31

An executable file named executable-file is created from the supplied object files and libraries.
To link additional libraries, add the required options before the list of object files. SeeChapter 16, Using Libraries with GCC .
NOTE
With C++ source code, replace the gcc command with g++ for convenienthandling of C++ Standard Library dependencies.
Additional Resources
Section 15.8, “Example: Building a C Program with GCC”
Chapter 16, Using Libraries with GCC
15.7. C++ COMPATIBILITY OF VARIOUS RED HAT PRODUCTS
The Red Hat ecosystem includes several versions of the GCC compiler and linker, provided in Red HatEnterprise Linux and Red Hat Developer Toolset. The C++ ABI compatibility between these is as follows:
The system compiler based on GCC 4.8 and provided directly as part of Red HatEnterprise Linux 7 supports only compiling and linking the C++98 standard (also known asC++03), and its variant with GNU extensions.
Any C++98-compliant binaries or libraries built explicitly with the options -std=c++98 or -std=gnu++98 can be freely mixed, regardless of the version of the compiler used.
Using and mixing the C++11 and C++14 language versions is supported only when using compilersfrom Red Hat Developer Toolset and only when all C++ objects compiled with the respectiveflag have been built using the same major version of GCC.
When linking C++ files built with both Red Hat Developer Toolset and Red Hat Enterprise Linuxtoolchain, prefer the Red Hat Developer Toolset version of the compiler and linker.
The default setting for compilers in Red Hat Enterprise Linux 6 and 7 and Red HatDeveloper Toolset up to 4.1 is -std=gnu++98. That is, C++98 with GNU extensions.
The default setting for compilers in Red Hat Developer Toolset 6, 6.1, 7, 7.1, 8.0, 8.1, 9.0, 9.1, and10 is -std=gnu++14. That is, C++14 with GNU extensions.
Additional Resources
Application Compatibility GUIDE
Knowledge base solution — What gcc versions are available in Red Hat Enterprise Linux?
Red Hat Developer Toolset User Guide — C++ Compatibility
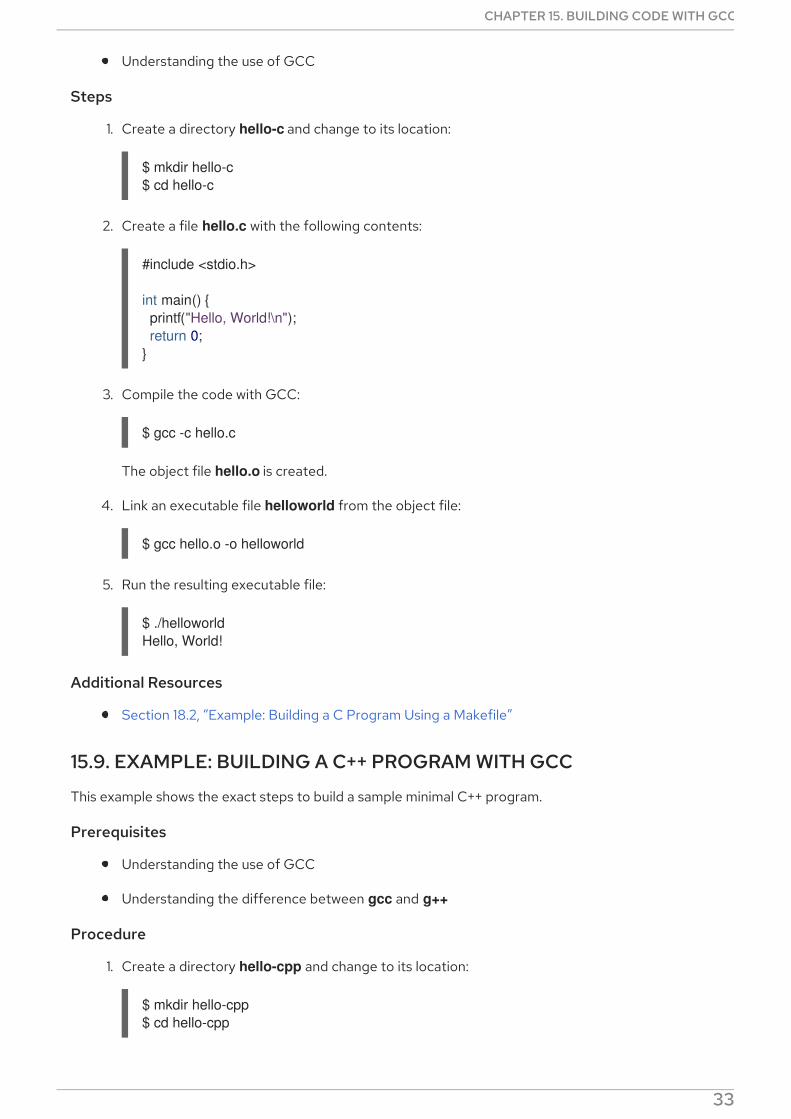
15.8. EXAMPLE: BUILDING A C PROGRAM WITH GCC
This example shows the exact steps to build a sample minimal C program.
Prerequisites
Understanding the use of GCC
Red Hat Enterprise Linux 7 Developer Guide
32
Understanding the use of GCC
Steps
1. Create a directory hello-c and change to its location:
$ mkdir hello-c$ cd hello-c
2. Create a file hello.c with the following contents:
3. Compile the code with GCC:
$ gcc -c hello.c
The object file hello.o is created.
4. Link an executable file helloworld from the object file:
$ gcc hello.o -o helloworld
5. Run the resulting executable file:
$ ./helloworldHello, World!
Additional Resources
Section 18.2, “Example: Building a C Program Using a Makefile”
15.9. EXAMPLE: BUILDING A C++ PROGRAM WITH GCC
This example shows the exact steps to build a sample minimal C++ program.
Prerequisites
Understanding the use of GCC
Understanding the difference between gcc and g++
Procedure
1. Create a directory hello-cpp and change to its location:
$ mkdir hello-cpp$ cd hello-cpp
#include <stdio.h>
int main() { printf("Hello, World!\n"); return 0;}
CHAPTER 15. BUILDING CODE WITH GCC
33
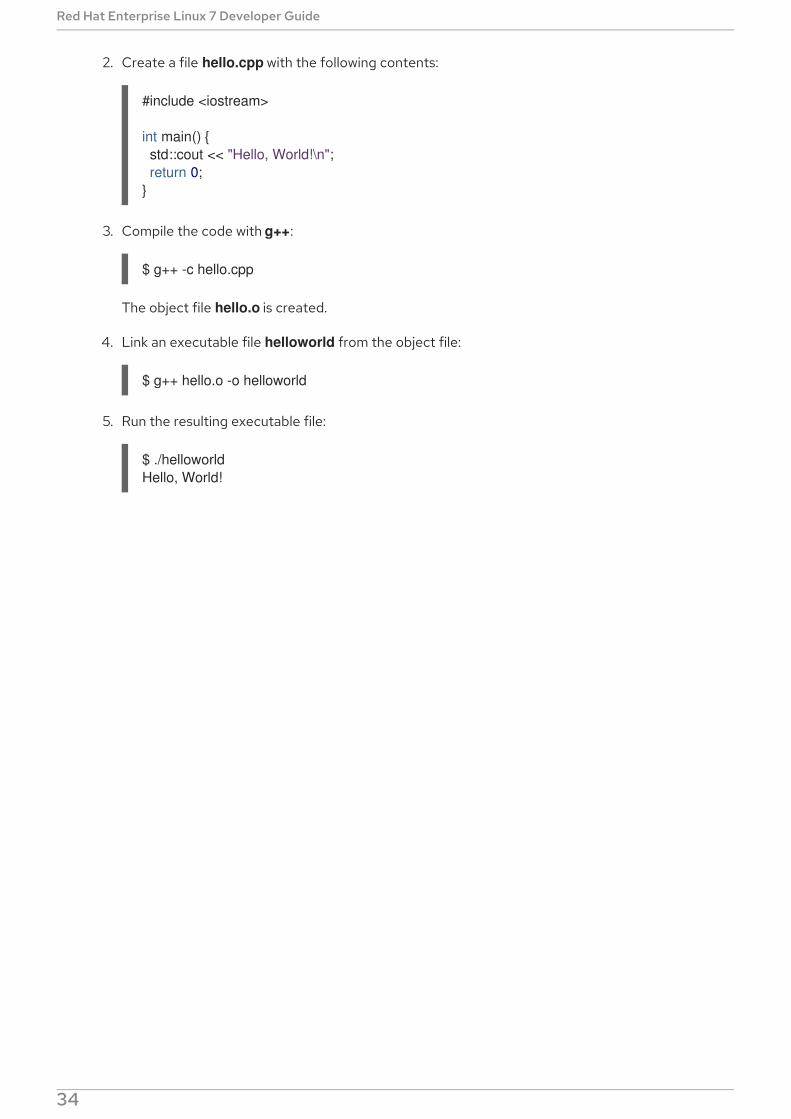
2. Create a file hello.cpp with the following contents:
3. Compile the code with g++:
$ g++ -c hello.cpp
The object file hello.o is created.
4. Link an executable file helloworld from the object file:
$ g++ hello.o -o helloworld
5. Run the resulting executable file:
$ ./helloworldHello, World!
#include <iostream>
int main() { std::cout << "Hello, World!\n"; return 0;}
Red Hat Enterprise Linux 7 Developer Guide
34

CHAPTER 16. USING LIBRARIES WITH GCCThis chapter describes how to use libraries in code.
16.1. LIBRARY NAMING CONVENTIONS
A special file name convention is used for libraries: A library known as foo is expected to exist as the file libfoo.so or libfoo.a. This convention is automatically understood by the linking input options of gcc, butnot by the output options:
When linking against the library, the library can be specified only by its name foo with the -loption as -lfoo:
$ gcc ... -lfoo ...
When creating the library, the full file name libfoo.so or libfoo.a must be specified.
Additional Resources
Section 17.2, “The soname Mechanism”
16.2. STATIC AND DYNAMIC LINKING
Developers have a choice of using static or dynamic linking when building applications with fullycompiled languages. This section lists the differences, particularly in the contexti of using the C and C++languages on Red Hat Enterprise Linux. To summarize, Red Hat discourages the use of static linking inapplications for Red Hat Enterprise Linux.
Comparison of static and dynamic linkingStatic linking makes libraries part of the resulting executable file. Dynamic linking keeps these librariesas separate files.
Dynamic and static linking can be compared in a number of ways:
Resource use
Static linking results in larger executable files which contain more code. This additional code comingfrom libraries cannot be shared across multiple programs on the system, increasing file system usageand memory usage at run time. Multiple processes running the same statically linked program will stillshare the code.On the other hand, static applications need fewer run-time relocations, leading to reduced startuptime, and require less private resident set size (RSS) memory. Generated code for static linking canbe more efficient than for dynamic linking due to the overhead introduced by position-independentcode (PIC).
Security
Dynamically linked libraries which provide ABI compatibility can be updated without changing theexecutable files depending on these libraries. This is especially important for libraries provided byRed Hat as part of Red Hat Enterprise Linux, where Red Hat provides security updates. Static linkingagainst any such libraries is strongly discouraged.Additionally, security measures such as load address randomization cannot be used with a staticallylinked executable file. This further reduces security of the resulting application.
Compatibility
CHAPTER 16. USING LIBRARIES WITH GCC
35

Static linking appears to provide executable files independent of the versions of libraries provided bythe operating system. However, most libraries depend on other libraries. With static linking, thisdependency becomes inflexible and as a result, both forward and backward compatibility is lost.Static linking is guaranteed to work only on the system where the executable file was built.
WARNING
Applications linking static libraries from the GNU C library (glibc) still requireglibc to be present on the system as a dynamic library. Furthermore, thedynamic library variant of glibc available at the application’s run time must be abitwise identical version of the one present while linking the application. As aresult, static linking is guaranteed to work only on the system where theexecutable file was built.
Support coverage
Most static libraries provided by Red Hat are in the Optional channel and not supported by Red Hat.
Functionality
Some libraries, notably the GNU C Library (glibc), offer reduced functionality when linked statically.For example, when statically linked, glibc does not support threads and any form of calls to the dlopen() function in the same program.
As a result of the listed disadvantages, static linking should be avoided at all costs, particularly for wholeapplications and the glibc and libstdc++ libraries.
NOTE
The compat-glibc package is included with Red Hat Enterprise Linux 7, but it is not a runtime package and therefore not required for running anything. It is solely a developmentpackage, containing header files and dummy libraries for linking. This allows compilingand linking packages to run in older Red Hat Enterprise Linux versions (using compat-gcc-\* against those headers and libraries). For more information on use of this package,run: rpm -qpi compat-glibc-*.
Reasons for static linkingStatic linking might be a reasonable choice in some cases, such as:
A library which is not enabled for dynamic linking
Fully static linking can be required for running code in an empty chroot environment orcontainer. However, static linking using the glibc-static package is not supported by Red Hat.
Additional Resources
Red Hat Enterprise Linux 7: Application Compatibility GUIDE
16.3. USING A LIBRARY WITH GCC
A library is a package of code which can be reused in your program. A C or C++ library consists of two
Red Hat Enterprise Linux 7 Developer Guide
36

A library is a package of code which can be reused in your program. A C or C++ library consists of twoparts:
The library code
Header files
Compiling Code That Uses a LibraryThe header files describe the interface of the library: The functions and variables available in the library.Information from the header files is needed for compiling the code.
Typically, header files of a library will be placed in a different directory than your application’s code. Totell GCC where the header files are, use the -I option:
$ gcc ... -Iinclude_path ...
Replace include_path with the actual path to the header file directory.
The -I option can be used multiple times to add multiple directories with header files. When looking for aheader file, these directories are searched in the order of their appearance in the -I options.
Linking Code That Uses a LibraryWhen linking an executable file, both the object code of your application and the binary code of thelibrary must be available. The code for static and dynamic libraries is present in different forms:
Static libraries are available as archive files. They contain a group of object files. The archive filehas the file name extension .a.
Dynamic libraries are available as shared objects. They are a form of executable file. A sharedobject has the file name extension .so.
To tell GCC where the archives or shared object files of a library are, use the -L option:
$ gcc ... -Llibrary_path -lfoo ...
Replace library_path with the actual path to the library directory.
The -L option can be used multiple times to add multiple directories. When looking for a library, thesedirectories are searched in the order of their -L options.
The order of options matters: GCC cannot link against a library foo unless it knows the directory of thislibrary. Therefore, use the -L options to specify library directories before using the -l options for linkingagainst libraries.
Compiling and Linking Code Which Uses a Library in One StepWhen the situation allows the code to be compiled and linked in one gcc command, use the options forboth situations mentioned above at once.
Additional Resources
Using the GNU Compiler Collection (GCC) — 3.16 Options for Directory Search
Using the GNU Compiler Collection (GCC) — 3.15 Options for Linking
16.4. USING A STATIC LIBRARY WITH GCC
CHAPTER 16. USING LIBRARIES WITH GCC
37

Static libraries are available as archives containing object files. After linking, they become part of theresulting executable file.
NOTE
Red Hat discourages the use of static linking for various reasons. See Section 16.2,“Static and dynamic linking”. Use static linking only when necessary, especially againstlibraries provided by Red Hat.
Prerequisites
GCC is installed on your system
Understanding of static and dynamic linking
A set of source or object files forming a valid program, requiring some static library foo and noother libraries
The foo library is available as a file libfoo.a, and no file libfoo.so is provided for dynamic linking.
NOTE
Most libraries which are part of Red Hat Enterprise Linux are supported for dynamiclinking only. The steps below only work for libraries which are not enabled for dynamiclinking. See Section 16.6, “Using Both Static and Dynamic Libraries with GCC” .
ProcedureTo link a program from source and object files, add a statically linked library foo, which is named libfoo.a:
1. Change to the directory containing your code.
2. Compile the program source files with headers of the foo library:
$ gcc ... -Iheader_path -c ...
Replace header_path with the path to the directory containing the header files for the foolibrary.
3. Link the program with the foo library:
$ gcc ... -Llibrary_path -lfoo ...
Replace library_path with the path to the directory containing the file libfoo.a.
4. To execute the program, run:
$ ./program
CAUTION
The -static GCC option related to static linking forbids all dynamic linking. Instead, use the -Wl,-Bstaticand -Wl,-Bdynamic options to control linker behavior more precisely. See Section 16.6, “Using BothStatic and Dynamic Libraries with GCC”.
Red Hat Enterprise Linux 7 Developer Guide
38

16.5. USING A DYNAMIC LIBRARY WITH GCC
Dynamic libraries are available as standalone executable files, required at both linking time and run time.They stay independent of your application’s executable file.
Prerequisites
GCC is installed on the system
A set of source or object files forming a valid program, requiring some dynamic library foo andno other libraries
The foo library available as a file libfoo.so
Linking a Program Against a Dynamic LibraryTo link a program against a dynamic library foo:
$ gcc ... -Llibrary_path -lfoo ...
When a program is linked against a dynamic library, the resulting program must always load the library atrun time. There are two options for locating the library:
Using an rpath value stored in the executable file itself
Using the LD_LIBRARY_PATH variable at runtime
Using an rpath Value Stored in the Executable FileThe rpath is a special value saved as a part of an executable file when it is being linked. Later, when theprogram is loaded from its executable file, the runtime linker will use the rpath value to locate the libraryfiles.
While linking with GCC, to store the path library_path as an rpath:
$ gcc ... -Llibrary_path -lfoo -Wl,-rpath=library_path ...
The path library_path must point to a directory containing the file libfoo.so.
CAUTION
There is no space after the comma in the -Wl,-rpath= option
To run the program later, execute:
$ ./program
Using the LD_LIBRARY_PATH Environment VariableIf no rpath is found in the program’s executable file, the runtime linker will use the LD_LIBRARY_PATHenvironment variable. The value of this variable must be changed for each program according to thepath where the shared library objects are located.
To run the program without rpath set, with libraries present in the library_path, execute:
$ export LD_LIBRARY_PATH=library_path:$LD_LIBRARY_PATH$ ./program
CHAPTER 16. USING LIBRARIES WITH GCC
39

Leaving out the rpath value offers flexibility, but requires setting the LD_LIBRARY_PATH variableevery time the program is to run.
Placing the Library into the Default DirectoriesThe runtime linker configuration specifies a number of directories as a default location of dynamiclibrary files. To use this default behaviour, copy your library to the appropriate directory.
A full description of the dynamic linker behavior is out of scope for this document. For more information,see the following resources:
Linux manual pages for the dynamic linker:
$ man ld.so
Contents of the /etc/ld.so.conf configuration file:
$ cat /etc/ld.so.conf
Report of the libraries recognized by the dynamic linker without additional configuration, whichincludes directories:
$ ldconfig -v
16.6. USING BOTH STATIC AND DYNAMIC LIBRARIES WITH GCC
Sometimes it is required to link some libraries statically and some dynamically.
Prerequisites
Understanding of static and dynamic linking
Introductiongcc recognizes both dynamic and static libraries. When the -lfoo option is encountered, gcc will firstattempt to locate a shared object (a .so file) containing a dynamically linked version of the foo library,and then look for the archive file (.a) containing a static version of the library. Thus, the followingsituations can result from this search:
Only the shared object is found and gcc links against it dynamically
Only the archive is found and gcc links against it statically
Both the shared object and archive are found; gcc selects by default dynamic linking against theshared object
Neither shared object nor archive is found and linking fails
Because of these rules, the best way to select the static or dynamic version of a library for linking ishaving only that version found by gcc. This can be controlled to some extent by using or leaving outdirectories containing the library versions when specifying the -Lpath options.
Additionally, because dynamic linking is the default, the only situation where linking must be explicitlyspecified is when a library with both versions present should be linked statically. There are two possiblesolutions:
Specifying the static libraries by file path instead of the -l option
Red Hat Enterprise Linux 7 Developer Guide
40

Using the -Wl option to pass options to the linker
Specifying the static libraries by fileUsually, gcc is instructed to link against a library foo with the -lfoo option. However, it is possible tospecify the full path to the file libfoo.a containing the library instead:
$ gcc ... path/to/libfoo.a ...
From the file extension .a, gcc will understand that this is a library to link with the program. However,specifying the full path to the library file is a less flexible method.
Using the -Wl optionThe gcc option -Wl is a special option for passing options to the underlying linker. Syntax of this optiondiffers from the other gcc options. The -Wl option is followed by a comma-separated list of linkeroptions, while other gcc options require a space-separated list of options. The ld linker used by gccoffers the options -Bstatic and -Bdynamic to specify whether libraries following this option should belinked statically or dynamically, respectively. After passing -Bstatic and a library to the linker, the defaultdynamic linking behaviour must be restored manually for the following libraries to be linked dynamicallywith the -Bdynamic option.
To link a program, linking a library first statically (libfirst.a) and second dynamically (libsecond.so), run:
$ gcc ... -Wl,-Bstatic -lfirst -Wl,-Bdynamic -lsecond ...
NOTE
gcc can be configured to use linkers other than the default ld. The -Wl option applies tothe gold linker, too.
Additional Resources
Using the GNU Compiler Collection (GCC) — 3.15 Options for Linking
Documentation for binutils 2.32 — 2.1 Command Line Options
CHAPTER 16. USING LIBRARIES WITH GCC
41
CHAPTER 17. CREATING LIBRARIES WITH GCCThis chapter describes steps for creating libraries and explains the necessary concepts used by theLinux operating system for libraries.
17.1. LIBRARY NAMING CONVENTIONS
A special file name convention is used for libraries: A library known as foo is expected to exist as the file libfoo.so or libfoo.a. This convention is automatically understood by the linking input options of gcc, butnot by the output options:
When linking against the library, the library can be specified only by its name foo with the -loption as -lfoo:
$ gcc ... -lfoo ...
When creating the library, the full file name libfoo.so or libfoo.a must be specified.
Additional Resources
Section 17.2, “The soname Mechanism”
17.2. THE SONAME MECHANISM
Dynamically loaded libraries (shared objects) use a mechanism called soname to manage multiplecompatible versions of a library.
Prerequisites
Understanding of dynamic linking and libraries
Understanding of the concept of ABI compatibility
Understanding of library naming conventions
Understanding of symbolic links
Problem IntroductionA dynamically loaded library (shared object) exists as an independent executable file. This makes itpossible to update the library without updating the applications that depend on it. However, thefollowing problems arise with this concept:
The identification of the actual version of the library
The need for multiple versions of the same library present
The signalling of ABI compatibility of each of the multiple versions
The soname MechanismTo resolve this, Linux uses a mechanism called soname.
A library foo version X.Y is ABI-compatible with other versions with the same value of X in the versionnumber. Minor changes preserving compatibility increase the number Y. Major changes that breakcompatibility increase the number X.
The actual library foo version X.Y exists as the file libfoo.so.x.y. Inside the library file, a soname is
Red Hat Enterprise Linux 7 Developer Guide
42

The actual library foo version X.Y exists as the file libfoo.so.x.y. Inside the library file, a soname isrecorded with the value libfoo.so.x to signal the compatibility.
When applications are built, the linker looks for the library by searching for the file libfoo.so. A symboliclink with this name must exist, pointing to the actual library file. The linker then reads the soname fromthe library file and records it into the application executable file. Finally, the linker creates the applicationso that it declares dependency on the library using the soname, not name or file name.
When the runtime dynamic linker links an application before running, it reads the soname from theexecutable file of the application. This soname is libfoo.so.x. A symbolic link with this name must exist,pointing to the actual library file. This allows loading the library, regardless of the Y component of theversion, because the soname does not change.
NOTE
The Y component of the version number is not limited to just a single number.Additionally, some libraries encode the version in their name.
Reading soname from a FileTo display the soname of a library file somelibrary:
$ objdump -p somelibrary | grep SONAME
Replace somelibrary with the actual file name of the library you wish to examine.
17.3. CREATING DYNAMIC LIBRARIES WITH GCC
Dynamically linked libraries (shared objects) allow resource conservation through code reuse andincreased security by easier updates of the library code. This section describes the steps to build andinstall a dynamic library from source.
Prerequisites
Understanding of the soname mechanism
GCC is installed on the system
Source code for a library
Procedure
1. Change to the directory with library sources.
2. Compile each source file to an object file with the position-independent code option -fPIC:
$ gcc ... -c -fPIC some_file.c ...
The object files have the same file names as the original source code files, but their extension is .o.
3. Link the shared library from the object files:
$ gcc -shared -o libfoo.so.x.y -Wl,-soname,libfoo.so.x some_file.o ...
The used major version number is X and the minor version number is Y.
CHAPTER 17. CREATING LIBRARIES WITH GCC
43

4. Copy the libfoo.so.x.y file to an appropriate location where the system’s dynamic linker canfind it. On Red Hat Enterprise Linux, the directory for libraries is /usr/lib64:
# cp libfoo.so.x.y /usr/lib64
Note that you need root permissions to manipulate files in this directory.
5. Create the symlink structure for the soname mechanism:
# ln -s libfoo.so.x.y libfoo.so.x# ln -s libfoo.so.x libfoo.so
Additional Resources
The Linux Documentation Project — Program Library HOWTO — 3. Shared Libraries
17.4. CREATING STATIC LIBRARIES WITH GCC AND AR
Creating libraries for static linking is possible through the conversion of object files into a special type ofarchive file.
NOTE
Red Hat discourages the use of static linking for security reasons. Use static linking onlywhen necessary, especially against libraries provided by Red Hat. See Section 16.2, “Staticand dynamic linking”.
Prerequisites
GCC and binutils are installed on the system
Understanding of static and dynamic linking
A source file with functions to be shared as a library
Procedure
1. Create intermediate object files with GCC.
$ gcc -c source_file.c ...
Append more source files as required. The resulting object files share the file name but use the .o file name extension.
2. Turn the object files into a static library (archive) using the ar tool from the binutils package.
$ ar rcs libfoo.a source_file.o ...
The file libfoo.a is created.
3. Use the nm command to inspect the resulting archive:
$ nm libfoo.a
Red Hat Enterprise Linux 7 Developer Guide
44

4. Copy the static library file to the appropriate directory.
5. When linking against the library, GCC will automatically recognize from the .a file nameextension that the library is an archive for static linking.
$ gcc ... -lfoo ...
Additional Resources
The Linux manual page for the ar tool:
$ man ar
CHAPTER 17. CREATING LIBRARIES WITH GCC
45

CHAPTER 18. MANAGING MORE CODE WITH MAKEThe GNU Make utility, commonly abbreviated as Make, is a tool for controlling the generation ofexecutables from source files. Make automatically determines which parts of a complex program havechanged and need to be recompiled. Make uses configuration files called Makefiles to control the wayprograms are built.
18.1. GNU MAKE AND MAKEFILE OVERVIEW
To create a usable form (usually executable files) from the source files of a particular project, performseveral necessary steps. Record the actions and their sequence to be able to repeat them later.
Red Hat Enterprise Linux contains GNU make, a build system designed for this purpose.
Prerequisites
Understanding the concepts of compiling and linking
GNU makeGNU make reads Makefiles which contain the instructions describing the build process. A Makefilecontains multiple rules that describe a way to satisfy a certain condition ( target) with a specific action(recipe). Rules can hierarchically depend on another rule.
Running make without any options makes it look for a Makefile in the current directory and attempt toreach the default target. The actual Makefile file name can be one of Makefile, makefile, and GNUmakefile. The default target is determined from the Makefile contents.
Makefile DetailsMakefiles use a relatively simple syntax for defining variables and rules, which consists of a target and arecipe. The target specifies the output if a rule is executed. The lines with recipes must start with the tabcharacter.
Typically, a Makefile contains rules for compiling source files, a rule for linking the resulting object files,and a target that serves as the entry point at the top of the hierarchy.
Consider the following Makefile for building a C program which consists of a single file, hello.c.
This specifies that to reach the target all, the file hello is required. To get hello, one needs hello.o(linked by gcc), which in turn is created from hello.c (compiled by gcc).
The target all is the default target because it is the first target that does not start with a period. Runningmake without any arguments is then identical to running make all, if the current directory contains this Makefile.
Typical MakefileA more typical Makefile uses variables for generalization of the steps and adds a target "clean" whichremoves everything but the source files.
all: hello
hello: hello.o gcc hello.o -o hello
hello.o: hello.c gcc -c hello.c -o hello.o
Red Hat Enterprise Linux 7 Developer Guide
46
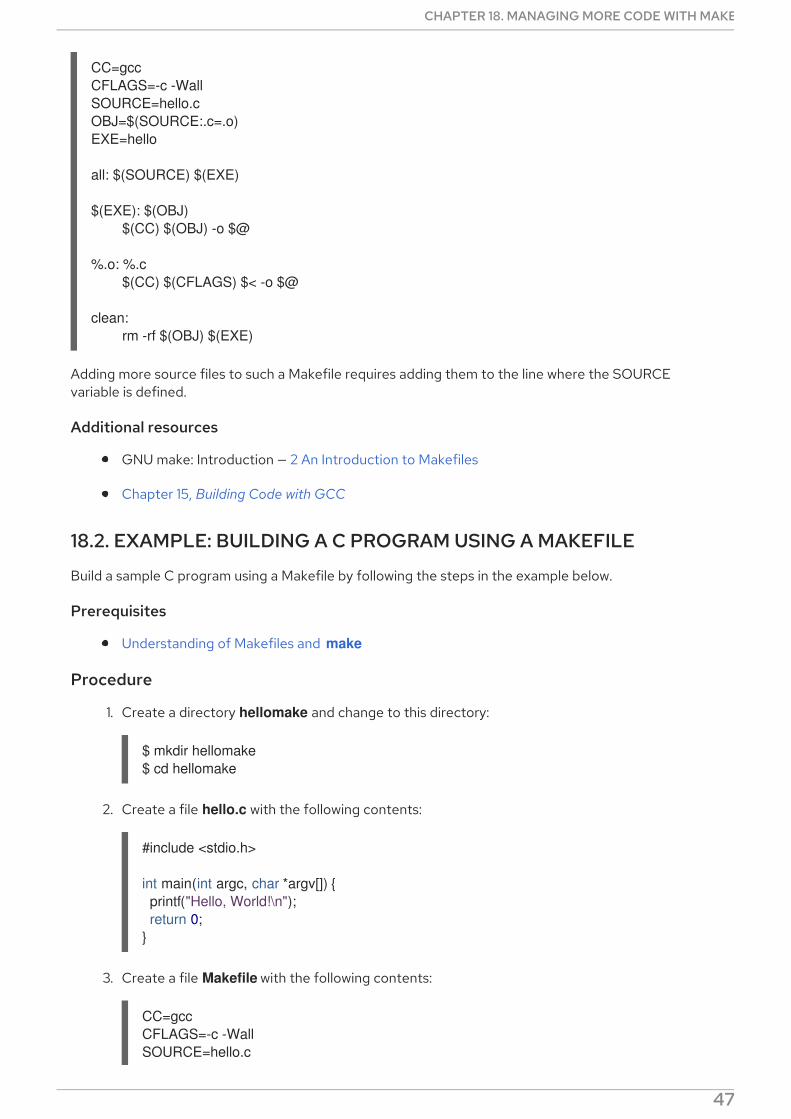
Adding more source files to such a Makefile requires adding them to the line where the SOURCEvariable is defined.
Additional resources
GNU make: Introduction — 2 An Introduction to Makefiles
Chapter 15, Building Code with GCC
18.2. EXAMPLE: BUILDING A C PROGRAM USING A MAKEFILE
Build a sample C program using a Makefile by following the steps in the example below.
Prerequisites
Understanding of Makefiles and make
Procedure
1. Create a directory hellomake and change to this directory:
$ mkdir hellomake$ cd hellomake
2. Create a file hello.c with the following contents:
3. Create a file Makefile with the following contents:
CC=gccCFLAGS=-c -WallSOURCE=hello.cOBJ=$(SOURCE:.c=.o)EXE=hello
all: $(SOURCE) $(EXE)
$(EXE): $(OBJ) $(CC) $(OBJ) -o $@
%.o: %.c $(CC) $(CFLAGS) $< -o $@
clean: rm -rf $(OBJ) $(EXE)
#include <stdio.h>
int main(int argc, char *argv[]) { printf("Hello, World!\n"); return 0;}
CC=gccCFLAGS=-c -WallSOURCE=hello.c
CHAPTER 18. MANAGING MORE CODE WITH MAKE
47

CAUTION
The Makefile recipe lines must start with the tab character. When copying the text above fromthe browser, you may paste spaces instead. Correct this change manually.
4. Run make:
$ makegcc -c -Wall hello.c -o hello.ogcc hello.o -o hello
This creates an executable file hello.
5. Run the executable file hello:
$ ./helloHello, World!
6. Run the Makefile target clean to remove the created files:
$ make cleanrm -rf hello.o hello
Additional Resources
Section 15.8, “Example: Building a C Program with GCC”
Section 15.9, “Example: Building a C++ Program with GCC”
18.3. DOCUMENTATION RESOURCES FOR MAKE
For more information about make, see the resources listed below.
Installed Documentation
Use the man and info tools to view manual pages and information pages installed on yoursystem:
$ man make$ info make
OBJ=$(SOURCE:.c=.o)EXE=hello
all: $(SOURCE) $(EXE)
$(EXE): $(OBJ) $(CC) $(OBJ) -o $@
%.o: %.c $(CC) $(CFLAGS) $< -o $@
clean: rm -rf $(OBJ) $(EXE)
Red Hat Enterprise Linux 7 Developer Guide
48

Online Documentation
The GNU Make Manual hosted by the Free Software Foundation
The Red Hat Developer Toolset User Guide — GNU make
CHAPTER 18. MANAGING MORE CODE WITH MAKE
49
CHAPTER 19. USING THE ECLIPSE IDE FOR C AND C++APPLICATION DEVELOPMENT
Some developers prefer using an IDE instead of an array of command line tools. Red Hat makes availablethe Eclipse IDE with support for development of C and C++ applications.
Using Eclipse to Develop C and C++ ApplicationsA detailed description of the Eclipse IDE and its use for developing C and C++ applications is out of thescope of this document. Please refer to the resources linked below.
Additional Resources
Using Eclipse
Eclipse documentation — C/C++ Development User Guide
Red Hat Enterprise Linux 7 Developer Guide
50

PART V. DEBUGGING APPLICATIONSDebugging applications is a very wide topic. This part provides developers with the most commontechniques for debugging in multiple situations.
PART V. DEBUGGING APPLICATIONS
51

CHAPTER 20. DEBUGGING A RUNNING APPLICATIONThis chapter will introduce the techniques for debugging an application which can be executed as manytimes as needed, on a machine directly accessible to the developer.
20.1. ENABLING DEBUGGING WITH DEBUGGING INFORMATION
To debug applications and libraries, debugging information is required. The following sections describehow to obtain this information.
20.1.1. Debugging Information
While debugging any executable code, two kinds of information allow the tools and by extension theprogrammer to comprehend the binary code:
The source code text
A description of how the source code text relates to the binary code
This is referred to as debugging information.
Red Hat Enterprise Linux uses the ELF format for executable binaries, shared libraries, or debuginfofiles. Within these ELF files, the DWARF format is used to hold the debug information.
DWARF symbols are read by the readelf -w file command.
CAUTION
STABS is occasionally used with UNIX. STABS is an older, less capable format. Its use is discouraged byRed Hat. GCC and GDB support the STABS production and consumption on a best effort basis only.Some other tools such as Valgrind and elfutils do not support STABS at all.
Additional Resources
The DWARF Debugging Standard
20.1.2. Enabling Debugging of C and C++ Applications with GCC
Because debugging information is large, it is not included in executable files by default. To enabledebugging of your C and C++ applications with it, you must explicitly instruct the compiler to createdebugging information.
Enabling the Creation of Debugging Information with GCCTo enable the creation of debugging information with GCC when compiling and linking code, use the -goption:
$ gcc ... -g ...
Optimizations performed by the compiler and linker can result in executable code which is hardto relate to the original source code: variables may be optimized out, loops unrolled, operationsmerged into the surrounding ones etc. This affects debugging negatively. For an improveddebugging experience, consider setting the optimization with the -Og option. However,changing the optimization level changes the executable code and may change the actualbehaviour so as to remove some bugs.
Red Hat Enterprise Linux 7 Developer Guide
52

The -fcompare-debug GCC option tests code compiled by GCC with debug information andwithout debug information. The test passes if the resulting two binary files are identical. Thistest ensures that executable code is not affected by any debugging options, which furtherensures that there are no hidden bugs in the debug code. Note that using the -fcompare-debugoption significantly increases compilation time. See the GCC manual page for details about thisoption.
Additional Resources
Section 20.1, “Enabling Debugging with Debugging Information”
Using the GNU Compiler Collection (GCC) — 3.10 Options for Debugging Your Program
Debugging with GDB — 18.3 Debugging Information in Separate Files
The GCC manual page:
$ man gcc
20.1.3. Debuginfo Packages
Debuginfo packages contain debugging information and debug source code for programs and libraries.
Prerequisites
Understanding of debugging information
Debuginfo PackagesFor applications and libraries installed in packages from the Red Hat Enterprise Linux repositories, youcan obtain the debugging information and debug source code as separate debuginfo packagesavailable through another channel. The debuginfo packages contain .debug files, which contain DWARFdebuginfo and the source files used for compiling the binary packages. Debuginfo package contents areinstalled to the /usr/lib/debug directory.
A debuginfo package provides debugging information valid only for a binary package with the samename, version, release, and architecture:
Binary package: packagename-version-release.architecture.rpm
Debuginfo package: packagename-debuginfo-version-release.architecture.rpm
20.1.4. Getting debuginfo Packages for an Application or Library using GDB
The GNU Debugger (GDB) automatically recognizes missing debug information and resolves thepackage name.
Prerequisites
The application or library you want to debug is installed on the system
GDB is installed on the system
The debuginfo-install tool is installed on the system
Procedure
1. Start GDB attached to the application or library you want to debug. GDB automaticallyrecognizes missing debugging information and suggests a command to run.
CHAPTER 20. DEBUGGING A RUNNING APPLICATION
53

recognizes missing debugging information and suggests a command to run.
$ gdb -q /bin/lsReading symbols from /usr/bin/ls...Reading symbols from /usr/bin/ls...(no debugging symbols found)...done.(no debugging symbols found)...done.Missing separate debuginfos, use: debuginfo-install coreutils-8.22-21.el7.x86_64(gdb)
2. Exit GDB without proceeding further: type q and Enter.
(gdb) q
3. Run the command suggested by GDB to install the needed debuginfo packages:
# debuginfo-install coreutils-8.22-21.el7.x86_64
Installing a debuginfo package for an application or library installs debuginfo packages for alldependencies, too.
4. In case GDB is not able to suggest the debuginfo package, follow the procedure inSection 20.1.5, “Getting debuginfo Packages for an Application or Library Manually” .
Additional Resources
Red Hat Developer Toolset User Guide — Chapter 1.5, Installing Debugging Information
Red Hat Knowledgebase solution — How can I download or install debuginfo packages for RHELsystems?
20.1.5. Getting debuginfo Packages for an Application or Library Manually
To manually choose (which) debuginfo packages (to install) for installation, locate the executable fileand find the package which installs it.
NOTE
The use of GDB to determine the packages for installation is preferable. Use this manualprocedure only if GDB is not able to suggest the package to install.
Prerequisites
The application or library must be installed on the system
The debuginfo-install tool must be available on the system
Procedure
1. Find the executable file of the application or library.
a. Use the which command to find the application file.
$ which nautilus/usr/bin/nautilus
Red Hat Enterprise Linux 7 Developer Guide
54

b. Use the locate command to find the library file.
$ locate libz | grep so/usr/lib64/libz.so/usr/lib64/libz.so.1/usr/lib64/libz.so.1.2.7
If the original reasons for debugging included error messages, pick the result where thelibrary has the same additional numbers in its file name. If in doubt, try following the rest ofthe procedure with the result where the library file name includes no additional numbers.
NOTE
The locate command is provided by the mlocate package. To install it andenable its use:
# yum install mlocate# updatedb
2. Using the file path, search for a package which provides that file.
# yum provides /usr/lib64/libz.so.1.2.7Loaded plugins: product-id, search-disabled-repos, subscription-managerzlib-1.2.7-17.el7.x86_64 : The compression and decompression libraryRepo : @anaconda/7.4Matched from:Filename : /usr/lib64/libz.so.1.2.7
The output provides a list of packages in the format name-version.distribution.architecture.In this step, only the package name is important, because the version shown in yum output maynot be the actual installed version.
IMPORTANT
If this step does not produce any results, it is not possible to determine whichpackage provided the binary file and this procedure fails.
3. Use the rpm low-level package management tool to find what package version is installed onthe system. Use the package name as an argument:
$ rpm -q zlibzlib-1.2.7-17.el7.x86_64
The output provides details for the installed package in the format name-version.distribution.architecture.
4. Install the debuginfo packages using the debuginfo-install utility. In the command, use thepackage name and other details you determined during the previous step:
# debuginfo-install zlib-1.2.7-17.el7.x86_64
Installing a debuginfo package for an application or library installs debuginfo packages for alldependencies, too.
CHAPTER 20. DEBUGGING A RUNNING APPLICATION
55

Additional Resources
Red Hat Developer Toolset User Guide — Installing Debugging Information
Knowledgebase article — How can I download or install debuginfo packages for RHEL systems?
20.2. INSPECTING THE APPLICATION’S INTERNAL STATE WITH GDB
To find why an application does not work properly, control its execution and examine its internal statewith a debugger. This section describes how to use the GNU Debugger (GDB) for this task.
20.2.1. GNU Debugger (GDB)
A debugger is a tool that enables control of code execution and inspection of the state of the code. Thiscapability is used to investigate what is happening in a program and why.
Red Hat Enterprise Linux contains the GNU debugger (GDB) which offers this functionality through acommand line user interface.
For a graphical frontend to GDB, install the Eclipse integrated development environment. See UsingEclipse.
GDB CapabilitiesA single GDB session can debug:
multithreaded and forking programs
multiple programs at once
programs on remote machines or in containers with the gdbserver utility connected over aTCP/IP network connection
Debugging RequirementsTo debug any executable code, GDB requires the respective debugging information:
For programs developed by you, you can create the debugging information while building thecode.
For system programs installed from packages, their respective debuginfo packages must beinstalled.
20.2.2. Attaching GDB to a Process
In order to examine a process, GDB must be attached to the process.
Prerequisites
GDB must be installed on the system
Starting a Program with GDBWhen the program is not running as a process, start it with GDB:
$ gdb program
Replace program with a file name or path to the program.
GDB starts execution of the program. You can set up breakpoints and the gdb environment before
Red Hat Enterprise Linux 7 Developer Guide
56
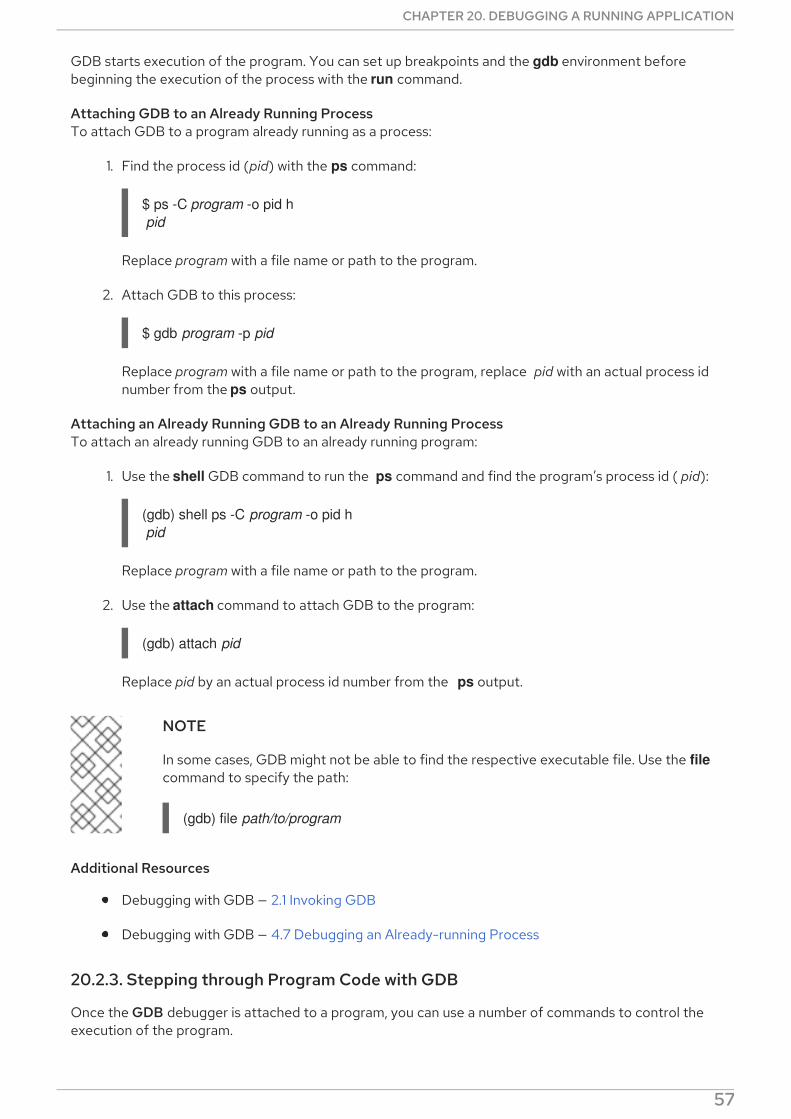
GDB starts execution of the program. You can set up breakpoints and the gdb environment beforebeginning the execution of the process with the run command.
Attaching GDB to an Already Running ProcessTo attach GDB to a program already running as a process:
1. Find the process id (pid) with the ps command:
$ ps -C program -o pid h pid
Replace program with a file name or path to the program.
2. Attach GDB to this process:
$ gdb program -p pid
Replace program with a file name or path to the program, replace pid with an actual process idnumber from the ps output.
Attaching an Already Running GDB to an Already Running ProcessTo attach an already running GDB to an already running program:
1. Use the shell GDB command to run the ps command and find the program’s process id ( pid):
(gdb) shell ps -C program -o pid h pid
Replace program with a file name or path to the program.
2. Use the attach command to attach GDB to the program:
(gdb) attach pid
Replace pid by an actual process id number from the ps output.
NOTE
In some cases, GDB might not be able to find the respective executable file. Use the filecommand to specify the path:
(gdb) file path/to/program
Additional Resources
Debugging with GDB — 2.1 Invoking GDB
Debugging with GDB — 4.7 Debugging an Already-running Process
20.2.3. Stepping through Program Code with GDB
Once the GDB debugger is attached to a program, you can use a number of commands to control theexecution of the program.
CHAPTER 20. DEBUGGING A RUNNING APPLICATION
57
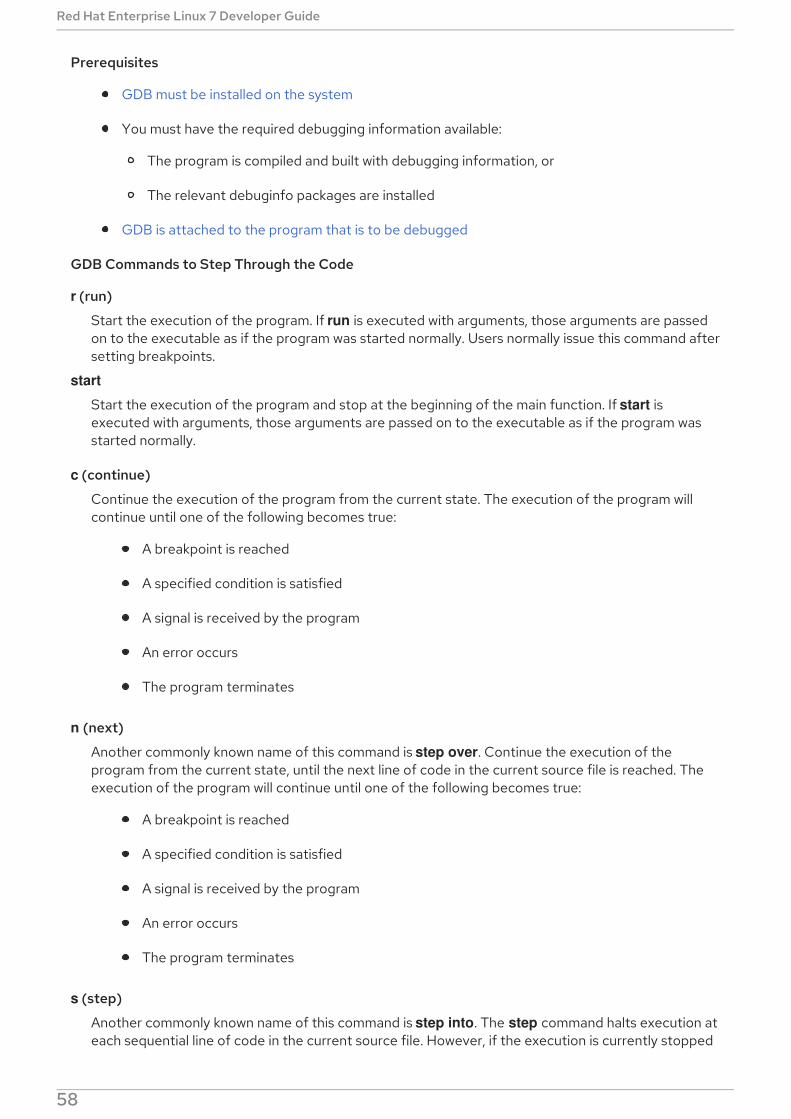
Prerequisites
GDB must be installed on the system
You must have the required debugging information available:
The program is compiled and built with debugging information, or
The relevant debuginfo packages are installed
GDB is attached to the program that is to be debugged
GDB Commands to Step Through the Code
r (run)
Start the execution of the program. If run is executed with arguments, those arguments are passedon to the executable as if the program was started normally. Users normally issue this command aftersetting breakpoints.
start
Start the execution of the program and stop at the beginning of the main function. If start isexecuted with arguments, those arguments are passed on to the executable as if the program wasstarted normally.
c (continue)
Continue the execution of the program from the current state. The execution of the program willcontinue until one of the following becomes true:
A breakpoint is reached
A specified condition is satisfied
A signal is received by the program
An error occurs
The program terminates
n (next)
Another commonly known name of this command is step over. Continue the execution of theprogram from the current state, until the next line of code in the current source file is reached. Theexecution of the program will continue until one of the following becomes true:
A breakpoint is reached
A specified condition is satisfied
A signal is received by the program
An error occurs
The program terminates
s (step)
Another commonly known name of this command is step into. The step command halts execution ateach sequential line of code in the current source file. However, if the execution is currently stopped
Red Hat Enterprise Linux 7 Developer Guide
58

at a source line containing a function call, GDB stops the execution after entering the function call(rather than executing it).
until location
Continue the execution until the code location specified by the location option is reached.
fini (finish)
Resume the execution of the program and halt when the execution returns from a function. Theexecution of the program will continue until one of the following becomes true:
A breakpoint is reached
A specified condition is satisfied
A signal is received by the program
An error occurs
The program terminates
q (quit)
Terminate the execution and exit GDB.
Additional Resources
Section 20.2.5, “Using GDB Breakpoints to Stop Execution at Defined Code Locations”
Debugging with GDB — 4.2 Starting your Program
Debugging with GDB — 5.2 Continuing and Stepping
20.2.4. Showing Program Internal Values with GDB
Displaying the values of the internal variables of a program is important for understanding what theprogram is doing. GDB offers multiple commands that you can use to inspect the internal variables. Thissection describes the most useful of these commands.
Prerequisites
Understanding of the GDB debugger
GDB Commands to Display the Internal State of a Program
p (print)
Displays the value of the argument given. Usually, the argument is the name of a variable of anycomplexity, from a simple single value to a structure. An argument can also be an expression valid inthe current language, including the use of program variables and library functions, or functionsdefined in the program being tested.It is possible to extend GDB with pretty-printer Python or Guile scripts for customized display of datastructures (such as classes, structs) using the print command.
bt (backtrace)
Display the chain of function calls used to reach the current execution point, or the chain of functionsused up until execution was signalled. This is useful for investigating serious bugs (such assegmentation faults) with elusive causes.Adding the full option to the backtrace command displays local variables, too.
CHAPTER 20. DEBUGGING A RUNNING APPLICATION
59

It is possible to extend GDB with frame filter Python scripts for customized display of data displayedusing the bt and info frame commands. The term frame refers to the data associated with a singlefunction call.
info
The info command is a generic command to provide information about various items. It takes anoption specifying the item.
The info args command displays arguments of the function call that is the currently selectedframe.
The info locals command displays local variables in the currently selected frame.
For a list of the possible items, run the command help info in a GDB session:
(gdb) help info
l (list)
Show the line in the source code where the program stopped. This command is available only whenthe program execution is stopped. While not strictly a command to show the internal state, list helpsthe user understand what changes to the internal state will happen in the next step of the program’sexecution.
Additional Resources
Red Hat Developer blog entry — The GDB Python API
Debugging with GDB — 10.9 Pretty Printing
20.2.5. Using GDB Breakpoints to Stop Execution at Defined Code Locations
In many cases, it is advantageous to let the program execute until a certain line of code is reached.
Prerequisites
Understanding of GDB
Using Breakpoints in GDBBreakpoints are markers that tell GDB to stop the execution of a program. Breakpoints are mostcommonly associated with source code lines: Placing a breakpoint requires specifying the source fileand line number.
To place a breakpoint:
Specify the name of the source code file and the line in that file:
(gdb) br file:line
When file is not present, the name of the source file at the current point of execution isused:
(gdb) br line
Alternatively, use a function name to place the breakpoint:
Red Hat Enterprise Linux 7 Developer Guide
60

(gdb) br function_name
A program might encounter an error after a certain number of iterations of a task. To specify anadditional condition to halt execution:
(gdb) br file:line if condition
Replace condition with a condition in the C or C++ language. The meaning of file and line is thesame as above.
To inspect the status of all breakpoints and watchpoints:
(gdb) info br
To remove a breakpoint by using its number as displayed in the output of info br:
(gdb) delete number
To remove a breakpoint at a given location:
(gdb) clear file:line
Additional Resources
Debugging with GDB — 5.1 Breakpoints, Watchpoints, and Catchpoints
20.2.6. Using GDB Watchpoints to Stop Execution on Data Access and Changes
In many cases, it is advantageous to let the program execute until certain data changes or is accessed.This section lists the most common watchpoints.
Prerequisites
Understanding of GDB
Using Watchpoints in GDBWatchpoints are markers which tell GDB to stop the execution of a program. Watchpoints areassociated with data: Placing a watchpoint requires specifying an expression describing a variable,multiple variables, or a memory address.
To place a watchpoint for data change (write):
(gdb) watch expression
Replace expression with an expression that describes what you want to watch. For variables,expression is equal to the name of the variable.
To place a watchpoint for data access (read):
(gdb) rwatch expression
To place a watchpoint for any data access (both read and write):
(gdb) awatch expression
CHAPTER 20. DEBUGGING A RUNNING APPLICATION
61

To inspect the status of all watchpoints and breakpoints:
(gdb) info br
To remove a watchpoint:
(gdb) delete num
Replace the num option with the number reported by the info br command.
Additional Resources
Debugging with GDB — 5.1.2 Setting Watchpoints
20.2.7. Debugging Forking or Threaded Programs with GDB
Some programs use forking or threads to achieve parallel code execution. Debugging multiplesimultaneous execution paths requires special considerations.
Prerequisites
Understanding of the GDB debugger
Understanding of the concepts of process forking and threads
Debugging Forked Programs with GDBForking is a situation when a program (parent) creates an independent copy of itself ( child). Use thefollowing settings and commands to affect the reaction of GDB to an occuring fork:
The follow-fork-mode setting controls whether GDB follows the parent or the child after thefork.
set follow-fork-mode parent
After forking, debug the parent process. This is the default.
set follow-fork-mode child
After forking, debug the child process.
show follow-fork-mode
Displays the current setting of the follow-fork-mode.
The set detach-on-fork setting controls whether the GDB keeps control of the other (notfollowed) process or leaves it to run.
set detach-on-fork on
The process which is not followed (depending on the value of the follow-fork-mode) isdetached and runs independently. This is the default.
set detach-on-fork off
GDB keeps control of both processes. The process which is followed (depending on thevalue of follow-fork-mode) is debugged as usual, while the other is suspended.
show detach-on-fork
Displays the current setting of detach-on-fork.
Debugging Threaded Programs with GDB
Red Hat Enterprise Linux 7 Developer Guide
62

GDB has the ability to debug individual threads, and to manipulate and examine them independently. Tomake GDB stop only the thread that is examined, use the commands set non-stop on and set target-async on. You can add these commands to the .gdbinit file. After that functionality is turned on, GDB isready to conduct thread debugging.
GDB uses the concept of current thread . By default, commands apply to the current thread only.
info threads
Displays a list of threads with their id and gid numbers, indicating the current thread.
thread id
Sets the thread with the specified id as the current thread.
thread apply ids command
Applies the command command to all threads listed by ids. The ids option is a space-separated listof thread ids. The special value all applies the command to all threads.
break location thread id if condition
Sets a breakpoint at a certain location with a certain condition only for the thread number id.
watch expression thread id
Sets a watchpoint defined by expression only for the thread number id.
command&
Executes the command command and returns immediately to the GDB prompt (gdb), continuingcode execution in the background.
interrupt
Halts execution in the background.
Additional Resources
Debugging with GDB — 4.10 Debugging Programs with Multiple Threads
Debugging with GDB — 4.11 Debugging Forks
20.3. RECORDING APPLICATION INTERACTIONS
The executable code of applications interacts with the code of the operating system and sharedlibraries. Recording an activity log of these interactions can provide enough insight into the application’sbehavior without debugging the actual application code. Alternatively, analyzing an application’sinteractions can help to pinpoint the conditions in which a bug manifests.
20.3.1. Useful Tools for Recording Application Interactions
Red Hat Enterprise Linux offers multiple tools for analyzing an application’s interactions.
strace
The strace tool enables the tracing of (and tampering with) interactions between an application andthe Linux kernel: system calls, signal deliveries, and changes of process state.
The strace output is detailed and explains the calls well, because strace interpretsparameters and results with knowledge of the underlying kernel code. Numbers are turnedinto the respective constant names, bitwise combined flags expanded to flag lists, pointersto character arrays dereferenced to provide the actual string, and more. Support for morerecent kernel features may be lacking, however.
CHAPTER 20. DEBUGGING A RUNNING APPLICATION
63

The use of strace does not require any particular setup except for setting up the log filter.
Tracing the application code with strace may result in significant slowdown of theapplication’s execution. As a result, strace is not suitable for many production deployments.As an alternative, consider using SystemTap in such cases.
You can limit the list of traced system calls and signals to reduce the amount of captureddata.
strace captures only kernel-userspace interactions and does not trace library calls, forexample. Consider using ltrace for tracing library calls.
ltrace
The ltrace tool enables logging of an application’s user space calls into shared objects (dynamiclibraries).
ltrace enables tracing calls to any library.
You can filter the traced calls to reduce the amount of captured data.
The use of ltrace does not require any particular setup except for setting up the log filter.
ltrace is lightweight and fast, offering an alternative to strace: it is possible to trace therespective interfaces in libraries such as glibc with ltrace instead of tracing kernel functionswith strace. Note however that ltrace may be less precise at syscall tracing.
ltrace is able to decode parameters only for a limited set of library calls: the calls whoseprototypes are defined in the relevant configuration files. As part of the ltrace package,prototypes for some libacl, libc, and libm calls and system calls are provided. The ltraceoutput mostly contains only raw numbers and pointers. The interpretation of ltrace outputusually requires consulting the actual interface declarations of the libraries present in theoutput.
SystemTap
SystemTap is an instrumentation platform for probing running processes and kernel activity on theLinux system. SystemTap uses its own scripting language for programming custom event handlers.
Compared to using strace and ltrace, scripting the logging means more work in the initialsetup phase. However, the scripting capabilities extend SystemTap’s usefulness beyond justproducing logs.
SystemTap works by creating and inserting a kernel module. The use of SystemTap isefficient and does not create a significant slowdown of the system or application executionon its own.
SystemTap comes with a set of usage examples.
GDB
The GNU Debugger is primarily meant for debugging, not logging. However, some of its featuresmake it useful even in the scenario where an application’s interaction is the primary activity ofinterest.
With GDB, it is possible to conveniently combine the capture of an interaction event withimmediate debugging of the subsequent execution path.
GDB is best suited for analyzing responses to infrequent or singular events, after the initial
Red Hat Enterprise Linux 7 Developer Guide
64

GDB is best suited for analyzing responses to infrequent or singular events, after the initialidentification of problematic situations by other tools. Using GDB in any scenario withfrequent events becomes inefficient or even impossible.
Additional Resources
Red Hat Enterprise Linux SystemTap Beginners Guide
Red Hat Developer Toolset User Guide
20.3.2. Monitoring an Application’s System Calls with strace
The strace tool enables tracing of (and optional tampering with) interactions between an applicationand the Linux kernel: system calls, signal deliveries, and changes of process state.
Prerequisites
strace is installed on the system
To install strace, run as root:
# yum install strace
ProcedureNote that the tracing specification syntax of strace offers regular expressions and syscall classes to helpwith the identification of system calls.
1. Run or attach to the process you wish to monitor.
If the program you want to monitor is not running, start strace and specify the program:
$ strace -fvttTyy -s 256 -e trace=call program
Options used in the example above are not mandatory. Use when needed:
The -f option is an acronym for "follow forks". This option traces children created by thefork, vfork, and clone system calls.
The -v or -e abbrev=none option disables abbreviation of output, omitting variousstructure fields.
The -tt option is a variant of the -t option that prefixes each line with an absolutetimestamp. With the -tt option, the time printed includes microseconds.
The -T option prints the amount of time spent in each system call at the end of the line.
The -yy option is a variant of the -y option that enables printing of paths associated withfile descriptor numbers. The -yy option prints not only paths, but also protocol-specificinformation associated with socket file descriptors and block or character devicenumber associated with device file descriptors.
The -s option controls the maximum string size to be printed. Note that filenames arenot considered strings and are always printed in full.
-e trace controls the set of system calls to trace.
Replace call with a comma-separated list of system calls to be displayed. If call is left,
CHAPTER 20. DEBUGGING A RUNNING APPLICATION
65

Replace call with a comma-separated list of system calls to be displayed. If call is left, strace will display all system calls. Shorthands for some groups of system calls areprovided in the strace(1) manual page.
If the program is already running, find its process ID (pid) and attach strace to it:
$ ps -C program(...)$ strace -fvttTyy -s 256 -e trace=call -ppid
If you do not wish to trace any forked processes or threads, do not use the -f option.
2. strace displays the system calls made by the application and their details.In most cases, an application and its libraries make a large number of calls and strace outputappears immediately, if no filter for system calls is set.
3. strace exits when all the traced processes exit. To terminate the monitoring before the tracedprogram exits, press Ctrl+C.
If strace started the program, it will send the terminating signal (SIGINT, in this case) to theprogram being started. Note, however, that program, in turn, may ignore that signal.
If you attached strace to an already running program, the program terminates togetherwith strace.
4. Analyze the list of system calls done by the application.
Problems with resource access or availability are present in the log as calls returning errors.
Values passed to the system calls and patterns of call sequences provide insight into thecauses of the application’s behaviour.
If the application crashes, the important information is probably at the end of the log.
The output contains a lot of extra information. However, you can construct a more precisefilter and repeat the procedure.
Notes
It is advantageous to both see the output and save it to a file. To do this, run the tee command:
$ strace ...-o |tee your_log_file.log>&2
To see separate output that corresponds to different processes, run:
$ strace ... -ff -o your_log_file
Output for a process with the process ID (pid) will be stored in your_log_file.pid.
Additional Resources
The strace(1) manual page.
Knowledgebase article — How do I use strace to trace system calls made by a command?
Red Hat Developer Toolset User Guide — strace
Red Hat Enterprise Linux 7 Developer Guide
66

20.3.3. Monitoring the Application’s Library Function Calls with ltrace
The ltrace tool enables monitoring of the calls done by an application to functions available in libraries(shared objects).
Prerequisites
ltrace is installed on the system
Procedure
1. Identify the libraries and functions of interest, if possible.
2. If the program you want to monitor is not running, start ltrace and specify program:
$ ltrace -f -l library -e function program
Use the options -e and -l to filter the output:
Supply the function names to be displayed as function. The -e function option can be usedmultiple times. If left out, ltrace will display calls to all functions.
Instead of specifying functions, you can specify whole libraries with the -l library option.This option behaves similarly to the -e function option.
See the ltrace(1)_ manual page for more information.
If the program is already running, find its process id (pid) and attach ltrace to it:
$ ps -C program(...)$ ltrace ... -ppid
If you do not wish to trace any forked processes or threads, leave out the -f option.
3. ltrace displays the library calls made by the application.In most cases, an application will make a large number of calls and ltrace output will appearimmediately if no filter is set.
4. ltrace exits when the program exits.To terminate the monitoring before the traced program exits, press ctrl+C.
If ltrace started the program, the program terminates together with ltrace.
If you attached ltrace to an already running program, the program terminates together withltrace.
5. Analyze the list of library calls done by the application.
If the application crashes, the important information is probably at the end of the log.
The output contains a lot of unnecessary information. However, you can construct a moreprecise filter and repeat the procedure.
NOTE
CHAPTER 20. DEBUGGING A RUNNING APPLICATION
67

NOTE
It is advantageous to both see the output and save it to a file. Use the tee command toachieve this:
$ ltrace ... |& tee your_log_file.log
Additional Resources
The strace(1) manual page
Red Hat Developer Toolset User Guide — ltrace
20.3.4. Monitoring the Application’s System Calls with SystemTap
The SystemTap tool enables registering custom event handlers for kernel events. In comparison withstrace, it is harder to use, but SystemTap is more efficient and enables more complicated processinglogic.
Prerequisites
SystemTap is installed on the system
Procedure
1. Create a file my_script.stp with the contents:
probe begin{ printf("waiting for syscalls of process %d \n", target())}
probe syscall.*{ if (pid() == target()) printf("%s(%s)\n", name, argstr)}
probe process.end{ if (pid() == target()) exit()}
2. Find the process ID (pid) of the process you wish to monitor:
$ ps -aux
3. Run SystemTap with the script:
# stap my_script.stp -x pid
The value of pid is the process id.
The script is compiled to a kernel module which is then loaded. This introduces a slight delay
Red Hat Enterprise Linux 7 Developer Guide
68

The script is compiled to a kernel module which is then loaded. This introduces a slight delaybetween entering the command and getting the output.
4. When the process performs a system call, the call name and its parameters are printed to theterminal.
5. The script exits when the process terminates, or when you press Ctrl+C.
Additional Resources
SystemTap Beginners Guide
SystemTap Tapset Reference
A larger SystemTap script, which approximates strace functionality, is available as /usr/share/systemtap/examples/process/strace.stp. To run the script:# stap --example strace.stp -x pid
or
# stap --example strace.stp -c "cmd args … "
20.3.5. Using GDB to Intercept Application System Calls
GDB enables stopping the execution in various kinds of situations arising during the execution of aprogram. To stop the execution when the program performs a system call, use a GDB catchpoint.
Prerequisites
Understanding of GDB breakpoints
GDB is attached to the program
Stopping Program Execution on System Calls with GDB
1. Set the catchpoint:
(gdb) catch syscall syscall-name
The command catch syscall sets a special type of breakpoint that halts execution when asystem call is performed by the program.
The syscall-name option specifies the name of the call. You can specify multiple catchpointsfor various system calls. Leaving out the syscall-name option causes GDB to stop on anysystem call.
2. If the program has not started execution, start it:
(gdb) r
If the program execution is only halted, resume it:
(gdb) c
3. GDB halts the execution after any specified system call is performed by the program.
CHAPTER 20. DEBUGGING A RUNNING APPLICATION
69

Additional Resources
Section 20.2.4, “Showing Program Internal Values with GDB”
Section 20.2.3, “Stepping through Program Code with GDB”
Debugging with GDB — 5.1.3 Setting Catchpoints
20.3.6. Using GDB to Intercept the Handling of Signals by Applications
GDB enables stopping the execution in various kinds of situations arising during the execution of aprogram. To stop the execution when the program receives a signal from the operating system, use aGDB catchpoint.
Prerequisites
Understanding of GDB breakpoints
GDB is attached to the program
Stopping the Program Execution on Receiving a Signal with GDB
1. Set the catchpoint:
(gdb) catch signal signal-type
The command catch signal sets a special type of breakpoint that halts execution when a signalis received by the program. The signal-type option specifies the type of the signal. Use thespecial value 'all' to catch all the signals.
2. If the program has not started execution, start it:
(gdb) r
If the program execution is only halted, resume it:
(gdb) c
3. GDB halts the execution after the program receives any specified signal.
Additional Resources
Section 20.2.4, “Showing Program Internal Values with GDB”
Section 20.2.3, “Stepping through Program Code with GDB”
Debugging With GDB — 5.3.1 Setting Catchpoints
Red Hat Enterprise Linux 7 Developer Guide
70

CHAPTER 21. DEBUGGING A CRASHED APPLICATIONSometimes, it is not possible to debug an application directly. In these situations, you can collectinformation about the application at the moment of its termination and analyze it afterwards.
21.1. CORE DUMPS
This section describes what a core dump is and how to use it.
Prerequisites
Understanding of debugging information
DescriptionA core dump is a copy of a part of the application’s memory at the moment the application stoppedworking, stored in the ELF format. It contains all the application’s internal variables and stack, whichenables inspection of the application’s final state. When augmented with the respective executable fileand debugging information, it is possible to analyze a core dump file with a debugger in a way similar toanalyzing a running program.
The Linux operating system kernel can record core dumps automatically, if this functionality is enabled.Alternatively, you can send a signal to any running application to generate a core dump regardless of itsactual state.
WARNING
Some limits might affect the ability to generate a core dump.
21.2. RECORDING APPLICATION CRASHES WITH CORE DUMPS
To record application crashes, set up core dump saving and add information about the system.
Procedure
1. Enable core dumps. Edit the file /etc/systemd/system.conf and change the line containing DefaultLimitCORE to the following:
DefaultLimitCORE=infinity
2. Reboot the system:
# shutdown -r now
3. Remove the limits for core dump sizes:
# ulimit -c unlimited
To reverse this change, run the command with the value 0 instead of unlimited.
4. When an application crashes, a core dump is generated. The default location for core dumps is
CHAPTER 21. DEBUGGING A CRASHED APPLICATION
71

4. When an application crashes, a core dump is generated. The default location for core dumps isthe application’s working directory at the time of the crash.
5. Create an SOS report to provide additional information about the system:
# sosreport
This creates a tar archive containing information about your system, such as copies ofconfiguration files.
6. Transfer the core dump and the SOS report to the computer where the debugging will takeplace. Transfer the executable file, too, if it is known.
IMPORTANT
If the executable file is not known, subsequent analysis of the core file willidentify it.
7. Optional: Remove the core dump and SOS report after transferring them to free up disk space.
Additional Resources
Knowledgebase article — How to enable core file dumps when an application crashes orsegmentation faults
Knowledgebase article — What is a sosreport and how to create one in Red Hat Enterprise Linux4.6 and later?
21.3. INSPECTING APPLICATION CRASH STATES WITH CORE DUMPS
Prerequisites
You have a core dump file and SOS report
GDB and elfutils are installed on the system
Procedure
1. To identify the executable file where the crash occurred, run the eu-unstrip command with thecore dump file:
$ eu-unstrip -n --core=./core.98140x400000+0x207000 2818b2009547f780a5639c904cded443e564973e@0x400284 /usr/bin/sleep /usr/lib/debug/bin/sleep.debug [exe]0x7fff26fff000+0x1000 1e2a683b7d877576970e4275d41a6aaec280795e@0x7fff26fff340 . - linux-vdso.so.10x35e7e00000+0x3b6000 374add1ead31ccb449779bc7ee7877de3377e5ad@0x35e7e00280 /usr/lib64/libc-2.14.90.so /usr/lib/debug/lib64/libc-2.14.90.so.debug libc.so.60x35e7a00000+0x224000 3ed9e61c2b7e707ce244816335776afa2ad0307d@0x35e7a001d8 /usr/lib64/ld-2.14.90.so /usr/lib/debug/lib64/ld-2.14.90.so.debug ld-linux-x86-64.so.2
The output contains details for each module on one line, separated by spaces. The informationis listed in this order:
Red Hat Enterprise Linux 7 Developer Guide
72

1. The memory address where the module was mapped
2. The build-id of the module and where in the memory it was found
3. The module’s executable file name, displayed as - when unknown, or as . when the modulehas not been loaded from a file
4. The source of debugging information, displayed as a file name when available, as . whencontained in the executable file itself, or as - when not present at all
5. The shared library name (soname), or [exe] for the main module
In this example, the important details are the file name /usr/bin/sleep and the build-id 2818b2009547f780a5639c904cded443e564973e on the line containing the text [exe]. With thisinformation, you can identify the executable file required for analyzing the core dump.
2. Get the executable file that crashed.
If possible, copy it from the system where the crash occurred. Use the file name extractedfrom the core file.
Alternatively, use an identical executable file on your system. Each executable file built onRed Hat Enterprise Linux contains a note with a unique build-id value. Determine the build-id of the relevant locally available executable files:
$ eu-readelf -n executable_file
Use this information to match the executable file on the remote system with your localcopy. The build-id of the local file and build-id listed in the core dump must match.
Finally, if the application is installed from an RPM package, you can get the executable filefrom the package. Use the sosreport output to find the exact version of the packagerequired.
3. Get the shared libraries used by the executable file. Use the same steps as for the executablefile.
4. If the application is distributed as a package, load the executable file in GDB to display hints formissing debuginfo packages. For more details, see Section 20.1.4, “Getting debuginfo Packagesfor an Application or Library using GDB”.
5. To examine the core file in detail, load the executable file and core dump file with GDB:
$ gdb -e executable_file -c core_file
Further messages about missing files and debugging information help you to identify what ismissing for the debugging session. Return to the previous step if needed.
If the debugging information is available as a file instead of a package, load this file in GDB withthe symbol-file command:
(gdb) symbol-file program.debug
Replace program.debug with the actual file name.
NOTE
CHAPTER 21. DEBUGGING A CRASHED APPLICATION
73

NOTE
It might not be necessary to install the debugging information for all executablefiles contained in the core dump. Most of these executable files are libraries usedby the application code. These libraries might not directly contribute to theproblem you are analyzing, and you do not need to include debugging informationfor them.
6. Use the GDB commands to inspect the state of the application at the moment it crashed. SeeSection 20.2, “Inspecting the Application’s Internal State with GDB” .
NOTE
When analyzing a core file, GDB is not attached to a running process. Commandsfor controlling execution have no effect.
Additional Resources
Debugging with GDB — 2.1.1 Choosing Files
Debugging with GDB — 18.1 Commands to Specify Files
Debugging with GDB — 18.3 Debugging Information in Separate Files
21.4. DUMPING PROCESS MEMORY WITH GCORE
The workflow of core dump debugging enables the analysis of the offline state of the program. In somecases it is advantageous to use this workflow with a program that is still running, such as when it is hardto access the environment with the process. You can use the gcore command to dump memory of anyprocess while it is still running.
Prerequisites
Understanding of core dumps
GDB is installed on the system
ProcedureTo dump a process memory using gcore:
1. Find out the process id (pid). Use tools such as ps, pgrep, and top:
$ ps -C some-program
2. Dump the memory of this process:
$ gcore -o filename pid
This creates a file filename and dumps the process memory in it. While the memory is beingdumped, the execution of the process is halted.
3. After the core dump is finished, the process resumes normal execution.
4. Create an SOS report to provide additional information about the system:
Red Hat Enterprise Linux 7 Developer Guide
74

# sosreport
This creates a tar archive containing information about your system, such as copies ofconfiguration files.
5. Transfer the program’s executable file, core dump, and the SOS report to the computer wherethe debugging will take place.
6. Optional: Remove the core dump and SOS report after transferring them to reclaim disk space.
Additional resources
Knowledgebase article — How to obtain a core file without restarting an application?
21.5. DUMPING PROTECTED PROCESS MEMORY WITH GDB
You can mark the memory of processes as not to be dumped. This can save resources and ensureadditional security if the process memory contains sensitive data. Both kernel core dumps (kdump) andmanual core dumps (gcore, GDB) do not dump memory marked this way.
In some cases, it is necessary to dump the whole contents of the process memory regardless of theseprotections. This procedure shows how to do this using the GDB debugger.
Prerequisites
Understanding of core dumps
GDB is installed on the system
GDB is attached to the process with protected memory
Procedure
1. Set GDB to ignore the settings in the /proc/PID/coredump_filter file:
(gdb) set use-coredump-filter off
2. Set GDB to ignore the memory page flag VM_DONTDUMP:
(gdb) set dump-excluded-mappings on
3. Dump the memory:
(gdb) gcore core-file
Replace core-file with the name of the file of which you want to dump the memory.
Additional Resources
Debugging with GDB — 10.19 How to Produce a Core File from Your Program
CHAPTER 21. DEBUGGING A CRASHED APPLICATION
75

PART VI. MONITORING PERFORMANCE
Developers profile programs to focus attention on the areas of the program that have the largestimpact on performance. The types of data collected include what section of the program consumes themost processor time, and where memory is allocated. Profiling collects data from the actual programexecution. Thus, the quality of the data collected is influenced by the actual tasks being performed bythe program. The tasks performed during profiling should be representative of actual use; this ensuresthat problems arising from realistic use of the program are addressed during development.
Red Hat Enterprise Linux includes a number of different tools (Valgrind, OProfile, perf, andSystemTap) to collect profiling data. Each tool is suitable for performing specific types of profile runs,as described in the following sections.
Red Hat Enterprise Linux 7 Developer Guide
76

CHAPTER 22. VALGRINDValgrind is an instrumentation framework for building dynamic analysis tools that can be used to profileapplications in detail. The default installation already provides five standard tools. Valgrind tools aregenerally used to investigate memory management and threading problems. Valgrind providesinstrumentation for user-space binaries to check for errors, such as the use of uninitialized memory,improper allocation/freeing of memory, and improper arguments for system calls. Its profiling tools canbe used on most binaries; however, compared to other profilers, Valgrind profile runs are significantlyslower. To profile a binary, Valgrind runs it inside a special virtual machine, which allows Valgrind tointercept all of the binary instructions. Valgrind's tools are most useful for looking for memory-relatedissues in user-space programs; it is not suitable for debugging time-specific issues or kernel-spaceinstrumentation and debugging.
Valgrind reports are most useful and accurate when debuginfo packages are installed for the programsor libraries under investigation. See Section 20.1, “Enabling Debugging with Debugging Information” .
22.1. VALGRIND TOOLS
The Valgrind suite is composed of the following tools:
memcheck
This tool detects memory management problems in programs:
By checking all reads from and writes to memory
By intercepting memory manipulations like calls to malloc, free, new or delete
memcheck is perhaps the most used Valgrind tool, as memory management problems can bedifficult to detect using other means. Such problems often remain undetected for long periods,eventually causing crashes that are difficult to diagnose.
memcheck functions as the default tool when no specific tool is selected.
cachegrind
cachegrind is a cache profiler that accurately pinpoints sources of cache misses in code byperforming a detailed simulation of the I1, D1 and L2 caches in the CPU. It shows the number of cachemisses, memory references, and instructions accruing to each line of source code; cachegrind alsoprovides per-function, per-module, and whole-program summaries, and can even show counts foreach individual machine instructions.
callgrind
Like cachegrind, callgrind can model cache behavior. However, the main purpose of callgrind is torecord callgraphs data for the executed code.
massif
massif is a heap profiler; it measures how much heap memory a program uses, providing informationon heap blocks, heap administration overheads, and stack sizes. Heap profilers are useful in findingways to reduce heap memory usage. On systems that use virtual memory, programs with optimizedheap memory usage are less likely to run out of memory, and may be faster as they require lesspaging.
helgrind
In programs that use the POSIX pthreads threading primitives, helgrind detects synchronizationerrors. Such errors are:
CHAPTER 22. VALGRIND
77

Misuses of the POSIX pthreads API
Potential deadlocks arising from lock ordering problems
Data races (that is, accessing memory without adequate locking)
22.2. USING VALGRIND
The valgrind package and its dependencies install all the necessary tools for performing a Valgrindprofile run. To profile a program with Valgrind, use:
$ valgrind --tool=toolname program
See Section 22.1, “Valgrind Tools” for a list of arguments for toolname. In addition to the suite ofValgrind tools, none is also a valid argument for toolname; this argument allows you to run a programunder Valgrind without performing any profiling. This is useful for debugging or benchmarking Valgrinditself.
You can also instruct Valgrind to send all of its information to a specific file. To do so, use the option --log-file=filename. For example, to check the memory usage of the executable file hello and sendprofile information to output, use:
$ valgrind --tool=memcheck --log-file=output hello
See Section 22.3, “Additional information” for more information on Valgrind, along with other availabledocumentation on the Valgrind suite of tools.
22.3. ADDITIONAL INFORMATION
For more extensive information on Valgrind, see man valgrind. Red Hat Enterprise Linux also providesa comprehensive Valgrind Documentation book available as PDF and HTML in:
/usr/share/doc/valgrind-version/valgrind_manual.pdf
/usr/share/doc/valgrind-version/html/index.html
Red Hat Enterprise Linux 7 Developer Guide
78

CHAPTER 23. OPROFILEOProfile is a low overhead, system-wide performance monitoring tool provided by the oprofilepackage. It uses performance monitoring hardware on the system’s processor to retrieve informationabout the kernel and executables on the system, such as when memory is referenced, the number ofsecond-level cache requests, and the number of hardware interrupts received. OProfile is also able toprofile applications that run in a Java Virtual Machine (JVM).
The following is a selection of the tools provided by OProfile:
ophelp
Displays available events for the system’s processor along with a brief description of each event.
operf
The main profiling tool. The operf tool uses the Linux Performance Events subsystem, which allowsOProfile to operate alongside other tools using performance monitoring hardware of your system.Unlike the previously used opcontrol tool, no initial setup is required, and it can be used without rootprivileges unless the --system-wide option is used.
ocount
A tool for counting the absolute number of event occurrences. It can count events on the wholesystem, per process, per CPU, or per thread.
opimport
Converts sample database files from a foreign binary format to the native format for the system.Only use this option when analyzing a sample database from a different architecture.
opannotate
Creates an annotated source for an executable if the application was compiled with debuggingsymbols.
opreport
Reads the recorded performance data and generates a summary as specified by the profilespecification. It is possible to generate different reports from the same profile data using differentprofile specifications.
23.1. USING OPROFILE
operf is the recommended tool for collecting profiling data. The tool does not require any initialconfiguration, and all options are passed to it on the command line. Unlike the legacy opcontrol tool, operf can run without root privileges. See the Using operf chapter in the System Administrator’s Guidefor detailed instructions on how to use the operf tool.
Example 23.1. Using ocount
The following example shows counting the amount of events with ocount during execution of the sleep utility:
$ ocount -e INST_RETIRED -- sleep 1
Events were actively counted for 1.0 seconds.
CHAPTER 23. OPROFILE
79

Event counts (actual) for /bin/sleep:Event Count % time countedINST_RETIRED 683,011 100.00
NOTE
The events are processor implementation specific. It might be necessary to set theoption perf_event_paranoid or limit the counts to only user-space events.
Example 23.2. Basic operf usage
In the following example, the operf tool is used to collect profiling data from the ls -l ~ command.
1. Install debugging information for the ls command:
# debuginfo-install -y coreutils
2. Run the profiling:
$ operf ls -l ~Profiling done.
3. Analyze the collected data:
$ opreport --symbolsCPU: Intel Skylake microarchitecture, speed 3.4e+06 MHz (estimated)Counted cpu_clk_unhalted events () with a unit mask of 0x00 (Core cycles when at least one thread on the physical core is not in halt state) count 100000samples % image name symbol name161 81.3131 no-vmlinux /no-vmlinux3 1.5152 libc-2.17.so get_next_seq3 1.5152 libc-2.17.so strcoll_l2 1.0101 ld-2.17.so _dl_fixup2 1.0101 ld-2.17.so _dl_lookup_symbol_x[...]
Example 23.3. Using operf to Profile a Java Program
In the following example, the operf tool is used to collect profiling data from a Java (JIT) program,and the opreport tool is then used to output per-symbol data.
1. Install the demonstration Java program used in this example. It is a part of the java-1.8.0-openjdk-demo package, which is included in the Optional channel. See Adding the Optionaland Supplementary Repositories for instructions on how to use the Optional channel. Whenthe Optional channel is enabled, install the package:
# yum install java-1.8.0-openjdk-demo
2. Install the oprofile-jit package for OProfile to be able to collect profiling data from Javaprograms:
Red Hat Enterprise Linux 7 Developer Guide
80

# yum install oprofile-jit
3. Create a directory for OProfile data:
$ mkdir ~/oprofile_data
4. Change into the directory with the demonstration program:
$ cd /usr/lib/jvm/java-1.8.0-openjdk/demo/applets/MoleculeViewer/
5. Start the profiling:
$ operf -d ~/oprofile_data appletviewer \-J"-agentpath:/usr/lib64/oprofile/libjvmti_oprofile.so" example2.html
6. Change into the home directory and analyze the collected data:
$ cd
$ opreport --symbols --threshold 0.5
A sample output may look like the following:
$ opreport --symbols --threshold 0.5Using /home/rkratky/oprofile_data/samples/ for samples directory.CPU: Intel Ivy Bridge microarchitecture, speed 3600 MHz (estimated)Counted CPU_CLK_UNHALTED events (Clock cycles when not halted) with a unit mask of 0x00 (No unit mask) count 100000samples % image name symbol name14270 57.1257 libjvm.so /usr/lib/jvm/java-1.8.0-openjdk-1.8.0.51-1.b16.el7_1.x86_64/jre/lib/amd64/server/libjvm.so3537 14.1593 23719.jo Interpreter690 2.7622 libc-2.17.so fgetc581 2.3259 libX11.so.6.3.0 /usr/lib64/libX11.so.6.3.0364 1.4572 libpthread-2.17.so pthread_getspecific130 0.5204 libfreetype.so.6.10.0 /usr/lib64/libfreetype.so.6.10.0128 0.5124 libc-2.17.so __memset_sse2
23.2. OPROFILE DOCUMENTATION
For more extensive information on OProfile, see the oprofile(1) manual page. Red Hat Enterprise Linuxalso provides two comprehensive guides to OProfile in file:///usr/share/doc/oprofile-version/:
OProfile Manual
A comprehensive manual with detailed instructions on the setup and use of OProfile is available at file:///usr/share/doc/oprofile-version/oprofile.html
OProfile Internals
Documentation on the internal workings of OProfile, useful for programmers interested incontributing to the OProfile upstream, can be found at file:///usr/share/doc/oprofile-version/internals.html
CHAPTER 23. OPROFILE
81

CHAPTER 24. SYSTEMTAPSystemTap is a useful instrumentation platform for probing running processes and kernel activity on theLinux system. To execute a probe:
1. Write SystemTap scripts that specify which system events (for example, virtual file systemreads, packet transmissions) should trigger specified actions (for example, print, parse, orotherwise manipulate data).
2. SystemTap translates the script into a C program, which it compiles into a kernel module.
3. SystemTap loads the kernel module to perform the actual probe.
SystemTap scripts are useful for monitoring system operation and diagnosing system issues withminimal intrusion into the normal operation of the system. You can quickly instrument running systemtest hypotheses without having to recompile and re-install instrumented code. To compile a SystemTapscript that probes kernel-space, SystemTap uses information from three different kernel informationpackages:
kernel-variant-devel-version
kernel-variant-debuginfo-version
kernel-debuginfo-common-arch-version
These kernel information packages must match the kernel to be probed. In addition, to compileSystemTap scripts for multiple kernels, the kernel information packages of each kernel must also beinstalled.
24.1. ADDITIONAL INFORMATION
For more detailed information about SystemTap, see the following Red Hat documentation:
SystemTap Beginner’s Guide
SystemTap Tapset Reference
Red Hat Enterprise Linux 7 Developer Guide
82

CHAPTER 25. PERFORMANCE COUNTERS FOR LINUX (PCL)TOOLS AND PERF
Performance Counters for Linux (PCL) is a kernel-based subsystem that provides a framework forcollecting and analyzing performance data. Red Hat Enterprise Linux 7 includes this kernel subsystem tocollect data and the user-space tool perf to analyze the collected performance data. The PCLsubsystem can be used to measure hardware events, including retired instructions and processor clockcycles. It can also measure software events, including major page faults and context switches. Forexample, PCL counters can compute Instructions Per Clock (IPC) from a process’s counts of instructionsretired and processor clock cycles. A low IPC ratio indicates the code makes poor use of CPU. Otherhardware events can also be used to diagnose poor CPU performance.
Performance counters can also be configured to record samples. The relative amount of samples can beused to identify which regions of code have the greatest impact on performance.
25.1. PERF TOOL COMMANDS
Useful perf commands include the following:
perf stat
This perf command provides overall statistics for common performance events, includinginstructions executed and clock cycles consumed. Options allow the selection of events other thanthe default measurement events.
perf record
This perf command records performance data into a file which can be later analyzed using perf report.
perf report
This perf command reads the performance data from a file and analyzes the recorded data.
perf list
This perf command lists the events available on a particular machine. These events will vary based onperformance monitoring hardware and software configuration of the system.
Use perf help to obtain a complete list of perf commands. To retrieve man page information on each perf command, use perf help command.
25.2. USING PERF
Using the basic PCL infrastructure for collecting statistics or samples of program execution is relativelystraightforward. This section provides simple examples of overall statistics and sampling.
To collect statistics on make and its children, use the following command:
# perf stat -- make all
The perf command collects a number of different hardware and software counters. It then prints thefollowing information:
Performance counter stats for 'make all':
244011.782059 task-clock-msecs # 0.925 CPUs 53328 context-switches # 0.000 M/sec
CHAPTER 25. PERFORMANCE COUNTERS FOR LINUX (PCL) TOOLS AND PERF
83

515 CPU-migrations # 0.000 M/sec 1843121 page-faults # 0.008 M/sec 789702529782 cycles # 3236.330 M/sec 1050912611378 instructions # 1.331 IPC 275538938708 branches # 1129.203 M/sec 2888756216 branch-misses # 1.048 % 4343060367 cache-references # 17.799 M/sec 428257037 cache-misses # 1.755 M/sec
263.779192511 seconds time elapsed
The perf tool can also record samples. For example, to record data on the make command and itschildren, use:
# perf record -- make all
This prints out the file in which the samples are stored, along with the number of samples collected:
[ perf record: Woken up 42 times to write data ][ perf record: Captured and wrote 9.753 MB perf.data (~426109 samples) ]
Performance Counters for Linux (PCL) Tools conflict with OProfile
Both OProfile and Performance Counters for Linux (PCL) use the same hardware PerformanceMonitoring Unit (PMU). If OProfile is running while attempting to use the PCL perf command, an errormessage like the following occurs when starting OProfile:
Error: open_counter returned with 16 (Device or resource busy). /usr/bin/dmesg may provide additional information.
Fatal: Not all events could be opened.
To use the perf command, first shut down OProfile:
# opcontrol --deinit
You can then analyze perf.data to determine the relative frequency of samples. The report outputincludes the command, object, and function for the samples. Use perf report to output an analysis of perf.data. For example, the following command produces a report of the executable that consumes themost time:
# perf report --sort=comm
The resulting output:
# Samples: 1083783860000## Overhead Command# ........ ...............# 48.19% xsltproc 44.48% pdfxmltex 6.01% make 0.95% perl
Red Hat Enterprise Linux 7 Developer Guide
84

0.17% kernel-doc 0.05% xmllint 0.05% cc1 0.03% cp 0.01% xmlto 0.01% sh 0.01% docproc 0.01% ld 0.01% gcc 0.00% rm 0.00% sed 0.00% git-diff-files 0.00% bash 0.00% git-diff-index
The column on the left shows the relative amount of samples. This output shows that make spends mostof this time in xsltproc and pdfxmltex. To reduce the time for make to complete, focus on xsltprocand pdfxmltex. To list functions executed by xsltproc, run:
# perf report -n --comm=xsltproc
This generates:
comm: xsltproc# Samples: 472520675377## Overhead Samples Shared Object Symbol# ........ .......... ............................. ......# 45.54%215179861044 libxml2.so.2.7.6 [.] xmlXPathCmpNodesExt 11.63%54959620202 libxml2.so.2.7.6 [.] xmlXPathNodeSetAdd__internal_alias 8.60%40634845107 libxml2.so.2.7.6 [.] xmlXPathCompOpEval 4.63%21864091080 libxml2.so.2.7.6 [.] xmlXPathReleaseObject 2.73%12919672281 libxml2.so.2.7.6 [.] xmlXPathNodeSetSort__internal_alias 2.60%12271959697 libxml2.so.2.7.6 [.] valuePop 2.41%11379910918 libxml2.so.2.7.6 [.] xmlXPathIsNaN__internal_alias 2.19%10340901937 libxml2.so.2.7.6 [.] valuePush__internal_alias
CHAPTER 25. PERFORMANCE COUNTERS FOR LINUX (PCL) TOOLS AND PERF
85

APPENDIX A. REVISION HISTORYRevision 7-6.1, Tue Oct 30 2018, Vladimír Slávik
Build for 7.6 GA release.
Revision 7-6, Tue Aug 21 2018, Vladimír Slávik
Build for 7.6 Beta release.
Revision 7-5.1, Tue Apr 10 2018, Vladimír Slávik
Build for the 7.5 GA release.
Revision 7-5, Tue Jan 9 2018, Vladimír Slávik
Published preview of new book version for 7.5 Beta
Revision 7-4.1, Tue Aug 22 2017, Vladimír Slávik
Update for new releases of linked products.
Revision 7-4, Wed Jul 26 2017, Vladimír Slávik
Build for 7.4 GA release. New chapter about setting up a workstation for development.
Revision 1-12, Fri May 26 2017, Vladimír Slávik
Update to remove outdated information.
Revision 7-3.9, Mon May 15 2017, Robert Krátký
Build for 7.4 Beta release.
Red Hat Enterprise Linux 7 Developer Guide
86