recurrent connections between amazon and atlantic forests ... · original article recurrent...
TRANSCRIPT

ORIGINALARTICLE
Recurrent connections between Amazonand Atlantic forests shaped diversity inCaatinga four-eyed frogsMaria Tereza C. Thom�e1*, Fernando Sequeira2, Francisco Brusquetti1,3,
Bryan Carstens4, C�elio F. B. Haddad1, Miguel Trefaut Rodrigues5 and
Jo~ao Alexandrino6
1Departamento de Zoologia, Instituto de
Biociencias, UNESP – Universidade Estadual
Paulista, Rio Claro, Brazil, 2CIBIO-InBIO,
Centro de Investigac�~ao em Biodiversidade e
Recursos Gen�eticos, Universidade do Porto,
4485-661 Vair~ao, Portugal, 3Instituto de
Investigaci�on Biol�ogica del Paraguay, 1409
Asunci�on, Paraguay, 4Department of
Evolution, Ecology and Organismal Biology,
The Ohio State University, Columbus, OH
43210-1293, USA, 5Departamento de
Zoologia, Instituto de Biociencias, USP –
Universidade de S~ao Paulo, S~ao Paulo, Brazil,6Departamento de Ciencias Biol�ogicas,
UNIFESP – Universidade Federal de S~ao
Paulo, Diadema, Brazil
*Correspondence: Maria Tereza C. Thom�e,
Departamento de Zoologia, Instituto de
Biociencias, UNESP – Universidade Estadual
Paulista, Campus Rio Claro, Rio Claro, Brazil.
E-mail: [email protected]
ABSTRACT
Aim The Caatinga is a widespread but poorly known biome in South America.
Its historical stability is controversial and different types of evidence provide sup-
port to contrasting hypotheses. We investigate how past biome dynamics may
have caused diversification in the endemic four-eyed frog genus Pleurodema.
Location Caatinga biome.
Methods We sampled 353 individuals of Pleurodema alium and Pleurodema
diplolister from 60 localities and genotyped them at 12 (P. alium) or 20
(P. diplolister) microsatellite loci. We sequenced a mitochondrial fragment for
a subset (199) of the samples. After exploratory analyses to infer genetic struc-
ture between and within species, we designed seven biogeographical scenarios
based on the literature on species distributions, palaeomodels and geological
palaeoindicators. We tested these hypotheses by calculating the posterior prob-
ability of models using multilocus approximate Bayesian computation (ABC).
Results Both markers recovered well-defined interspecific limits with restricted
introgression, but population structure within P. diplolister is subtle and
affected by isolation by distance. Model selection using ABC supported two
scenarios of diversification that included recent demographic growth. Genetic
breaks at intra- and interspecific levels were geographically coincident, and cor-
related with past forest invasions reported in the literature.
Main conclusions Our data support the idea that past expansions of the
Amazon and Atlantic forests over the current Caatinga distribution shaped the
genetic structure in endemic four-eyed frogs at more than one level by pro-
moting intermittent vicariance. Additional support comes from the distribution
patterns of forest and Caatinga taxa. Variation among groups suggests differen-
tial organismal responses to past habitat shifts, probably mediated by specific
natural-history traits. This paper provides the first direct evidence that taxa
endemic to the Caatinga were affected by past forest interactions.
Keywords
ABC, Chapada Diamantina, forest corridor, microsatellites, past habitat shifts,
phylogeography, Pleurodema, semi-arid biome
INTRODUCTION
Phylogeography of the widespread biomes of South America
has become a popular subject, with a particular focus on the
Amazon and Brazilian Atlantic forests (Turchetto-Zolet et al.,
2013). Although Brazil is well represented in such studies, it
is also home to the least-studied widespread terrestrial biome
in South America, the semi-arid Caatinga. Covering
850,000 km2 across north-eastern Brazil, the Caatinga is
characterized by a severe water deficit caused by intense and
unpredictable dry seasons (Cole, 1960). The area is part of
the seasonally dry tropical forests of South America (SDTF;
Prado & Gibbs, 1993), and is currently surrounded by two
more mesic biomes, the Cerrado savannas and the Brazilian
ª 2016 John Wiley & Sons Ltd http://wileyonlinelibrary.com/journal/jbi 1doi:10.1111/jbi.12685
Journal of Biogeography (J. Biogeogr.) (2016)
Atlantic forest. The historical distribution of the Caatinga is
poorly understood; interdigitate boundaries with other
biomes may be sharp and local or constituted by extensive
and gradual ecotones, suggesting a constant state of flux
(Cole, 1960). Distinct evidence supports conflicting biogeo-
graphical scenarios varying from long-term stability to dra-
matic habitat replacement.
Based on the distribution of tree species, Prado & Gibbs
(1993) proposed the inclusion of the Caatinga as part of the
SDTF. Under such a model, the Caatinga would constitute
the largest of three disjoint nuclei, relicts of a once continu-
ous ‘Pleistocene arc’ that crossed the continent during the
Last Glacial Maximum (LGM), when wet forests were con-
tracted due to a drier and colder climate. A more recent view
holds that the SDTF trees were incorporated into the Ama-
zon as drought-tolerant elements (Pennington et al., 2000),
suggesting that they may have a longer history in the region
than had been previously assumed. Under this view, they
would have expanded their distributions towards the Cer-
rado, and later retracted to more southerly regions, causing
the current disjunct pattern. The timing of these retractions
would probably date to a much earlier time than the LGM,
based on the high number of endemics in each nucleus (Pen-
nington et al., 2000). Finally, Mayle (2004) proposed that
the SDTF isolates are better explained by long-distance dis-
persal events that probably took place more recently than the
LGM.
Recent investigations have used models of environmental
niche projected to past climate conditions (e.g. palaeomod-
elling) to understand the dynamics of the SDTF, with contra-
dictory results. Werneck et al. (2011) modelled random
occurrence points and predicted that the palaeodistribution of
the SDTF was even more fragmented at the LGM than
expected under Pennington’s model. Past expansions over the
Amazon were not confirmed, but the Caatinga would have had
a fairly stable distribution with only a recent moderate expan-
sion at its southern limits. More recently, Collevatti et al.
(2013) generated past distributions for the SDTF trees mapped
by Prado & Gibbs (1993). Their results support a potential past
distribution for the SDTF that extended continuously across a
wide area during the LGM. This wide past distribution was,
however, displaced to the south-west, suggesting that the
SDTF simultaneously expanded west (into the Cerrado and
Amazon), while retracting its eastern limits (Caatinga).
Palaeoindicators (pollen record and other geological data
on past habitats or climates) suggest that rain forests
replaced the Caatinga, at least partly, in recurrent and
numerous pulses of moister climate. Under such a scenario,
the present dry conditions would have been established dur-
ing the early (Behling et al., 2000) or mid-Holocene (de
Oliveira et al., 1999). However, the extent and timing of
these habitat shifts are not clear. Based on pollen records, de
Oliveira et al. (1999) proposed the formation of a Late Pleis-
tocene forest corridor connecting the Amazon and the Atlan-
tic forests, crossing the Caatinga through the Chapada
Diamantina formation. On the other hand, accumulated evi-
dence (e.g. Auler et al., 2004) has expanded both the time-
frame and geographical extent of the Caatinga replacement.
Moister climates would have been more recurrent than pre-
viously thought, occurring at least since the mid-Pleistocene.
The distribution of studied sites supports massive landscape
changes with large forested areas instead of a narrow corri-
dor (Auler et al., 2004).
Given the uncertainty about shifts in the SDTF habitat
during the Pleistocene, we gathered multilocus data from
353 individuals of two endemic four-eyed frogs – one
restricted to the southern Caatinga and the other with a
widespread distribution – to better understand the history of
this biome. We investigated how past biome dynamics may
have caused diversification in this system by evaluating intra-
and interspecific divergences, and by testing which of seven
diversification scenarios extracted from the literature best
explains the population history of the widespread species.
MATERIALS AND METHODS
Focus organism and sampling
The four-eyed frog genus Pleurodema Tschudi, 1838 com-
prises a lineage of South American explosive-breeding frogs
inhabiting strongly seasonal and xeric environments. Of the
15 known species in the genus, only P. alium Maciel &
Nunes, 2010 and P. diplolister (Peters, 1870) occur in the
Caatinga and these species are geographically isolated from
other congeners by surrounding mesic biomes. Pleurodema
alium and P. diplolister are sister species (Faivovich et al.,
2012) with partly sympatric distributions (Maciel & Nunes,
2010): P. alium has a more restricted distribution in the
southern Caatinga, whereas P. diplolister is widespread across
most of the biome, also occurring in pockets of Caatinga
embedded within the Cerrado. In this study, we sampled a
total of 353 individuals from 60 localities distributed across
the biome and isolates (Fig. 1; see Appendix S1 in Support-
ing Information).
Markers and molecular protocols
Genomic DNA was extracted from liver and muscle pre-
served in ethanol using DNeasy Blood & Tissue kits (Qiagen,
Venlo, Netherlands). Following the protocol described by
Thom�e et al. (2014), we genotyped 12 microsatellite loci in
each species, and eight additional loci for P. diplolister. Indi-
viduals with more than 30% missing data were not included
in downstream analyses. In addition, we sequenced a frag-
ment of the mitochondrial cytochrome c oxidase subunit I
(COI) gene in 199 individuals. For fragment amplification,
we used Master Mix (Fermentas, Waltham, MA, USA),
c. 50 ng DNA, and the ANF1/ANR1 primers (Jungfer et al.,
2013). PCR conditions included initial denaturation at 94 °C(3 min); 35 cycles of 94 °C (30 s) for denaturation, 50 °C(30 s) for annealing, and 72 °C (90 s) for extension; and
72 °C (7 min) for extension. PCR products were delivered to
Journal of Biogeographyª 2016 John Wiley & Sons Ltd
2
M. T. C. Thom�e et al.
Macrogen (Seoul, Korea) for sequencing. We checked chro-
matograms and edited and assembled sequences using
CodonCode 3.5.4 (CodonCode Corporation; available at:
http://www.codoncode.com/).
Basic statistics and genetic structure
We tested all microsatellite loci for allele dropouts, stuttering
and null alleles using micro-checker 2.2.3 (Van Oosterhout
et al., 2004), considering localities with 10 or more individu-
als. Bayesian clustering, implemented in structure 2.3.4
(Pritchard et al., 2000), was used to detect the species limits
between Pleurodema alium and P. diplolister. We ran struc-
ture allowing for mixed ancestry and correlated allele fre-
quencies, and considered values of K up to 10. A burn-in of
500,000 Markov chain Monte Carlo generations was dis-
carded, and analyses were conducted using 1,000,000 steps.
We performed 10 runs for each value of K, plotted the aver-
age log-likelihoods, and calculated DK (Evanno et al., 2005)
using structure-harvester 0.6 (Earl & vonHoldt, 2012).
Individuals were aligned across runs using clumpp 1.1.2
(Jakobsson & Rosenberg, 2007).
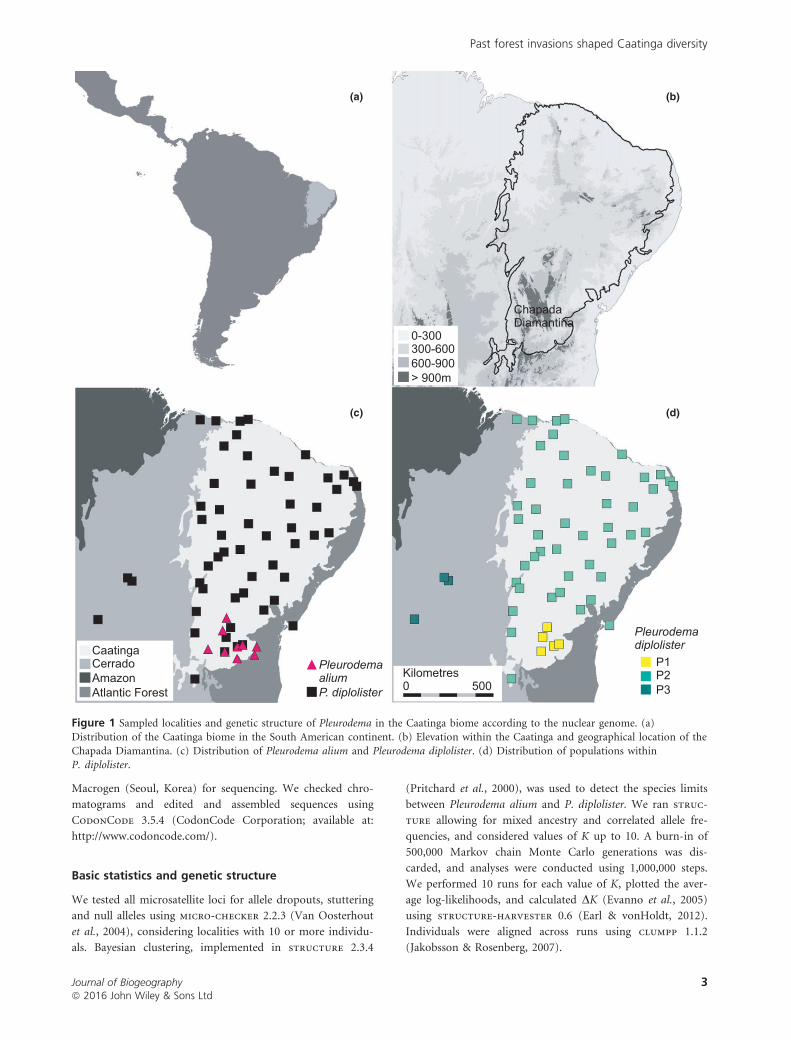
Caatinga Cerrado Amazon Atlantic Forest
Pleurodema alium P. diplolister
(c)
Kilometres0 500
P1 P2 P3
(d)
0-300 300-600 600-900 > 900m
(b)
ChapadaDiamantina
(a)
Pleurodema diplolister
Figure 1 Sampled localities and genetic structure of Pleurodema in the Caatinga biome according to the nuclear genome. (a)Distribution of the Caatinga biome in the South American continent. (b) Elevation within the Caatinga and geographical location of the
Chapada Diamantina. (c) Distribution of Pleurodema alium and Pleurodema diplolister. (d) Distribution of populations withinP. diplolister.
Journal of Biogeographyª 2016 John Wiley & Sons Ltd
3
Past forest invasions shaped Caatinga diversity
To evaluate genetic structure within P. diplolister, we elim-
inated possibly admixed individuals (those with q-values
lower than 0.90 in the analysis that included P. alium and
P. diplolister) and ran structure considering values of K up
to 15. We tested for correlation between genetic distance
(Nei’s D) and geographical distance using a Mantel test
(Mantel, 1967), and then used geneland (Guillot et al.,
2005) to investigate genetic structure while accounting for
the geographical locations of samples. geneland was first
used to estimate K with the following settings: 10 replicates
of 100,000 interactions, thinning interval of 100, uncorrelated
frequencies, and convergence accessed by comparing K values
in each replicate. Secondly, we ran geneland with a fixed K
to estimate population membership, with 1,000,000 interac-
tions.
To investigate the mitochondrial genetic structure, we
aligned sequences by eye and reconstructed a maximum-like-
lihood tree in Phylip 3.2 (Felsenstein, 1989), used in
Haplotype Viewer (http://www.cibiv.at/~greg/haploviewer)
to build a haplotype network. We calculated the number of
haplotypes, haplotype diversity, nucleotide diversity and net
divergences, and performed neutrality tests (R2 and Fu’s FS)
in DnaSP 5 (Librado & Rozas, 2009).
Hypotheses construction and testing using
multilocus ABC
Seven biogeographical scenarios (models) were designed by
integrating the available evidence to describe putative past
Caatinga distributions (Fig. 2), and the relative fit of these
models, given the data were calculated using approximate
Bayesian computation (ABC). For simplicity, we based our
analysis only on the microsatellite data set but, because
microsatellites may be unsuitable for estimating deep diver-
gences (Sunnucks, 2000), we excluded P. alium and kept
P. diplolister, which shows a widespread distribution that is
more representative of the Caatinga. The models were
derived from the literature (Table 1). Each model included
three populations (consistent with our results on genetic
structure) and two mutually exclusive time intervals: t1 for
recent events, ranging from mid-Holocene to late Pleis-
tocene, and t2 for older events, ranging from t1 (thus mid-
Holocene to late Pleistocene) to late Pliocene.
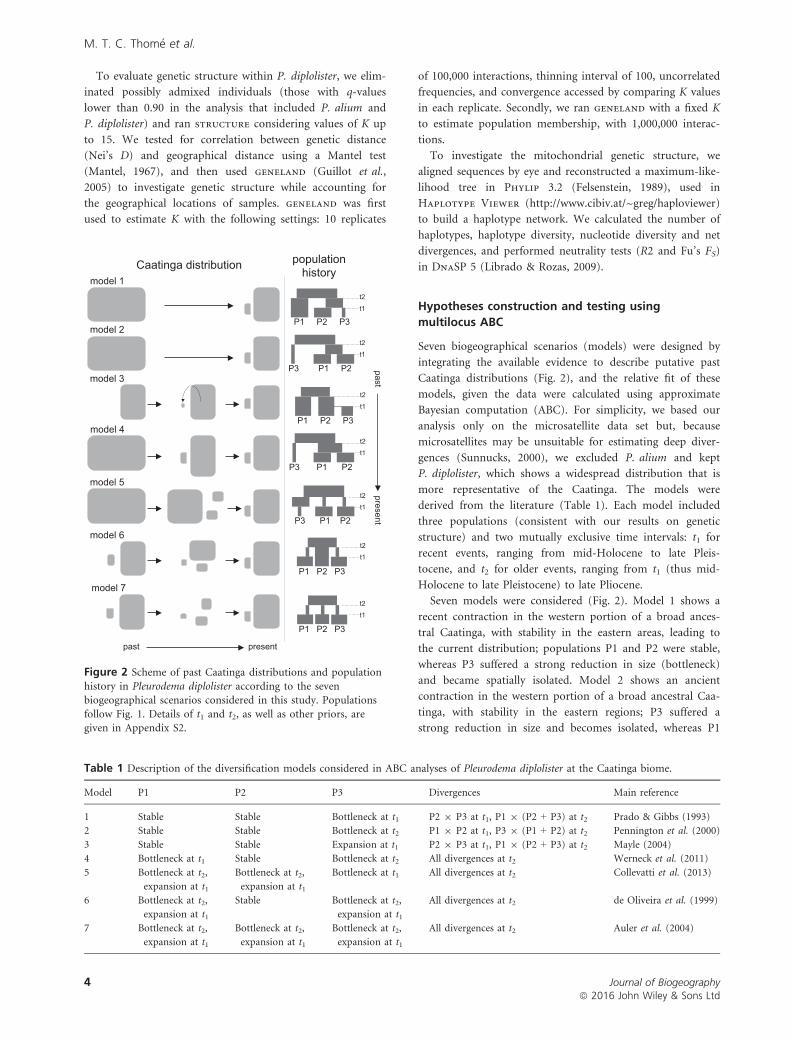
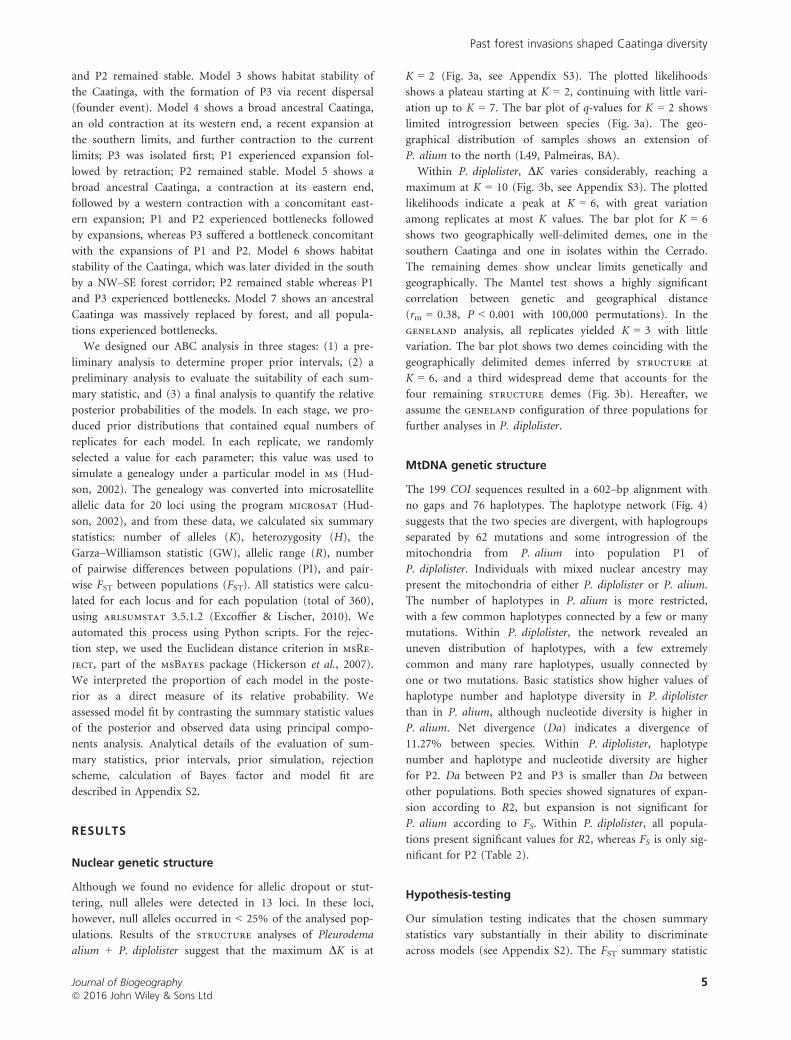
Seven models were considered (Fig. 2). Model 1 shows a
recent contraction in the western portion of a broad ances-
tral Caatinga, with stability in the eastern areas, leading to
the current distribution; populations P1 and P2 were stable,
whereas P3 suffered a strong reduction in size (bottleneck)
and became spatially isolated. Model 2 shows an ancient
contraction in the western portion of a broad ancestral Caa-
tinga, with stability in the eastern regions; P3 suffered a
strong reduction in size and becomes isolated, whereas P1
model 2
model 3
past present
Caatinga distribution
past present
model 4
model 5
model 6
model 7
model 1
P3 P1 P2
t2
t1
population history
t2
t1
P1 P2 P3
P1 P2 P3
t2
t1
P3 P1 P2
t2
t1
P3 P1 P2
t2
t1
P1 P2 P3
t2
t1
P1 P2 P3
t2
t1
Figure 2 Scheme of past Caatinga distributions and population
history in Pleurodema diplolister according to the sevenbiogeographical scenarios considered in this study. Populations
follow Fig. 1. Details of t1 and t2, as well as other priors, aregiven in Appendix S2.
Table 1 Description of the diversification models considered in ABC analyses of Pleurodema diplolister at the Caatinga biome.
Model P1 P2 P3 Divergences Main reference
1 Stable Stable Bottleneck at t1 P2 9 P3 at t1, P1 9 (P2 + P3) at t2 Prado & Gibbs (1993)
2 Stable Stable Bottleneck at t2 P1 9 P2 at t1, P3 9 (P1 + P2) at t2 Pennington et al. (2000)
3 Stable Stable Expansion at t1 P2 9 P3 at t1, P1 9 (P2 + P3) at t2 Mayle (2004)
4 Bottleneck at t1 Stable Bottleneck at t2 All divergences at t2 Werneck et al. (2011)
5 Bottleneck at t2,
expansion at t1
Bottleneck at t2,
expansion at t1
Bottleneck at t1 All divergences at t2 Collevatti et al. (2013)
6 Bottleneck at t2,
expansion at t1
Stable Bottleneck at t2,
expansion at t1
All divergences at t2 de Oliveira et al. (1999)
7 Bottleneck at t2,
expansion at t1
Bottleneck at t2,
expansion at t1
Bottleneck at t2,
expansion at t1
All divergences at t2 Auler et al. (2004)
Journal of Biogeographyª 2016 John Wiley & Sons Ltd
4
M. T. C. Thom�e et al.
and P2 remained stable. Model 3 shows habitat stability of
the Caatinga, with the formation of P3 via recent dispersal
(founder event). Model 4 shows a broad ancestral Caatinga,
an old contraction at its western end, a recent expansion at
the southern limits, and further contraction to the current
limits; P3 was isolated first; P1 experienced expansion fol-
lowed by retraction; P2 remained stable. Model 5 shows a
broad ancestral Caatinga, a contraction at its eastern end,
followed by a western contraction with a concomitant east-
ern expansion; P1 and P2 experienced bottlenecks followed
by expansions, whereas P3 suffered a bottleneck concomitant
with the expansions of P1 and P2. Model 6 shows habitat
stability of the Caatinga, which was later divided in the south
by a NW–SE forest corridor; P2 remained stable whereas P1
and P3 experienced bottlenecks. Model 7 shows an ancestral
Caatinga was massively replaced by forest, and all popula-
tions experienced bottlenecks.
We designed our ABC analysis in three stages: (1) a pre-
liminary analysis to determine proper prior intervals, (2) a
preliminary analysis to evaluate the suitability of each sum-
mary statistic, and (3) a final analysis to quantify the relative
posterior probabilities of the models. In each stage, we pro-
duced prior distributions that contained equal numbers of
replicates for each model. In each replicate, we randomly
selected a value for each parameter; this value was used to
simulate a genealogy under a particular model in ms (Hud-
son, 2002). The genealogy was converted into microsatellite
allelic data for 20 loci using the program microsat (Hud-
son, 2002), and from these data, we calculated six summary
statistics: number of alleles (K), heterozygosity (H), the
Garza–Williamson statistic (GW), allelic range (R), number
of pairwise differences between populations (PI), and pair-
wise FST between populations (FST). All statistics were calcu-
lated for each locus and for each population (total of 360),
using arlsumstat 3.5.1.2 (Excoffier & Lischer, 2010). We
automated this process using Python scripts. For the rejec-
tion step, we used the Euclidean distance criterion in msRe-
ject, part of the msBayes package (Hickerson et al., 2007).
We interpreted the proportion of each model in the poste-
rior as a direct measure of its relative probability. We
assessed model fit by contrasting the summary statistic values
of the posterior and observed data using principal compo-
nents analysis. Analytical details of the evaluation of sum-
mary statistics, prior intervals, prior simulation, rejection
scheme, calculation of Bayes factor and model fit are
described in Appendix S2.
RESULTS
Nuclear genetic structure
Although we found no evidence for allelic dropout or stut-
tering, null alleles were detected in 13 loci. In these loci,
however, null alleles occurred in < 25% of the analysed pop-
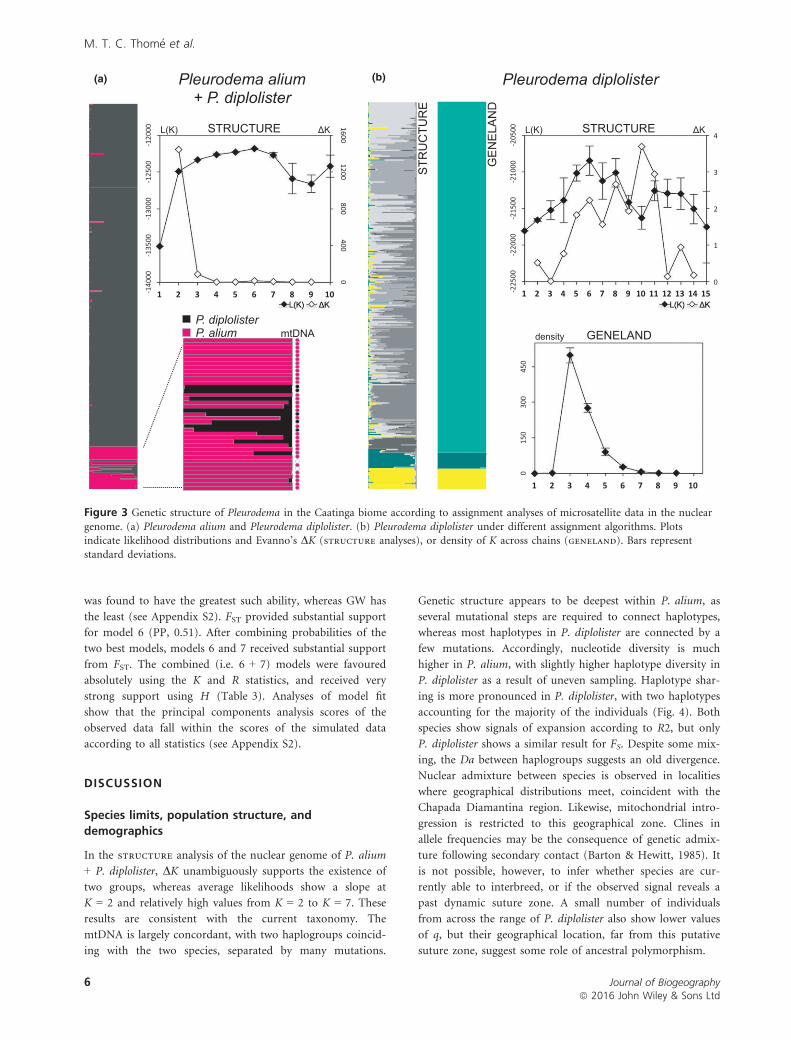
ulations. Results of the structure analyses of Pleurodema
alium + P. diplolister suggest that the maximum DK is at
K = 2 (Fig. 3a, see Appendix S3). The plotted likelihoods
shows a plateau starting at K = 2, continuing with little vari-
ation up to K = 7. The bar plot of q-values for K = 2 shows
limited introgression between species (Fig. 3a). The geo-
graphical distribution of samples shows an extension of
P. alium to the north (L49, Palmeiras, BA).
Within P. diplolister, DK varies considerably, reaching a
maximum at K = 10 (Fig. 3b, see Appendix S3). The plotted
likelihoods indicate a peak at K = 6, with great variation
among replicates at most K values. The bar plot for K = 6
shows two geographically well-delimited demes, one in the
southern Caatinga and one in isolates within the Cerrado.
The remaining demes show unclear limits genetically and
geographically. The Mantel test shows a highly significant
correlation between genetic and geographical distance
(rm = 0.38, P < 0.001 with 100,000 permutations). In the
geneland analysis, all replicates yielded K = 3 with little
variation. The bar plot shows two demes coinciding with the
geographically delimited demes inferred by structure at
K = 6, and a third widespread deme that accounts for the
four remaining structure demes (Fig. 3b). Hereafter, we
assume the geneland configuration of three populations for
further analyses in P. diplolister.
MtDNA genetic structure
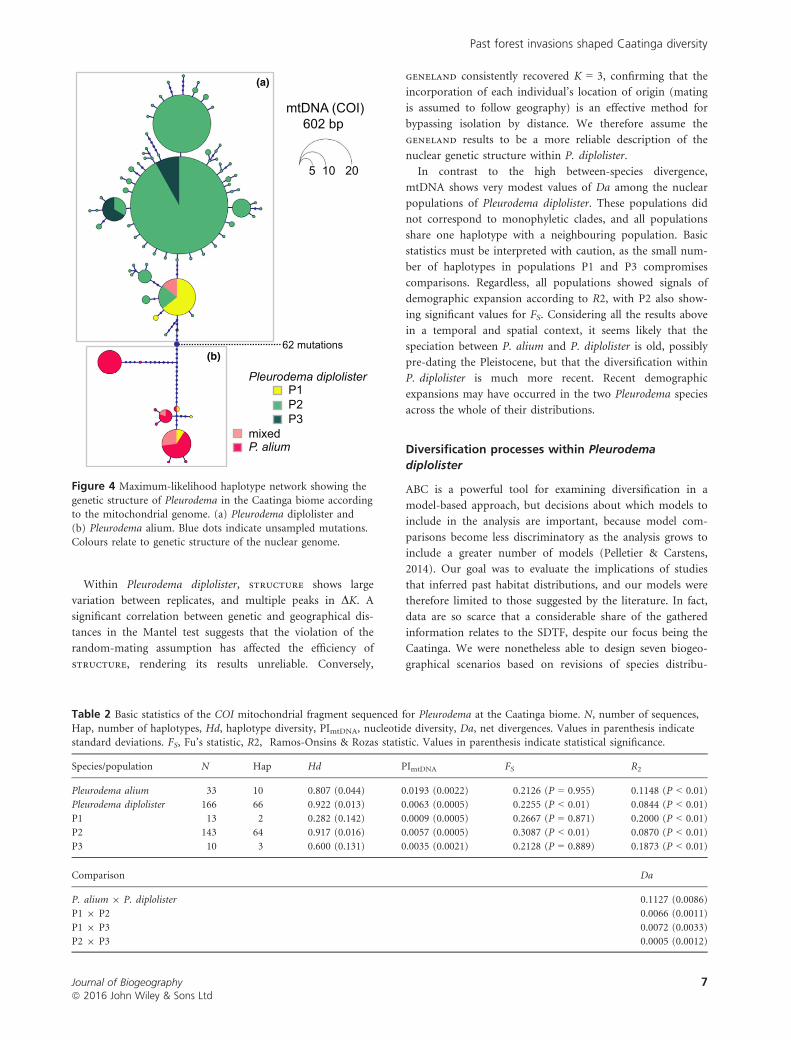
The 199 COI sequences resulted in a 602–bp alignment with
no gaps and 76 haplotypes. The haplotype network (Fig. 4)
suggests that the two species are divergent, with haplogroups
separated by 62 mutations and some introgression of the
mitochondria from P. alium into population P1 of
P. diplolister. Individuals with mixed nuclear ancestry may
present the mitochondria of either P. diplolister or P. alium.
The number of haplotypes in P. alium is more restricted,
with a few common haplotypes connected by a few or many
mutations. Within P. diplolister, the network revealed an
uneven distribution of haplotypes, with a few extremely
common and many rare haplotypes, usually connected by
one or two mutations. Basic statistics show higher values of
haplotype number and haplotype diversity in P. diplolister
than in P. alium, although nucleotide diversity is higher in
P. alium. Net divergence (Da) indicates a divergence of
11.27% between species. Within P. diplolister, haplotype
number and haplotype and nucleotide diversity are higher
for P2. Da between P2 and P3 is smaller than Da between
other populations. Both species showed signatures of expan-
sion according to R2, but expansion is not significant for
P. alium according to FS. Within P. diplolister, all popula-
tions present significant values for R2, whereas FS is only sig-
nificant for P2 (Table 2).
Hypothesis-testing
Our simulation testing indicates that the chosen summary
statistics vary substantially in their ability to discriminate
across models (see Appendix S2). The FST summary statistic
Journal of Biogeographyª 2016 John Wiley & Sons Ltd
5
Past forest invasions shaped Caatinga diversity
was found to have the greatest such ability, whereas GW has
the least (see Appendix S2). FST provided substantial support
for model 6 (PP, 0.51). After combining probabilities of the
two best models, models 6 and 7 received substantial support
from FST. The combined (i.e. 6 + 7) models were favoured
absolutely using the K and R statistics, and received very
strong support using H (Table 3). Analyses of model fit
show that the principal components analysis scores of the
observed data fall within the scores of the simulated data
according to all statistics (see Appendix S2).
DISCUSSION
Species limits, population structure, and
demographics
In the structure analysis of the nuclear genome of P. alium
+ P. diplolister, DK unambiguously supports the existence of
two groups, whereas average likelihoods show a slope at
K = 2 and relatively high values from K = 2 to K = 7. These
results are consistent with the current taxonomy. The
mtDNA is largely concordant, with two haplogroups coincid-
ing with the two species, separated by many mutations.
Genetic structure appears to be deepest within P. alium, as
several mutational steps are required to connect haplotypes,
whereas most haplotypes in P. diplolister are connected by a
few mutations. Accordingly, nucleotide diversity is much
higher in P. alium, with slightly higher haplotype diversity in
P. diplolister as a result of uneven sampling. Haplotype shar-
ing is more pronounced in P. diplolister, with two haplotypes
accounting for the majority of the individuals (Fig. 4). Both
species show signals of expansion according to R2, but only
P. diplolister shows a similar result for FS. Despite some mix-
ing, the Da between haplogroups suggests an old divergence.
Nuclear admixture between species is observed in localities
where geographical distributions meet, coincident with the
Chapada Diamantina region. Likewise, mitochondrial intro-
gression is restricted to this geographical zone. Clines in
allele frequencies may be the consequence of genetic admix-
ture following secondary contact (Barton & Hewitt, 1985). It
is not possible, however, to infer whether species are cur-
rently able to interbreed, or if the observed signal reveals a
past dynamic suture zone. A small number of individuals
from across the range of P. diplolister also show lower values
of q, but their geographical location, far from this putative
suture zone, suggest some role of ancestral polymorphism.
(a) (b)
Figure 3 Genetic structure of Pleurodema in the Caatinga biome according to assignment analyses of microsatellite data in the nuclear
genome. (a) Pleurodema alium and Pleurodema diplolister. (b) Pleurodema diplolister under different assignment algorithms. Plotsindicate likelihood distributions and Evanno’s DK (structure analyses), or density of K across chains (geneland). Bars represent
standard deviations.
Journal of Biogeographyª 2016 John Wiley & Sons Ltd
6
M. T. C. Thom�e et al.
Within Pleurodema diplolister, structure shows large
variation between replicates, and multiple peaks in DK. A
significant correlation between genetic and geographical dis-
tances in the Mantel test suggests that the violation of the
random-mating assumption has affected the efficiency of
structure, rendering its results unreliable. Conversely,
geneland consistently recovered K = 3, confirming that the
incorporation of each individual’s location of origin (mating
is assumed to follow geography) is an effective method for
bypassing isolation by distance. We therefore assume the
geneland results to be a more reliable description of the
nuclear genetic structure within P. diplolister.
In contrast to the high between-species divergence,
mtDNA shows very modest values of Da among the nuclear
populations of Pleurodema diplolister. These populations did
not correspond to monophyletic clades, and all populations
share one haplotype with a neighbouring population. Basic
statistics must be interpreted with caution, as the small num-
ber of haplotypes in populations P1 and P3 compromises
comparisons. Regardless, all populations showed signals of
demographic expansion according to R2, with P2 also show-
ing significant values for FS. Considering all the results above
in a temporal and spatial context, it seems likely that the
speciation between P. alium and P. diplolister is old, possibly
pre-dating the Pleistocene, but that the diversification within
P. diplolister is much more recent. Recent demographic
expansions may have occurred in the two Pleurodema species
across the whole of their distributions.
Diversification processes within Pleurodema
diplolister
ABC is a powerful tool for examining diversification in a
model-based approach, but decisions about which models to
include in the analysis are important, because model com-
parisons become less discriminatory as the analysis grows to
include a greater number of models (Pelletier & Carstens,
2014). Our goal was to evaluate the implications of studies
that inferred past habitat distributions, and our models were
therefore limited to those suggested by the literature. In fact,
data are so scarce that a considerable share of the gathered
information relates to the SDTF, despite our focus being the
Caatinga. We were nonetheless able to design seven biogeo-
graphical scenarios based on revisions of species distribu-
5 10 20
mtDNA (COI) 602 bp
62 mutations
Pleurodema diplolister P1 P2 P3
mixed P. alium
(a)
(b)
Figure 4 Maximum-likelihood haplotype network showing the
genetic structure of Pleurodema in the Caatinga biome accordingto the mitochondrial genome. (a) Pleurodema diplolister and
(b) Pleurodema alium. Blue dots indicate unsampled mutations.Colours relate to genetic structure of the nuclear genome.
Table 2 Basic statistics of the COI mitochondrial fragment sequenced for Pleurodema at the Caatinga biome. N, number of sequences,
Hap, number of haplotypes, Hd, haplotype diversity, PImtDNA, nucleotide diversity, Da, net divergences. Values in parenthesis indicatestandard deviations. FS, Fu’s statistic, R2, Ramos-Onsins & Rozas statistic. Values in parenthesis indicate statistical significance.
Species/population N Hap Hd PImtDNA FS R2
Pleurodema alium 33 10 0.807 (0.044) 0.0193 (0.0022) �0.2126 (P = 0.955) 0.1148 (P < 0.01)
Pleurodema diplolister 166 66 0.922 (0.013) 0.0063 (0.0005) �0.2255 (P < 0.01) 0.0844 (P < 0.01)
P1 13 2 0.282 (0.142) 0.0009 (0.0005) 0.2667 (P = 0.871) 0.2000 (P < 0.01)
P2 143 64 0.917 (0.016) 0.0057 (0.0005) �0.3087 (P < 0.01) 0.0870 (P < 0.01)
P3 10 3 0.600 (0.131) 0.0035 (0.0021) 0.2128 (P = 0.889) 0.1873 (P < 0.01)
Comparison Da
P. alium 9 P. diplolister 0.1127 (0.0086)
P1 9 P2 0.0066 (0.0011)
P1 9 P3 0.0072 (0.0033)
P2 9 P3 0.0005 (0.0012)
Journal of Biogeographyª 2016 John Wiley & Sons Ltd
7
Past forest invasions shaped Caatinga diversity
tional patterns (models 1, 2 and 3), palaeomodels (models 3,
4 and 5) and palaeoindicators of multiple geological origins
(models 6 and 7).
The translation of information into the models was per-
haps the most challenging aspect of our work. Models must
incorporate constraints in time and space depicted by prior
intervals, but many of these works show limited resolution at
temporal and/or geographical scales. Calibration from years
to units of 4N is especially problematic; one recent account
showed that the timings of population-level events (including
expansions) based on molecular clocks are frequently over-
estimated by an order of magnitude (Grant, 2015), even in
cases where a substitution rate is available, or in the case of
well-studied organisms (e.g. humans). Dating in Pleurodema
should be even more problematic because these are non-
model organisms for which no information on mutation
rates (either from sequences or microsatellites) is available.
Thus, the lack of a direct connection between population
history and time-specific events is an expected limitation of
our work, and our efforts to circumvent this issue included
the exploratory analysis of mtDNA to define broad time
constraints that include a large number of climatic events,
and extensive sampling of the prior with a total of a million
simulations for model choice. Strategies to minimize other
issues inherent to ABC (e.g. choice of summary statistics
and proper sampling of parameter space) included (1) a
preliminary ABC analysis to narrow independent (per
locus) intervals for the population-size parameter h, includ-ing a rejection scheme that accounted for the intervals
defined by each summary statistic, (2) a detailed (per
model) evaluation of the efficiency of each summary statis-
tic in recovering the true model, (3) rejection performed
separately for each summary statistic using low tolerance,
and (4) analysis of model fit using principal components
analysis of summary statistics from the simulated and
observed data.
Our ABC model-choice analysis identified model 6 as the
model with the highest posterior probability, and we suspect
that support for this model was somewhat diminished by the
inclusion of a similar model (model 7) in the comparison set.
Models 6 and 7 differ only by the inclusion of population
growth in P2 (in model 6, growth occurs only in P1 and P3).
When the posterior probabilities of these models were com-
bined, most summary statistics support these models. Both
were designed to represent recent changes in habitat availability
and are characterized by population fragmentation followed
by demographic expansions. In fact, a series of studies on
palaeoindicators of geological origin confirmed a dynamic
nature for the past distribution of the Caatinga (see below).
Dynamic past distributions support recurrent
processes in the Caatinga
Studies on past climates and habitat conditions of the Caa-
tinga are scarce. Because low levels of precipitation prevent
the formation of the permanent lakes needed for a continu-
ous pollen record, most evidence relates to the physical envi-
ronment instead of true vegetation cover (with the exception
of de Oliveira et al., 1999, and Behling et al., 2000). One of
the first works mentioning climate change was based on
groundwater composition, and estimated a cooling of at least
5.4 °C for the period between 10 and 35 14C ka (c. 12–40 cal. yr bp; Stute et al., 1995). Later, de Oliveira et al.
(1999) examined the palynological record of the Icatu River
valley, covering the entire Holocene. Their findings include
an older layer (13–12.6 ka) containing taxa currently found
in Amazon and Atlantic forests, and indicates the establish-
ment of the present-day Caatinga vegetation only 4.8 ka. The
work of de Oliveira et al. (1999) is paramount because it
confirms that reduced temperatures were indeed associated
with conditions wet enough to allow the expansion of for-
ests. Data from the palaeoceanographical record at the
Table 3 Posterior probabilities of each model in the ABC analysis of Pleurodema diplolister at the Caatinga biome, according to the
summary statistic used in rejection. K, number of alleles; H, heterozygosity; GW, Garza–Williamson statistic; R, allelic range; PI, numberof pairwise differences between populations, FST, pairwise FST between populations; BWM, barely worth mentioning. FST was found to
have the greatest ability to discriminate among models in the simulation testing (see Appendix S2).
Model FST PI K R H GW
1 0.03 0.25 0 0 0.01 0.17
2 0.02 0.15 0 0 0.01 0.30
3 0.05 0.21 0 0 0 0.11
4 0.14 0.04 0 0 0.01 0.10
5 0.09 0.16 0 0 0.01 0.12
6 0.51 0.13 0.48 0.46 0.36 0.10
7 0.16 0.06 0.52 0.54 0.60 0.10
Best model 6 1 7 7 7 2
Bayes factor 3.19 1.19 1.08 1.17 1.67 1.76
Support Substantial BWM BWM BWM BWM BWM
Two best models 6 and 7 1 and 3 6 and 7 6 and 7 6 and 7 1 and 2
Bayes factor 4.79 2.87 Absolute Absolute 96 3.92
Support Substantial BWM Decisive Decisive Very strong Substantial
Journal of Biogeographyª 2016 John Wiley & Sons Ltd
8
M. T. C. Thom�e et al.
extreme north-eastern Brazilian coast were also of great
importance, including stable oxygen isotopes (Arz et al.,
1998) and a second palynological record (Behling et al.,
2000), both suggesting humid past climates. The pollen
record provides better resolution and shows that semi-arid
conditions dominated most of the time (Behling et al.,
2000). Fern spores indicated short, episodic pulses of ele-
vated precipitation, whereas pollen from forest species domi-
nated the records from 18.5 to 13.8 ka. Both studies
contributed by expanding the geographical range of forest
invasions (Auler et al., 2004). Conversely, analyses of spe-
laeothems and travertines dramatically expanded the time-
frame of the wet periods (Auler & Smart, 2001; Wang et al.,
2004), allowing a highly detailed description of the precipita-
tion records for the last 210 kyr to be made, with an average
of one pluvial event every 20 kyr (Wang et al., 2004). These
are in broad agreement with the wet pulses described by
Behling et al. (2000), and add six more wet events between
60 and 70 ka. Even more impressively, the oldest travertines
are about 0.9–1 Myr old (Auler & Smart, 2001; Wang et al.,
2004). Because these structures only deposit under consider-
able precipitation, it provides unequivocal evidence that wet
periods have occurred at least since the mid-Pleistocene.
Despite evidence of wet periods and pulsar increases in
moisture, the contractions and expansions of the Caatinga
are still poorly understood in terms of their timing and geo-
graphical extent. Past wet climates were episodic, intercalated
with much longer periods of semi-arid climate, and most
wet events may have been too small for a wide expansion of
wet forests (Jennerjahn et al., 2004). The geography of the
evidence suggests widespread climate changes (Auler et al.,
2004), but the pollen records attesting to forest existence are
sparse. The use of palaeomodels is a convenient and fast way
to formulate testable hypotheses, but there are many related
technical caveats. The existence of two conflicting hypotheses
(Werneck et al., 2011; Collevatti et al., 2013) underscores the
need for model validation and illustrates the value of infer-
ence based on hard data.
Caatinga isolates within the Cerrado (Paran~a river basin
and other fragments) and rain forest relicts embedded in the
Caatinga (‘brejos’ in north-eastern Brazil and fragments in
the Chapada Diamantina formation) constitute living wit-
nesses to the dynamics between biomes. Taxa occurring in
forest isolates are often endemics (Loebmann & Haddad,
2010; Camardelli & Napoli, 2012; Guedes et al., 2014) with
their closest relatives in the Atlantic forest or Amazon
(Rodrigues et al., 2006; Roberto et al., 2014), and show
genetic signatures compatible with refugial dynamics (Car-
naval & Bates, 2007). Caatinga isolates are less well studied
but show similar patterns (Werneck & Colli, 2006). Most rel-
evant to the present work, the inference of an intermittent
forested corridor crossing the Caatinga via the Chapada Dia-
mantina (de Oliveira et al., 1999) is supported by a suite of
data. This formation is characterized by a Palaeogene plateau
(Bonow et al., 2009) with rocky fields at the top and forest
outlining its escarpments. De Oliveira et al. (1999) associated
their findings with the occurrence of isolated forest elements
in a present-day botanical inventory (Stannard, 1995), and
to a Late Pleistocene skeleton of a megafaunal primate (Pro-
topithecus; Hartwig & Cartelle, 1996). Costa (2003) related
this bridge to phylogenetic patterns in mammals from the
Amazon and Atlantic forests. More recently, two geographi-
cally similar hypotheses of the precise distribution of this
corridor were proposed, although their temporal contexts
differ. Batalha-Filho et al. (2013) combined phylogenetic
data with distributions in birds to propose a corridor for
rain forest exchanges that took place c. 4.5 Ma, whereas
Sobral-Souza et al. (2015) used palaeomodelling to infer this
connection at the LGM.
The evidence suggests overall that changes in habitat avail-
ability did occur in the Caatinga. This is concordant with
the analyses in this paper, including the demographic expan-
sions detected in the mtDNA, and by model selection using
nuclear markers. Furthermore, the striking similarity in the
geographical limits of P. alium and P. diplolister, and popu-
lations P1 and P2 within P. diplolister, in contrast to the
marked difference in mitochondrial divergences, suggests
recurrent processes. The geographical coincidence of these
two genetic breaks with the Chapada Diamantina region,
with well-documented relicts of wet forest elements and for
which a rain forest bridge has been previously proposed, also
supports the idea of recurrent processes. The evidence sug-
gests that rain forest invasions shaped the genetic diversity of
the Pleurodema species endemic to the Caatinga, with the
formation of an intermittent forest corridor causing recur-
rent population vicariance, resulting in speciation in the
common ancestor of P. alium and P. diplolister, as well as
divergence within P. diplolister. To our knowledge, this is the
first available evidence that taxa endemic to the Caatinga
were affected by the dynamics between this biome and the
surrounding forests.
Diversification patterns in other Caatinga organisms
The biota of the Caatinga is intriguing, as endemism levels
vary greatly by taxonomic group. The Caatinga presents the
most distinctive xeric flora on the continent (Sarmiento,
1975), whereas faunal endemism may be very low (7% in
mammals), or extremely high (57% in fishes) (Leal et al.,
2005). Such remarkable differences suggest that the responses
of organisms to past habitat shifts must have been varied
(Collevatti et al., 2013). Natural-history traits mediate popu-
lation persistence and are therefore determinants of genetic
structure. Two studies with widespread taxa found deep
genetic structure that, at first glance, seems to be at odds
with our findings. Magalh~aes et al. (2014) reported on the
presence of several cryptic lineages in spiders of the genus
Sicarus, but attributed them to low dispersal abilities and
older history in the biome. These organisms showed a reduc-
tion in population size in the late Pleistocene with a Holo-
cene recovery, compatible with forest invasions inferred by
Sobral-Souza et al. (2015). Lizards of the Tropidurus semitae-
Journal of Biogeographyª 2016 John Wiley & Sons Ltd
9
Past forest invasions shaped Caatinga diversity

niatus complex showed high levels of genetic diversity in
microendemic lineages and no signal of population reduc-
tion, which the authors associated with the long-term stabil-
ity of isolated rock surfaces and climate (Werneck et al.,
2015). The orchid genus Epidendrum, however, showed sig-
nals of population persistence both in Atlantic Forest and
Caatinga inselbergs (Pinheiro et al., 2014), raising the possi-
bility that rocky environments remained uncovered during
forest invasions. In contrast, Pleurodema occurs in great
abundance throughout the biome, suggesting that population
sizes are large and that the distribution is continuous. Under
such conditions, the signatures of many events would be
readily erased, preventing the formation of complex genetic
structure. Furthermore, habitat fragmentation may play a
secondary role in some groups. Diversification in Caatinga
legumes seems to be related to paedogenesis, with more spe-
cies associated with recent sandy soils than older soils from
crystalline basements (de Queiroz, 2006). For lizards and
mammals, the S~ao Francisco River is a major vicariant agent
at both large (Werneck et al., 2012, 2015; Faria et al., 2013;
Nascimento et al., 2013) and small scales (Rodrigues, 1996).
Differences in diversification patterns bring direct conse-
quences for conservation. Despite its distinctiveness and large
area of occurrence, the Caatinga is the least-protected Brazil-
ian biome, with high deforestation rates and < 1% of its area
allocated to conservation (Leal et al., 2005). Proper conserva-
tion planning for this biome should include regions harbour-
ing high levels of species richness, while accounting for the
evolutionary processes that ultimately produce this biodiver-
sity.
CONCLUSIONS
In poorly known regions, evidence found in alternative types
of data and neighbouring regions may allow the elucidation
of biogeographical processes. For the Caatinga, evidence on
past climates, species patterns and habitat distributions sug-
gest recurrent invasions of wet forest into this biome. The
genetic structure in endemic Pleurodema species is in agree-
ment with these forest invasions, including the intermittent
formation of a forest corridor connecting the Amazon and
the Atlantic forests via the Chapada Diamantina, causing
recurrent vicariance of populations in this region, thus shap-
ing the genetic diversity of Pleurodema at the levels of popu-
lations and species. To our knowledge, this is the first time
that support for Caatinga habitat shifts and interactions with
the major wet forests in the continent has come directly
from Caatinga taxa.
ACKNOWLEDGEMENTS
We thank Manolo Perez for help with ABC, Jos�e Pombal Jr,
Marcelo N�apoli and Adrian Garda for donation of samples,
and ICMBio for collecting permits (#30512). P.H. Valdujo,
R. Recoder, M. Teixeira Jr, J. M. Guellere, D. Pavan, M.
Sena, F. Dal Vechio and J. Cassimiro, helped in the field.
The following agencies provided financial support: Fundac�~aoGrupo Botic�ario de Protec�~ao �a Natureza (grant #0909_20112
to M.T.C.T.), S~ao Paulo Research Foundation (FAPESP)
(grants #2012/50255-2 to J.A., #2003/10335-8 and #2011/
50146-6 to M.T.R., #2013/50741-7 to C.F.B.H., and fellow-
ships #2011/51392-0 and #2012/06611-9 to M.T.C.T.), Pro-
grama Nacional de Incentivo a Investigadores from the
Consejo Nacional de Ciencia y Tecnolog�ıa (PRONII, CONA-
CYT, Paraguay) (fellowship to F.B.), Coordenac�~ao de Aper-
feic�oamento de Pessoal de N�ıvel Superior (CAPES, Brazil)
(fellowship to F.B.), Fundac�~ao para a Ciencia e a Tecnologia
(FCT, Portugal) (grant SFRH/BPD/87721/2012 to FS) and
CNPq (fellowships to M.T.R. and C.F.B.H.).
REFERENCES
Arz, H.W., P€atzold, J. & Wefer, G. (1998) Correlated millen-
nial-scale changes in surface hydrography and terrigenous
sediment yield inferred from last-glacial marine deposits
off northeastern Brazil. Quaternary Research, 50,
157–166.Auler, A.S. & Smart, P.L. (2001) Late Quaternary paleocli-
mate in semiarid northeastern Brazil from U-series dating
of travertine and water-table speleothems. Quaternary
Research, 55, 159–167.Auler, A.S., Wang, X., Edwards, R.L., Cheng, H., Cristalli,
P.S., Smart, P.L. & Richards, D.A. (2004) Quaternary eco-
logical and geomorphic changes associated with rainfall
events in presently semi-arid northeastern Brazil. Journal
of Quaternary Science, 19, 693–701.Barton, N.H. & Hewitt, G.M. (1985) Analysis of hybrid
zones. Annual Review of Ecology and Systematics, 16,
113–148.Batalha-Filho, H., Fjelds�a, J., Fabre, P.-H. & Miyaki, C.Y.
(2013) Connections between the Atlantic and the Amazo-
nian forest avifaunas represent distinct historical events.
Journal of Ornithology, 154, 41–50.Behling, H., Arz, H.W., P€atzold, J. & Wefer, G. (2000) Late
Quaternary vegetational and climate dynamics in north-
eastern Brazil, inferences from marine core GeoB 3104-1.
Quaternary Science Reviews, 19, 981–994.Bonow, J.M., Japsen, P., Green, P.F., Cobbold, P.R., Pedreira,
A.J., Lilletveit, R. & Chiossi, D. (2009) Post-rift landscape
development of north-east Brazil. Geological Survey of Den-
mark and Greenland Bulletin, 17, 81–84.Camardelli, M. & Napoli, M.F. (2012) Amphibian conserva-
tion in the Caatinga biome and semiarid region of Brazil.
Herpetologica, 68, 31–47.Carnaval, A.C. & Bates, J.M. (2007) Amphibian DNA shows
marked genetic structure and tracks Pleistocene climate
change in northeastern Brazil. Evolution, 61, 2942–2957.Cole, M.M. (1960) Cerrado, caatinga and pantanal: the dis-
tribution and origin of the savanna vegetation of Brazil.
Geographical Journal, 126, 168–179.Collevatti, R.G., Terribile, L.C., de Oliveira, G., Lima-Ribeiro,
M.S., Nabout, J.C., Rangel, T.F. & Diniz-Filho, J.A.F.
Journal of Biogeographyª 2016 John Wiley & Sons Ltd
10
M. T. C. Thom�e et al.

(2013) Drawbacks to palaeodistribution modelling: the
case of South American seasonally dry forests. Journal of
Biogeography, 40, 345–358.Costa, L.P. (2003) The historical bridge between the Amazon
and the Atlantic Forest of Brazil: a study of molecular
phylogeography with small mammals. Journal of Biogeogra-
phy, 30, 71–86.Earl, D.A. & vonHoldt, B.M. (2012) STRUCTURE HAR-
VESTER: a website and program for visualizing STRUC-
TURE output and implementing the Evanno method.
Conservation Genetics Resources, 4, 359–361.Evanno, G., Regnaut, S. & Goudet, J. (2005) Detecting the
number of clusters of individuals using the software
structure: a simulation study. Molecular Ecology, 14,
2611–2620.Excoffier, L. & Lischer, H.E. (2010) Arlequin suite ver 3.5: a
new series of programs to perform population genetics
analyses under Linux and Windows. Molecular Ecology
Resources, 10, 564–567.Faivovich, J., Ferraro, D.P., Basso, N.G., Haddad, C.F.,
Rodrigues, M.T., Wheeler, W.C. & Lavilla, E.O. (2012) A
phylogenetic analysis of Pleurodema (Anura: Leptodactyli-
dae: Leiuperinae) based on mitochondrial and nuclear
gene sequences, with comments on the evolution of anu-
ran foam nests. Cladistics, 28, 460–482.Faria, M.B., Nascimento, F.F., de Oliveira, J.A. & Bonvicino,
C.R. (2013) Biogeographic determinants of genetic diversi-
fication in the mouse opossum Gracilinanus agilis (Didel-
phimorphia: Didelphidae). Journal of Heredity, 104, 613–626.
Felsenstein, J. (1989) Phylip – phylogeny inference package
(Version 3.2). Cladistics, 5, 164–166.Grant, W.S. (2015) Problems and cautions with sequence
mismatch analysis and Bayesian skyline plots to infer his-
torical demography. Journal of Heredity, 106, 333–346.Guedes, T.B., Sawaya, R.J. & Nogueira, C. (2014) Biogeogra-
phy, vicariance and conservation of snakes of the neglected
and endangered Caatinga region, north-eastern Brazil.
Journal of Biogeography, 41, 919–931.Guillot, G., Mortier, F. & Estoup, A. (2005) Geneland: a
computer package for landscape genetics. Molecular Ecol-
ogy Notes, 5, 712–715.Hartwig, W.C. & Cartelle, C. (1996) A complete skeleton of
the giant South American primate Protopithecus. Nature,
381, 307–311.Hickerson, M.J., Stahl, E. & Takebayashi, N. (2007) msBayes:
pipeline for testing comparative phylogeographic histories
using hierarchical approximate Bayesian computation.
BMC Bioinformatics, 8, 268.
Hudson, R.R. (2002) Generating samples under a Wright-
Fisher neutral model of genetic variation. Bioinformatics,
18, 337–338.Jakobsson, M. & Rosenberg, N.A. (2007) CLUMPP: a cluster
matching and permutation program for dealing with label
switching and multimodality in analysis of population
structure. Bioinformatics, 23, 1801–1806.
Jennerjahn, T.C., Ittekkot, V., Arz, H.W., Behling, H.,
P€atzold, J. & Wefer, G. (2004) Asynchronous terrestrial
and marine signals of climate change during Heinrich
events. Science, 306, 2236–2239.Jungfer, K.-H., Faivovich, J., Padial, J.M. et al. (2013) System-
atics of spiny-backed treefrogs (Hylidae: Osteocephalus): an
Amazonian puzzle. Zoologica Scripta, 42, 351–380.Leal, I.R., da Silva, J.M.C., Tabarelli, M. & Lacher, T.E., Jr
(2005) Changing the course of biodiversity conservation in
the Caatinga of northeastern Brazil. Conservation Biology,
19, 701–706.Librado, P. & Rozas, J. (2009) DnaSP v5: a software for com-
prehensive analysis of DNA polymorphism data. Bioinfor-
matics, 25, 1451–1452.Loebmann, D. & Haddad, C.F.B. (2010) Amphibians and
reptiles from a highly diverse area of the Caatinga domain:
composition and conservation implications. Biota Neotrop-
ica, 10, 227–256.Maciel, D.B. & Nunes, I. (2010) A new species of four-eyed
frog genus Pleurodema Tschudi, 1838 (Anura: Leiuperidae)
from the rock meadows of Espinhac�o range, Brazil. Zoo-
taxa, 2640, 53–61.Magalh~aes, I.L., Oliveira, U., Santos, F.R., Vidigal, T.H.,
Brescovit, A.D. & Santos, A.J. (2014) Strong spatial struc-
ture, Pliocene diversification and cryptic diversity in the
Neotropical dry forest spider Sicarius cariri. Molecular
Ecology, 23, 5323–5336.Mantel, N. (1967) The detection of disease clustering and a
generalized regression approach. Cancer Research, 27, 209–220.
Mayle, F.E. (2004) Assessment of the Neotropical dry forest
refugia hypothesis in the light of palaeoecological data and
vegetation model simulations. Journal of Quaternary
Science, 19, 713–720.Nascimento, F.F., Lazar, A., Menezes, A.N., da Matta Durans,
A., Moreira, J.C., Salazar-Bravo, J., D’Andrea, P.S. & Bon-
vicino, C.R. (2013) The role of historical barriers in the
diversification processes in open vegetation formations
during the Miocene/Pliocene using an ancient rodent lin-
eage as a model. PLoS ONE, 8, e61924.
de Oliveira, P.E., Barreto, A.M.F. & Suguio, K. (1999) Late
Pleistocene/Holocene climatic and vegetational history of
the Brazilian caatinga: the fossil dunes of the middle S~ao
Francisco River. Palaeogeography, Palaeoclimatology,
Palaeoecology, 152, 319–337.Pelletier, T.A. & Carstens, B.C. (2014) Model choice for phy-
logeographic inference using a large set of models. Molecu-
lar Ecology, 23, 3028–3043.Pennington, R.T., Prado, D.E. & Pendry, C.A. (2000)
Neotropical seasonally dry forests and Quaternary vegeta-
tion changes. Journal of Biogeography, 27, 261–273.Pinheiro, F., Cozzolino, S., Draper, D., de Barros, F., F�elix,
L.P., Fay, M.F. & Palma-Silva, C. (2014) Rock outcrop
orchids reveal the genetic connectivity and diversity of
inselbergs of northeastern Brazil. BMC Evolutionary Biol-
ogy, 14, 49.
Journal of Biogeographyª 2016 John Wiley & Sons Ltd
11
Past forest invasions shaped Caatinga diversity
Prado, D.E. & Gibbs, P.E. (1993) Patterns of species distribu-
tions in the dry seasonal forests of South America. Annals
of the Missouri Botanical Garden, 80, 902–927.Pritchard, J.K., Stephens, M. & Donnelly, P. (2000) Inference
of population structure using multilocus genotype data.
Genetics, 155, 945–959.de Queiroz, L.P. (2006) The Brazilian caatinga: phytogeo-
graphical patterns inferred from distribution data of the
Leguminosae. Neotropical savannas and seasonally dry for-
ests: plant diversity, biogeography and conservation (ed. by
R. T Pennington, G.P. Lewis and J.A. Ratter), pp. 121–157, CRC Press, Boca Raton, FL.
Roberto, I.J., Brito, L. & Thom�e, M.T.C. (2014) A new spe-
cies of Rhinella (Anura: Bufonidae) from northeastern Bra-
zil. South American Journal of Herpetology, 9, 190–199.Rodrigues, M.T. (1996) Lizards, snakes, and amphisbaenians
from the Quaternary sand dunes of the middle Rio S~ao
Francisco, Bahia, Brazil. Journal of Herpetology, 30, 513–523.Rodrigues, M.T., de Freitas, M.A., Santos Silva, T.F. & Vi~na
Bertolotto, C.E. (2006) A new species of lizard genus
Enyalius (Squamata, Leiosauridae) from the highlands of
Chapada Diamantina, State of Bahia, Brazil, with a key to
species. Phyllomedusa, 5, 11–24.Sarmiento, G. (1975) The dry plant formations of South
America and their floristic connections. Journal of Biogeog-
raphy, 2, 233–251.Sobral-Souza, T., Lima-Ribeiro, M.S. & Solferini, V.N. (2015)
Biogeography of Neotropical Rainforests: past connections
between Amazon and Atlantic Forest detected by ecological
niche modeling. Evolutionary Ecology, 29, 643–655.Stannard, B.L. (1995) Flora of the Pico das Almas, Chapada
Diamantina – Bahia, Brazil. University of Chicago Press,
Chicago.
Stute, M., Forster, M., Frischkorn, H., Serejo, A., Clark, J.F.,
Schlosser, P., Broecker, W.S. & Bonani, G. (1995) Cooling
of tropical Brazil (5°C) during the last glacial maximum.
Science, 269, 379–383.Sunnucks, P. (2000) Efficient genetic markers for population
biology. Trends in Ecology and Evolution, 15, 199–203.Thom�e, M.T.C., Alexandrino, J., Lopes, S., Haddad, C.F.B. &
Sequeira, F. (2014) Development and characterization of
microsatellite markers for Brazilian four-eyed frogs (genus
Pleurodema) endemic to the Caatinga biome. Genetics and
Molecular Research, 13, 1604–1608.Turchetto-Zolet, A.C., Pinheiro, F., Salgueiro, F. & Palma-
Silva, C. (2013) Phylogeographical patterns shed light on
evolutionary process in South America. Molecular Ecology,
22, 1193–1213.Van Oosterhout, C., Hutchinson, W.F., Wills, D.P. & Ship-
ley, P. (2004) micro–checker: software for identifying
and correcting genotyping errors in microsatellite data.
Molecular Ecology Notes, 4, 535–538.Wang, X., Auler, A.S., Edwards, R.L., Cheng, H., Cristalli,
P.S., Smart, P.L., Richards, D.A. & Shen, C.-C. (2004) Wet
periods in northeastern Brazil over the past 210 kyr linked
to distant climate anomalies. Nature, 432, 740–743.Werneck, F.P. & Colli, G.R. (2006) The lizard assemblage
from Seasonally Dry Tropical Forest enclaves in the Cer-
rado biome, Brazil, and its association with the Pleis-
tocenic Arc. Journal of Biogeography, 33, 1983–1992.Werneck, F.P., Costa, G.C., Colli, G.R., Prado, D.E. & Sites,
J.W., Jr (2011) Revisiting the historical distribution of Sea-
sonally Dry Tropical Forests: new insights based on
palaeodistribution modelling and palynological evidence.
Global Ecology and Biogeography, 20, 272–288.Werneck, F.P., Gamble, T., Colli, G.R., Rodrigues, M.T. &
Sites, J.W., Jr (2012) Deep diversification and long term
persistence in the south American ‘dry diagonal’: integrat-
ing continent-wide phylogeography and distribution mod-
eling of geckos. Evolution, 66, 3014–3034.Werneck, F.P., Leite, R.N., Geurgas, S.R. & Rodrigues, M.T.
(2015) Biogeographic history and cryptic diversity of saxi-
colous Tropiduridae lizards endemic to the semiarid Caa-
tinga. BMC Evolutionary Biology, 15, 94.
SUPPORTING INFORMATION
Additional Supporting Information may be found in the
online version of this article:
Appendix S1 Information on sampled individuals and
microsatellite genotypes.
Appendix S2 Analytical details for ABC.
Appendix S3 Evanno’s table for structure analyses.
DATA ACCESSIBILITY
COI sequences available in GenBank (accession numbers
KT991845 - KT992043)
BIOSKETCH
Maria Tereza C. Thom�e is interested in empirical phylo-
geography of Neotropical organisms, with emphasis on
investigation of the evolutionary mechanisms behind diversi-
fication of endemic species complexes in widespread biomes.
All authors share a common interest in general evolutionary
biology and biogeography.
Author contributions: M.T.C.T. and J.A. designed the study;
M.T.C.T., F.B., C.F.B.H. and M.T.R. collected samples in the
field; M.T.C.T., F.B. and F.S. produced the genetic data;
M.T.C.T. and B.C. analysed the data; M.T.C.T. led the writ-
ing. All authors read and approved the final version of the
manuscript.
Editor: Liliana Katinas
Journal of Biogeographyª 2016 John Wiley & Sons Ltd
12
M. T. C. Thom�e et al.