recruiting trends brie 2 hiring by sector...
TRANSCRIPT
1Recruiting Trends 2017-18
Brief 2: Hiring by Sector & RegionRECRUITING TRENDS 2017-18
47th Edition
Recruiting Trends 2017—2018 is published by Career Services and the Collegiate Employment Research Institute and copyrighted, © 2017-2018, by Michigan State University. All rights reserved. This electronic version is for individual use only. No part of this electronic report may be reproduced in any form by any electronic or mechanical means (including photocopying, recording, or information storage and retrieval) without written permission from the Institute. Users are not permitted to mount this file on any network servers or distribute this report by email without written permission from the Institute. Material from this report can be used in classrooms and newsletters with proper citation of Michigan State University and the Collegiate Employment Research Institute.
BRIEF 3Starting Salaries
Key findings from 2017-18 are presented in this research brief. We have broken the release of employer information into a series of short briefs that will be made available over the next six weeks. You can download the briefs from the Collegiate Employment Research Institute.
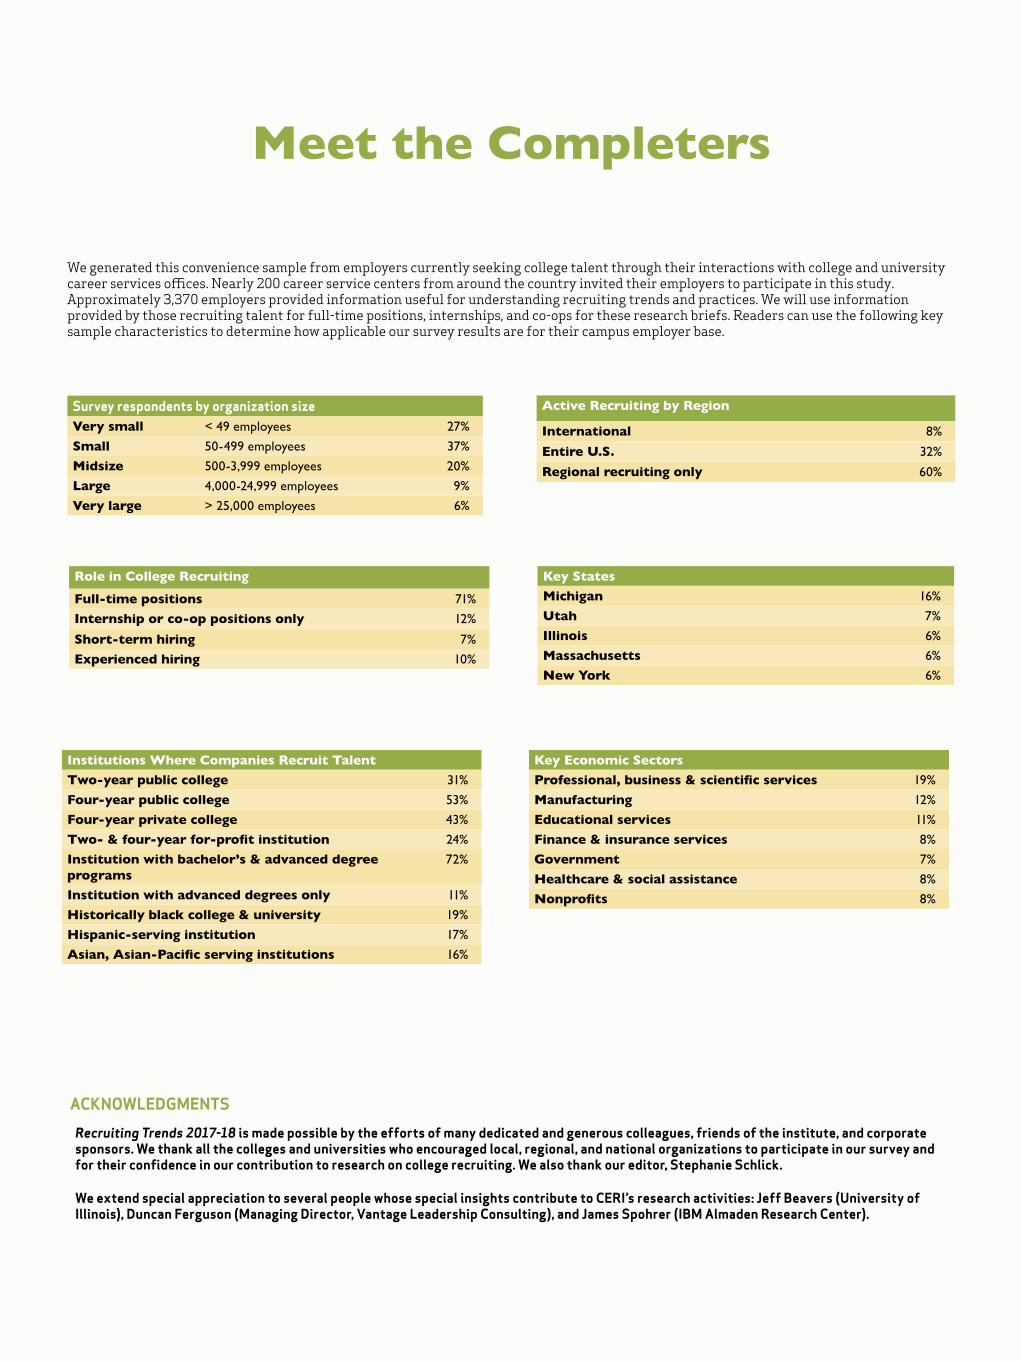
Role in College RecruitingFull-time positions 71%
Internship or co-op positions only 12%
Short-term hiring 7%
Experienced hiring 10%
Key Economic SectorsProfessional, business & scientific services 19%
Manufacturing 12%
Educational services 11%
Finance & insurance services 8%
Government 7%
Healthcare & social assistance 8%
Nonprofits 8%
Key StatesMichigan 16%
Utah 7%
Illinois 6%
Massachusetts 6%
New York 6%
Institutions Where Companies Recruit TalentTwo-year public college 31%
Four-year public college 53%
Four-year private college 43%
Two- & four-year for-profit institution 24%
Institution with bachelor’s & advanced degree programs
72%
Institution with advanced degrees only 11%
Historically black college & university 19%
Hispanic-serving institution 17%
Asian, Asian-Pacific serving institutions 16%
Active Recruiting by Region
International 8%
Entire U.S. 32%
Regional recruiting only 60%
Meet the Completers
We generated this convenience sample from employers currently seeking college talent through their interactions with college and university career services offices. Nearly 200 career service centers from around the country invited their employers to participate in this study. Approximately 3,370 employers provided information useful for understanding recruiting trends and practices. We will use information provided by those recruiting talent for full-time positions, internships, and co-ops for these research briefs. Readers can use the following key sample characteristics to determine how applicable our survey results are for their campus employer base.
ACKNOWLEDGMENTS
Recruiting Trends 2017-18 is made possible by the efforts of many dedicated and generous colleagues, friends of the institute, and corporate sponsors. We thank all the colleges and universities who encouraged local, regional, and national organizations to participate in our survey and for their confidence in our contribution to research on college recruiting. We also thank our editor, Stephanie Schlick.
We extend special appreciation to several people whose special insights contribute to CERI’s research activities: Jeff Beavers (University of Illinois), Duncan Ferguson (Managing Director, Vantage Leadership Consulting), and James Spohrer (IBM Almaden Research Center).
Survey respondents by organization sizeVery small < 49 employees 27%
Small 50-499 employees 37%
Midsize 500-3,999 employees 20%
Large 4,000-24,999 employees 9%
Very large > 25,000 employees 6%
1Recruiting Trends 2017-18
Brief 2: Hiring by Sector & Region
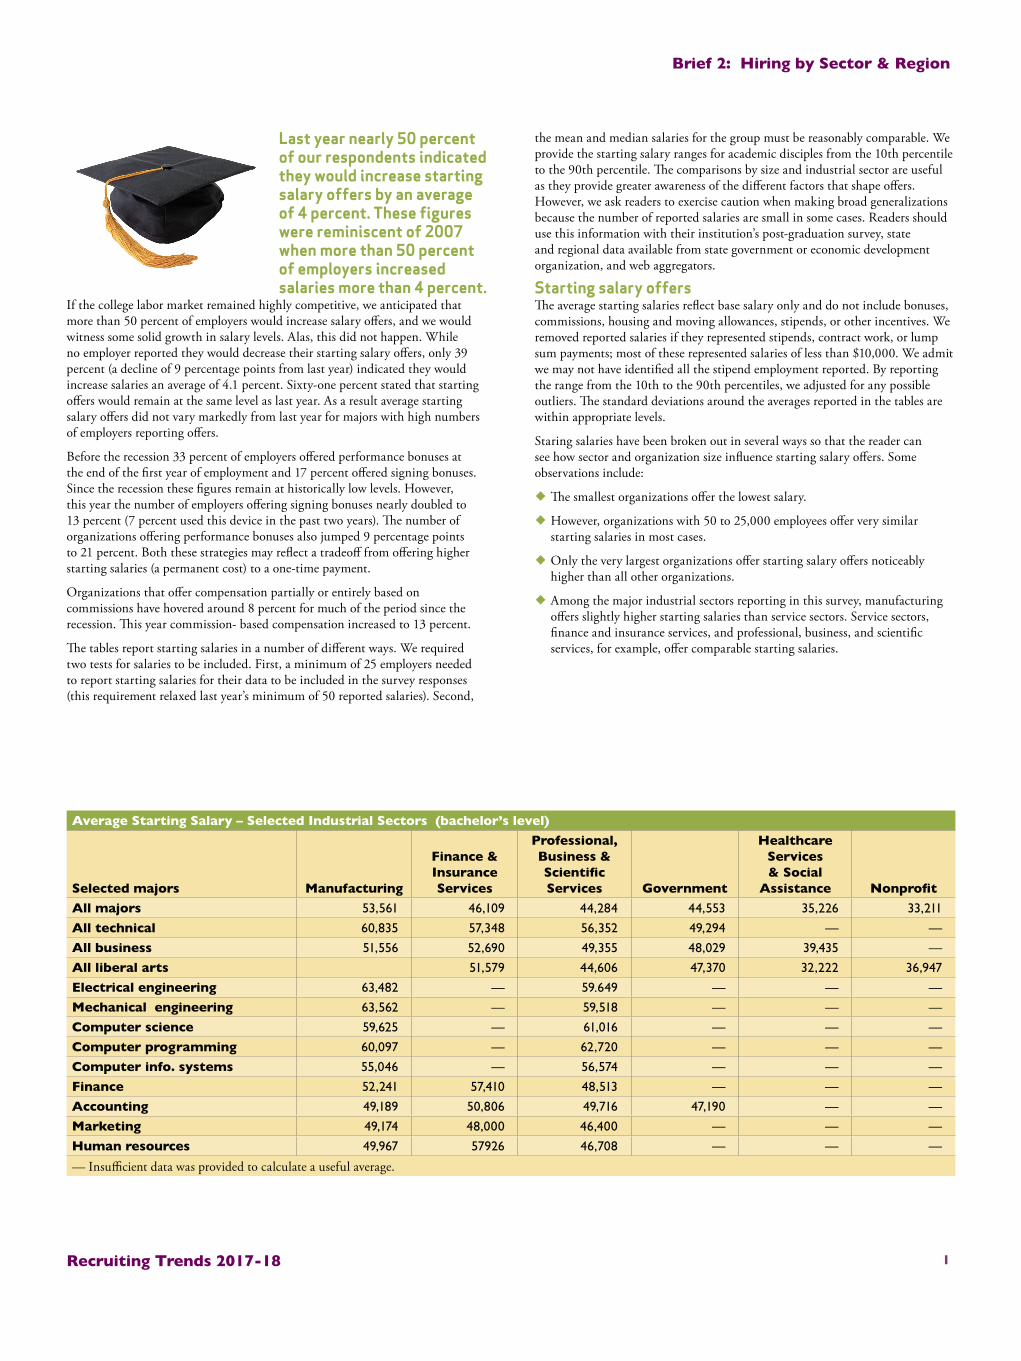
Last year nearly 50 percent of our respondents indicated they would increase starting salary offers by an average of 4 percent. These figures were reminiscent of 2007 when more than 50 percent of employers increased salaries more than 4 percent.
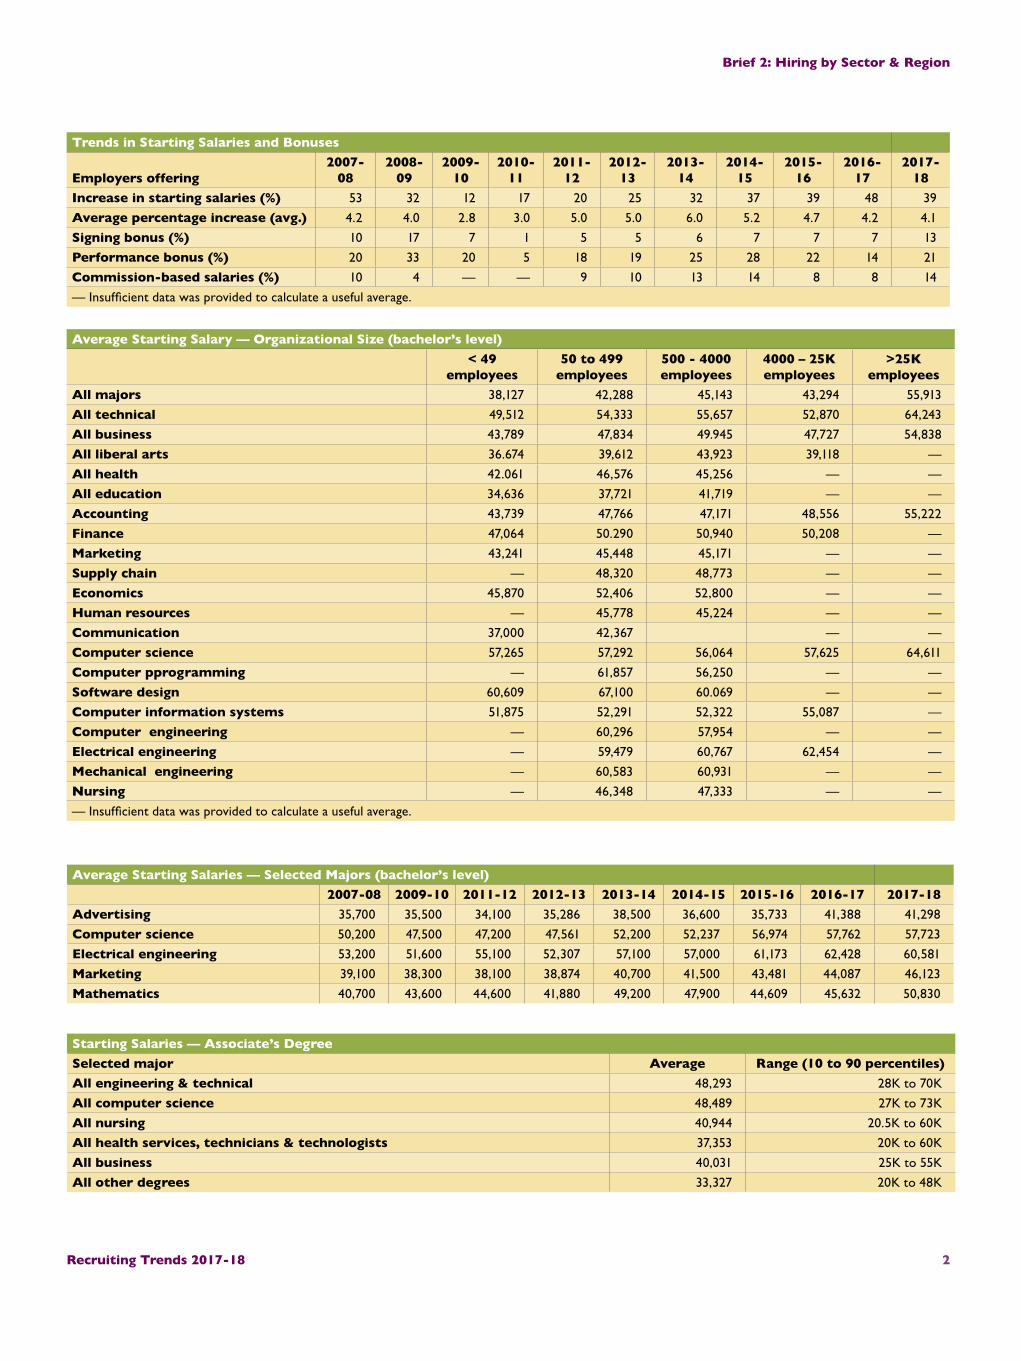
If the college labor market remained highly competitive, we anticipated that more than 50 percent of employers would increase salary offers, and we would witness some solid growth in salary levels. Alas, this did not happen. While no employer reported they would decrease their starting salary offers, only 39 percent (a decline of 9 percentage points from last year) indicated they would increase salaries an average of 4.1 percent. Sixty-one percent stated that starting offers would remain at the same level as last year. As a result average starting salary offers did not vary markedly from last year for majors with high numbers of employers reporting offers.
Before the recession 33 percent of employers offered performance bonuses at the end of the first year of employment and 17 percent offered signing bonuses. Since the recession these figures remain at historically low levels. However, this year the number of employers offering signing bonuses nearly doubled to 13 percent (7 percent used this device in the past two years). The number of organizations offering performance bonuses also jumped 9 percentage points to 21 percent. Both these strategies may reflect a tradeoff from offering higher starting salaries (a permanent cost) to a one-time payment.
Organizations that offer compensation partially or entirely based on commissions have hovered around 8 percent for much of the period since the recession. This year commission- based compensation increased to 13 percent.
The tables report starting salaries in a number of different ways. We required two tests for salaries to be included. First, a minimum of 25 employers needed to report starting salaries for their data to be included in the survey responses (this requirement relaxed last year’s minimum of 50 reported salaries). Second,
the mean and median salaries for the group must be reasonably comparable. We provide the starting salary ranges for academic disciples from the 10th percentile to the 90th percentile. The comparisons by size and industrial sector are useful as they provide greater awareness of the different factors that shape offers. However, we ask readers to exercise caution when making broad generalizations because the number of reported salaries are small in some cases. Readers should use this information with their institution’s post-graduation survey, state and regional data available from state government or economic development organization, and web aggregators.
Starting salary offersThe average starting salaries reflect base salary only and do not include bonuses, commissions, housing and moving allowances, stipends, or other incentives. We removed reported salaries if they represented stipends, contract work, or lump sum payments; most of these represented salaries of less than $10,000. We admit we may not have identified all the stipend employment reported. By reporting the range from the 10th to the 90th percentiles, we adjusted for any possible outliers. The standard deviations around the averages reported in the tables are within appropriate levels.
Staring salaries have been broken out in several ways so that the reader can see how sector and organization size influence starting salary offers. Some observations include:
¿ The smallest organizations offer the lowest salary.
¿ However, organizations with 50 to 25,000 employees offer very similar starting salaries in most cases.
¿ Only the very largest organizations offer starting salary offers noticeably higher than all other organizations.
¿ Among the major industrial sectors reporting in this survey, manufacturing offers slightly higher starting salaries than service sectors. Service sectors, finance and insurance services, and professional, business, and scientific services, for example, offer comparable starting salaries.
Average Starting Salary – Selected Industrial Sectors (bachelor’s level)
Selected majors Manufacturing
Finance & Insurance Services
Professional, Business & Scientific Services Government
Healthcare Services & Social
Assistance NonprofitAll majors 53,561 46,109 44,284 44,553 35,226 33,211
All technical 60,835 57,348 56,352 49,294 — —
All business 51,556 52,690 49,355 48,029 39,435 —
All liberal arts 51,579 44,606 47,370 32,222 36,947
Electrical engineering 63,482 — 59.649 — — —
Mechanical engineering 63,562 — 59,518 — — —
Computer science 59,625 — 61,016 — — —
Computer programming 60,097 — 62,720 — — —
Computer info. systems 55,046 — 56,574 — — —
Finance 52,241 57,410 48,513 — — —
Accounting 49,189 50,806 49,716 47,190 — —
Marketing 49,174 48,000 46,400 — — —
Human resources 49,967 57926 46,708 — — —
— Insufficient data was provided to calculate a useful average.
2Recruiting Trends 2017-18
Brief 2: Hiring by Sector & Region
Trends in Starting Salaries and Bonuses
Employers offering2007-
082008-
092009-
102010-
112011-
122012-
132013-
142014-
152015-
162016-
172017-
18Increase in starting salaries (%) 53 32 12 17 20 25 32 37 39 48 39
Average percentage increase (avg.) 4.2 4.0 2.8 3.0 5.0 5.0 6.0 5.2 4.7 4.2 4.1
Signing bonus (%) 10 17 7 1 5 5 6 7 7 7 13
Performance bonus (%) 20 33 20 5 18 19 25 28 22 14 21
Commission-based salaries (%) 10 4 — — 9 10 13 14 8 8 14
— Insufficient data was provided to calculate a useful average.
Average Starting Salary — Organizational Size (bachelor’s level)< 49
employees50 to 499
employees500 - 4000 employees
4000 – 25K employees
>25K employees
All majors 38,127 42,288 45,143 43,294 55,913
All technical 49,512 54,333 55,657 52,870 64,243
All business 43,789 47,834 49.945 47,727 54,838
All liberal arts 36.674 39,612 43,923 39,118 —
All health 42.061 46,576 45,256 — —
All education 34,636 37,721 41,719 — —
Accounting 43,739 47,766 47,171 48,556 55,222
Finance 47,064 50.290 50,940 50,208 —
Marketing 43,241 45,448 45,171 — —
Supply chain — 48,320 48,773 — —
Economics 45,870 52,406 52,800 — —
Human resources — 45,778 45,224 — —
Communication 37,000 42,367 — —
Computer science 57,265 57,292 56,064 57,625 64,611
Computer pprogramming — 61,857 56,250 — —
Software design 60,609 67,100 60.069 — —
Computer information systems 51,875 52,291 52,322 55,087 —
Computer engineering — 60,296 57,954 — —
Electrical engineering — 59,479 60,767 62,454 —
Mechanical engineering — 60,583 60,931 — —
Nursing — 46,348 47,333 — —
— Insufficient data was provided to calculate a useful average.
Average Starting Salaries — Selected Majors (bachelor’s level)2007-08 2009-10 2011-12 2012-13 2013-14 2014-15 2015-16 2016-17 2017-18
Advertising 35,700 35,500 34,100 35,286 38,500 36,600 35,733 41,388 41,298
Computer science 50,200 47,500 47,200 47,561 52,200 52,237 56,974 57,762 57,723
Electrical engineering 53,200 51,600 55,100 52,307 57,100 57,000 61,173 62,428 60,581
Marketing 39,100 38,300 38,100 38,874 40,700 41,500 43,481 44,087 46,123
Mathematics 40,700 43,600 44,600 41,880 49,200 47,900 44,609 45,632 50,830
Starting Salaries — Associate’s DegreeSelected major Average Range (10 to 90 percentiles)All engineering & technical 48,293 28K to 70K
All computer science 48,489 27K to 73K
All nursing 40,944 20.5K to 60K
All health services, technicians & technologists 37,353 20K to 60K
All business 40,031 25K to 55K
All other degrees 33,327 20K to 48K
3Recruiting Trends 2017-18
Brief 2: Hiring by Sector & Region
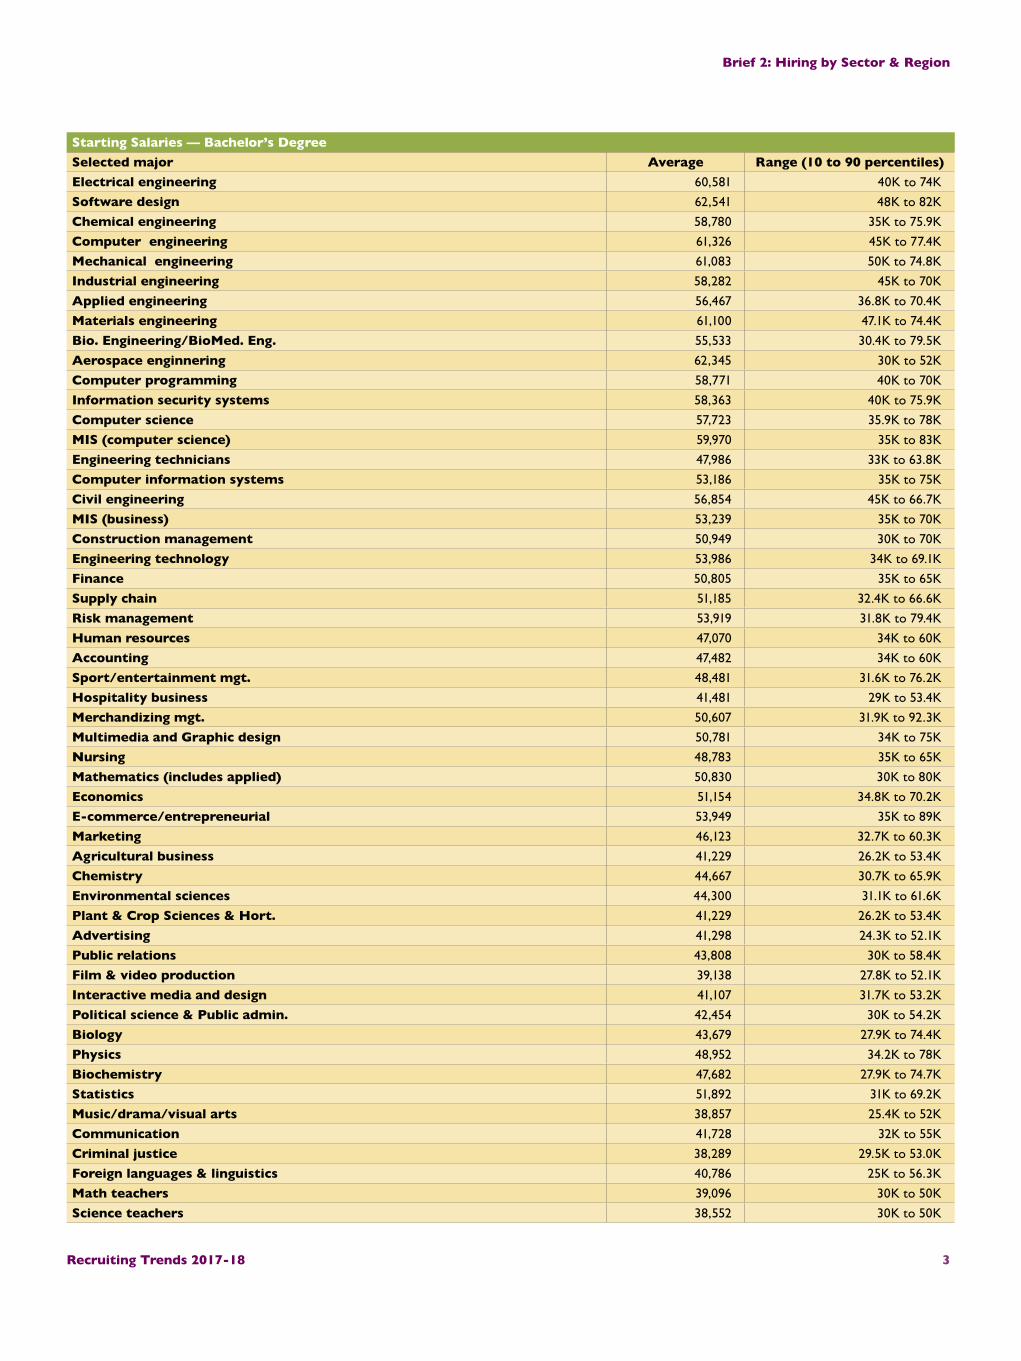
Starting Salaries — Bachelor’s DegreeSelected major Average Range (10 to 90 percentiles)Electrical engineering 60,581 40K to 74K
Software design 62,541 48K to 82K
Chemical engineering 58,780 35K to 75.9K
Computer engineering 61,326 45K to 77.4K
Mechanical engineering 61,083 50K to 74.8K
Industrial engineering 58,282 45K to 70K
Applied engineering 56,467 36.8K to 70.4K
Materials engineering 61,100 47.1K to 74.4K
Bio. Engineering/BioMed. Eng. 55,533 30.4K to 79.5K
Aerospace enginnering 62,345 30K to 52K
Computer programming 58,771 40K to 70K
Information security systems 58,363 40K to 75.9K
Computer science 57,723 35.9K to 78K
MIS (computer science) 59,970 35K to 83K
Engineering technicians 47,986 33K to 63.8K
Computer information systems 53,186 35K to 75K
Civil engineering 56,854 45K to 66.7K
MIS (business) 53,239 35K to 70K
Construction management 50,949 30K to 70K
Engineering technology 53,986 34K to 69.1K
Finance 50,805 35K to 65K
Supply chain 51,185 32.4K to 66.6K
Risk management 53,919 31.8K to 79.4K
Human resources 47,070 34K to 60K
Accounting 47,482 34K to 60K
Sport/entertainment mgt. 48,481 31.6K to 76.2K
Hospitality business 41,481 29K to 53.4K
Merchandizing mgt. 50,607 31.9K to 92.3K
Multimedia and Graphic design 50,781 34K to 75K
Nursing 48,783 35K to 65K
Mathematics (includes applied) 50,830 30K to 80K
Economics 51,154 34.8K to 70.2K
E-commerce/entrepreneurial 53,949 35K to 89K
Marketing 46,123 32.7K to 60.3K
Agricultural business 41,229 26.2K to 53.4K
Chemistry 44,667 30.7K to 65.9K
Environmental sciences 44,300 31.1K to 61.6K
Plant & Crop Sciences & Hort. 41,229 26.2K to 53.4K
Advertising 41,298 24.3K to 52.1K
Public relations 43,808 30K to 58.4K
Film & video production 39,138 27.8K to 52.1K
Interactive media and design 41,107 31.7K to 53.2K
Political science & Public admin. 42,454 30K to 54.2K
Biology 43,679 27.9K to 74.4K
Physics 48,952 34.2K to 78K
Biochemistry 47,682 27.9K to 74.7K
Statistics 51,892 31K to 69.2K
Music/drama/visual arts 38,857 25.4K to 52K
Communication 41,728 32K to 55K
Criminal justice 38,289 29.5K to 53.0K
Foreign languages & linguistics 40,786 25K to 56.3K
Math teachers 39,096 30K to 50K
Science teachers 38,552 30K to 50K
4Recruiting Trends 2017-18
Brief 2: Hiring by Sector & Region
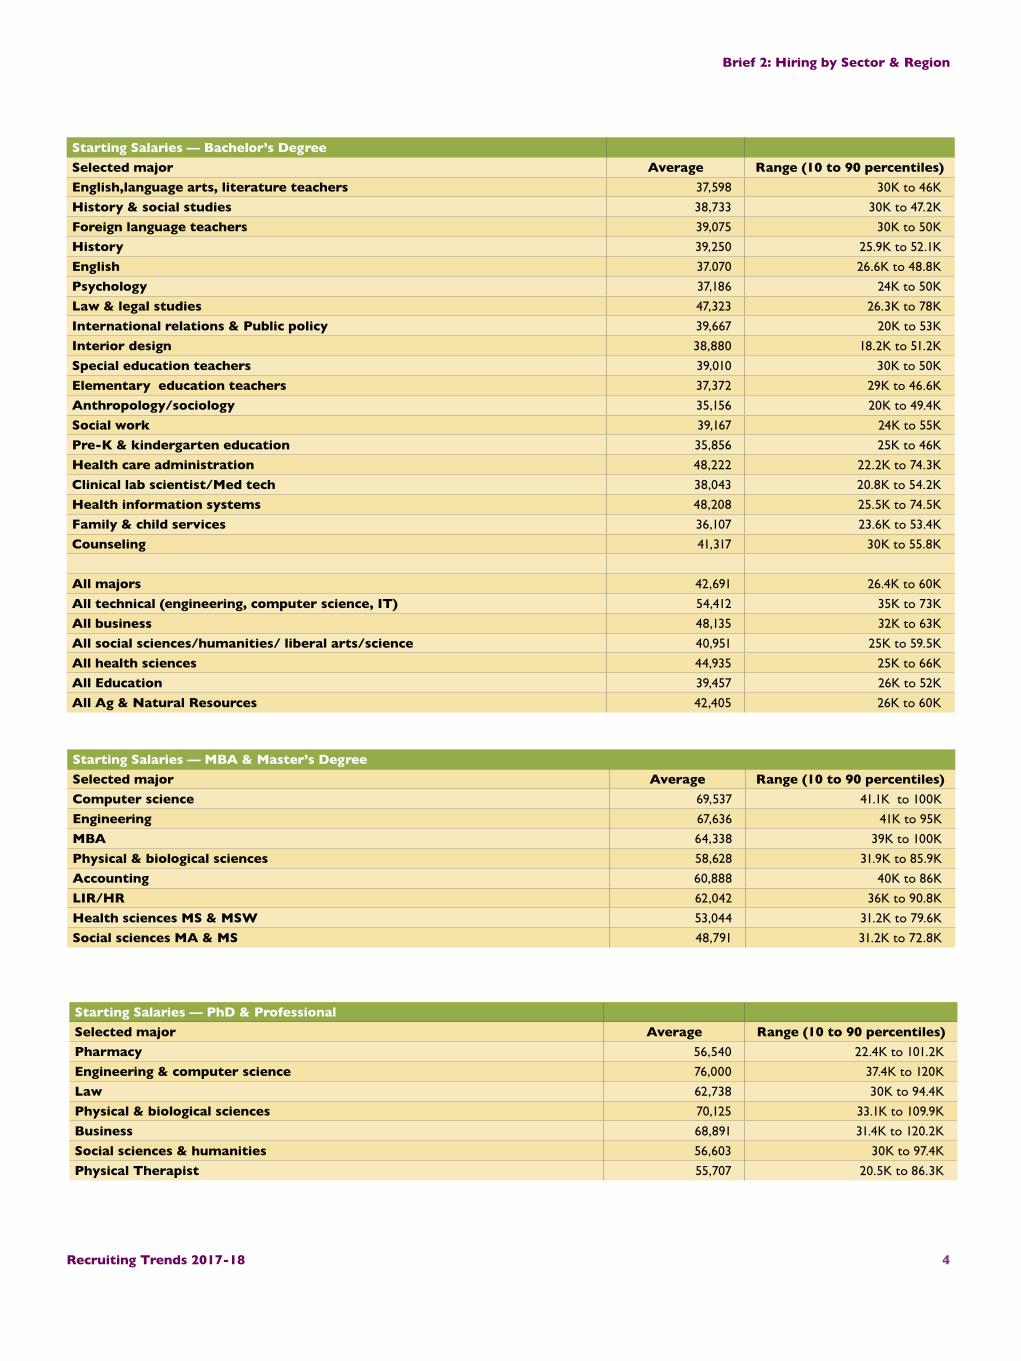
Starting Salaries — Bachelor’s DegreeSelected major Average Range (10 to 90 percentiles)English,language arts, literature teachers 37,598 30K to 46K
History & social studies 38,733 30K to 47.2K
Foreign language teachers 39,075 30K to 50K
History 39,250 25.9K to 52.1K
English 37.070 26.6K to 48.8K
Psychology 37,186 24K to 50K
Law & legal studies 47,323 26.3K to 78K
International relations & Public policy 39,667 20K to 53K
Interior design 38,880 18.2K to 51.2K
Special education teachers 39,010 30K to 50K
Elementary education teachers 37,372 29K to 46.6K
Anthropology/sociology 35,156 20K to 49.4K
Social work 39,167 24K to 55K
Pre-K & kindergarten education 35,856 25K to 46K
Health care administration 48,222 22.2K to 74.3K
Clinical lab scientist/Med tech 38,043 20.8K to 54.2K
Health information systems 48,208 25.5K to 74.5K
Family & child services 36,107 23.6K to 53.4K
Counseling 41,317 30K to 55.8K
All majors 42,691 26.4K to 60K
All technical (engineering, computer science, IT) 54,412 35K to 73K
All business 48,135 32K to 63K
All social sciences/humanities/ liberal arts/science 40,951 25K to 59.5K
All health sciences 44,935 25K to 66K
All Education 39,457 26K to 52K
All Ag & Natural Resources 42,405 26K to 60K
Starting Salaries — MBA & Master’s DegreeSelected major Average Range (10 to 90 percentiles)Computer science 69,537 41.1K to 100K
Engineering 67,636 41K to 95K
MBA 64,338 39K to 100K
Physical & biological sciences 58,628 31.9K to 85.9K
Accounting 60,888 40K to 86K
LIR/HR 62,042 36K to 90.8K
Health sciences MS & MSW 53,044 31.2K to 79.6K
Social sciences MA & MS 48,791 31.2K to 72.8K
Starting Salaries — PhD & ProfessionalSelected major Average Range (10 to 90 percentiles)Pharmacy 56,540 22.4K to 101.2K
Engineering & computer science 76,000 37.4K to 120K
Law 62,738 30K to 94.4K
Physical & biological sciences 70,125 33.1K to 109.9K
Business 68,891 31.4K to 120.2K
Social sciences & humanities 56,603 30K to 97.4K
Physical Therapist 55,707 20.5K to 86.3K