recruiting and retention: an overview of fy2011 and fy2012
TRANSCRIPT
CRS Report for CongressPrepared for Members and Committees of Congress
Recruiting and Retention: An Overview of FY2011 and FY2012 Results for Active and Reserve Component Enlisted Personnel
Lawrence Kapp Specialist in Military Manpower Policy
May 10, 2013
Congressional Research Service
7-5700 www.crs.gov
RL32965
Recruiting and Retention: An Overview of FY2011 and FY2012 Results
Congressional Research Service
Summary Congress has historically been quite interested in recruiting and retention of personnel in the nation’s Armed Forces, since maintaining a fully manned and capable workforce is a key component of military readiness. This report provides a brief overview of the recruiting and retention results for Active and Reserve Component enlisted personnel during FY2011 and FY2012. Both years were considered very strong for recruiting and retention in the Active and Reserve Components.
Recruiting and Retention Metrics
Recruiting performance for enlisted personnel is principally measured in terms of meeting quantity and quality goals. Quantity goals are based on the projected need for new personnel each service must bring in over the course of the year to meet its congressionally authorized end-strength. There are two principal quality goals: at least 90% of new recruits be high school diploma graduates and at least 60% score above average on the Armed Forces Qualification Test. Quality goals are only for recruits without any previous military service (“non-prior service”). Retention performance for enlisted personnel is principally measured by meeting one or more quantity goals. For the Active Components, quantity goals are based on career phase (for example, initial term, mid-career, and career) and are stated in numerical terms. For the Reserve Components, retention is tracked via overall attrition rates, which measure the ratio of people who leave in a given year. Reserve Component retention goals establish a maximum attrition rate or “ceiling” which should not be exceeded. They are stated in percentage terms and are not broken out by career phase.
Overview of FY2011 and FY2012 Results
In FY2011 and FY2012, all of the Active Components achieved their recruit quantity goals and recruit quality was very strong. Virtually all new recruits had high school diplomas, and nearly three-quarters scored above average on the Armed Forces Qualification Test. The Navy, Marine Corps, and Air Force experienced the highest recruit quality levels achieved since the beginning of the All-Volunteer Force in 1973. Retention also remained strong, with all of the Services close to or exceeding their goals. Nearly all of the Reserve Components met or exceeded their quantity goals, while quality remained high. The Army National Guard and the Army Reserve fell slightly short of their quantity goals in FY2011 and FY2012, respectively. All of the Reserve Components remained below their targeted attrition ceilings in FY2011 and FY2012. Despite generally strong recruiting and retention metrics, the Navy and Army Reserve were about 2% below their authorized end-strength at the end of FY2012, possibly indicating the need to set higher goals in the future.
Recruiting and Retention: An Overview of FY2011 and FY2012 Results
Congressional Research Service
Contents Recruiting ........................................................................................................................................ 2
Active Components ................................................................................................................... 2 Historical Context ............................................................................................................... 3
Reserve Components ................................................................................................................. 6 Historical Context ............................................................................................................... 7
Analysis ..................................................................................................................................... 9 Retention ........................................................................................................................................ 10
Active Components ................................................................................................................. 11 Reserve Components ............................................................................................................... 13 Analysis ................................................................................................................................... 13
Historical Perspective: The Post-Cold War Drawdown and Its Impact on Recruiting and Retention ..................................................................................................................................... 15
Options for Congress ..................................................................................................................... 17
Tables Table 1. Accession Data (Quantity) for Active Component Enlisted Personnel, FY2011
and FY2012 .................................................................................................................................. 3 Table 2. Accession Data (Quality) for Non-Prior Service Active Component Enlisted
Personnel, FY2011 and FY2012 ................................................................................................... 3 Table 3. Accession Data (Quantity) for Reserve Component Enlisted Personnel, FY2011
and FY2012 .................................................................................................................................. 6 Table 4. Accession Data (Quality) for Non-Prior Service Reserve Component Enlisted
Personnel, FY2011 and FY2012 ................................................................................................... 7 Table 5. Retention Data for Active Component Enlisted Personnel, FY2011 and FY2012 .......... 12 Table 6. Attrition Data for Reserve Component Enlisted Personnel, FY2011 and FY2012 .......... 13
Contacts Author Contact Information........................................................................................................... 18
Recruiting and Retention: An Overview of FY2011 and FY2012 Results
Congressional Research Service 1
ongress has historically been very interested in the recruiting and retention of personnel in the nation’s Armed Forces, as maintaining a fully manned and capable workforce is a key component of military readiness. Congress exercises a powerful influence on recruiting
and retention goals through its establishment of personnel strength levels for each of the active and reserve components. It influences the achievement of these goals primarily through setting military compensation levels (which may include recruiting and retention bonuses, educational benefits, and separation incentives), establishing criteria that affect eligibility for enlistment and retention (for example, age, cognitive, behavioral, and citizenship standards), and by authorizing and funding recruiting and retention programs (for example, providing for dedicated recruiters and career counselors, military entrance processing stations, market research, and advertising). Through its oversight powers, Congress also closely monitors the performance of the executive branch in managing the size and quality of the military workforce.
Since 2001, the United States has conducted major military operations which have dramatically increased the operations tempo of the military services, required the large scale mobilization of reservists, and resulted in significant battle casualties. These factors have been particularly applicable to the Army, Army Reserve, Army National Guard, Marine Corps, and Marine Corps Reserve, which have shouldered the bulk of the manpower burden associated with operations in Iraq and Afghanistan. Many observers expressed concern that these factors would lead to lower recruiting and retention rates and jeopardize the vitality of today’s all-volunteer military, particularly in the FY2005-FY2007 timeframe, when the Army had difficulty meeting its recruit quantity goals and began accepting lower quality recruits. However, starting in 2008 these concerns were alleviated by the more favorable recruiting and retention environment brought about by comparatively high unemployment rates in the civilian economy, by the improved security situation in Iraq, and by reduced recruiting goals for the Army and Marine Corps as both of those services completed major expansions.
Looking to the future, the ongoing withdrawal from Afghanistan scheduled to be largely complete by 2014, projected cuts in force structure,1 and continuing weakness in the labor market will likely contribute to a favorable environment for recruiting and retention over the next few years. After that, however, the situation is less clear. An economic recovery could make civilian work comparatively more attractive than military work, thereby making recruiting and retention more
1 In the FY2013 Budget Request, the Administration proposed reducing the end-strength of the Active and Reserve Components between FY2012 and 2017 by the following amounts: Army (-72,000), Navy (-6,200), Marine Corps (-20,000), Air Force (-4,200), Army National Guard (-5,000), Army Reserve (no change), Navy Reserve (-9,100), Marine Corps Reserve (no change), Air National Guard (-5,500), Air Force Reserve (-1,900). Proposed active and reserve component reductions were summarized the FY2013 Department of Defense Budget Overview document, pages 4-13 and 4-15, available at http://comptroller.defense.gov/defbudget/fy2013/FY2013_Budget_Request_Overview_Book.pdf. In response to this proposed drawdown, Congress included end-strength provisions in the FY2013 National Defense Authorization Act ( P.L. 112-239) which were generally consistent with the Administration request for FY2013, except that it did not fully accept the proposed reductions in end-strength for the Air Force and its reserve components. For the active components, section 401 of P.L. 112-239 reduced the Army end-strength for FY2013 to 552,100 (- 9,900 in comparison to the FY2012 authorized base end-strength), Marine Corps to 197,300 (-4,800 in comparison to FY2012 authorized end-strength), Navy to 322,700 (-3,000 in comparison to the FY2012 end-strength), Air Force to 329,460 (-3,340 in comparison to the FY2012 end-strength). In the FY2014 Budget Request, the Administration generally proposed continuing its drawdown plans from the previous year with the exception of the Navy, proposing instead to slightly increase its personnel strength. Where the FY2013 Budget Request had envisioned reducing the personnel strength of the Navy to 319,000 in FY2014, the FY2014 Budget Request proposed stabilizing the Navy at 323,600 in FY2014 and gradually increasing it to 326,100 by FY2018. The FY2014 request also abandoned plans to reduce the size of the Air National Guard, projecting a FY2018 end-strength of 105,300, essentially the same level as FY2013.
C
Recruiting and Retention: An Overview of FY2011 and FY2012 Results
Congressional Research Service 2
challenging. The current drawdown of the Army has led to lower recruiting goals for that service; but once complete it will need to increase these goals to stabilize the force at planned levels. Additionally, the experience of the post-Cold War drawdown raises some cautionary flags: if a drawdown is carried out in such a way as to undermine job satisfaction or to create a perception of limited career prospects, it could have a negative effect on recruiting and retention.
Recruiting Recruiting has been called the life blood of the military. Without a robust ability to bring new members into the military, the services would lack sufficient manpower to carry out mission essential tasks in the near term and would lack a sufficient pool of entry-level personnel to develop into the mid-level and upper-level leaders of the future. To protect against this, the Active and Reserve Components set goals for new recruit “accessions”2 each fiscal year. Officer and enlisted goals are set separately. There are both “quantity”3 and “quality”4 goals for the enlisted force.
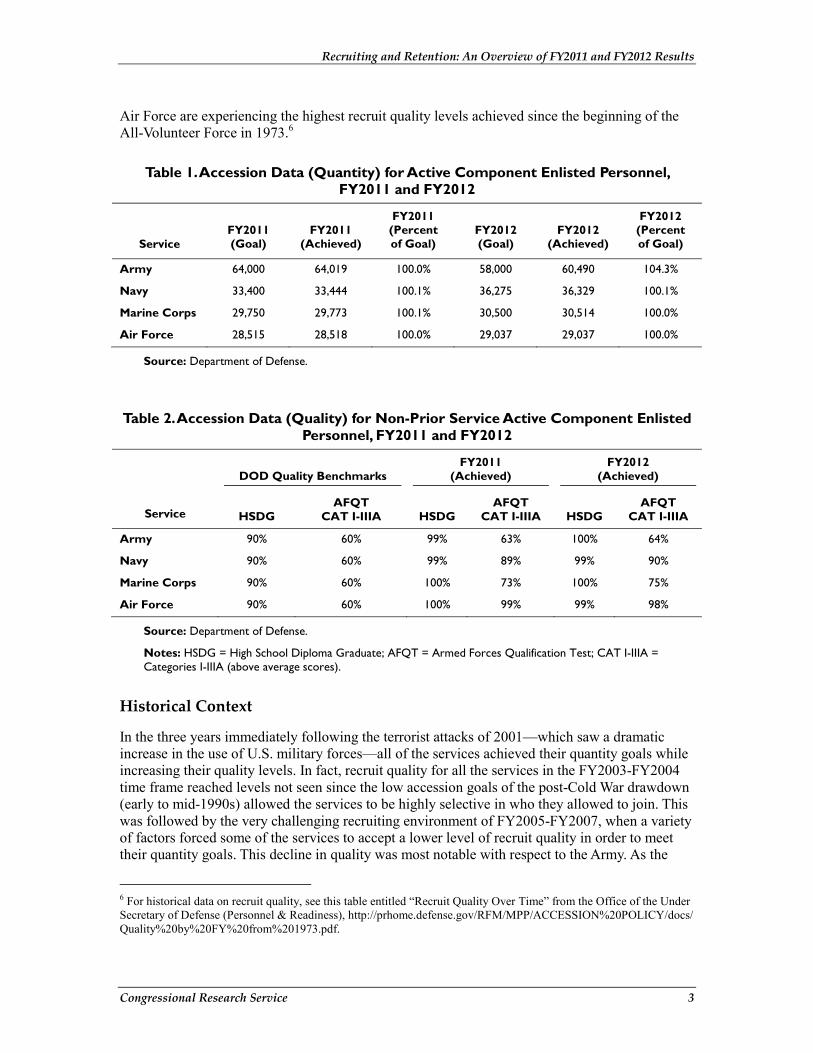
Active Components The recruiting data presented in Table 1 below show that all of the Active Components met their enlisted accession quantity goals in both FY2011 and FY2012. The recruiting data presented in Table 2 show the performance of the Active Components with respect to the Department of Defense (DOD) enlisted accession quality benchmarks for those same years. The two principal DOD quality benchmarks are the percentage of non-prior service enlistees who are high school diploma graduates (HSDG) and the percentage who score above average on the Armed Forces Qualification Test (AFQT Categories I-IIIA).5 All of the Active Components exceeded their quality goals in FY2011 and FY2012, often by large margins. In fact, the Navy, Marine Corps and
2 In the case of the Active Component, “accessions” are individuals who have actually begun their military service, as distinguished from those who have signed a contract to serve but who have not yet begun their service. Accession for Active Component personnel usually occurs when an individual is “shipped” to basic training. For the Reserve Components, the term has a broader meaning: accession can occur shortly after an individual signs a contract, when he or she is “shipped” to basic training, or when a servicemember transfers from an Active Component to a Reserve Component. 3 This “quantity” goal is normally based primarily on the difference between the congressionally authorized end strength of the Component for a given fiscal year and the projected number of currently serving personnel that Component will retain through the end of the year. Officer and enlisted accession goals are set separately. To simplify somewhat, if a Component has an authorized end strength of 200,000 enlisted personnel in a given year, and it projects that it will retain 175,000 of its current enlisted members through the year, it will set a goal of bringing in approximately 25,000 new enlisted recruits for that year (actually, the goal will be slightly higher to account for those new recruits who are discharged early, usually while in initial entry training). The actual number of new enlisted recruits a Component needs, however, may change during the year as new projections are made about the retention of currently serving enlisted personnel or if the Component must increase or decrease the total size of its force. 4 DOD measures enlisted recruit “quality” based on two criteria: graduation from high school and score on the Armed Forces Qualification Test (AFQT). Since FY1993, DOD’s benchmarks for recruit quality stipulate that at least 90% of new recruits must be high school diploma graduates and at least 60% must score above average on the AFQT. 5 Other metrics that are used less frequently include the percentage of non-prior service enlistees who score well below average on the AFQT (Category IV) and the number and types of enlistment waivers granted to enlistees. However, these measures are secondary to HSDG and above average AFQT and, in the case of waivers, there is no official benchmark.
Recruiting and Retention: An Overview of FY2011 and FY2012 Results
Congressional Research Service 3
Air Force are experiencing the highest recruit quality levels achieved since the beginning of the All-Volunteer Force in 1973.6
Table 1. Accession Data (Quantity) for Active Component Enlisted Personnel, FY2011 and FY2012
Service FY2011 (Goal)
FY2011 (Achieved)
FY2011 (Percent of Goal)
FY2012 (Goal)
FY2012 (Achieved)
FY2012 (Percent of Goal)
Army 64,000 64,019 100.0% 58,000 60,490 104.3%
Navy 33,400 33,444 100.1% 36,275 36,329 100.1%
Marine Corps 29,750 29,773 100.1% 30,500 30,514 100.0%
Air Force 28,515 28,518 100.0% 29,037 29,037 100.0%
Source: Department of Defense.
Table 2. Accession Data (Quality) for Non-Prior Service Active Component Enlisted Personnel, FY2011 and FY2012
Service
DOD Quality Benchmarks FY2011
(Achieved) FY2012
(Achieved)
HSDG AFQT
CAT I-IIIA HSDG AFQT
CAT I-IIIA HSDG AFQT
CAT I-IIIA
Army 90% 60% 99% 63% 100% 64%
Navy 90% 60% 99% 89% 99% 90%
Marine Corps 90% 60% 100% 73% 100% 75%
Air Force 90% 60% 100% 99% 99% 98%
Source: Department of Defense.
Notes: HSDG = High School Diploma Graduate; AFQT = Armed Forces Qualification Test; CAT I-IIIA = Categories I-IIIA (above average scores).
Historical Context
In the three years immediately following the terrorist attacks of 2001—which saw a dramatic increase in the use of U.S. military forces—all of the services achieved their quantity goals while increasing their quality levels. In fact, recruit quality for all the services in the FY2003-FY2004 time frame reached levels not seen since the low accession goals of the post-Cold War drawdown (early to mid-1990s) allowed the services to be highly selective in who they allowed to join. This was followed by the very challenging recruiting environment of FY2005-FY2007, when a variety of factors forced some of the services to accept a lower level of recruit quality in order to meet their quantity goals. This decline in quality was most notable with respect to the Army. As the
6 For historical data on recruit quality, see this table entitled “Recruit Quality Over Time” from the Office of the Under Secretary of Defense (Personnel & Readiness), http://prhome.defense.gov/RFM/MPP/ACCESSION%20POLICY/docs/Quality%20by%20FY%20from%201973.pdf.
Recruiting and Retention: An Overview of FY2011 and FY2012 Results
Congressional Research Service 4
Army’s recruiting difficulties were the primary source of concern during that time, a specific discussion of its recruiting challenges and performance is provided below, followed by a brief summary of the other services’ results.
Army
In FY2004, the Army slightly exceeded its quantity goal of 77,000. Of these individuals, 92% had high school diplomas (above the DOD benchmark of 90%) and 72% scored above average on the Armed Forces Qualification Test or AFQT (well above the DOD benchmark of 60%). Only 0.5% of Army recruits had AFQT scores in Category IV (the 10th through 30th percentile). The HSDG figure was about the same as the Army had experienced for the preceding seven years, while the AFQT figure was about the same as that of the preceding year, but higher than the Army had experienced in the 10 years prior to that (FY1993-FY2002). However, for a number of reasons—including the challenge of recruiting during wartime, competition from civilian employers during an economic boom, and an effort to expand the size of the Army which necessitated bringing in more recruits—the Army struggled to meet its recruiting goals from FY2005 to FY2007. In FY2005, it failed to meet its quantity goal by 8% and the quality of its recruits fell. While achieving its quantity goals in FY2006 and FY2007, Army recruit quality continued to slide. By the end of FY2007, the Army reported that only 79% of its recruits were high school diploma graduates and 61% had scored above average on the AFQT, levels not seen since the 1980s. Additionally, the proportion of Category IV recruits rose from less than 1% in FY2003-FY2004 to about 4% in FY2005-FY2007.7 This decline in recruit quality occurred at a time when the Army applied extraordinary resources to its recruiting efforts: it added over 2,500 recruiters to the existing recruiting force, increased its advertising budget, raised the maximum age for enlistees from 35 to 42,8 relaxed some existing standards (such as the prohibition on tattoos on the neck and hands), increased enlistment bonus maximums from $20,000 to $40,000,9 and increased the number of medical and conduct10 waivers being granted.11
The Army began to reverse this quality decline in FY2008, when it met its accession quantity goal while also increasing the proportion who were high school diploma graduates to 83% and 7 DOD regulations require that no more than 4% of an annual enlistment cohort may be Category IV (10th -30th percentile on the AFQT). In addition, no one in Category V (1st-9th percentile on the AFQT) may be admitted. DOD Instruction 1145.01, Qualitative Distribution of Military Manpower, September 20, 2005, paragraph 4.1, http://www.dtic.mil/whs/directives/corres/pdf/114501p.pdf. 8 P.L. 109-163, §543, increased the maximum allowable age for enlistment from 35 to 42. 9 P.L. 109-163, §635. 10 Conduct waivers are used for a wide range of preenlistment misconduct. Until 2008, conduct waivers included drug use, traffic violations, misdemeanors, and felonies, although each of the services had different rules for categorizing specific types of misconduct and different criteria for granting conduct waivers. DOD established an enlistment waiver policy effective at the start of FY2009 which revised the waiver categories, standardized the definitions of the various types of misconduct across the services, made drug use its own waiver category, and set minimum standards for requiring drug and conduct waivers. See Directive Type Memorandum (DTM) 08-018 – Enlistment Waivers, June 27, 2008, available at http://www.dtic.mil/whs/directives/corres/pdf/DTM-08-018.pdf. 11 The following are the number and the percentage of Army non-prior service accessions enlisted accessions with a waiver of any type in the cited fiscal year: FY2003 (8,836/12.7%); FY2004 (8,918/12.3%); FY2005 (10,185/ 15.7%); FY2006 (13,518/19.5%); FY2007 (14,820/22.0%); FY2008 (14,929/21.5%). The percentage of non-prior service enlisted accessions with waivers was relatively stable for the other three services during this period. The Army waiver figures for subsequent years are as follows: FY2009 (9,938/15.6%); FY2010 (6,080/8.7%); FY2011 (6,653/10.7%), FY2012 (6.014/10.1%). However, these figures are not directly comparable to those of previous years due to a change in the methodology for counting waivers (see discussion in footnote 10)
Recruiting and Retention: An Overview of FY2011 and FY2012 Results
Congressional Research Service 5
slightly increasing the proportion who scored above average on the AFQT to 62%. Additionally, the Army allowed fewer Category IV recruits (3.5%) and was able to reduce the number of individuals who were enlisted with waivers for conduct by about 10%.12
Improvements in Army recruit quality accelerated markedly in FY2009 and FY2010. Aided by a more favorable recruiting environment—generated by comparatively high unemployment rates and an improved security situation in Iraq—and needing fewer recruits due to the completion of the major force expansion which occurred during FY2004-FY2008, the Army was able to be much more selective. As a result, the Army was able to exceed its quantity goal in FY2009 by 8% while recruit quality shot up dramatically: 95% of new accessions were high school diploma graduates, 66% scored above average on the AFQT, and just 1.5% were Category IV. In FY2010, 100% of the Army’s recruits were high school diploma graduates, 64% scored above average on the AFQT, and less than 1% were Category IV. Army recruit quality in FY2011 and FY2012 was nearly identical to FY2010.
Marine Corps
While the Marine Corps experienced some of the same recruiting stresses as the Army in the FY2005-FY2007 timeframe—heavy involvement in Iraq and Afghanistan coupled with a major force expansion that required a greater number of new recruits—the impact was not as great. In FY2004, 97% of Marine Corps recruits were high school diploma graduates and 69% scored above average on the AFQT. These figures dropped slightly to 95% and 65%, respectively, by FY2007 but were still well above the DOD benchmarks and not substantially different from the quality levels achieved by the Marine Corps since the mid-1990s. The Marine Corps did, however, increase the proportion of Category IV recruits to 3% in FY2007, the highest level it had accepted since 1985, and it did accept more individuals with records of serious misconduct (although its overall ratio of waivered individuals remained relatively stable). Marine Corps recruiting in FY2008 showed some small improvements in quality, while FY2009 saw much larger improvements. In FY2009, 99% of Marine Corps recruits were high school diploma graduates and 71% of them scored above average on the AFQT. In FY2010, 100% were high school diploma graduates, 72% scored above average on the AFQT, and less than 1% were Category IV. Marine Corps recruit quality in FY2011 and FY2012 was similar to FY2010.
Navy and Air Force
The Navy and the Air Force were the least affected by the recruiting stresses of the FY2005-FY2007 time frame. While deeply involved in the ongoing operations in Iraq and Afghanistan, their role in these conflicts resulted in far fewer casualties than experienced by the Army and Marine Corps. Additionally, both of these services were undergoing force reductions during this time frame, in contrast to the force expansions of the Army and Marine Corps. As such, they experienced less pressure to trade off quality to achieve quantity goals, enabling both services to meet their quantity goals while suffering little change in their quality metrics. 12 While the FY2008 conduct waiver figures were still above the levels for FY2006 – and well above the levels for FY2003-FY2005 – the downward movement from FY2007 was noteworthy. Of particular significance, in FY2008 the Army reduced the number of waivers for felony convictions from 511 to 372. With the change in methodology brought about by Directive Type Memorandum (DTM) 08-018 (see footnote 10), directly comparable conduct waiver data for subsequent years is not available. Under the new methodology, the Army reported 220 waivers for “Major Misconduct (Conviction)” in FY2009, just 7 in FY2010, and none in FY2011 and FY2012.
Recruiting and Retention: An Overview of FY2011 and FY2012 Results
Congressional Research Service 6
The Navy’s HSDG rate declined from 96% in FY2004 to 93% in FY2007, but its above-average AFQT rate improved from 70% to 73%. The Air Force’s HSDG metric remained at 99% between FY2004 and FY2007, while its AFQT metric dropped from 82% to 79%. Neither service allowed in any Category IV personnel during this period.
The Navy and the Air Force both met their accession quantity goals during the FY2008-FY2012 time frame, and both experienced improvements in recruit quality. The Navy’s HSDG rate rose from 93% in FY2007 to 99% in FY2011 and FY2012, while its above-average AFQT rate rose from 73% in FY2007 to 89% in FY2011 and 90% in FY2012. The Air Force’s HSDG rate remained between 98-100% in FY2008-FY2012, while its above-average AFQT rate rose from 79% in FY2007 to 99% in FY2011 and 98% in FY2012.13
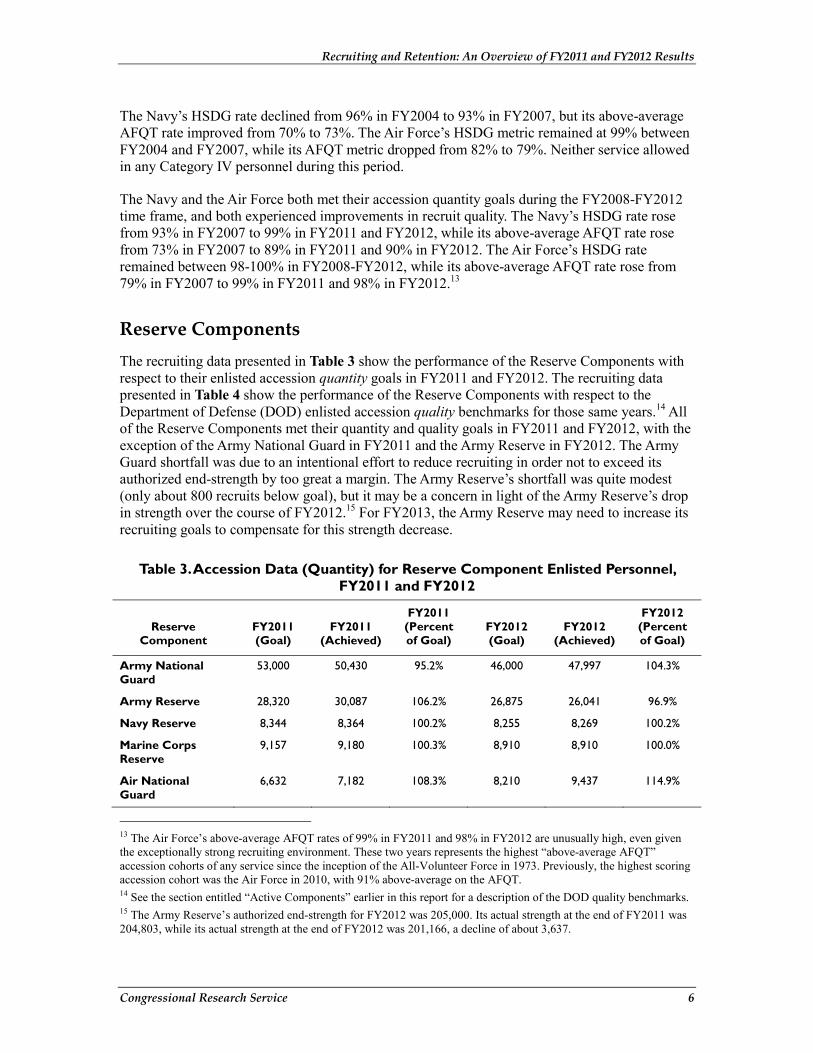
Reserve Components The recruiting data presented in Table 3 show the performance of the Reserve Components with respect to their enlisted accession quantity goals in FY2011 and FY2012. The recruiting data presented in Table 4 show the performance of the Reserve Components with respect to the Department of Defense (DOD) enlisted accession quality benchmarks for those same years.14 All of the Reserve Components met their quantity and quality goals in FY2011 and FY2012, with the exception of the Army National Guard in FY2011 and the Army Reserve in FY2012. The Army Guard shortfall was due to an intentional effort to reduce recruiting in order not to exceed its authorized end-strength by too great a margin. The Army Reserve’s shortfall was quite modest (only about 800 recruits below goal), but it may be a concern in light of the Army Reserve’s drop in strength over the course of FY2012.15 For FY2013, the Army Reserve may need to increase its recruiting goals to compensate for this strength decrease.
Table 3. Accession Data (Quantity) for Reserve Component Enlisted Personnel, FY2011 and FY2012
Reserve Component
FY2011 (Goal)
FY2011 (Achieved)
FY2011 (Percent of Goal)
FY2012 (Goal)
FY2012 (Achieved)
FY2012 (Percent of Goal)
Army National Guard
53,000 50,430 95.2% 46,000 47,997 104.3%
Army Reserve 28,320 30,087 106.2% 26,875 26,041 96.9%
Navy Reserve 8,344 8,364 100.2% 8,255 8,269 100.2%
Marine Corps Reserve
9,157 9,180 100.3% 8,910 8,910 100.0%
Air National Guard
6,632 7,182 108.3% 8,210 9,437 114.9%
13 The Air Force’s above-average AFQT rates of 99% in FY2011 and 98% in FY2012 are unusually high, even given the exceptionally strong recruiting environment. These two years represents the highest “above-average AFQT” accession cohorts of any service since the inception of the All-Volunteer Force in 1973. Previously, the highest scoring accession cohort was the Air Force in 2010, with 91% above-average on the AFQT. 14 See the section entitled “Active Components” earlier in this report for a description of the DOD quality benchmarks. 15 The Army Reserve’s authorized end-strength for FY2012 was 205,000. Its actual strength at the end of FY2011 was 204,803, while its actual strength at the end of FY2012 was 201,166, a decline of about 3,637.
Recruiting and Retention: An Overview of FY2011 and FY2012 Results
Congressional Research Service 7
Reserve Component
FY2011 (Goal)
FY2011 (Achieved)
FY2011 (Percent of Goal)
FY2012 (Goal)
FY2012 (Achieved)
FY2012 (Percent of Goal)
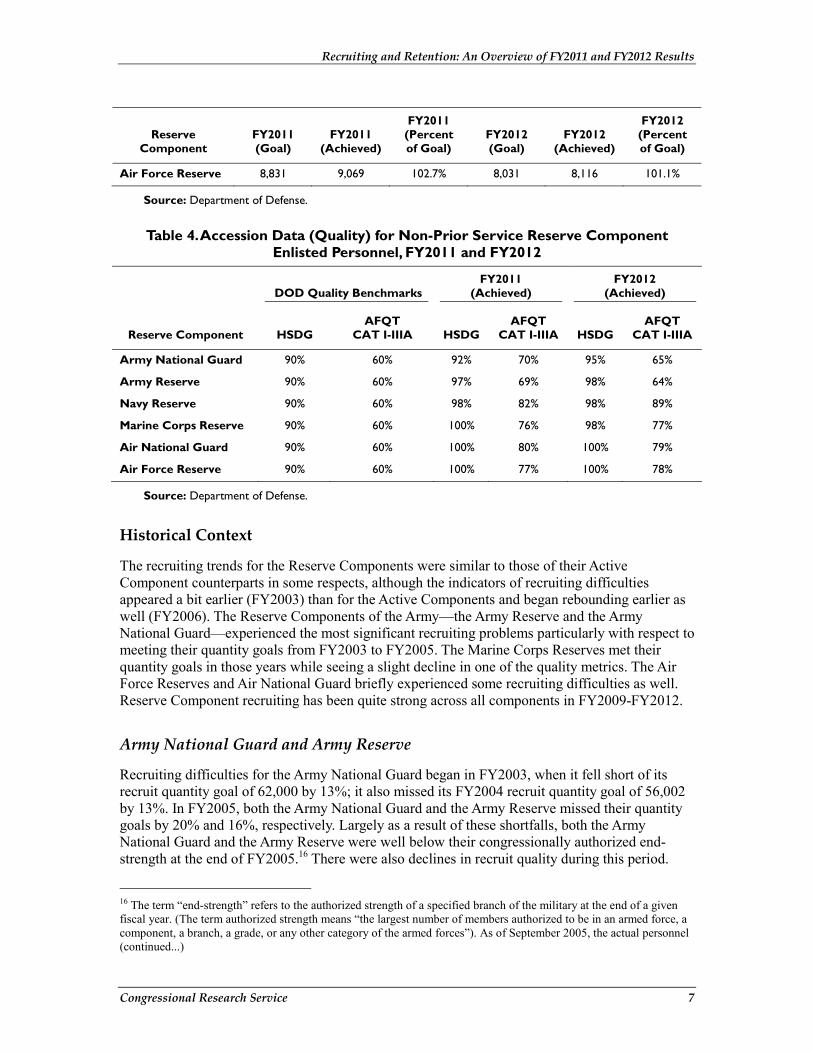
Air Force Reserve 8,831 9,069 102.7% 8,031 8,116 101.1%
Source: Department of Defense.
Table 4. Accession Data (Quality) for Non-Prior Service Reserve Component Enlisted Personnel, FY2011 and FY2012
Reserve Component
DOD Quality Benchmarks FY2011
(Achieved) FY2012
(Achieved)
HSDG AFQT
CAT I-IIIA HSDG AFQT
CAT I-IIIA HSDG AFQT
CAT I-IIIA
Army National Guard 90% 60% 92% 70% 95% 65%
Army Reserve 90% 60% 97% 69% 98% 64%
Navy Reserve 90% 60% 98% 82% 98% 89%
Marine Corps Reserve 90% 60% 100% 76% 98% 77%
Air National Guard 90% 60% 100% 80% 100% 79%
Air Force Reserve 90% 60% 100% 77% 100% 78%
Source: Department of Defense.
Historical Context
The recruiting trends for the Reserve Components were similar to those of their Active Component counterparts in some respects, although the indicators of recruiting difficulties appeared a bit earlier (FY2003) than for the Active Components and began rebounding earlier as well (FY2006). The Reserve Components of the Army—the Army Reserve and the Army National Guard—experienced the most significant recruiting problems particularly with respect to meeting their quantity goals from FY2003 to FY2005. The Marine Corps Reserves met their quantity goals in those years while seeing a slight decline in one of the quality metrics. The Air Force Reserves and Air National Guard briefly experienced some recruiting difficulties as well. Reserve Component recruiting has been quite strong across all components in FY2009-FY2012.
Army National Guard and Army Reserve
Recruiting difficulties for the Army National Guard began in FY2003, when it fell short of its recruit quantity goal of 62,000 by 13%; it also missed its FY2004 recruit quantity goal of 56,002 by 13%. In FY2005, both the Army National Guard and the Army Reserve missed their quantity goals by 20% and 16%, respectively. Largely as a result of these shortfalls, both the Army National Guard and the Army Reserve were well below their congressionally authorized end-strength at the end of FY2005.16 There were also declines in recruit quality during this period.
16 The term “end-strength” refers to the authorized strength of a specified branch of the military at the end of a given fiscal year. (The term authorized strength means “the largest number of members authorized to be in an armed force, a component, a branch, a grade, or any other category of the armed forces”). As of September 2005, the actual personnel (continued...)
Recruiting and Retention: An Overview of FY2011 and FY2012 Results
Congressional Research Service 8
The Army National Guard’s HSDG rate decline from 86% in FY2002 to 83% in FY2005, while its AFQT metric dropped from 60% to 57%. During this same period, the HSDG rate for the Army Reserve dropped from 94% to 88% and its above-average AFQT rate declined from 69% to 67%.
Recruiting for the Army National Guard began improving in FY2006. From FY2006 to FY2009, the Army National Guard met, or came close to meeting, robust recruit quantity goals. This allowed it to slightly exceed its authorized end-strength by FY2007, and to significantly exceed its authorized end-strength in FY2008 and FY2009. For FY2010 and FY2011, retention was strong enough in the Army Guard that it cut back on its recruiting in the last few months of the year in order to keep from exceeding it authorized end-strength by too great a margin, and the recruiting goal for FY2012 was markedly lower than the preceding two years for the same reason.17 Recruit quality also improved during this time frame, with the HSDG metric rising from 83% in FY2005 to 92-95% in FY2010-FY2012. Its proportion of recruits with above average AFQT scores remained just under the DOD benchmark of 60% in FY2006-FY2008, but jumped dramatically to 76% in FY2009, and tapered off to 65% by FY2012.
The Army Reserve also improved its recruiting from the perspective of quantity from FY2006 to FY2012, meeting or nearly meeting all of its quantity goals in these years. This allowed the Army Reserve to stabilize its strength at around 190,000 personnel in FY2006 and FY2007 (about 7% below its authorized end-strength), and to begin increasing its personnel strength in FY2008. In FY2009, the Army Reserve was finally able to meet its authorized end-strength after four years of operating under-strength, and it maintained this during FY2010-FY2011.18 FY2012 saw a modest decline in Army Reserve strength.19 The quality of Army Reserve recruits declined from FY2006 to FY2008, with the HSDG metric remaining close to the FY2005 level of 88% and the percentage of recruits scoring above-average on the AFQT declining from 67% in FY2005 to 58% in FY2008. Recruit quality improved dramatically in subsequent years. The percentage of recruits with a high school diploma shot up to 97-100% in FY2009-FY2012. The percentage scoring above average on the AFQT increased to 63% in FY2009, continued upward to 71% in FY2010, and then tapered off to 69% in FY2011 and 64% in FY2012.
Other Reserve Components
The remaining Reserve Components appear to have been much less affected by the recruiting stresses of the FY2003-FY2005 period; they likewise saw less of a rebound in the FY2006- (...continued) strength of the Army National Guard was 333,177—about 95% of its authorized end-strength of 350,000. The actual strength of the Army Reserve was 189,005 in September, 2005—about 92% of its authorized end-strength of 205,000. While end-strengths for the reserve components are maximum strength levels, not minimum strength levels, the inability to maintain a force at the authorized end-strength level can be an indicator of strength management problems. 17 The end-strength figures for the Army National Guard are as follows: FY2006 (350,000 authorized, 346,288 actual); FY2007 (350,000 authorized, 352,707 actual); FY2008 (351,300 authorized, 360,351 actual); FY2009 (352,600 authorized, 358,391 actual), FY2010 (358,200 authorized, 362,015 actual), FY2011 (358,200 authorized, 361,561 actual); FY2012 (358,200 authorized, 358,078 actual). 18 The end-strength figures for the Army Reserve are as follows: FY2006 (205,000 authorized, 189,975 actual); FY2007 (200,000 authorized, 189,882 actual); FY2008 (205,000 authorized, 197,024 actual); FY2009 (205,000 authorized, 205,297 actual); FY2010 (205,000 authorized, actual strength 205,281); FY2011 (205,000 authorized, 204,803 actual). 19 See footnote 15.
Recruiting and Retention: An Overview of FY2011 and FY2012 Results
Congressional Research Service 9
FY2012 period. The Marine Corps Reserve and Air Force Reserve met their quantity goals in every year from FY2003 to FY2012. The Air National Guard missed its quantity goals by an average of about 7% from FY2004 to FY2007, but nonetheless maintained a fairly stable strength level consistent with its authorized end-strength. The Navy Reserve missed its quantity goals in FY2005 and FY2006, but the significance of this shortfall should be assessed in light of the reductions in the size of the Navy Reserve related to restructuring initiatives.20
Recruit quality in the Reserve Components overall has exhibited a positive trend in recent years. In FY2003, two Reserve Components failed to meet one or both of its quality goals. That dropped to one Reserve Component in FY2004, rose to three in FY2005 and FY2006, and dropped back to two in FY2007 and FY2008. For FY2009-FY2012, every Reserve Component met both of its quality goals, in many cases by substantial margins.21
Analysis Concerns about the health of military recruiting efforts were substantial in the FY2005-FY2007 timeframe, but these concerns have been mitigated by the more favorable results experienced in subsequent years. In particular, FY2009-FY2012 were remarkably strong recruiting years for all the services and their Reserve Components, particularly with regards to recruit quality.
There are a number of likely causes for this recruiting success. One factor that has a powerful impact on military recruiting is the state of the economy. Military recruiting is generally easier in times of high unemployment and more difficult in times of low unemployment. Historical data indicate that the unemployment rate dropped from 2003 through 2007 (falling from 6.0% in 2003 to 4.6% for 2006 and 2007) and then climbed to 5.8% in 2008, 9.3% in 2009, and 9.6% in 2010. While the unemployment rate dropped to 8.9% for 2011 and 8.1% for 2012, it was likely still high enough to benefit military recruiting efforts.22
Another factor was likely the cumulative effect of the substantial increases in military compensation that have occurred over the past decade or so. In most years between FY2001 and FY2010, Congress increased basic pay by an amount that was at least 0.5% higher than the annual increase in the employment cost index (a common measure of increases in wages for private-sector employees). Congress initiated a multi-year reform of housing allowances between FY1998 and FY2005 to raise housing allowance rates in order to bring them line with actual housing costs. Congress also increased the amount of hostile fire pay and family separation
20 The authorized end-strength for the Navy Reserve has declined by about 23,500 from 2003 through 2011, dropping from 88,156 at the end of FY2003 to 64,703 at the end of FY2011, with the largest declines occurring in FY2004-2006. According to testimony by Navy leaders before Congress, this was largely the result of force realignments related to greater integration of the Navy and the Navy Reserve. However, this testimony also indicated that the Navy Reserve had recruiting difficulties in some of these years related to a lower flow of recruits from the Navy due to high retention among active duty sailors, competition from the Army and Marine Corps, and low civilian unemployment. See testimony of Vice Admiral John G. Cotton, Chief of Navy Reserve, before the Senate Armed Services Personnel Subcommittee on March 31, 2004; April 13, 2005; and March 30, 2006. See also testimony of Vice Admiral Dirk J. Debbink, Chief of Navy Reserve, before the Senate Armed Services Personnel Subcommittee on March 3, 2009. 21 The components failing to meet one or both quality metrics were as follows: the Army National Guard and the Navy Reserve in FY2003; the Army National Guard in FY2004; the Army National Guard, the Army Reserve, and the Air Force Reserve in FY2005; the Army National Guard, the Army Reserve, and the Navy Reserve in FY2006; the Army National Guard and the Army Reserve in FY2007 and FY2008. 22 Department of Labor, Bureau of Labor Statistics, available at http://www.bls.gov/.
Recruiting and Retention: An Overview of FY2011 and FY2012 Results
Congressional Research Service 10
allowance in 2002, authorized premium-based TRICARE coverage for non-activated reservists in 2006, and enacted a generous new educational benefit in 2008. Cumulatively, these changes have made the military compensation package much more attractive.
A third important factor was likely the improved security situation in Iraq, which resulted in a rapid decline in casualties. From 2004 to 2007, roughly 700 servicemembers were killed in action each year while serving in Iraq, with about 70% of them serving in the Army and its Reserve Components. However, as security improved in Iraq, the number of those killed in action in Iraq dropped to 218 in 2008, 74 in 2009, 19 in 2010, and 34 in 2011.23 The U.S. mission in Iraq ended in December 2011. While casualties in Afghanistan rose significantly in the 2008-2011 time frame, the increase was substantially less than the decline in casualties in Iraq.24
One more factor which positively affected recruiting in FY2009 and subsequent years was the completion of the major multi-year efforts by the Army and the Marine Corps to increase their personnel strength. These growth initiatives required those services to set higher goals for the number of new accessions. With the successful completion of its “Grow the Army” initiative, the Army was able to lower its accession goal from 80,000 per year in FY2005-FY2008 to an average of about 68,000 per year in FY2009-FY2011. Likewise, the Marine Corps was able to reduce its accession goal from 35,576 in FY2007 and 37,967 in FY2008 to an average of about 30,000 per year in FY2009-FY2011. In the FY2013 National Defense Authorization Act, Congress approved substantial reductions in end-strength for the Army and the Marine Corps, which continue to reduce the need for new enlisted accessions. This lowered demand for recruits may well continue over the next few years, if Congress continues to support DOD plans to reduce the size of the ground forces.
Retention The term retention refers to the rate at which military personnel voluntarily choose to stay in the military after their original obligated term of service has ended.25 Imbalances in the retention rate can cause problems within the military personnel system. A common retention concern is that too few people will stay in, thereby creating a shortage of experienced leaders, decreasing military efficiency, and lowering job satisfaction. This was a particular concern during the middle part of the last decade, as the stress of combat deployments raised concerns about the willingness of military personnel to continue serving. The opposite concern—more salient today in light of reductions in force structure—is that too many people will stay in, thereby decreasing promotion opportunities and possibly requiring involuntarily separations in order to prevent the organization from becoming “top heavy” with middle and upper level leaders, or to comply with end-strength
23 DOD casualty data for Iraq available https://www.dmdc.osd.mil/dcas/pages/report_oif_month.xhtml (for Operation Iraqi Freedom) and https://www.dmdc.osd.mil/dcas/pages/report_ond_month.xhtml (for Operation New Dawn). 24 From 2005 to 2007, about 70 servicemembers on average were killed in action each year while serving in Afghanistan; that figure rose to 131 in 2008, 271 in 2009, and 437 for 2010, before declining to 359 in 2011 and 237 in 2012. DOD casualty data for Afghanistan (Operation Enduring Freedom) available at https://www.dmdc.osd.mil/dcas/pages/report_oef_month.xhtml. 25 The obligated term of service for enlisted personnel is determined by their initial enlistment contract. The normal service obligation incurred is eight years, which may be served in the Active Component, in the Reserve Component, or some combination of both. For example, an individual may enlist for four years of service in the Active Component, followed by four years of service in the Reserve Component. See 10 USC 651 and DOD Instruction 1304.25.
Recruiting and Retention: An Overview of FY2011 and FY2012 Results
Congressional Research Service 11
limitations. Each of these outcomes can have a negative impact on recruiting by making the military a less attractive career option.
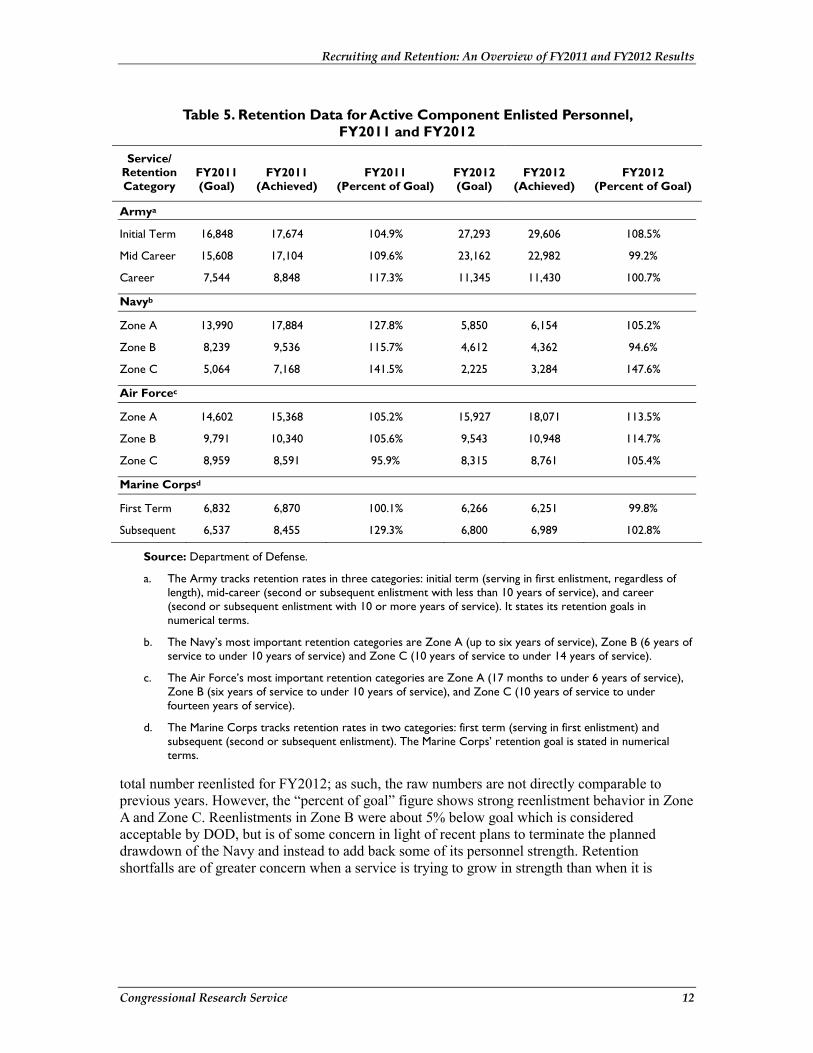
Active Components The data presented in Table 5 show that the Army essentially met or exceeded its retention goals for enlisted personnel in FY2011 and FY2012. These results are a continuation of a strong retention trend in the Army over the past decade, which has been particularly remarkable in light of the heavy stress placed on Army personnel during that time by combat operations in Iraq and Afghanistan. The Marine Corps has likewise borne a heavy share of the manpower burden associated with operations in Iraq and Afghanistan, and it too has exhibited strong retention over the past decade. 26 It essentially met or exceeded its retention goals in FY2011 and FY2012.
After some difficulties in FY2008,27 the Air Force met, or nearly met, all of its reenlistment goals in FY2009. It met, or nearly met, two of three reenlistment goals in FY2010. Its results for first-term reenlistments in FY2010 were substantially below goal, but Air Force analysts point out that the Air Force was trying to reduce its force at this time in order to stay under its end-strength limits. To achieve these reductions, several thousand airmen were given incentives to separate from the Air Force. In FY2011, the Air Force exceeded its goals for first-term and mid-career personnel, but was slightly short of its goal for career personnel, while in FY2012 it exceeded all of its goals.
The Navy exceeded its retention goals in FY2009 by a comfortable margin, and by even larger margins in FY2010 and FY2011. It changed its methodology for setting retention goals and measuring achievement about midway through FY2012 in order to focus solely on those who were completing their term of obligated service in that fiscal year. (Under its previous methodology, those who were scheduled to complete their term of obligated service in later years, but who chose to reenlist early, were considered when setting annual goals and calculating goal achievement). One effect of this new methodology was to lower the total numeric goal and the
26It did fall about 13% short of its “first term” goal in FY2008 and about 8% short in FY2007, but this was due to exceptionally high retention goals associated with increasing the size of the Marine Corps rather than poor retention. While the Marine Corps had a “first term” retention goal of 5,892 in FY2006, it was increased to 8,298 in FY2007 and to 9,507 in FY2008. While it did not meet these sharply increased retention goals, it nonetheless achieved a much higher retention rate than it did in FY2006. See U.S. Congress, House Committee on Armed Services, Subcommittee on Military Personnel, Fiscal Year 2010 National Defense Authorization Budget Request on Military Personnel Overview, 111th Cong., 1st sess., May 21, 2009, Statement of Lieutenant General Ronald S. Coleman, Deputy Commandant for Manpower & Reserve Affairs, http://armedservices.house.gov/pdfs/MP052109/Coleman_Testimony052109.pdf, p. 6. 27 The Air Force missed all three of its FY2008 retention goals by large margins, although the magnitude of this shortfall appears to have been distorted by the implementation of new goal-setting and achievement-measuring methodologies. Specifically, the Air Force changed its goal setting methodology from one based on historical reenlistment rates to goals based on specific skill and grade needs, and narrowed the criteria for counting whether a reenlistment “counted” towards a goal. This new counting methodology reportedly failed to count thousands of actual reenlistments towards the Air Force’s goals. (Author’s discussion with Air Force enlisted analysis staff). The Air Force tripled its funding for new Selective Reenlistment Bonuses in FY2009 and refined its methodology for counting reenlistments to include some previously omitted.
Recruiting and Retention: An Overview of FY2011 and FY2012 Results
Congressional Research Service 12
Table 5. Retention Data for Active Component Enlisted Personnel, FY2011 and FY2012
Service/ Retention Category
FY2011 (Goal)
FY2011 (Achieved)
FY2011 (Percent of Goal)
FY2012 (Goal)
FY2012 (Achieved)
FY2012 (Percent of Goal)
Armya
Initial Term 16,848 17,674 104.9% 27,293 29,606 108.5%
Mid Career 15,608 17,104 109.6% 23,162 22,982 99.2%
Career 7,544 8,848 117.3% 11,345 11,430 100.7%
Navyb
Zone A 13,990 17,884 127.8% 5,850 6,154 105.2%
Zone B 8,239 9,536 115.7% 4,612 4,362 94.6%
Zone C 5,064 7,168 141.5% 2,225 3,284 147.6%
Air Forcec
Zone A 14,602 15,368 105.2% 15,927 18,071 113.5%
Zone B 9,791 10,340 105.6% 9,543 10,948 114.7%
Zone C 8,959 8,591 95.9% 8,315 8,761 105.4%
Marine Corpsd
First Term 6,832 6,870 100.1% 6,266 6,251 99.8%
Subsequent 6,537 8,455 129.3% 6,800 6,989 102.8%
Source: Department of Defense.
a. The Army tracks retention rates in three categories: initial term (serving in first enlistment, regardless of length), mid-career (second or subsequent enlistment with less than 10 years of service), and career (second or subsequent enlistment with 10 or more years of service). It states its retention goals in numerical terms.
b. The Navy’s most important retention categories are Zone A (up to six years of service), Zone B (6 years of service to under 10 years of service) and Zone C (10 years of service to under 14 years of service).
c. The Air Force’s most important retention categories are Zone A (17 months to under 6 years of service), Zone B (six years of service to under 10 years of service), and Zone C (10 years of service to under fourteen years of service).
d. The Marine Corps tracks retention rates in two categories: first term (serving in first enlistment) and subsequent (second or subsequent enlistment). The Marine Corps’ retention goal is stated in numerical terms.
total number reenlisted for FY2012; as such, the raw numbers are not directly comparable to previous years. However, the “percent of goal” figure shows strong reenlistment behavior in Zone A and Zone C. Reenlistments in Zone B were about 5% below goal which is considered acceptable by DOD, but is of some concern in light of recent plans to terminate the planned drawdown of the Navy and instead to add back some of its personnel strength. Retention shortfalls are of greater concern when a service is trying to grow in strength than when it is
Recruiting and Retention: An Overview of FY2011 and FY2012 Results
Congressional Research Service 13
drawing down its force.28 In general, given the Navy’s plans to increase its force structure, it will likely need to increase its recruiting and retention goals modestly in the coming years.
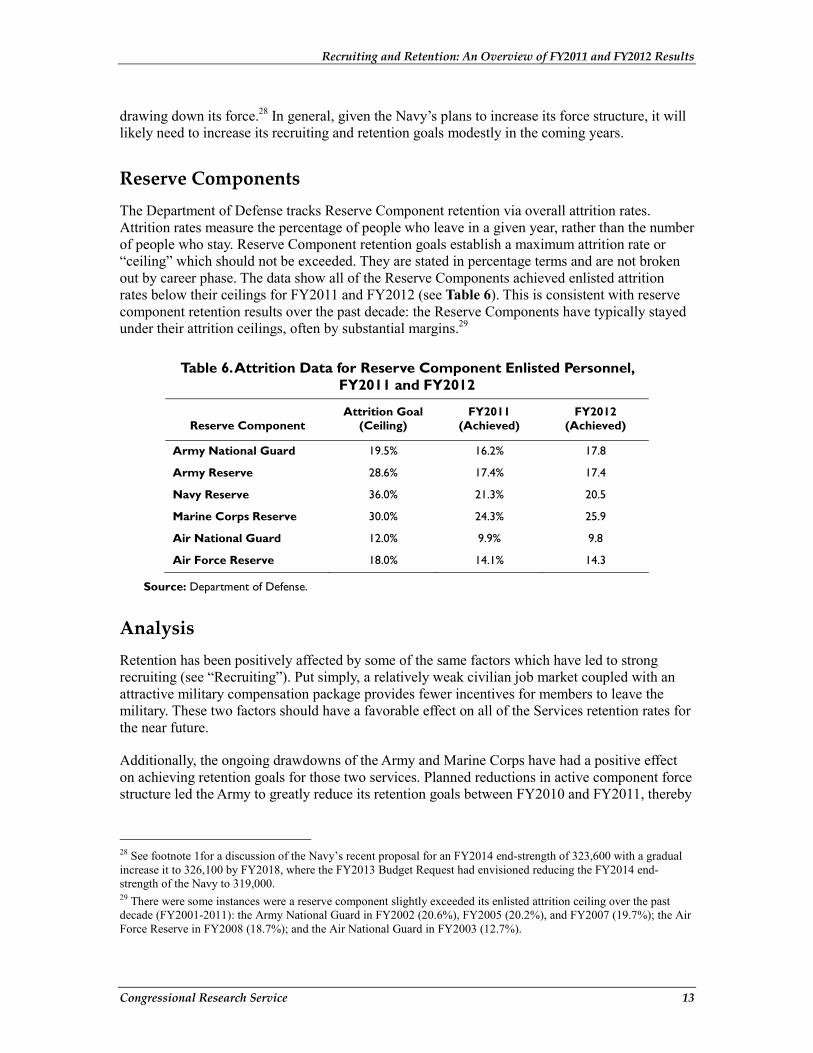
Reserve Components The Department of Defense tracks Reserve Component retention via overall attrition rates. Attrition rates measure the percentage of people who leave in a given year, rather than the number of people who stay. Reserve Component retention goals establish a maximum attrition rate or “ceiling” which should not be exceeded. They are stated in percentage terms and are not broken out by career phase. The data show all of the Reserve Components achieved enlisted attrition rates below their ceilings for FY2011 and FY2012 (see Table 6). This is consistent with reserve component retention results over the past decade: the Reserve Components have typically stayed under their attrition ceilings, often by substantial margins.29
Table 6. Attrition Data for Reserve Component Enlisted Personnel, FY2011 and FY2012
Reserve Component Attrition Goal
(Ceiling) FY2011
(Achieved) FY2012
(Achieved)
Army National Guard 19.5% 16.2% 17.8
Army Reserve 28.6% 17.4% 17.4
Navy Reserve 36.0% 21.3% 20.5
Marine Corps Reserve 30.0% 24.3% 25.9
Air National Guard 12.0% 9.9% 9.8
Air Force Reserve 18.0% 14.1% 14.3
Source: Department of Defense.
Analysis Retention has been positively affected by some of the same factors which have led to strong recruiting (see “Recruiting”). Put simply, a relatively weak civilian job market coupled with an attractive military compensation package provides fewer incentives for members to leave the military. These two factors should have a favorable effect on all of the Services retention rates for the near future.
Additionally, the ongoing drawdowns of the Army and Marine Corps have had a positive effect on achieving retention goals for those two services. Planned reductions in active component force structure led the Army to greatly reduce its retention goals between FY2010 and FY2011, thereby
28 See footnote 1for a discussion of the Navy’s recent proposal for an FY2014 end-strength of 323,600 with a gradual increase it to 326,100 by FY2018, where the FY2013 Budget Request had envisioned reducing the FY2014 end-strength of the Navy to 319,000. 29 There were some instances were a reserve component slightly exceeded its enlisted attrition ceiling over the past decade (FY2001-2011): the Army National Guard in FY2002 (20.6%), FY2005 (20.2%), and FY2007 (19.7%); the Air Force Reserve in FY2008 (18.7%); and the Air National Guard in FY2003 (12.7%).
Recruiting and Retention: An Overview of FY2011 and FY2012 Results
Congressional Research Service 14
making it easier to achieve them.30 The Marine Corps also reduced its retention goals modestly between FY2009 and FY2010, and they have stayed approximately at the lower level since then. If Congress continues to approve Army and Marine Corps proposals to reduce their personnel strength through FY2016-17, these Services will continue to have relatively modest retention goals.31 Additionally, the reserve components will likely benefit from an increased stream of personnel leaving active duty and desiring to continue their military careers in the reserves. However, the force structure reductions will also lead to decreased promotion opportunity in some career fields, thereby potentially providing a retention disincentive in future years. While the Navy and Air Force are not undergoing major changes in their manpower in the next few years – the Air Force plans to decrease its strength by about 5,000 between FY2012 and FY2014, while the Navy plans to increase its strength by about 5,000 in that time frame 32 – they should still benefit from the other favorable retention factors mentioned in the previous paragraph.
Although it may seem counterintuitive, the high operational tempo and large scale reserve mobilizations that have occurred since September 11, 2001, may also have had a positive impact on retention. A number of studies indicate that deployments can enhance retention, perhaps by providing participants with a sense of accomplishment.33 With the U.S. mission in Iraq completed 30 Note, however, that the Army’s retention goals shot up dramatically from FY2011 to FY2012. This was apparently related to the very large cohort of personnel who had enlisted or reenlisted during the peak years of the Army’s force expansion, thus generating a much larger retention-eligible population. (Author’s discussion with Headquarters, Department of the Army retention official). 31 The Army achieved a peak strength of about 571,000 in 2011, while the Marine Corps achieved a peak strength of about 205,000 in 2010. On January 6, 2011, then-Secretary of Defense Robert Gates proposed a drawdown of Army to 520,000 and a drawdown of the Marine Corps to 182,000-187,000 by FY2016. The FY2013 budget request proposed reducing Army strength to 552,100 and Marine Corps strength to 197,300 by the end of the fiscal year, which Congress approved in section 401 of the FY2013 National Defense Authorization Act. The FY2014 budget request proposes reducing Army strength to 520,000 and Marine Corps strength to 190,000 by the end of the fiscal year. At the time, it is unclear how Congress will respond to this proposal. Both the FY2013 and FY2014 budget requests propose an end to the drawdown for the Army in FY2017 at a strength level of 490,000 and an end to the drawdown for the Marine Corps in 2016 at a strength level of 182,100. 32 The Air Force’s actual strength at the end of FY2012 was 332,959, its authorized end-strength for FY2013 was 329,460 and the budget request proposes an authorized end-strength of 327,600 for FY2014. The Navy’s actual strength at the end of FY2012 was 318,406, its authorized end-strength for FY2013 was 322,700 and the budget request proposes an authorized end-strength of 323,600 for FY2014. 33 James Hosek and Mark Totten, Does Perstempo Hurt Reenlistment? The Effect of Long or Hostile Perstempo on Reenlistment, RAND, 1998; Paul Sticha, Paul Hogan and Maris Diane, Personnel Tempo: Definition, Measurement, and Effects on Retention, Readiness and Quality of Life, Army Research Institute, 1999; Peter Francis, OPTEMPO and Readiness, Center for Naval Analysis, 1999; and Paul Hogan and Jared Lewis, Voluntary Enlisted Retention and PERSTEMPO: An Empirical Analysis of Army Administrative Data, The Lewin Group. However, some of these studies also indicate that after a certain threshold level, this positive effect diminishes or becomes negative. Additionally, these studies focused on retention behavior during the 1990s, when deployments were generally shorter and less hostile than during the last eleven years. A more contemporary report looks at more current data, contrasting the relationship between deployment and retention during the periods 1996-2001 versus 2002-2007. Its findings, in part, are summarized below:
Analysis of the survey data indicates that survey respondents who had a deployment involving hostile duty in the year prior to the survey experienced higher-than-usual work stress and higher-than-usual personal stress. They also reported a lower intention to stay in the military. However, the lower intention to stay was not borne out by analysis of actual reenlistment. Using hostile deployment in the year before a reenlistment decision as an indicator, the study found that the Air Force and Navy experienced no real effect on first-term reenlistment numbers, and the same was true of the Marine Corps until 2005–2007, when the effect of deployment was positive. Deployment had a positive but decreasing effect on Air Force, Navy, and Marine Corps second-term reenlistments through 2003, when the effect neared zero, but it then rebounded and was positive in 2004–2007.
(continued...)
Recruiting and Retention: An Overview of FY2011 and FY2012 Results
Congressional Research Service 15
in 2011, and a drawdown of forces in Afghanistan underway, some current servicemembers may be less inclined to continue their military service.
Historical Perspective: The Post-Cold War Drawdown and Its Impact on Recruiting and Retention The nation’s most recent experience with force structure cuts illustrates some of the potential impacts which such cuts can have on recruiting and retention. In the aftermath of the Cold War, all of the services embarked on major force reduction efforts. Needing fewer people, the services significantly reduced their recruiting and retention goals, which in turn made it easier for them to meet these goals. As a result, the services all reported excellent recruiting and retention results in the early 1990s. However, by the late 1990s, the Army, Navy, and Air Force began to experience some difficulties. In FY1998 the Army and the Navy failed to meet their quantity goals for enlisted recruits, as did the Army and the Air Force in FY1999. Retention shortfalls also surfaced in the Army, Navy, and Air Force.34 There was a wide array of perceived causes for these recruiting and retention shortfalls, including competition with a robust civilian economy and a perceived “pay gap” between civilian and military compensation, competition with institutions of higher education, and demographic and attitudinal changes among younger Americans. Other cited causes included limited recruiting resources and dissatisfaction with military life, due to the nature of military service and pace of operations (e.g., Bosnia and Kosovo) and a lack of critical supplies and equipment.35
(...continued)
The Army’s trends were different, however. The effect of deployment on Army reenlistment had been positive before 2002 and during the first few years of the operations in Iraq and Afghanistan, but the effect decreased after 2002 and turned negative in 2006. The pattern was similar for second-term reenlistment.... The estimate for 2006 shows that hostile deployment in the previous 12 months reduced reenlistment by eight percentage points—a large decrease.... More than any other Service, the Army increased the number of occupations eligible for a bonus as well as the dollar amount of bonuses, raising the number of reenlisting soldiers who received a bonus from 15 percent in 2003–2004 to nearly 80 percent in 2005–2007; in that same period, the average value of bonuses increased by more than 50 percent. The Army’s extended use of reenlistment bonuses helped to offset the decreasing and (by 2006) negative effect of deployments on reenlistment for both first- and second-term personnel.
James Hosek and Francisco Martorell, How Have Deployments During the War on Terrorism Affected Reenlistment, RAND National Defense Research Institute, 2009, p. 1 of Research Brief, http://www.rand.org/pubs/research_briefs/2009/RAND_RB9468.pdf. Full report available at http://www.rand.org/pubs/monographs/2009/RAND_MG873.pdf. 34 Specifically, from FY1996-98 the Army missed its retention goals for career personnel by between 2 and 5%. The Air Force did not meet its retention goals for first term personnel in FY1998-2000; for second term personnel in FY1997-2001; and for career personnel in FY1998-2001. The shortfall was most pronounced with respect to second term personnel, where the Air Force fell short of its goal by about six percentage points per year. The Navy did not have specific retention goals during the late 1990s, but the Chief of Naval Operations testified in 2001 that retention rates were not at a “steady state” level. 35 However, the data used to underpin these various claims were often rather limited. For more information on recruiting and retention in the late 1990s, see CRS Report RL31297, Recruiting and Retention in the Active Component Military: Are There Problems?, by Lawrence Kapp.
Recruiting and Retention: An Overview of FY2011 and FY2012 Results
Congressional Research Service 16
The currently planned drawdown is much smaller in scope than that conducted at the end of the Cold War, and is focused primarily on the Army and Marine Corps, but a similar dynamic could occur.36 In such a scenario, recruiting and retention would likely remain strong in the near term due to force reductions and sluggish competition from the civilian economy, but challenges would arise once these factors faded. Specifically, recruiting and retention requirements could increase as the drawdown neared completion in order to stabilize the force at its designated personnel strength level. Meeting these requirements might also be made more difficult due to increased competition from a more robust economy, fewer resources allocated to recruiting and retention, or the development of negative attitudes about military career prospects and job satisfaction. If such a scenario were to occur, its impact on recruiting and retention would likely not be manifest until the latter half of this decade.
Another cautionary flag raised by the post-Cold War drawdown relates to managing force structure so as to hedge against future contingencies. To paraphrase the comments of a former Chief of Staff of the Army, you can reduce force structure quickly, but it takes time to re-grow quality soldiers and leaders.37 One way to hedge against this is to retain somewhat more mid-grade officers and noncommissioned officers than is strictly necessary in order to allow for the rapid addition of force structure if the situation requires it. This is precisely what the Department of Defense proposes to do with the Army and Marine Corps as part of its “reversibility” concept. As Secretary of Defense Panetta recently stated:
The force structure shifts I've outlined today entail some risks to be sure. But to manage that risk we will ensure that we can mobilize, surge and adapt our force to meet the requirements of an uncertain future. To that end, the Army will retain more mid-level, mid-grade officers and NCOs. These are the guys who have the experience. And they will maintain them even as their overall strength decreases to ensure that we have the structure and experienced leaders necessary to re-grow the force quickly if we have to.38
Such a policy also provides a hedge against potential retention problems associated with limited promotion opportunity, at least for junior grade personnel who will compete for a larger number of higher grade positions. Conversely, it could have an adverse effect on promotion opportunity for mid-grade officers and noncommissioned officers, as there will be proportionately more of them competing for promotion to higher grade positions.
36 For comparative purposes, the Army went from a strength of about 770,000 in 1989 to a strength of about 480,000 by 1999 (a 38% reduction), with most of the reductions occurring between 1990 and 1994. The Marine Corps dropped from 196,000 to 172,000 in that same period (a 12% reduction), with most of the reductions occurring between 1992 and 1994. The Administration plan proposes that the Army go from a peak of about 571,000 in 2011 to 490,000 in 2017 (-14%) while the Marine Corps goes from a peak of about 205,000 in 2010 down to 182,100 by FY2016 (-11%). However, strength levels are set by Congress and could end up being lower or higher than those proposed by the Administration. 37 General Peter Schoomaker testified before Congress in 2005: “from the end of the first Gulf War until the end of the 1990’s, we reduced the active Army force by 300,000 people…If you cut down 300,000 trees, you can do that pretty quick. But now grow 30,000 of them back. But there is an analogy there that is pretty apt. It takes time, as you know, to grow the quality soldier, quality leaders that we have.” U.S. Congress, House Committee on Armed Services, Hearings on the National Defense Authorization Act for FY 2006—Budget Request from the U.S. Army, committee print, 109th Cong., 1st sess., February 9, 2005, H.A.S.C. No. 109-2. 38 “Major Budget Decisions Briefing from the Pentagon,” Secretary of Defense Leon Panetta, January 26, 2102, available at http://www.defense.gov/transcripts/transcript.aspx?transcriptid=4962 .
Recruiting and Retention: An Overview of FY2011 and FY2012 Results
Congressional Research Service 17
Options for Congress Congress exercises a powerful influence on recruiting and retention goals through its establishment of personnel strength levels for each of the active and reserve components. As such, Congress’s response to the Administration’s drawdown plans will have a major impact on each of the services’ recruiting and retention goals. If Congress approves a smaller or more slowly implemented reduction in military forces than what the Administration proposes, then the services will need to increase their recruiting and retention goals; conversely, if Congress adopts a larger or more rapidly implemented reduction in military forces, the services will need to decrease their goals.39
Congress also influences the achievement of these goals through setting military compensation levels (which may include recruiting and retention bonuses, educational benefits, and separation incentives), establishing criteria that affect eligibility for enlistment and retention (for example, age, cognitive, behavioral, and citizenship standards), and by authorizing and funding recruiting and retention programs (for example, providing for dedicated recruiters and career counselors, military entrance processing stations, market research, and advertising). Through its oversight powers, Congress also closely monitors the performance of the executive branch in managing the size and quality of the military workforce.
The policy levers most commonly used by Congress and DOD to manage recruiting and retention in the near term include varying the number of recruiters, funding for advertising, and funding for enlistment and reenlistment bonuses. When recruiting or retention shortfalls occur, or are anticipated, Congress may elect to apply additional resources to these mechanisms, as it did during the last decade. Conversely, when recruiting or retention are expected to be strong, Congress may elect to shift resources away from these areas, as it has done in recent years.
The completion of the Iraq mission in 2011, a drawdown of forces in Afghanistan, planned cuts in manpower for the ground forces, and ongoing weakness in the labor market will likely contribute to a favorable environment for recruiting and retention over the next few years. However, the experience of the post-Cold War drawdown raises some cautionary flags. If the drawdown is carried out in such a way as to undermine job satisfaction or to create a perception of limited career prospects, or if an improving economy makes civilian work comparatively more attractive than military work, the services may face a more challenging recruiting and retention environment in a few years.
39 See footnote 1 for an overview of the services’ proposed force structure changes.
Recruiting and Retention: An Overview of FY2011 and FY2012 Results
Congressional Research Service 18
Author Contact Information Lawrence Kapp Specialist in Military Manpower Policy [email protected], 7-7609