recovery of entrained cssx solvent from caustic … argonne national laboratory chemical technology...
TRANSCRIPT
Argonne National Laboratory, Argonne, Illinois 60439operated by The University of Chicagofor the United States Department of Energy under Contract W-31-109-Eng-38
Chemical TechnologyDivision
Chemical Technology Division
Chemical Technology Division
Chemical Technology Division
Chemical Technology Division
Chemical Technology Division
Chemical Technology Division
Chemical Technology Division
Chemical Technology Division
Chemical Technology Division
Chemical Technology Division
Chemical Technology Division
Chemical Technology Division
Chemical Technology Division
Chemical Technology Division
Chemical Technology Division
Chemical Technology Division
Chemical Technology Division
Chemical Technology Division
Chemical Technology Division
Chemical Technology Division
ANL-02/34
Recovery of Entrained CSSXSolvent from Caustic Aqueous
Raffinate Using Coalescers
by C. Pereira, H. A. Arafat,J. R. Falkenberg, M. C. Regalbuto,
and G. F. Vandegrift

Argonne National Laboratory, with facilities in the states of Illinois and Idaho, isowned by the United States Government and operated by The University of Chicagounder the provisions of a contract with the Department of Energy.
DISCLAIMER
This report was prepared as an account of work sponsored by an agency ofthe United States Government. Neither the United States Government norany agency thereof, nor The University of Chicago, nor any of theiremployees or officers, makes any warranty, express or implied, or assumesany legal liability or responsibility for the accuracy, completeness, orusefulness of any information, apparatus, product, or process disclosed, orrepresents that its use would not infringe privately owned rights. Referenceherein to any specific commercial product, process, or service by trade name,trademark, manufacturer, or otherwise, does not necessarily constitute orimply its endorsement, recommendation, or favoring by the United StatesGovernment or any agency thereof. The views and opinions of documentauthors expressed herein do not necessarily state or reflect those of theUnited States Government or any agency thereof, Argonne NationalLaboratory, or The University of Chicago.
Available electronically at http://www.doe.gov/bridge
Available for a processing fee to U.S. Department ofEnergy and its contractors, in paper, from:
U.S. Department of EnergyOffice of Scientific and Technical InformationP.O. Box 62Oak Ridge, TN 37831-0062phone: (865) 576-8401fax: (865) 576-5728email: [email protected]
ANL-02/34
Argonne National Laboratory Chemical Technology Division
9700 South Cass Avenue Argonne, IL 60439
RECOVERY OF ENTRAINED CSSX SOLVENT FROM CAUSTIC AQUEOUS RAFFINATE USING COALESCERS
Candido Pereira, Hassan A. Arafat, John R. Falkenberg, Monica C. Regalbuto,
and George F. Vandegrift
November 2002

ii
iii
CONTENTS Page
ABSTRACT............................................................................................................................ 1 1. INTRODUCTION............................................................................................................. 1 2. SUMMARY AND CONCLUSIONS................................................................................. 4 3. EXPERIMENTAL ............................................................................................................ 6 3.1 PHYSICAL PROPERTIES MEASUREMENT FOR OPTIMIZED SOLVENT FULL-COMPONENT SIMULANT ........................................................................ 6 3.2 SOLVENT ENTRAINMENT TESTS ..................................................................... 8 3.3 COALESCER MEDIA INTEGRITY ...................................................................... 9 3.4 LABORATORY-SCALE COALESCER TESTS .................................................... 10 4. COMMERCIAL COALESCERS ...................................................................................... 12 5. RESULTS AND DISCUSSION ........................................................................................ 14 5.1 PHYSICAL PROPERTIES MEASUREMENTS..................................................... 14 5.2 SOLVENT ENTRAINMENT TESTS ..................................................................... 16 5.3 WEBER NUMBER EVALUATION....................................................................... 19 5.4 COALESCER MEDIA INTEGRITY ...................................................................... 20 5.5 LABORATORY-SCALE COALESCER TESTS .................................................... 23 ACKNOWLEDGMENTS....................................................................................................... 24 REFERENCES ....................................................................................................................... 25 APPENDIX A. CHEMICAL ANALYSIS OF SIMULANT FROM ENTRAINMENT TESTS FOR BOBCALIXC6 AND CS-7SB CONTENT............................... 27 APPENDIX B. CHEMICAL ANALYSIS OF SIMULANT FROM ENTRAINMENT TESTS FOR ISOPAR® L CONTENT ........................................................... 29 APPENDIX C. DROPLET SIZE DISTRIBUTIONS AND DATA FOR ENTRAINMENT TESTS.............................................................................. 30 APPENDIX D. SUMMARY OF PHYSICAL PROPERTY DATA........................................ 42 APPENDIX E. COALESCER VENDOR CONTACTS AND MEDIA SAMPLES................ 45

iv
FIGURES Page
1. Flowsheet for CSSX Process Proof-of-Concept Tests with Solvent Recycle ................... 2 2. Flowsheet for Solvent Entrainment Test ......................................................................... 9 3. Laboratory-Scale Coalescer ............................................................................................ 10 4. Experimental Setup for Laboratory-Scale Coalescer Tests .............................................. 11 5. Variation in Density as a Function of Temperature for the Full-Component Simulant and Deionized Water ...................................................................................................... 14 6. Viscosity of Solvent vs. Temperature.............................................................................. 15 7. Viscosity of Full- and Four-Component Simulants vs. Temperature................................ 15 8. Effect of Temperature on Interfacial Tension between Full SRS Simulant and CSSX Solvent................................................................................................................. 16 9. Droplet Size Distributions for Entrainment Test Raffinate Samples ................................ 18
10. Droplet Size Distributions for Two Entrainment Test Raffinate Samples and Blank SRS Waste Simulant after Standing for 12 Days ............................................................. 19 11. Weber Number as a Function of Droplet Size and Velocity at 25ºC ................................ 20 12. Effect of Temperature on Weber Number ....................................................................... 20 C.1. Droplet Size Distribution and Data for First Entrainment Test Sample............................ 30 C.2. Droplet Size Distribution and Data for Second Entrainment Test Sample........................ 32 C.3. Droplet Size Distribution and Data for Third Entrainment Test Sample .......................... 34 C.4. Droplet Size Distribution and Data for Fourth Entrainment Test Sample......................... 36 C.5. Droplet Size Distribution and Data for Blank SRS Waste Simulant ................................ 38 C.6. Droplet Size Distribution and Data for Blank Four-Component Simulant ....................... 40 E.1. Franken Filtertechnik GN Silica-Based Media ................................................................ 61 E.2. Franken Filtertechnik MF Stainless Steel Media ............................................................. 61

v
FIGURES (continued) Page E.3. Frank Filtertechnik MN Stainless Steel Media ................................................................ 62 E.4. Koch Otto-York 316SS Mesh Sample, Stainless Steel Mesh........................................... 62 E.5. Koch Ott-York 316SS/TEF Mesh Sample, Stainless Steel and Fluoropolymer Mesh ...... 63 E.6. Mercer International Sample 1, Stainless Steel Mesh ...................................................... 63 E.7. Mercer International Sample 2, Stainless Steel Coupon .................................................. 63 E.8. McTighe Industries Sample A, Polymer Mesh Mixture................................................... 64 E.9. McTighe Industries Sample B, Polymer Mesh ................................................................ 64 E.10. McTighe Industries Sample C, Polymer Mesh ................................................................ 64 E.11. McTighe Industries Sample D, Polymer Mesh ................................................................ 65 E.12. McTighe Industries Sample E, Polymer Coupons ........................................................... 65 E.13. McTighe Industries Sample F, Polymer Coupons............................................................ 66 E.14. Filter Innovations Polymer Spheres ................................................................................ 66
vi
TABLES Page
1. Full-Component SRS Waste Simulant Composition for a 30-L Batch............................. 7 2. Commercial Coalescer Options....................................................................................... 12 3. Surface Tension Data...................................................................................................... 16 4. Chemical Analysis of Solvent Entrainment Samples ....................................................... 17 5. Media Compatibility Tests.............................................................................................. 22 6. Results of Tests with Laboratory-Scale Coalescer........................................................... 23
D.1. Interfacial Tension vs. Temperature................................................................................ 42 D.2. Surface Tension at Ambient Temperature ....................................................................... 42 D.3. Viscosity vs. Temperature .............................................................................................. 43 D.4. Simulant Density vs. Temperature .................................................................................. 43 D.5. Weber Number Calculation ............................................................................................ 44 E.1. Vendor Contact Information ........................................................................................... 45

1
RECOVERY OF ENTRAINED CSSX SOLVENT FROM CAUSTIC AQUEOUS RAFFINATE USING COALESCERS
Candido Pereira, Hassan A. Arafat, John R. Falkenberg, Monica C. Regalbuto, and
George F. Vandegrift
ABSTRACT
A solvent was developed at Oak Ridge National laboratory (ORNL) for a caustic-side solvent extraction (CSSX) process that removes cesium from Savannah River Site (SRS) tank waste. After treatment, a small fraction of the solvent is entrained in the caustic raffinate at a level of 100-300 ppm, well above the solubilities for the various solvent components. Recovery of this solvent can produce a potential cost saving in excess of $5M per annum based on a processing rate of 20 gpm. In this study we examined the issues associated with the use of a coalescer for solvent recovery and measured the physical properties of the solvent and simulant. The density, surface, and interfacial tension, and viscosity of the optimized solvent and a full-component SRS waste simulant were determined as a function of temperature. The entrainment of the solvent components in the SRS waste simulant during the operation of a four-stage 4-cm contactor unit was quantified based on chemical and volumetric analysis. The chemical stabilities of several candidate commercial coalescing media in the caustic simulant were examined. Stainless steel media showed little degradation over a 30-day test; polymer media tended to be coated by the organic. A laboratory-scale coalescer was operated in tandem with a four stage 4-cm contactor unit. Results indicate that a 90% recovery of the entrained solvent can be achieved using a commercial coalescer equipped with appropriate media and at appropriate operating conditions. Finally, several commercial coalescer options are discussed.
1. INTRODUCTION Approximately 34 million gallons of high-level radioactive waste are currently stored in underground tanks at the Savannah River Site (SRS) near Aiken, South Carolina [LEVENSON 2000]. A process developed at Oak Ridge National Laboratory (ORNL), in collaboration with Argonne National Laboratory (ANL) and SRS, was selected to remove cesium-137 (137Cs) from the waste prior to immobilizing the waste in low-level grout. The treatment technology, which is a caustic-side solvent extraction (CSSX) process, will utilize a multistage centrifugal contactor to extract 137Cs from the waste [LEONARD 2000]. The solvent consists of four components: (1) an extractant, calix[4]arene-bis(tert-octylbenzo-crown-6), designated BOBCalixC6, which is a calixarene crown that is very specific for cesium extraction; (2) a modifier, 1-(2,2,3,3,-tetrafluoropropoxy)-3-(4-sec-butylphenoxy)-2-propanol, also called Cs-7SB, which is an alkyl aryl polyether that keeps the extractant dissolved in the solvent and increases its ability to extract cesium in the extraction section; (3) a suppressant, tri-n-octylamine (TOA), which suppresses the effects of organic impurities to ensure that the cesium can be back-extracted from the solvent in the strip section; and (4) a diluent, Isopar® L, which is a mixture of branched-chain

2
hydrocarbons. The optimized solvent composition is 0.007 M BOBCalixC6, 0.75 M Cs-7SB, and 0.003 M TOA in Isopar® L. The flowsheet for the CSSX process proof-of-concept test, performed at ANL in FY01 using the optimized solvent, is shown in Figure 1 [LEONARD 2000]. In the extraction section (stages 1 through 15 in Fig. 1), cesium is extracted from the alkaline waste feed by the CSSX solvent. Then, as the organic solvent flows through the scrub section (stages 16 and 17), entrained alkaline aqueous solution and weakly extracted potassium are removed from the solvent. In the strip section (stages 18 through 32), cesium is stripped from the CSSX solvent into dilute nitric acid.
Fig. 1. Flowsheet for CSSX Process Proof-of-Concept Test with Solvent Recycle
Since the cost of the CSSX solvent is high, even small losses in the aqueous effluents can
be expensive. Recent cost estimates for the BOBCalixC6, Cs-7SB, and Isopar® L are $150/g, $1.5/g, and $5/gal, respectively [ARAFAT 2002A]. Based on these estimates, the cost of original solvent was approximately $1900/L [ARAFAT 2002A]. With the new, optimized solvent the cost is somewhat less, approximately $1600/L. During the CSSX process, the solvent is transferred to the aqueous phase via two mechanisms: partitioning (dissolution) and entrainment. Solvent loss through partitioning is dependent on the distribution ratios (i.e., D values) of the solvent components between the organic and aqueous phases. The D values for the Cs-7SB and BOBcalixC6 were estimated to be greater than 50,000 and 12,500 respectively, suggesting that solvent loss will arise predominantly from entrainment.
15 Stages2
Stages
Aqueous Raffinate(All componentsexcept Cs)(DW)Flow = 45.82 mL/min
Strip Effluent(Only CsNO3)(EW)Flow = 2.85 mL/min
Alkaline-Side TankWaste Feed(SRS Sim)(DF)Flow = 43.0 mL/min
Scrub Feed0.05 M HNO3(DS)Flow = 2.82 mL/min
Strip Feed0.001 M HNO3(EF)Flow = 2.85 mL/min
Extraction (1-15) Scrub(16-17)
Strip (18-32)
15 Stages
EP
DX
CSSX Solvent0.007M BoBCalixC60.75M Cs-7SB0.003M TOAIsopar® L (Bal.)Flow = 14.12mL/min

3
The recovery of entrained solvent should lead to a significant cost savings. As discussed in [ARAFAT 2002B], solvent entrainment accounts for most (>85%) of the solvent lost in the extraction section. In that report, solvent entrainment was found to average 121 ppm at steady operation for tests with the four-component simulant and an earlier solvent composition containing 0.010M BoBCalixC6, 0.5M Cs75B, and 0.001 M TOA. In this study, tests were conducted with a full-component simulant [PETERSON 2000] and the optimized solvent [KLATT 2001].
A number of options have been considered for recovery of the entrained solvent.
Physical separations using decanters, centrifuges, and coalescers were discussed in an earlier work, where the decanter was the only option among these three that was tested [ARAFAT 2002B]. Chemical separation by contacting the aqueous phase with organic diluent Isopar® L was also studied previously [ARAFAT 2002A]. Physical separation with a decanter proved inefficient, but calculations showed that a coalescer or centrifuge was feasible. Chemical separation achieved recovery of >90% of the entrained solvent components; however, further processing was refined to remove the excess diluent and adjust the extractant and modifier concentrations to those of the feed in addition to removing entrained organic diluent from the processed aqueous solution. In this report we examine the use of a coalescer to achieve the desired separation. In a coalescer, the aqueous effluent contacts a physical medium that causes the entrained solvent droplets to agglomerate or coalesce until they become large enough to collect on the surface of the aqueous phase, allowing for a separation to be achieved. The advantage over a decanter is the smaller size of the unit and the higher throughput. Since the coalescer is static, maintenance is minimal and energy requirements are much lower than for a centrifuge.
Several factors that affect the design of the coalescer were examined. Physical properties
of the simulant and solvent that play a role in the design of a coalescer, including the density, viscosity, and interfacial tension, were measured as a function of temperature. The entrainment of the CSSX solvent in the SRS waste simulant was measured by contacting the simulant and solvent in a four-stage 4-cm contactor unit. The stabilities of several candidate coalescing media in the caustic simulant were tested. Finally a laboratory-scale coalescer was demonstrated to effect the separation of the organic and aqueous phases in the raffinate from a contactor. The results indicate that a coalescer, under appropriate operating conditions and with suitable media, can effectively recover entrained solvent.

4
2. SUMMARY AND CONCLUSIONS The high cost of the solvent and the significant entrainment losses suggest that recovery
of the entrained solvent should lead to significant process savings. A coalescer is being considered for collecting and separating entrained CSSX solvent from the caustic raffinate. In order to test the viability of a coalescer and to size a commercial unit, we conducted experimental work to (1) measure the physical properties of the solvent and simulant that are required to size the coalescer and select an appropriate media, (2) determine the durability of various media materials when contacted with solvent and simulant, (3) extend the entrainment measurements to include SRS waste simulant and CSSX solvent, (4) examine the effectiveness of a laboratory-scale coalescer under process conditions, and (5) consider several available commercial coalescers.
A coalescer can be used to recover the entrained solvent. The coalescer consists of a
large cylindrical vessel that houses mesh-like media. Suspended solvent droplets adhere to the media and agglomerate over time. At a critical size, the inertial forces of the flowing simulant overcome the adhesive forces between the droplet and the mesh causing it to break free. The increased buoyancy of the enlarged droplets causes them to flow to the surface of the aqueous phase, where they coalesce further to form a layer that can be effectively separated from the aqueous phase.
We measured several physical properties of the simulant and solvent that play a role in
the design of a coalescer. Density, viscosity, and surface tension were determined as a function of temperature. The interfacial tension between the two liquids was also measured. Temperature was found to have a strong effect on the viscosity of the solvent, which varied from 5.3cP at 12°C to 2.2cP at 46°C. The viscosity of the simulant also varied with temperature, ranging from 4.6cP at 11°C to 2.0cP at 45°C. Interfacial tension and density did not vary strongly with temperature. The density of the simulant at 25°C was 1.26 g/mL; the surface tension was 59.7 dynes/cm. The surface tension of the solvent at 25°C was 24.3 dynes/cm. The interfacial tension between the SRS simulant and the CSSX solvent varied from 16.4 to 17.0 dyne/cm.
Entrainment was measured in the aqueous raffinate by contacting the simulant and
solvent in a four-stage 4-cm contactor unit. Solvent entrainment was higher than previous results for the four-component solvent and the older simulant composition; on the order of 300 ppm of solvent was entrained in the simulant based on analysis of the aqueous phase for BOBcalixC6 and modifier content. Entrainment was also measured as part of the tests with a laboratory-scale coalescer. I n one test, the quantity of solvent collected was consistent with an entrained solvent content of ~350 ppm, in the same range as the results obtained by chemical analysis.
The organic component of the raffinate produced by a four-stage 4-cm contactor unit with SRS simulant and CSSX solvent as the feed was successfully separated from the aqueous component with a laboratory-scale coalescer equipped with mesh-like media. The aqueous product from the coalescer was selectively and continually drained from the coalescer while the organic accumulated within the vessel. At the end of the test, the coalescer was completely drained. Over one six-hour test with a Franken Filtertechnik MN media, 8 mL of organic phase

5
was collected from 22.5 L of raffinate, corresponding to 90+% recovery of the entrained solvent based on the entrainment test results. In tests with a coarser media and at higher flow rates, significantly less solvent was recovered, corresponding to 15 to 30% at the 300 ppm entrainment level, indicating that media selection and operating conditions may significantly affect performance. However, variability in contactor operation may also have resulted in much lower entrainment and therefore higher recovery.
The tests conducted to date with the laboratory-scale coalescer indicate that a coalescer,
under appropriate operating conditions and with suitable media, can be used to efficiently recover entrained solvent. There also appears to be some variability in the levels of entrainment from the test. Additional tests will have to be conducted to determine the optimal operating conditions and to select the best media because of the apparent variability. There was no visible change to the stainless steel media used in the tests with the laboratory-scale coalescer. A similar study of the recovery efficiency can readily be done for a centrifuge.

6
3. EXPERIMENTAL Physical properties were measured as a function of temperature. Chemical analysis of the solvent entrained in the simulant was performed at SRTC, and the BOBCalixC6, Cs-7SB, and Isopar® L diluent concentrations in the raffinate were measured. Conclusions related to solvent entrainment were based on the accuracy of these chemical analyses and additional measurements made using a laboratory-scale coalescer. Studies were conducted with the same four-stage, 4-cm contactor system used for the entrainment studies at the same organic to aqueous (O:A) ratio, 0.3, but the flow rates were adjusted to match the operating range of the coalescer. 3.1 PHYSICAL PROPERTIES MEASUREMENT FOR OPTIMIZED
SOLVENT AND FULL-COMPONENT SIMULANT
The solvent used for these tests was obtained from ORNL. The composition was that of the optimized solvent containing 0.007M BOBcalixC6 extractant, 0.75M Cs-7SB modifier, and 0.003M TOA in Isopar® L. In all of the tests the solvent was used as received.
Both four-component and full-component SRS waste simulants were used in the physical
properties measurements. The four-component simulant contained 2M NaOH, 2M NaNO3, 0.5M Al(NO3)3, and 0.5M NaNO2 in deionized water. The full-component simulant without radionuclides was formulated in-house following the procedure provided by SRS [PETERSON 2000]. The composition is given in Table 1. The full-component simulant is not stable. Although the SRS simulant was filtered after it was prepared, a precipitate continued to form as the simulant was stored. The precipitate was not analyzed. In these tests, wherever the full-component simulant was used, care was taken to exclude the precipitate by sampling only from the supernate at the top of the simulant storage vessel
Density Measurement: The density of the full-component simulant was measured as a
function of temperature. A clean, dry 25-mL volumetric flask was weighed. Slightly more than 25 mL of the simulant was added to the flask. The flask was immersed in a controlled- temperature bath until the solution attained the desired temperature. A pipette was used to adjust the simulant volume in the flask to 25mL. The simulant and flask were then weighed and the temperature was measured. Three samples were done at each temperature.

7
Table 1. Full-Component SRS Waste Simulant
Composition for a 30-L Batch
Component Quantity NaOH 3.57kg
Al(NO3)3.9H2O 3.16kg NaNO3 3.01kg NaNO2 1.04kg NaSO4 0.6kg
NaCO3.H2O 0.56kg NaSiO3.9H2O 0.26kg
Na2HPO4.7H2O 56.3g KNO3 45.6g NaCl 42.14g NaF 35.28g
Na2C2O4 32.16g NH4NO3 2.42g
Na2(MoO4).2H2O 0.57g Zn 85mg Sn 72mg Pb 63mg Fe 43.2mg Cr 30mg Ru 24.6mg Cu 15mg Pd 12.3mg Rh 6.3mg Hg 1.5mg Ag 0.3mg
HCOONa 68.05g N(CH3)3 0.86mg
DBP 0.324mg MBP 0.324mg
C4H13OH 0.06mg TBP 0.015mg
Viscosity Measurement: The viscosity of the CSSX solvent, the four-component
simulant, and the full SRS waste simulant were measured as a function of temperature. A Brookfield LVT 25 viscometer equipped with a UL spindle was used for all measurements. The spindle was immersed in the fluid and rotated at 60 rpm for the measurements reported in this document. The procedure outlined in ASTM D2196-99 was followed for all room-temperature measurements. At other temperatures, the vessel containing the fluid was immersed in a controlled-temperature bath, but the procedures were otherwise those listed in ASTM D2196. The temperature of the fluid was an average of that measured at different locations along the

8
spindle cylinder. The variation in temperature was typically small, <0.2°C, with the exception of the lowest temperatures, where variations as high as 5°C were observed. Typically, the coldest temperatures were at the bottom of the fluid where more of the fluid container was in contact with the cooling medium.
Surface and Interfacial Tension: The surface tension of the optimized solvent, the four-component simulant, and the full-component simulant were measured with a Fisher Scientific Tensiomet 100 tensiometer. The instrument is equipped with a platinum-iridium ring having a circumference of 5.993 cm and an R/r of 53.1666. The ring is immersed in the fluid of interest and slowly pulled up through the fluid. The force required to break through the fluid surface of the interface between two fluids is recorded and converted to an interfacial tension. All measurements were made with the instrument in manual mode. The procedure outlined in the instrument manual, based on ASTM 1331-89, was followed for all of the room-temperature measurements. At other temperatures, the vessel containing the fluid was immersed in a controlled-temperature bath prior to placement on the instrument stage; the same procedure was followed. The temperature of the vessel was measured before and after each measurement.
The ring was cleaned by rinsing with acetone, immersing in benzene, rinsing with
acetone, and heating in a butane torch to drive off any residual organic. Surface and interfacial tension measurements were made as a function of temperature. For the room-temperature measurement, the clean glass vessel was filled with full-component simulant, the ring was immersed in the simulant, and the optimized solvent was carefully poured onto the surface of the simulant. In subsequent measurements at other temperatures, the solvent was added to the simulant and immersed in a controlled-temperature bath prior to placement on the instrument stage. The ring was cleaned and immersed through the two layers after the temperature was equilibrated and prior to measurement. As a result, these measurements must be regarded only as showing the trend in interfacial temperature with temperature, since immersing the ring through both fluids contributes to experimental error.
3.2 SOLVENT ENTRAINMENT TESTS
A four-stage, 4-cm centrifugal contactor was used to study entrainment of solvent in the aqueous waste raffinate. The 4-cm contactors were chosen because (1) they should demonstrate higher stage efficiencies than 2-cm contactors [ARAFAT 2002A] and (2) they approach the expected 5.0- to 7.0-cm size of the contactor for a waste treatment facility that is at 15% of full scale. The experimental flowsheet is shown schematically in Figure 2. The solvent was recycled. The simulant was used once and collected; it was subsequently reused for the laboratory-scale coalescer tests described below.
The aqueous waste simulant was set at a flow rate of 100 mL/min. It was contacted with
the CSSX solvent, which was set at a flow rate of 30 mL/min to induce entrainment of the solvent in the aqueous phase. The O/A ratio, 0.3, is similar to that in the extraction section of the CSSX process flowsheet. As the aqueous effluent left stage 1 it was collected in a container and stored. The organic effluent was collected from stage 4 and continuously pumped into stage 1. The test was run for 2.5 hours. The test was started with 1.0 L of solvent and ~25 L of simulant. At a number of intervals and at the end of the test, samples of the aqueous raffinate were

9
collected for analysis of droplet size distribution and for shipment to SRTC for analysis of the various solvent components.
The SRTC developed an analytical procedure to measure the concentration of BOBCalixC6 and Cs-7SB modifier [WHITE 2002]; the entrained organic was extracted from the simulant by contacting with chloroform. The organic solution was then run through a series of chromatographic columns to isolate the BOBCalix6 and the Cs-7SB. A gas chromatograph-mass spectrometer was used to measure the Isopar® L content of the samples [CRUMP 2002]. The complete data set for these analyses given in Appendices A and B. Droplet size analysis was performed with a Coulter Counter unit. This technique uses light scattering to determine the distribution in diameter of particles and droplets suspended in a solution. A Fraunhofer algorithm for water-based solutions was used to convert the absorbance spectrum into a particle size distribution. Results of the particle size analysis for the test samples, the SRS waste simulant, and the four-component simulant are given in Appendix C.
Fig. 2. Flowsheet for Solvent Entrainment Test
3.3 COALESCER MEDIA INTEGRITY Samples of coalescer media were obtained from several vendors. The media consisted of polymeric, silica, or stainless steel mesh-like material. Samples of plastic and metal filter and structural components were also obtained from some vendors. The media were weighed and placed in a plastic bottle. The bottle was filled with 25-75 mL of simulant, to maintain a simulant-to-media mass ratio of 100, and capped solvent was subsequently added to the each of the sample bottles at a concentration of 1000 ppm. The media was initially completely immersed in the liquid in all cases; however, during the test, expansion of some media caused the samples to protrude from the surface of the solution. The samples were periodically examined visually to look for degradation. The presence of a film on the surface of the simulant indicated that some of the solvent had coalesced. After completion of the tests the samples were removed from the media, rinsed with deionized water, allowed to dry, and examined further with a light microscope.
Stage 1 Stage 2 Stage 3 Stage 4
CSSX SolventSimulant FeedSimulant Outlet

10
3.4 LABORATORY-SCALE COALESCER TESTS
A laboratory-scale coalescer was obtained from Franken Filtertechnik KG, Hurth, Germany. The unit dimensions are approximately 8 in. length and 2.5 in. diameter. A flanged section approximately 2 in. from the inlet port allows for access to the media housing and for internal cleaning. The unit contains eight 3/8-in.-ID ports for the feed inlet, the organic and aqueous outlets, pressure measurement, level control, and draining of the vessel. The media are housed in a Teflon® “puck” that is inserted within the unit at the flange location. The unit is rated for flow rates between 25 and 117 mL/min. The unit is shown in Figure 3.
Fig. 3. Laboratory-Scale Coalescer For the laboratory-scale tests, the unit was run in tandem with the four-stage, 4-cm
contactor used in the entrainment tests described above. The aqueous effluent from the contactors was fed directly into the coalescer feed inlet. The level within the unit was controlled by adjusting the height of the aqueous outlet tube. The feed to the unit was kept at a level that prevented backflow into the last contactor stage. The pressure drop across the media was approximately 3 in. of water. The unit was run at steady state for up to 6 hours, after which the unit was drained of its contents. These contents were collected in a separatory funnel and placed into volumetric flasks to isolate the organic phase. The organic phase was removed from the flask with a pipette. The volume collected was measured with a graduated cylinder or a calibrated centrifuge tube. The experimental setup is shown in Figure 4.

11
Fig. 4. Experimental Setup for Laboratory-Scale Coalescer Tests

12
4. COMMERCIAL COALESCERS
Vendors of liquid-liquid coalescers and separators were sent a description of the separation process requirements and data on the measured droplet size distribution and available physical property data for the solvent and simulant [ARAFAT 2002B, MOYER 2001]. We have received proposals from several commercial vendors outlining dimensions, media type, and cost for a coalescer sized for a 3.2-gal/min-scale plant. The unit is sized to process 3 gpm of waste. A summary of available commercial coalescers that may affect the separation is given in Table 2. Appendix E provides quotations from two vendors and photographs of the vendor-supplied media and structural samples that were tested for stability in the SRS waste simulant containing 1000 ppm CSSX solvent.
Table 2. Commercial Coalescer Options
Vendor Dimensions, ft
(LxWxH) Media Cost, $ Franken FilterTechnik 6x3x6 Stainless steel 15,000 Pall Equipment Corp. 10x1.25x4 Fluoropolymer 40,500
Koch-Otto York 5x1x2.5 Stainless steel/ fluropolymer 10,000
Mercer NA Stainless steel NA McTighe 5x1x2.5 Polypropylene 6000
Filter Innovations NA Polypropylene stainless steel 200,000
Amistco 7x1.5x2 Polymer 7,000
Liquid-liquid coalescer systems generally consist of three components: pre-filter, coalescing medium, and separator. The pre-filter removes suspended particulates that may lodge in the coalescing medium, disrupting its function. The coalescing medium consists of a mesh or structure form to which the entrained droplets adhere and coalesce into larger droplets. The separator separates and collects the light phase from the heavy phase.
Several configurations and designs are available based on either a horizontal or vertical configuration [WINES 2002]. Vertical configurations generally separate an entrained aqueous phase from a continuous organic phase. Separation is accomplished by use of a hydrophobic barrier. The horizontal configuration is used to separate systems characterized by low interfacial tension (<3 dynes/cm) and for systems in which the entrained phase is the organic and the aqueous phase is continuous. In this configuration, phase separation is accomplished by density difference, allowing the lighter phase to accumulate above the heavy phase. The lighter phase can be collected in a sump above the primary vessel or removed by a surface skimmer into a
13
separate segment of the vessel. Flat plate coalescers achieve simultaneous separation of solids and organics from an aqueous phase. In the coalescer, 0.2- to 50-µm droplets are transformed into ~1000-µm or larger droplets. This process is accomplished in following manner: droplets adhere to the media fiber or surface, bulk flow induces their translation to intersections where they combine or coalesce to form larger droplets that dislodge with the increase in drag due to bulk fluid flow. This process is repeated, with more open media if necessary, until droplets flow to the fluid interface.For interfacial tensions of >20 dyne/cm, large stable droplets are formed that are readily coalesced. Stable emulsions of small droplets are formed for interfacial tensions between 2 and 20 dyne/cm, which are more difficult to separate with a coalescer [WINES 2002, GARDNER 1997].
We have conducted tests with media from these vendors to determine the integrity of the
media. The dimensions of the commercial units vary to a small extent. The largest unit is ten feet long; however, ancillary equipment such as particulate filter housings are not reflected in some of the dimensions given. There is a very wide variation in the price of the units. Selection will be based on several factors but stability of the media in the caustic simulant will be a major consideration. Radiation damage to the polymeric components will be a factor as well, but was not examined.
14
5. RESULTS AND DISCUSSION 5.1 PHYSICAL PROPERTIES MEASUREMENTS
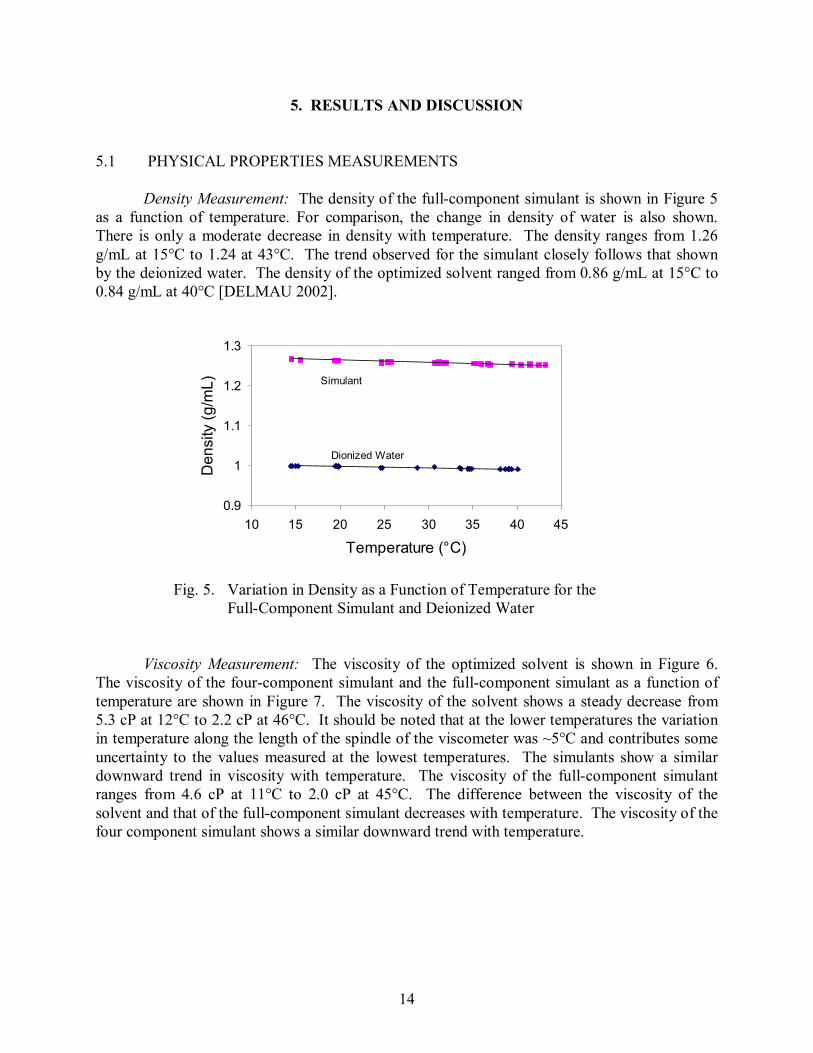
Density Measurement: The density of the full-component simulant is shown in Figure 5 as a function of temperature. For comparison, the change in density of water is also shown. There is only a moderate decrease in density with temperature. The density ranges from 1.26 g/mL at 15°C to 1.24 at 43°C. The trend observed for the simulant closely follows that shown by the deionized water. The density of the optimized solvent ranged from 0.86 g/mL at 15°C to 0.84 g/mL at 40°C [DELMAU 2002].
Fig. 5. Variation in Density as a Function of Temperature for the Full-Component Simulant and Deionized Water
Viscosity Measurement: The viscosity of the optimized solvent is shown in Figure 6. The viscosity of the four-component simulant and the full-component simulant as a function of temperature are shown in Figure 7. The viscosity of the solvent shows a steady decrease from 5.3 cP at 12°C to 2.2 cP at 46°C. It should be noted that at the lower temperatures the variation in temperature along the length of the spindle of the viscometer was ~5°C and contributes some uncertainty to the values measured at the lowest temperatures. The simulants show a similar downward trend in viscosity with temperature. The viscosity of the full-component simulant ranges from 4.6 cP at 11°C to 2.0 cP at 45°C. The difference between the viscosity of the solvent and that of the full-component simulant decreases with temperature. The viscosity of the four component simulant shows a similar downward trend with temperature.
0.9
1
1.1
1.2
1.3
10 15 20 25 30 35 40 45
Temperature (°C)
Den
sity
(g/m
L) Simulant
Dionized Water

15
Fig. 6. Viscosity of Solvent vs. Temperature
Fig. 7. Viscosity of Full- and Four-Component Simulants vs. Temperature
Surface and Interfacial Tension: The surface tension of the optimized solvent, the four-component simulant, and the full-component simulant are given in Table 3. The measurement for each component was repeated five times; the average value for each is listed in Table 3. The interfacial tension between the full simulant and the optimized solvent as a function of temperature is shown in Figure 8. Within experimental error there appears to be a slight increase in the interfacial tension with temperature, though one would expect a decrease with temperature. The values measured are slightly lower than the value of 18.8 dynes/cm reported previously [MOYER 2001].
0
1
2
3
4
5
6
10 15 20 25 30 35 40 45 50
Temperature (°C)
Visc
osity
(cP)
0.00.51.01.52.02.53.03.54.04.55.0
10 15 20 25 30 35 40 45 50
Temperature (°C)
Visc
osity
(cP)
Full-component
Four-component

16
Table 3. Surface Tension Data
Component Surface Tension, dynes/cm
Solvent 24.3 ±0.2 Four-component simulant 59.7 ±0.2 Full-component simulant 73.5 ±0.1
Fig. 8. Effect of Temperature on Interfacial Tension between
Full SRS Simulant and CSSX Solvent
5.2 SOLVENT ENTRAINMENT TESTS A four-stage, 4-cm centrifugal contactor unit was used to study entrainment of solvent in the aqueous waste raffinate. The experimental flowsheet is shown schematically in Figure 2. The solvent was continually recycled with no additional treatment. The simulant was used once. The full simulant was contacted at a flow rate of 100 mL/min with the CSSX solvent to create typical entrainment of the solvent in the aqueous phase. The O/A ratio was maintained at 0.3. The test was run for 2.5 hours. At a number of intervals and at the end of the test, samples of the aqueous raffinate were collected for droplet size distribution analysis and for shipment to SRTC for component analysis.
Six samples were submitted for chemical analysis. Four samples were taken during the test at 45-minute intervals. The last two were control samples consisting of simulant spiked with 100 and 300 ppm of the CSSX solvent. Results of the chemical analysis are shown in Table 4. The results of the chemical analysis for BOBcalixC6 and Cs-7SB content were in line with the concentration of these components in sample 5, the sample spiked with 300 ppm solvent, while the concentrations for sample 6, containing 100 ppm solvent, were at approximately one third of the concentrations in sample 5. Therefore, the control samples were internally consistent. However, the BOBcalixC6 concentrations measured for the control samples were higher than the
15.0
15.5
16.0
16.5
17.0
17.5
18.0
15 20 25 30 35 40
Temperature
Inte
rfaci
al T
ensi
on

17
calculated values. The measured Cs-7SB concentrations for the control samples were similar to the expected values. Analysis of the Isopar® L content was not consistent with this analysis.
Values tended to vary from sample to sample in an inconsistent fashion. The measured
values for samples 5 and 6 were much lower than the expected values.
Table 4. Chemical Analysis of Solvent Entrainment Samples
BOBCalixC6 Cs-7SB Isopar® L
Sample Conc., mg/L
Entrainment, ppm
Conc., mg/L
Entrainment, ppm
Conc., mg/L
Entrainment, ppm
1 4.2 522 101 398 7 10 2 4.25 528 105 414 6.3 9 3 3.71 461 88.1 347 3.2 5 4 4.89 608 126 496 16 23
AVG 4.26 530 105 414 8.1 12 5 4 497 90.8 358 24 34
5 (expected) 2.4 300 76.1 300 210 300 6 1.33 165 25.3 100 2.4 3
6 (expected) 0.8 100 25.4 100 70 100 The lack of consistency between the three analyses makes determination of a specific entrainment level difficult. However, it should be noted that the BOBCalixC6 and Cs-7SB concentrations match those of the control sample at 300 ppm and are approximately three times higher than those of the sample at 100 ppm. Therefore, the best estimate for the level of solvent entrainment is 300 ppm. Because the concentrations measured for the diluent are much lower than those for the extractant and modifier, it appears that diluent was lost from the samples upon handling and storage.
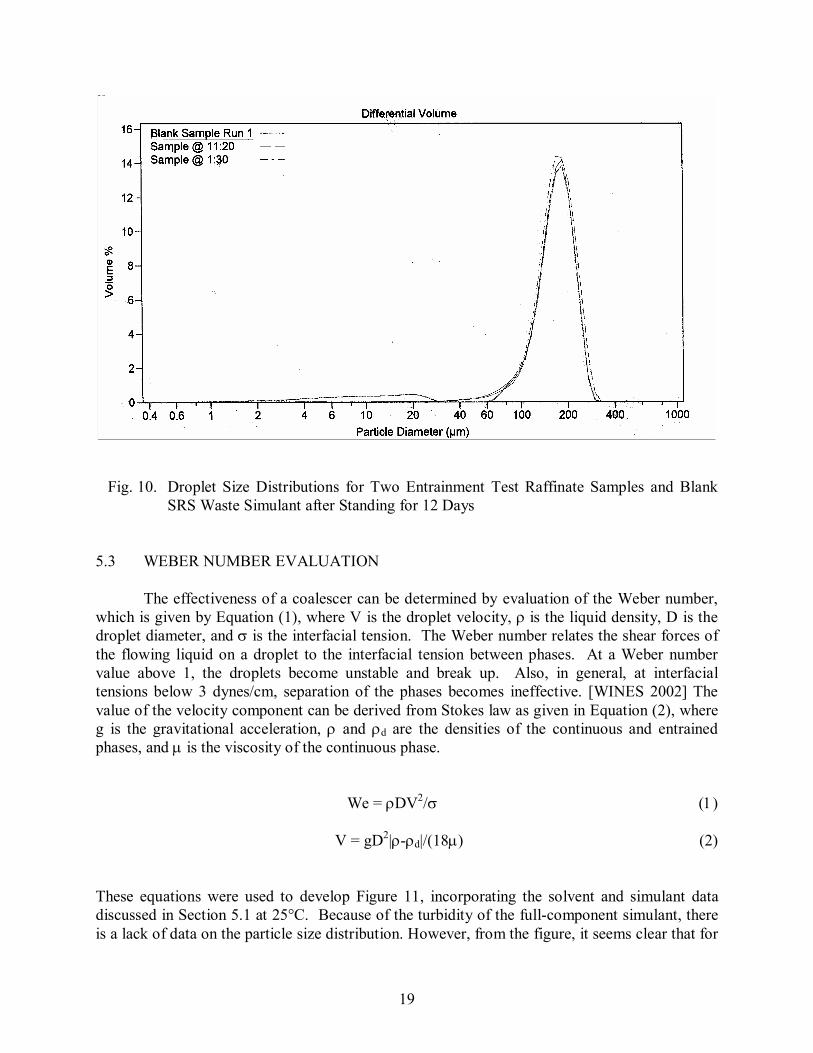
Particle size analysis of the raffinate samples was inconclusive. The samples collected during the test were essentially identical, as can be seen in Figure 9. There is a major peak between 50 and 200 µm centered at 120 µm. This large feature has a small shoulder centered at ~80 µm. A shallower feature is evident between 1 and 20 µm. The particle size analysis was similar to results obtained previously for the previous solvent composition entrained in the four-component simulant [ARAFAT 2002B]. Figure 10 shows particle size analysis of two samples left standing for 12 days. There is a shift in the large peak at 120 µm to larger particle sizes, 180 mm. The peak is also broader ranging from 50 to 300 µm. The shoulder at 80 mm has broadened as well. The features at smaller particle size have disappeared. The SRS simulant used in the entrainment test was also analyzed at this time and was found to be nearly identical to raffinate samples with entrained solvent that had been left standing, as can be seen in Figure 10; the four-component simulant had a particle size distribution similar to that of the SRS waste simulant. All of the particle size data are included in Appendix C.

18
Although not conclusive, these results suggest that the particle size distributions obtained were primarily due to salt precipitates or other particulate suspended within the solution rather than organic droplets. It is possible that features observed in Figure 9 can be attributed to the organic phase; notably, the features at small particle sizes and the presence of similar features in the distribution for the blank simulant suggest that these are, at least in part, associated with the solid precipitates . Because the blank samples showed particle size distribution similar to the raffinate, other techniques must be developed to determine the droplet size of the entrained organic in the simulant. However, the presence of precipitates makes quantification of the organic phase by other techniques extremely difficult. For example, laser light scattering of the four-component simulant indicated that the turbidity of the unspiked simulant was too high for quantitative analysis.
Fig. 9. Droplet Size Distributions for Entrainment Test Raffinate Samples
19
Fig. 10. Droplet Size Distributions for Two Entrainment Test Raffinate Samples and Blank
SRS Waste Simulant after Standing for 12 Days
5.3 WEBER NUMBER EVALUATION The effectiveness of a coalescer can be determined by evaluation of the Weber number,
which is given by Equation (1), where V is the droplet velocity, ρ is the liquid density, D is the droplet diameter, and σ is the interfacial tension. The Weber number relates the shear forces of the flowing liquid on a droplet to the interfacial tension between phases. At a Weber number value above 1, the droplets become unstable and break up. Also, in general, at interfacial tensions below 3 dynes/cm, separation of the phases becomes ineffective. [WINES 2002] The value of the velocity component can be derived from Stokes law as given in Equation (2), where g is the gravitational acceleration, ρ and ρd are the densities of the continuous and entrained phases, and µ is the viscosity of the continuous phase. We = ρDV2/σ (1) V = gD2|ρ-ρd|/(18µ) (2) These equations were used to develop Figure 11, incorporating the solvent and simulant data discussed in Section 5.1 at 25°C. Because of the turbidity of the full-component simulant, there is a lack of data on the particle size distribution. However, from the figure, it seems clear that for

20
particle sizes less than 1000 µm (1 mm), a coalescer will be effective for solvent recovery at 25°C. The same trend is observed at other temperatures with the Weber number increasing with increasing temperature as is shown in Figure 12.
Fig. 11. Weber Number as a Function of Droplet Size
and Velocity at 25°C. Desired range for coalescer suitability is shaded region.
Fig. 12. Effect of Temperature on Weber Number
5.4 COALESCER MEDIA INTEGRITY Samples of coalescer media were obtained from several vendors. The media consisted of plastic, silica, or stainless steel mesh-like material. Samples of plastic and metal filter and structural components were also obtained in some cases. The media were weighed and placed in plastic bottles. Each bottle was filled with 25 to 75 mL of simulant to maintain a simulant-to-media mass ratio of 100. The media was completely immersed in the liquid in most cases, although some expansion over time was observed. The samples were periodically examined visually to look for degradation. After completion of the tests the samples were removed from the media, allowed to dry and examined further with a light microscope.
0.0
0.5
1.0
1.5
2.0
0.01 0.1 1 10
Weber Number
Dro
plet
Siz
e, m
m
0
10
20
30
40
50
Dro
plet
Vel
ocity
(c
m/s
)
Diameter
Velocity
0.0
0.5
1.0
1.5
2.0
2.5
0.01 0.1 1 10
Weber Number
Dro
plet
Siz
e, m
m 35°C
15°C
25°C
Approx. Operating Region

21
Several general observations of the media tests can be made:
o The silica medium was the only sample that showed clear embrittlement and degradation. o The organic film on the fluid surface was generally more prevalent for the metal media. o The organic phase tended to coat the plastic media. o Degradation of the plastic meshes was observed, but only at the strand-to-strand junction
points. o Salt precipitation seemed more prevalent for the metal meshes. o The finest metal meshes tended to retain the organic.
A summary of the media compatibility tests is given in Table 5. Solid particulates were observed suspended in the simulant solution upon completion of
the media stability tests. There was also a small amount of precipitate in the bottom of some sample containers from these tests. Similar precipitates were observed at the base of the container housing the source simulant from which these samples were taken, and within the four-stage contactor used in the entrainment and coalescer tests. The precipitates are likely salt coming out of the meta-stable simulant. Small crystallites were evident adhering to all of the media samples once they had dried after the test were completed. It is possible that the media served as a nucleation center for salts that precipitated out of solution. The media from the lab-scale coalescer test did not show evidence of such crystallites. These results do suggest that a pre-filter should be used in tandem with the coalescer.

22
Table 5. Media Compatibility Tests
Media Composition Observations
Franken GN Silica Mesh Extensive swelling. Media became brittle with immersion. Very cloudy simulant.
Franken MF Stainless Steel Mesh
Some swelling. Most of organic was trapped within media. Removed by compressing media. Clear simulant.
Franken MN Stainless Steel Mesh
Slight swelling. Most of organic was trapped within media. Removed by compressing media. Clear simulant.
Mercer 1 Stainless Steel Mesh
Media was unchanged. Some organic formed film in web. Organic at simulant surface. Extensive salt precipitation.
Mercer 2 Stainless Steel Coupon
Brown spots on coupon. Solution is clear.
Koch-Otto York 316
Stainless Steel Mesh
Media was unchanged. Some organic formed film in web. Organic at simulant surface. Some salt precipitation.
Koch-Otto York 316-TEF
Stainless Steel-Teflon Mesh
Media was unchanged. Some organic formed film in web. Organic at simulant surface. Clear simulant. Few tiny droplets on mesh. Some salt precipitation.
Koch-Otto York 316/316-TEF
Stainless Steel-Teflon Mesh
Media was unchanged. Some organic formed film in web. Organic at simulant surface. Clear simulant. Few tiny droplets on mesh; larger at steel-Teflon junctions. Some salt precipitation.
McTighe A Polymer Mesh
Media was unchanged. Organic coats surface of thicker mesh filaments. Solution is very clear with organic film on surface.
McTighe B Polymer Mesh
Solvent coats sample but no clear evidence of degradation. Less salt precipitation than on metal samples.
McTighe C Polymer Mesh
Mesh beginning to unwind at junctions. Solution adheres to triangular crevices in mesh. Organic is present on surface but not as extensive as other media.
McTighe D Polymer Mesh
Mesh broke apart. Small droplets adhered to straight sections. Solution is similar to McTighe C.
McTighe E Polymeric Coupon
Simulant, primarily organic, adheres to media. Solution is clear. Organic surface layer is less substantial than in other samples.
McTighe F Polymeric Coupon
Simulant, primarily organic, adheres to media. Small particulates are evident in solution. As for McTighe E, organic surface layer is less substantial than in other samples less substantial than in other samples.
Filter Innovations
Polymeric Unit
No indication of degradation. Simulant or organic coated the surface; could be removed by wiping or washing. Simulant solution was clear with small droplets of organic evident on surface and suspended particulates.

23
5.5 LABORATORY-SCALE COALESCER TESTS
A laboratory-scale coalescer was obtained from Franken FiltertechnikKG. The unit was run in tandem with the four-stage, 4-cm contactor set used in the entrainment tests described above. The aqueous effluent from the contactors was fed directly into the coalescer feed inlet. The level within the coalescer was controlled by adjusting the liquid height in the aqueous-phase outlet tube. The feed to the unit was kept at a level that prevented backflow into stage 1. The pressure drop across the coalescer media varied from approximately 3 to 4 in. of water. The test was run at steady state for 2.5 to 6.75 hours after which the coalescer was drained of its contents. These contents were collected in a separatory funnel and placed into volumetric flasks to isolate the organic phase. The deionized water used to flush the coalescer was also added to the separatory funnel. The organic phase was removed from the flask with a pipette. The volume collected was measured with a graduated cylinder.
Results are given in Table 6 for the three tests that were run. Tests were run at two flow rates with two different media—a fine media, MN, and a coarse media, MC. The results indicate that a greater quantity of solvent is recovered at the lower flow rate and with the finer media, MN. These results follow the expected trends for the performance of the coalescer. The coarser media does not appear to be as effective as the finer media. The higher flow rate was at the maximum-rated capacity of the coalescer, which may have limited its performance. The fraction of organic that can be recovered depends on the amount that is entrained. The solvent recovered in the initial test was consistent with entrainment at the 350 ppm level; this entrainment is also consistent with the chemical analysis results for the entrainment tests discussed above. The quantity of organic in the raffinate from the contactor was not quantified, but based on the data above, the coalescer test results suggest that a major fraction of the entrained organic was recovered in the first test, but that a lesser fraction was recovered in the other two tests.
These tests indicate that a substantial fraction of the solvent can be recovered with the
coalescer at appropriate flow rates and with suitable media. The variation in the amount of solvent recovered suggests a strong media effect. The effectiveness of the coalescer and the effect of the media on its performance can be readily quantified by conducting a systematic study with several different media and varying the operating conditions. For entrainment at the 300 ppm level in a 20.1-gal/min plant-scale operation [HODGES 2000] for 240 day/yr, the total annual cost of solvent lost via entrainment to both extraction and strip solutions would be approximately $14,000,000/yr. At the lower level of entrainment, 100 ppm, the cost remains significant at ~$5M/yr for the same flow rate.
Table 6. Results of Tests with Laboratory-Scale Coalescer
Test (media) Aqueous Flow Rate, mL/min
Organic Flow Rate, mL/min Duration, h
Solvent Recovered, mL
1 (MN)a 57.7 17.3 6.75 8.1 2 (MN) 90 27.5 5.3 2.3 3 (MC)a 60.0 17.3 6.25 1.2
aMN and MC are the designations used by Franken Filtertechnik for the media.
24
ACKNOWLEDGMENTS This work was supported by the U.S. Department of Energy, Office of Environmental Management, through the Office of Project Completion and the Tank Focus Area of the Office of Science and Technology under Contract W-31-109-Eng-38 with Argonne National Laboratory, managed by the University of Chicago. Thomas White and Steve Crump of SRTC performed the chemical analysis of the simulant from the solvent entrainment tests.

25
REFERENCES
ARAFAT 2002A
H. A. Arafat, J.R. Falkenberg, and R. A. Leonard, Solvent Recovery from Aqueous Effluent Using Process Diluent in the Caustic Side Solvent Extraction (CSSX) Process, Argonne National Laboratory Report ANL-02/31 (2002).
ARAFAT 2002B H. A. Arafat, M. C. Hash, A. S. Hebden, and R. A. Leonard, Characterization and Recovery of Solvent Entrained During the Use of Centrifugal Contactors, Argonne National Laboratory Report ANL-02/08 (2002).
CRUMP 2002
S. Crump, Savannah River Technology Center, private communication (2002). DELMAU 2002
L. Delmau, Oak Ridge National Laboratory, private communication (2002).
GARDNER 1997 A. Gardner, ”Refining Details: Advances in Liquid/Liquid Coalescing Technology,” Today’s Refinery, March 1997.
HODGES 2000
M.E. Hodges, Design Input-Caustic Side Solvent Extraction Flowsheet-Proof of Concept Testing, Westinghouse Savannah River Company Report HLW-SDT-2000-000356 (2000).
KLATT 2001 L. N. Klatt, J.F. Birdwell, Jr, P. V. Bonneson, L. H. Delmau, L. J. Foote, D. D. Lee, R. A. Leonard, T. G. Levitskaia, M. P. Maskarinec, and B. A. Moyer, “Caustic-Side Solvent Extraction-Composition Recommendation,” Oak Ridge National Laboratory Report ORNL/TM-2001/258 (2002).
LEONARD 2000 R. A. Leonard, S. B. Aase, H. A. Arafat, C. Conner, J. R. Falkenberg, and G. F. Vandegrift, Proof-of-Concept Flowsheet Tests for Caustic-Side Solvent Extraction of Cesium from Tank Waste, Argonne National Laboratory Report ANL-00/30 (2000).
LEONARD 2002
R. A. Leonard, S. B. Aase, H. A. Arafat, C. Conner, D.B. Chamberlain, M.C. Regalbuto, and G. F. Vandegrift, Multi-Day Test of the Caustic-Side Solvent Extraction Flowsheet for Cesium Removal from a Simulated SRS Tank Waste, Argonne National Laboratory Report ANL-02/11 (2002).

26
LEVENSON 2000 M. Levenson et al., "Alternatives for High-Level Waste Salt Processing at the Savannah River Site," National Research Council, National Academy Press, Washington, DC (2000).
MOYER 2001
B. A. Moyer, S. D. Alexandratos, P. V. Bonnesen, G. M. Brown, J. E. Caton, L. H. Delmau, C. R. Duchemin, T. J. Haverlock, T. G. Levitskaia, M. P. Maskarinec, F. V. Sloop, and C. L. Stine, “Caustic-Side Solvent Extraction Chemical and Physical Properties: Progress in FY2000 and FY2001,” Oak Ridge National Laboratory Report ORNL/TM-2001/285 (2001).
PETERSON 2000
R. A. Peterson, “Preparation of Simulated Waste Solutions for Solvent Extraction,” Westinghouse Savannah River Company Report WSRC-RP-2000-00361, Rev. 0 (2000).
WHITE 2002
T. White, Savannah River Technology Center, private communication (2002). WINES 2002
T. H. Wines and R. L. Brown, “Minimizing Liquid Contaminants in Natural Gas Liquids,” Pall Corporation Report (2002).

27
APPENDIX A. CHEMICAL ANALYSIS OF SIMULANT FROMENTRAINMENT TESTS FOR BOBCALIXC6 AND CS-7SB CONTENT
The following report on the BOBCalixC6 and Cs-7SB entrainment levels was prepared by Thomas White of SRTC: Concentrations in mg/L were determined on an Agilent LC instrument with chloroform mobile phase and a Shodex K-801GPC column. The data is recorded in notebook #2001-0141. Salt Solution Results and Preparation Sample ID CabtBC6 Cs-7SB 1 4.20 101 2 4.25 105 3 3.71 88.1 4 4.89 126 5 4.00 90.8 6 1.33 25.3 Sample amounts were determined by weight and converted to volume using a density of 1.285. The samples were emptied into a separatory funnel and the containers were rinsed three times with chloroform. Each sample was extracted with chloroform three times (3 x 20 mL), dried with anhydrous sodium sulfate, and the extracts were combined and concentrated to 2.00 mL. Receipt of Samples Six yellow aqueous samples (~100 mL) in Nalgene HDPE 125 mL were received from Argonne on 8/12/02. The samples were double boxed with packing material. According to Pereira, these containers were the ones used to collect the sample from the solvent extraction process. Standards Standards of calix[4]arene-bis(tert-octylbenzo-crown-6) (extractant, IBC Advanced Technologies) and 1-(2,2,3,3-tetrafluoropropoxy)-3-(4-tert-octylphenoxy)-2-propanol (modifier) were prepared in chloroform and analyzed. Extractant Modifier Theoretical 24.2 mg/L 116 mg/L Actual 25.8 mg/L 116 mg/L
Cesium extraction solvent (PVB B000894-31W; 12,000 mg/L extractant and 170,000 mg/L modifier) was diluted 1:200 in chloroform and injected 5 times (n=5).

28
n=5 Extractant,
mg/L
Modifier, mg/L v=4 11,700 174,000 t=2.776 11,700 174,000 11,900 170,000 12,000 170,000 12,000 170,000 Average 11,800 172,000 St. dev. 160 2240 %rsd 1.35 1.31 95% con. ± 199 ± 2780
Standards of cesium extraction solvent were analyzed before and after the sample analyses at 1 to 666 dilutions. Extractant,
mg/L
Modifier, mg/L Before 12,100 171,000 After 11,000 171,000 Spike After the initial three extractions and work-up of sample #1, sample #1 was extracted three more times and worked up. This indicates about three percent of the solvent remains in the salt solution after three extractions. Extractant,
mg/L
Modifier, mg/L Initial extraction round 250 6020 Second extraction round 6.33 119 % yield in second 2.47 1.94 Cesium extraction solvent was then spiked into sample #1 and a greater than 86 % recovery was obtained for both components. Extractant,
mg/L
Modifier, mg/L Theoretical 60.0 850 Actual 52.0 940 % Recovery 87 110

29
APPENDIX B. CHEMICAL ANALYSIS OF SIMULANT FROM ENTRAINMENT TESTS FOR ISOPAR® L CONTENT
The following report on the Isopar L content of the simulant from the entrainment tests was prepared by Steven Crump of SRTC: SRT-ADS-02-0452 Discussion of Results
Six aqueous samples were analyzed for Isopar® L content, and results are tabulated below. Sample 1B was analyzed to check for residual analyte in the aqueous sample after extractions had been carried out, and showed that 3 % of the Isopar® L remained in the aqueous samples after the initial extraction. The detection limit for all samples in this study was 0.02 mg/L.
Sample ID Isopar® L, mg/L1A 7.0 1B 0.25 2 6.3 3 3.2 4 16 5 24 6 2.4
Experimental The aqueous samples were extracted three times with chloroform and the combined extracts
were dried and concentrated under nitrogen, then analyzed by Gas Chromatography/Mass Spectrometry (GC/MS). Sample 1 was re-extracted an additional three times to generate sample 1B. GC/MS analysis was carried out using isotopic dilution to quantitate Isopar® L. The isotopic diluent employed for this study was dodecane-d26 (Aldrich).
GC/MS analysis was employed to identify organic compounds in the samples. Analysis were carried out in building 773-A, laboratory B-123. It should be noted that ADS is not certified by DHEC for NPDES discharge compliance monitoring.
Analytical separations were carried out on a Hewlett Packard 6890 gas chromatograph, equipped with a 30 m DB-5 column, with 0.25 mm diameter and 0.25 µm film thickness. Quantification was performed using a Hewlett Packard 5973 mass selective detector. The mass spectrometer tuning was confirmed within 24 hours prior to each measurement using perfluorotributylamine.
30
APPENDIX C. DROPLET SIZE DISTRIBUTIONS AND DATA FOR ENTRAINMENT TESTS
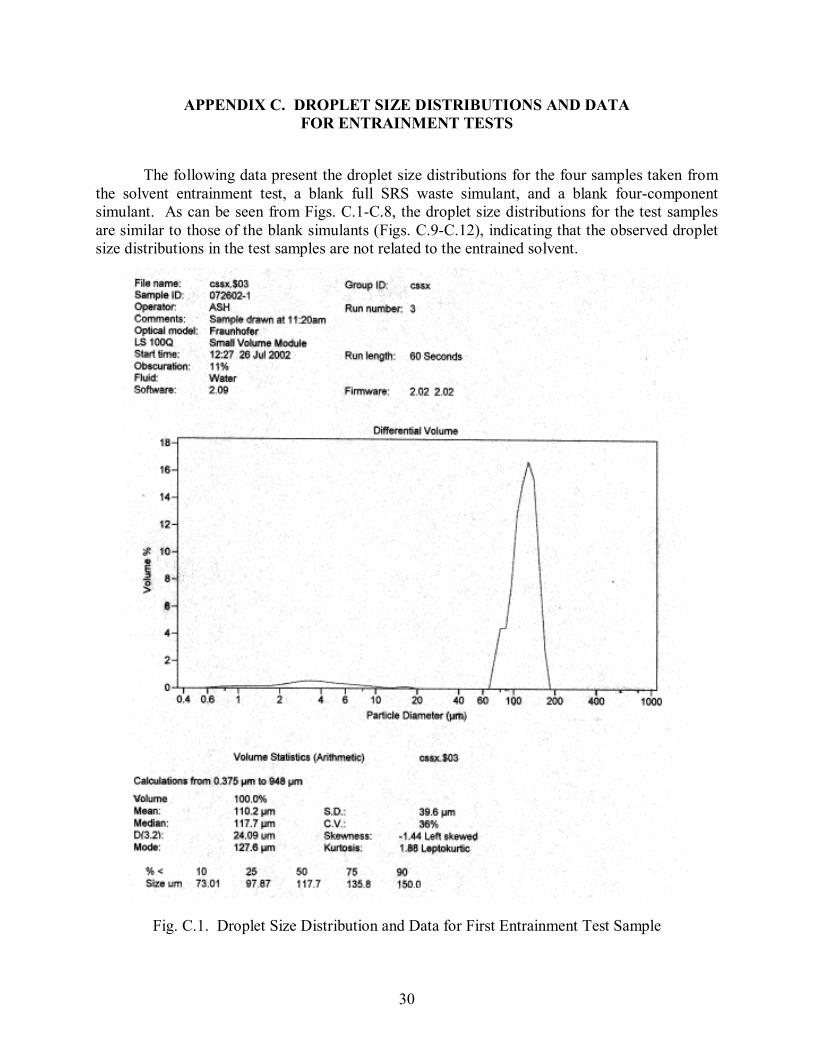
The following data present the droplet size distributions for the four samples taken from the solvent entrainment test, a blank full SRS waste simulant, and a blank four-component simulant. As can be seen from Figs. C.1-C.8, the droplet size distributions for the test samples are similar to those of the blank simulants (Figs. C.9-C.12), indicating that the observed droplet size distributions in the test samples are not related to the entrained solvent.
Fig. C.1. Droplet Size Distribution and Data for First Entrainment Test Sample

31
Fig. C.1. (Continued)

32
Fig. C.2. Droplet Size Distribution and Data for Second Entrainment Test Sample

33
Fig. C.2. (Continued)

34
Fig. C.3. Droplet Size Distribution and Data for Third Entrainment Test Sample

35
Fig. C.3. (Continued)

36
Fig. C.4. Droplet Size Distribution and Data for Fourth Entrainment Test Sample

37
Fig. C.4. (Continued)
38
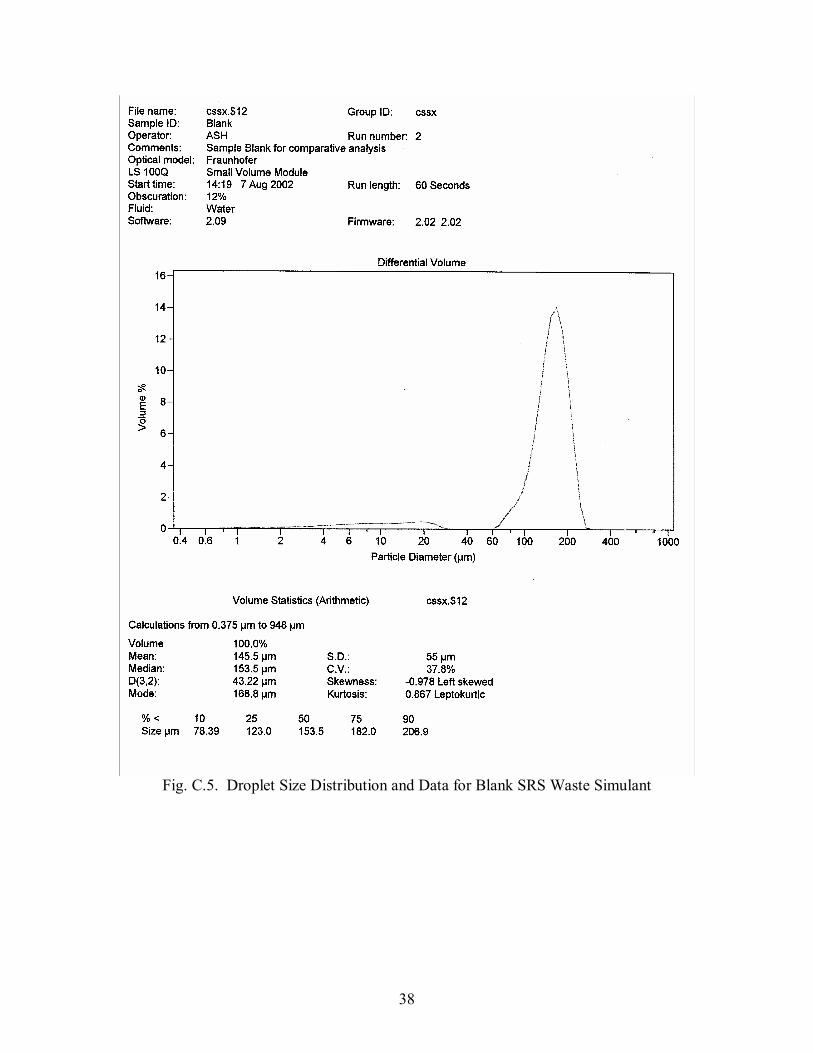
Fig. C.5. Droplet Size Distribution and Data for Blank SRS Waste Simulant
39
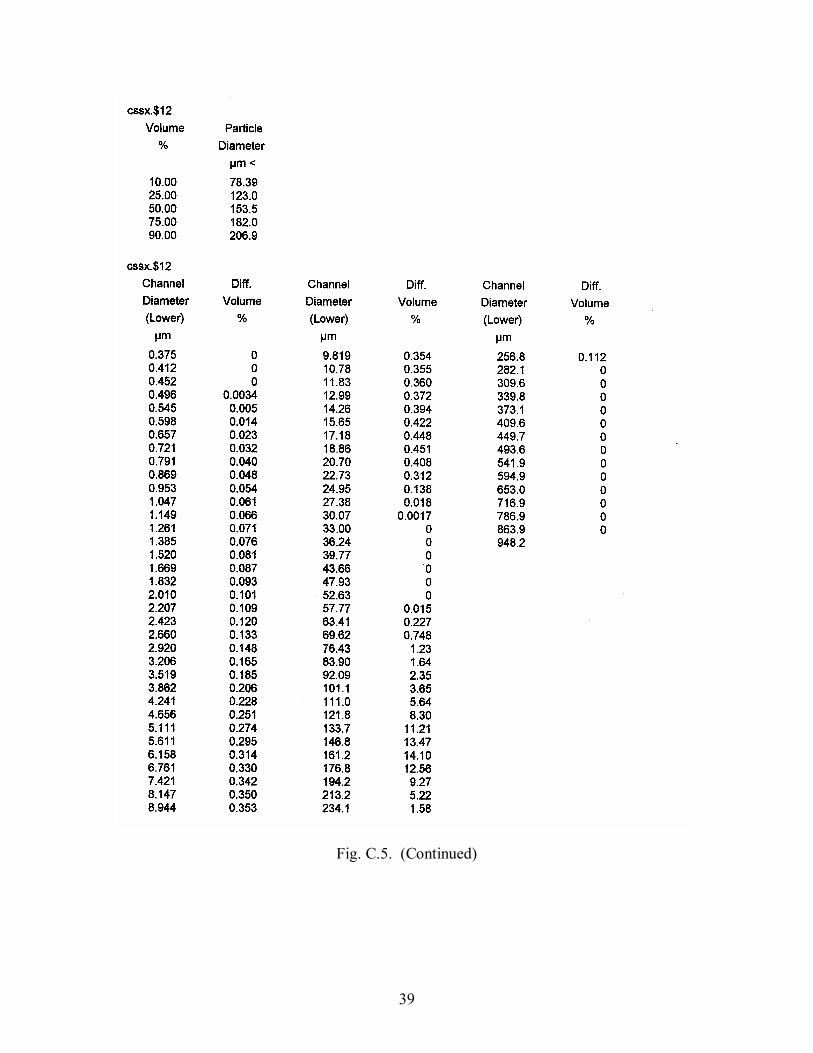
Fig. C.5. (Continued)

40
Fig. C.6. Droplet Size Distribution and Data for Blank Four-Component Simulant

41
Fig. C.6. (Continued)
42
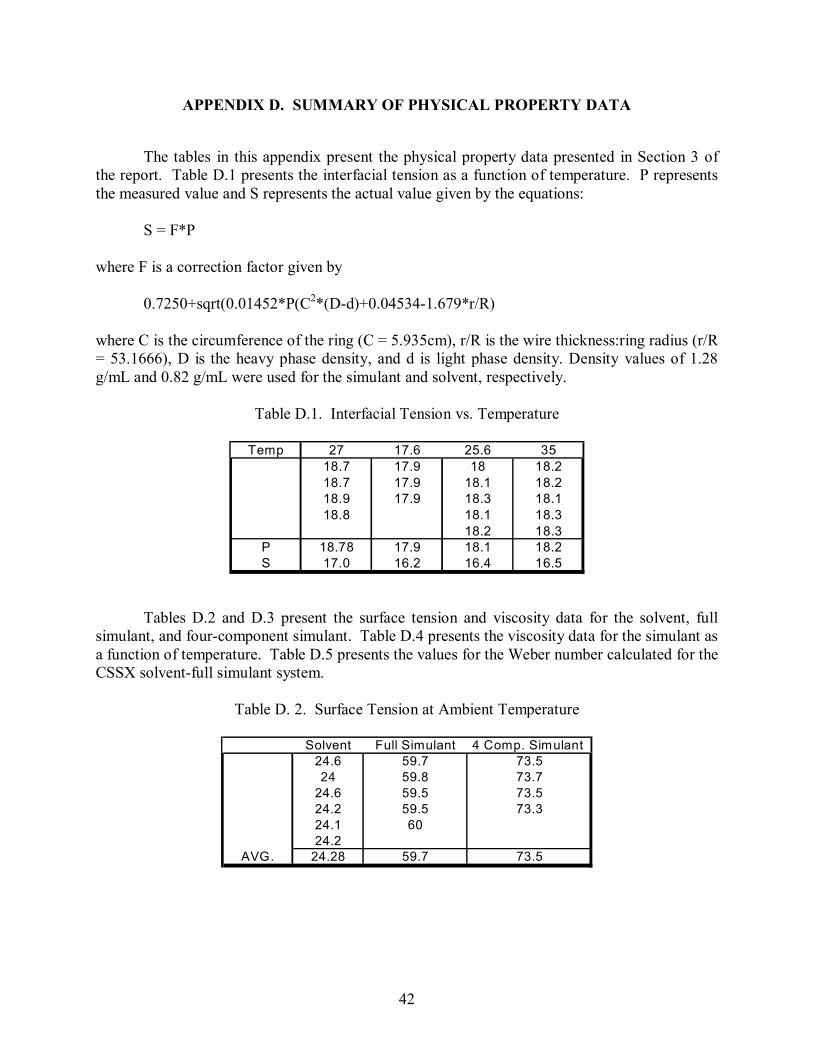
APPENDIX D. SUMMARY OF PHYSICAL PROPERTY DATA
The tables in this appendix present the physical property data presented in Section 3 of
the report. Table D.1 presents the interfacial tension as a function of temperature. P represents the measured value and S represents the actual value given by the equations:
S = F*P
where F is a correction factor given by 0.7250+sqrt(0.01452*P(C2*(D-d)+0.04534-1.679*r/R) where C is the circumference of the ring (C = 5.935cm), r/R is the wire thickness:ring radius (r/R = 53.1666), D is the heavy phase density, and d is light phase density. Density values of 1.28 g/mL and 0.82 g/mL were used for the simulant and solvent, respectively.
Table D.1. Interfacial Tension vs. Temperature
Temp 27 17.6 25.6 35
18.7 17.9 18 18.218.7 17.9 18.1 18.218.9 17.9 18.3 18.118.8 18.1 18.3
18.2 18.3P 18.78 17.9 18.1 18.2S 17.0 16.2 16.4 16.5
Tables D.2 and D.3 present the surface tension and viscosity data for the solvent, full
simulant, and four-component simulant. Table D.4 presents the viscosity data for the simulant as a function of temperature. Table D.5 presents the values for the Weber number calculated for the CSSX solvent-full simulant system.
Table D. 2. Surface Tension at Ambient Temperature
Solvent Full Simulant 4 Comp. Simulant
24.6 59.7 73.524 59.8 73.7
24.6 59.5 73.524.2 59.5 73.324.1 6024.2
AVG. 24.28 59.7 73.5
43
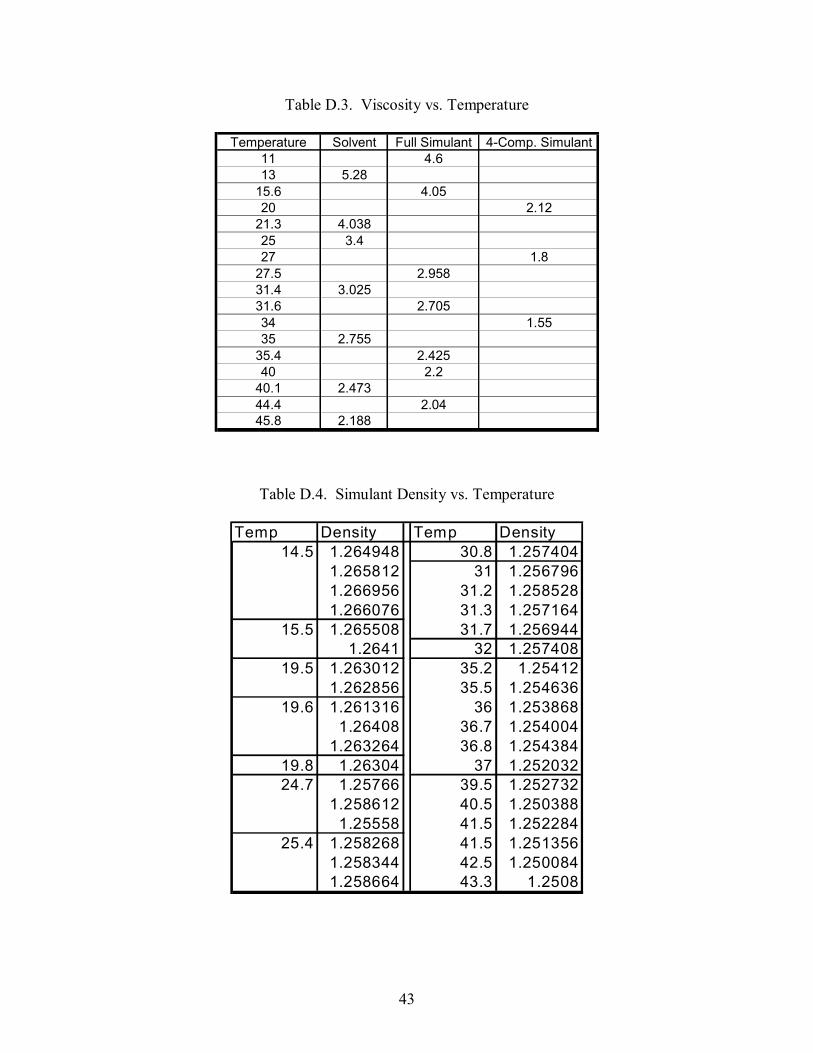
Table D.3. Viscosity vs. Temperature
Temperature Solvent Full Simulant 4-Comp. Simulant11 4.613 5.28
15.6 4.0520 2.12
21.3 4.03825 3.427 1.8
27.5 2.95831.4 3.02531.6 2.70534 1.5535 2.755
35.4 2.42540 2.2
40.1 2.47344.4 2.0445.8 2.188
Table D.4. Simulant Density vs. Temperature
Temp Density Temp Density14.5 1.264948 30.8 1.257404
1.265812 31 1.2567961.266956 31.2 1.2585281.266076 31.3 1.257164
15.5 1.265508 31.7 1.2569441.2641 32 1.257408
19.5 1.263012 35.2 1.25412 1.262856 35.5 1.254636
19.6 1.261316 36 1.253868 1.26408 36.7 1.254004 1.263264 36.8 1.254384
19.8 1.26304 37 1.25203224.7 1.25766 39.5 1.252732
1.258612 40.5 1.250388 1.25558 41.5 1.252284
25.4 1.258268 41.5 1.251356 1.258344 42.5 1.250084 1.258664 43.3 1.2508

44
Table D.5. Weber Number Calculation
ρ 1.25 g/cc ρd 0.84 g/cc V 8.1E-06 cm/s σ 16.5 dyne/cm µ 2.7 cP µd 3.5 cP D microns V cm/s We
1 8.07E-06 4.89E-162 3.23E-05 1.56E-144 1.29E-04 5.01E-138 5.16E-04 1.60E-11
16 2.06E-03 5.13E-1032 8.26E-03 1.64E-0864 3.30E-02 5.25E-0764 3.30E-02 5.25E-07
128 1.32E-01 1.68E-05256 5.29E-01 5.38E-04512 2.11E+00 1.72E-02
1024 8.46E+00 5.50E-012048 3.38E+01 1.76E+01

45
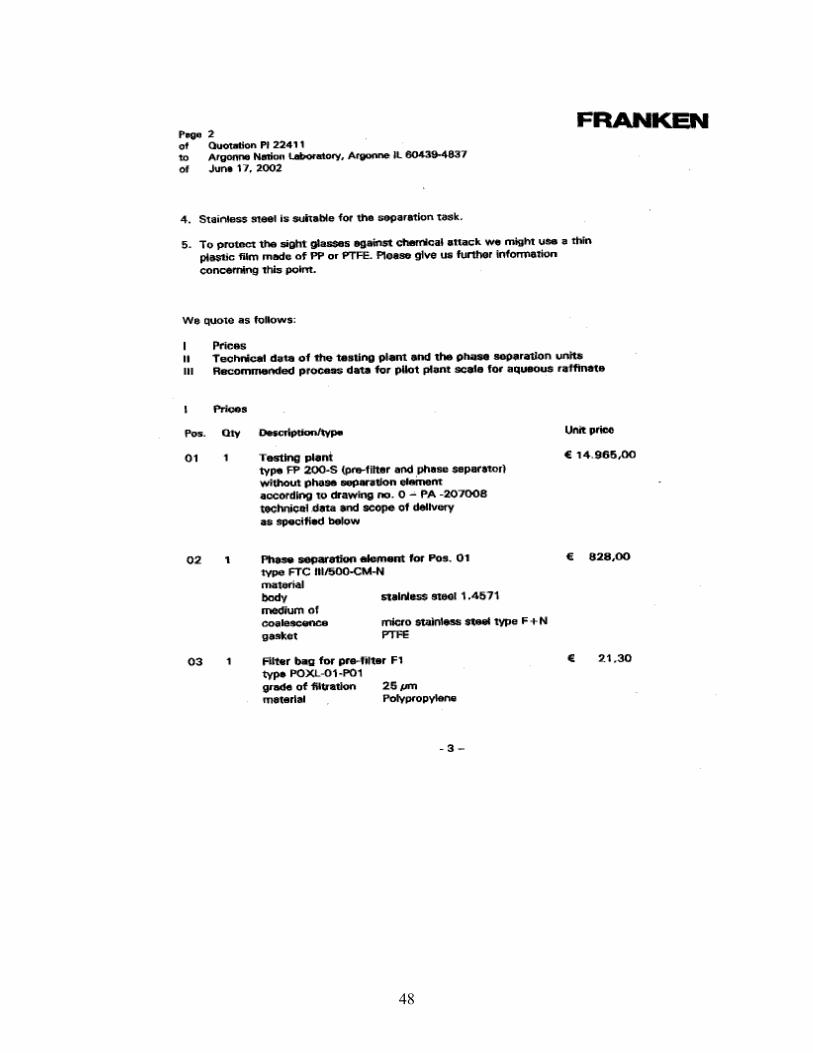
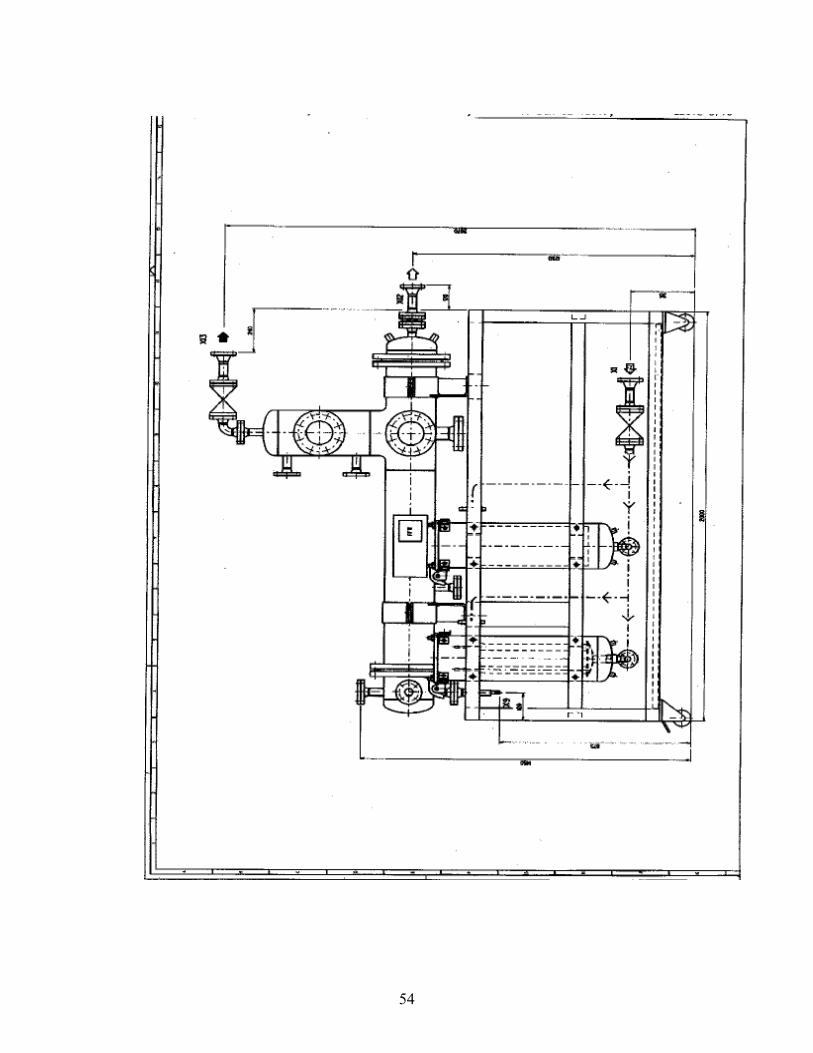
APPENDIX E. COALESCER VENDOR CONTACTS AND MEDIA SAMPLES Table E.1 contains contact information for several coalescer vendors. This appendix also
includes two full quotations from two coalescer vendors, Franken Filtertechnik KG and Koch Otto-York. The quotations are listed based on results with the lab-scale coalescer, the media tests, and cost.
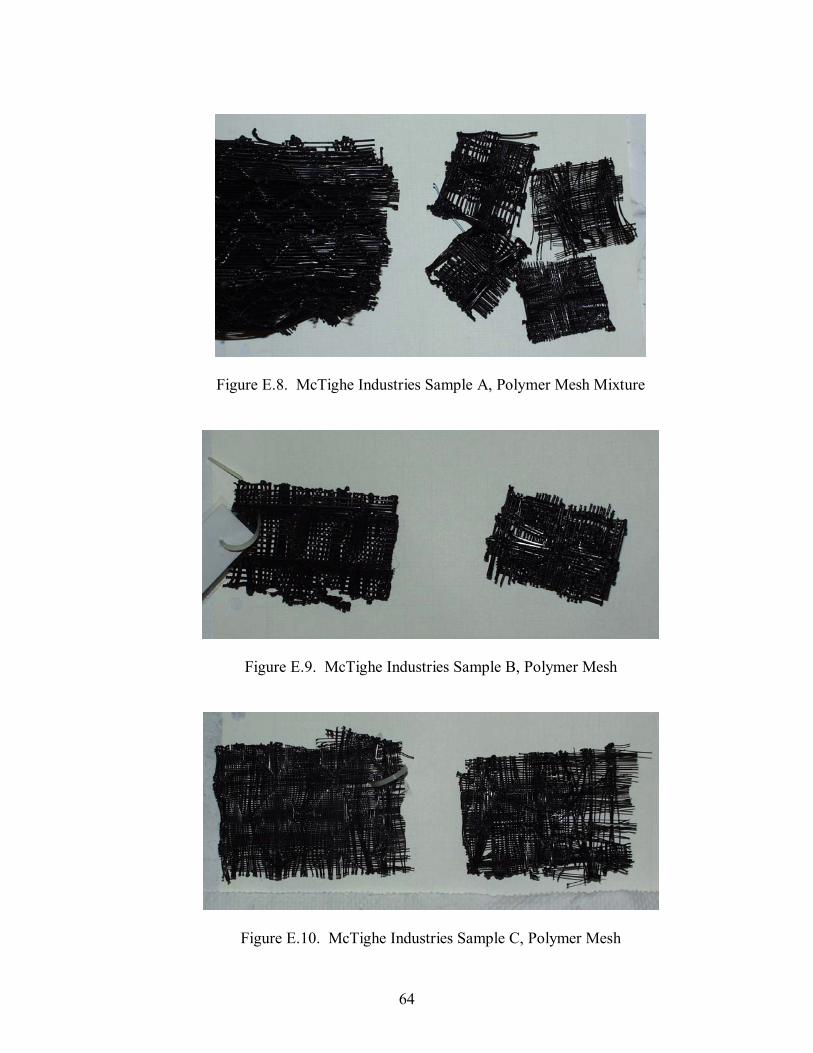
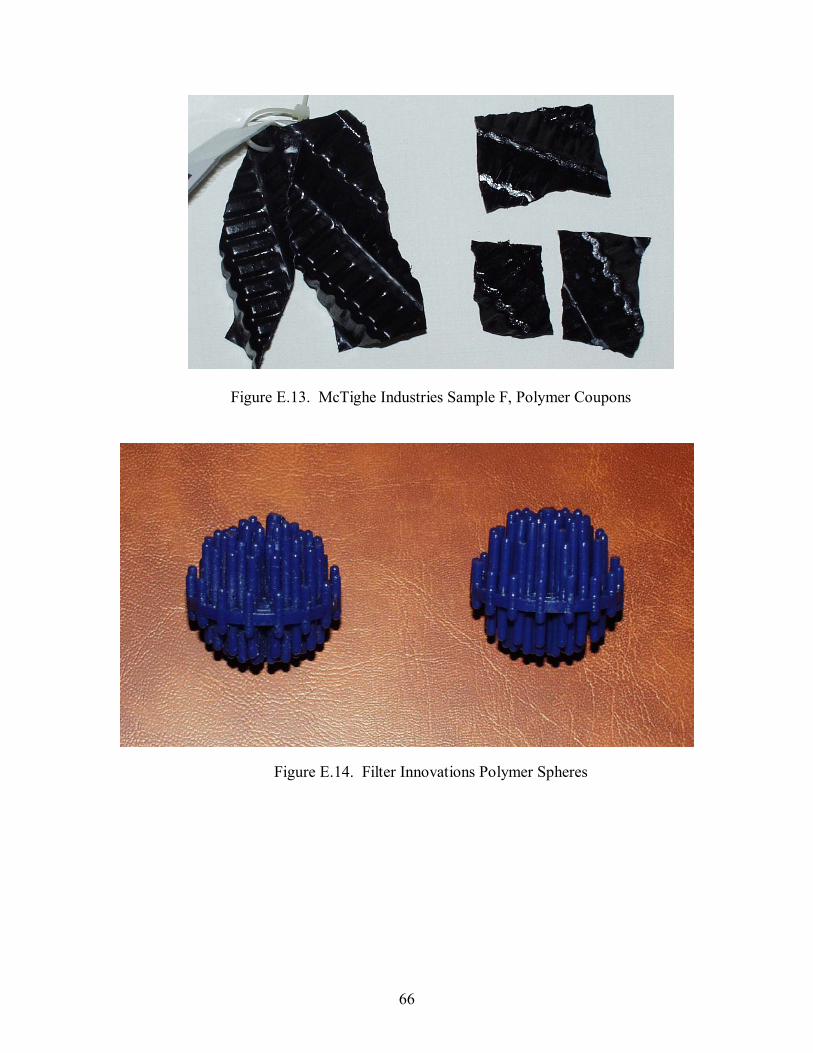
Figures E.1-E.13 are photographs of the vendor-supplied media and structural samples
that were tested for stability in the SRS waste simulant containing 1000 ppm CSSX solvent. In each photograph, the item on the left is the pristine sample, on the right is the sample taken from the test vessel after 36 days and dried at ambient conditions. In some samples, crystallites adhere to the surface. These appear to be salt residue from the simulant. Designations used by the vendor are used when they have been provided.
Table E.1. Vendor Contact Information
Vendor Contact Name Telephone Franken FilterTechnik KG Hurth, Germany
Michael Chatterjee +49.(0) 2233/97440.0
Pall Equipment Corp. Cortland, NY
John Sica
(516) 801-9852
Koch-Otto York, Inc. Wichita, KS
Hubert Zey
(316) 828-8472
Mercer International, Inc. Mendham, NJ
David Goding
(973) 543-9000
McTighe Industries, Inc. Sioux fall, SD
Patrick Moen
(888) 776-0581
Filter Innovations, Inc. North York, ONT, Canada
John Dragasevich
416-490-7848
Amistco Separations Products, Inc. Alvin, TX
Bernhard Kalis
(281) 331-5956

46

47
48

49

50

51

52

53
54

55

56

57

58

59

60

61
Figure E.1. Franken Filtertechnik GN Silica-Based Media. Sample was
compressed to remove entrained liquid.
Figure E.2. Franken Filtertechnik MF Stainless Steel Media. Sample was
compressed to remove entrained liquid.

62
Figure E.3. Franken Filtertechnik MN Stainless Steel Media. Sample was
compressed to remove entrained liquid.
Figure E.4. Koch Otto-York 316SS Mesh Sample, Stainless Steel Mesh

63
Figure E.5. Koch Otto-York 316SS/TEF Mesh Sample, Stainless
Steel and Fluoropolymer Mesh
Figure E.6. Mercer International Sample 1, Stainless Steel Mesh
Figure E.7. Mercer International Sample 2, Stainless Steel Coupon
64
Figure E.8. McTighe Industries Sample A, Polymer Mesh Mixture
Figure E.9. McTighe Industries Sample B, Polymer Mesh
Figure E.10. McTighe Industries Sample C, Polymer Mesh

65
Figure E.11. McTighe Industries Sample D, Polymer Mesh
Figure E.12. McTighe Industries Sample E, Polymer Coupons
66
Figure E.13. McTighe Industries Sample F, Polymer Coupons
Figure E.14. Filter Innovations Polymer Spheres

67
Distribution for ANL-02/34 Internal (Printed and Electronic Copies): S. B. Aase H. A. Arafat A. J. Bakel D. B. Chamberlain
M. L. Dietz A. V. Guelis J. E. Helt R. A. Leonard
K. L. Nash C. Pereira (5) M. C. Regalbuto G. F. Vandegrift
Internal (Printed Copy Only): V A. Davis M. J. Steindler S. K. Zussman (2) Internal (Electronic Copy Only): D. L. Bowers Y. I. Chang R. J. Finch
E. C. Gay M. R. Hale, TIS D. Lewis
C. J. Mertz J. I. Sackett J. Sedlet
External (Printed and Electronic Copies): J. F. Birdwell, Oak Ridge National Laboratory, Oak Ridge, TN P. V. Bonnesen, Oak Ridge National Laboratory, Oak Ridge, TN S. G. Campbell, Westinghouse Savannah River Company, Aiken, SC J. T. Carter, Westinghouse Savannah River Company, Aiken, SC S. Clifford, Westinghouse Savannah River Company, Aiken, SC L. H. Delmau, Oak Ridge National Laboratory, Oak Ridge, TN H. D. Harmon, Westinghouse Savannah River Company, Aiken, SC R. T. Jubin, Oak Ridge National Laboratory, Oak Ridge, TN J. D. Law, Idaho National Engineering and Environmental Laboratory, Idaho Falls, ID R. Leugemors, Pacific Northwest National Laboratory, Richland, WA G. J. Lumetta, Battelle, Pacific Northwest National Laboratory, Richland, WA M. Maxted-Miles, DOE-SR, Aiken, SC B. A. Moyer, Oak Ridge National Laboratory, Oak Ridge, TN M. Norato, Westinghouse Savannah River Company, Aiken, SC R. A. Pierce, Westinghouse Savannah River Company, Aiken, SC P. C. Suggs, DOE-SR, Aiken, SC M. C. Thompson, Westinghouse Savannah River Company, Aiken, SC T. A. Todd, Idaho National Engineering and Environmental Laboratory, Idaho Falls, ID D. D. Walker, Westinghouse Savannah River Company, Aiken, SC V. Wheeler, DOE-SR, Aiken, SC External (Printed Copy Only): C. Conner, BWX Technologies, Inc., Lynchburg, VA K. D. Gerdes, DOE-EM, Tanks Focus Area Headquarters, Germantown, MD T. P. Pietrok, USDOE, Richland Operations Office, Richland, WA

68
B. J. Williams, Pacific Northwest National Laboratory, Tanks Focus Area Technical Team, Richland, WA External (Electronic Copy Only): M. A. Buckley, ANL Library-E E. Sackett, ANL Library-W Chemical Technology Division Review Committee Members: H. U. Anderson, University of Missouri-Rolla, Rolla, MO R. A. Greenkorn, Purdue University, West Lafayette, IN C. L. Hussey, University of Mississippi, University, MS M. V. Koch, University of Washington, Seattle, WA V. P. Roan, Jr., University of Florida, Gainesville, FL J. R. Selman, Illinois Institute of Technology, Chicago, IL J. S. Tulenko, University of Florida, Gainesville, FL W. D. Clark, DOE-SR, Aiken, SC S. M. Dinehart, Los Alamos National Laboratory, Los Alamos, NM R. E. Edwards, Westinghouse Savannah River Company, Aiken, SC S. D. Fink, Westinghouse Savannah River Company, Aiken, SC
D. Hobbs, Westinghouse Savannah River Company, Aiken, SC L. N. Klatt, Oak Ridge National Laboratory, Oak Ridge, TN D. E. Kurath, Pacific Northwest National Laboratory, Richland, WA K. T. Lang, USDOE, Washington, DC J. W. McCullough, USDOE, Aiken, SC C. P. McGinnis, Oak Ridge National Laboratory, Oak Ridge, TN A. L. Olson, Idaho National Engineering and Environmental Laboratory, Idaho Falls, ID M. J. Palmer, Los Alamos National Laboratory, Los Alamos, NM L. M. Papouchado, Westinghouse Savannah River Company, Aiken, SC R. A. Peterson, Bechtel-Washington Process Technology, Richland, WA B. M. Rapko, Pacific Northwest National Laboratory, Richland, WA R. D. Rogers, University of Alabama, Department of Chemistry, Tuscaloosa, AL K. J. Rueter, Bechtel-Washington Process Technology, Richland, WA P. Rutland, Bechtel-Washington Process Technology, Richland, WA S. Schlahta, Pacific Northwest National Laboratory, Richland, WA J. L. Swanson, Richland, WA W. L. Tamosaitis, Westinghouse Savannah River Company, Aiken, SC L. L. Tavlarides, Syracuse University, Syracuse, NY D. W. Tedder, Georgia Institute of Technology, Atlanta, GA V. Van Brunt, University of South Carolina, Columbia, SC J. F. Walker, Oak Ridge National Laboratory, Oak Ridge, TN J. S. Watson, Oak Ridge National Laboratory, Oak Ridge, TN R. M. Wham, Oak Ridge National Laboratory, Oak Ridge, TN W. R. Wilmarth, Westinghouse Savannah River Company, Aiken, SC