recovery from economic collapse: insight from input-output ... · again, with lower oil exports in...
TRANSCRIPT

Recovery from Economic Collapse: Insight from Input-Output Models and the Special Case of a Collapsed Oil Producer John Roberts Economic and Statistics Analysis Unit
March 2004
ESAU Working Paper 6
Overseas Development Institute London
ii
The Economics and Statistics Analysis Unit has been established by DFID to undertake research, analysis and synthesis, mainly by seconded DFID economists, statisticians and other professionals, which advances understanding of the processes of poverty reduction and pro-poor growth in the contemporary global context, and of the design and implementation of policies that promote these objectives. ESAU’s mission is to make research conclusions available to DFID, and to diffuse them in the wider development community ISBN 0 85003 713 1 Economics and Statistics Analysis Unit Overseas Development Institute 111 Westminster Bridge Road London SE1 7JD © Overseas Development Institute 2004 All rights reserved. Readers may quote from or reproduce this paper, but as copyright holder, ODI requests due acknowledgement.
iii
Contents
Acknowledgements v
Acronyms v
Executive Summary vi
Prevailing view vi Experiences of eight low-income countries vi Case of Iraq vii Economic structures and policies for supporting recovery vii Modelling economic recovery viii Conclusions viii
Chapter 1: Introduction 1
Chapter 2: Recent research on economic collapse and recovery 3
Chapter 3: Features and characteristics of collapse and recovery in non-oil economies 6
3.1 Eight country cases 6
Chapter 4: Collapse of an oil economy: the special case of Iraq 11
4.1 Iraq as an oil economy 11 4.2 Economic collapse 11 4.3 Challenges of recovery 14
Chapter 5: Economic structures and policies for economic recovery 16
5.1 Characteristics of ‘general case’ collapsed economies 16 5.2 Characteristics of collapsed ‘urbanised’ economies 18 5.3 Macroeconomics of aid for economic recovery 18 5.4 Common policy prescriptions 21
Chapter 6: Modelling economic recovery 23
6.1 Structure of the model 23 6.2 Application of the model to collapsed economies 25
Chapter 7: Illustrative applications of the I-O framework to economic recovery 27
7.1 General case of low-income countries 27 7.2 The case of Iraq 30 7.3 A recovery scenario 33
Chapter 8: Conclusion 36
Bibliography 38
Statistical sources 38
Annex 1: Collapse and recovery – country profiles 39
Annex 2: Estimation of Iraq’s GDP in the 1980s and 1990s 44
Annex 3: Input-Output model: induced effects 45
Annex 4: Iraq – Projection of government revenue from the oil sector 2004-06 46
iv
Figures Figure 1: Collapsed economies’ real GDP 1975-2001 6 Figure 2: Collapsed economies’ per capita GDP 1975-2001 7 Figure 3: Iraq: GDP 1960-1990 (at 2000 prices) 12 Figure 4: Iraq: GDP 1990-2000 (2000 prices) 12 Figure.5: Iraq: per capita GDP 1970-2000 (at 2000 prices) 14 Figure 6: Recovery phase inflation 19 Figure 7: Recovery phase M2/GDP ratios 20
Tables Table 1: Annual growth rates of real GDP and expenditure during the years of recovery 8 Table 2: Collapsed economies' economic structures (Shares of GDP at factor cost) 16 Table 3: Illustrative input-output table of a ‘general case’ economy (percentages of GDP) 28 Table 4: Effects of final demand shocks equivalent to 10% of baseline values in Government
consumption and Exports 28 Table 5: Annual growth rates during Initial & mature phases of recovery 29 Table 6: Structure of the Iraqi economy (percentages of GDP at factor costs) 31 Table 7: Effects of 10% rise in Investment, government and export expenditure on value-added
by sector (percentages of baseline GDP) 32 Table 8: Effect of 10% rise in government or investment expenditure or exports on sector output
and GDP growth and on sector employment 33 Table 9: Medium-term income generation from government and investment expenditure ($bn
at 2002 prices) 34
v
Acknowledgements
The author is a Research Fellow in ODI, and director of ESAU. He gratefully acknowledges the valuable suggestions for improving the paper made by Andy Mackay (University of Bath and ODI), its peer reviewer, and for policy advice and technical assistance from Malcolm Smart (DFID) and Sonja Fagernäs (ODI).
Acronyms
CFA Communauté Financière Africaine GDP Gross Domestic Product IFS International Finance Statistics IMF International Monetary Fund I-O Input-Output IPC Iraq Petroleum Company M2 Broad Money Supply OPEC Organisation of Petroleum Exporting Countries WDI World Development Indicators
vi
Executive Summary
This paper presents evidence that recovery from economic collapse in poor countries has been on occasion rapid once the causes of collapse are removed. It argues that demand-side stimulus plays a strategic role in ensuring swift recovery, alongside the removal of supply-side constraints. In this perspective, the paper considers the case of post-war recovery in Iraq. Economic collapse is very often associated with the collapse of political and social institutions, and quite commonly also with the breakdown of civil peace and order, in other words with state collapse. This, however, is not always the case. Economies also collapse because harmful policies are pursued over long periods of time, and/or because rigorous economic sanctions are applied by trading partners and capital markets. Economic collapse is here defined as a prolonged decline in per capita income (or GDP).
Prevailing view
The prevailing belief is that recovery from economic collapse, following the removal of its primary cause(s) is likely to be delayed because of the inheritance of the dysfunctionalities, disorder and administrative decay dating from the previous period. This belief has been confirmed and reinforced by econometric evidence, using the Collier-Dollar model of aid effectiveness, that aid is ineffective in the first three years of recovery, but becomes strongly effective for a few years thereafter when absorptive capacity rises above normally expected levels. In this second phase the most serious administrative, security and physical bottlenecks have been removed, and underutilised productive capacity is put back in service. Rates of return on capital may be particularly high in this second phase in countries which have experienced major destruction of their physical capital stock and loss of human capital. The agenda of recommended actions to hasten economic recovery is supply-side focused, with an emphasis on the restoration of civil institutions, the reconstruction of infrastructure and the provision of supplies with which to revive production. However, there are stages in the process of recovery when demand-side stimulus may also be valuable to hasten the re-employment of available, but underemployed, resources. This paper argues that cases can readily be identified in which an early application of demand side stimulus can hasten economic recovery and that the constraints on revival arising from supply-side bottlenecks, though real, can be exaggerated.
Experiences of eight low-income countries
The post-collapse experiences of Cameroon, Cambodia, Ethiopia, Mozambique, Nicaragua, Rwanda, Uganda and Zambia are reviewed. These countries suffered prolonged periods of at least a decade of falling per capita income for reasons to do with conflict, economic policy, falling terms of trade, natural resource depletion and economic sanctions, and have a subsequent track record – dating from 1985 to 1995 – of post-collapse performance. In all but two cases the first three years of recovery saw positive per capita income growth. The pace of recovery is not obviously related to the prior extent of collapse or to its duration. Of much greater apparent significance in explaining the post-collapse rate of recovery is the growth of real final demand – government consumption expenditure, investment expenditure and exports. Nicaragua and Zambia were unable to increase their per capita incomes in the immediate post-collapse period because of their inherited macroeconomic and external financial situation, and the need to rein-in government expenditure. The recovery paths of seven countries have been
vii
inconsistent with the thesis that economic revival accelerates after the initial three years of the recovery phase.
Case of Iraq
Iraq’s GDP declined steeply in the first half of the 1980s because of way with Iran, revived briefly in the second half, and then plunged to new depths in the early 1990s with the imposition of rigorous UN sanctions following Iraq’s invasion of Kuwait. Per capita GDP (in 2000 US $) fell from a peak of nearly $3000 in 1980 to a trough of below $ 500 in 1991. It then revived to close to $1000 in 2000 and 2001, with the benefit of imports of food and other supplies to run infrastructural and other public services permitted under the UN Oil-for-Food programme. It has subsequently declined again, with lower oil exports in 2002, and sharply lower oil exports in 2003 in the aftermath of the war of March-April 2003. Iraq has a mainly urbanised society, and a domestic economy geared towards the production of goods and services needed to meet the effective demand created by oil revenue-financed expenditure – by government, by the wider public sector and by public sector employees. Sanctions, first prohibiting the export of oil altogether, then placing the financial proceeds in an offshore escrow account available only for the purchase of imports under strictly supervised conditions, deprived the domestic economy of its financial lifeblood. Though public service employment was largely maintained wages and salaries lost most of their purchasing power, and effective demand for producer and consumer goods evaporated, leading to under-and unemployment in state and private enterprises. The economy experienced not only supply bottlenecks – which were alleviated by the Oil-for-Food programme – but also, and crucially, severely deficient demand. With the abrogation of sanctions in June 2003 revenues from oil will flow once again through the public accounts, and effective demand for domestically supplied goods and services should revive.
Economic structures and policies for supporting recovery
Most of the eight low-income countries are predominantly rural, with large, informal, rural sectors, relatively small informal urban sectors, and a formal non-rural economy in which the government plays a large role, alongside relatively small industrial and mining activities. Only Zambia, which is relatively urbanised and where industry was economically twice as large as agriculture during the years of decline, does not conform to this archetype. Economic collapse in the mainly rural countries is neither sudden nor total because of the resilience of the informal sector. The formal sector usually suffers worst, reducing government revenues, and causing decay in government services. ‘Urbanised’, extractive industry-dependent, economies like Iraq and Zambia, with formerly higher per capita incomes and high levels of tax-financed public expenditure are less well hedged against adverse shocks to their formal sector earnings. Their informal agricultural sectors are relatively smaller and a higher proportion of the employed population is directly or indirectly dependent on public expenditure for its livelihood. Dutch Disease, and the domestic market focus of much of their non-mineral tradable goods output, inhibits the early and easy diversification of their export earnings. Conventional policy prescriptions for economic recovery and for recovery-oriented assistance emphasise, correctly, physical security, rehabilitating infrastructure, resettlement, reviving agriculture and formal sector production through input provision, restoring state institutions and restoring/preserving macroeconomic stability. However, this strategy is wrong to imply that supply-side actions are not only necessary but also sufficient to promote recovery because it omits complementary demand-side action.
viii
Modelling economic recovery
Simple linear models are constructed to represent, illustratively, the typical low-income economy in collapse and the case of Iraq. Such models, though once popular, are now correctly deemed inappropriate to represent the processes of economic growth. However, they can yield valuable insights into the processes of recovery if, and so long as, there are underutilised productive resources, and if supply elasticities are consequently high, and provided that major supply-side bottlenecks have been removed. In constructing linear models appropriate to countries starting recovery the question arises whether to use pre-collapse or post-collapse intermediate consumption, final demand and value added coefficients. Pre-collapse coefficients are likely to be the more relevant for charting the effects of rising demand on economic recovery because agents are striving, in the phase of recovery, to restore transactional patterns with which they are familiar from the past. In a first approximation, the characteristics of the pre-collapse economy can be assumed to typify the economy in recovery, certainly as the recovery reaches a mature phase. The construction of statistically sound input-output tables is data intensive and laborious, and most economies in collapse are unlikely to have such tables. However, for broad-bush policy analysis purposes, it is possible to construct simple ad hoc linear models from readily available sources, augmented if need be by coefficients borrowed from other countries. The illustrative numerical model constructed for the typical low-income country case has a relatively modest multiplier effect from rise in government expenditure, and a rather stronger effect from an equi-proportionate rise in export earnings. If increases in actual government consumption, investment and exports experienced in the six ‘general case’ countries are applied as shocks to the illustrative model, the model reacts with GDP increases which, in five of the six countries, approximate the actual rates of growth experienced by them in their initial phase of recovery. The model is less predictive of actual growth in the mature recovery phase. This result suggests that demand-side stimuli are particularly important in promoting growth in the initial phase. If this exercise is performed in the planning phase, before major interventions to remove supply-side bottlenecks, it can highlight transactional linkages which must function properly if recovery is to proceed, and thus help to identify priority projects. An illustrative model for Iraq is also constructed, loosely based on what is known about the structure of the economy before its precipitate collapse in the 1990s. A high arc elasticity of supply is assumed on account of the high level of current unemployment affecting inter alia skilled and educated personnel, and pressure within the international community to make rapid restoration of productive and infrastructural capacity. This model, by construction, shows that the indirect and induced effects of government expenditure, with its strong backward and forward linkages, are significantly stronger than those of exports and investment spending where linkages are weaker. A 10% rise in government consumption yields a 3.5% increase in GDP, and a possible increase in employment of 117 000. Using this tool a partial economic recovery scenario is constructed, making realistic assumptions about the revival of oil production, the value of oil exports, and assuming that Exchequer receipts of oil revenue are used to finance government expenditure. It holds out the prospect that per capita GDP (in 2002$) may rise by 50% from $830 in 2002 to $ 1225 in 2005 or 2006.
Conclusions
The main conclusions drawn are that:

ix
• economic recovery after collapse – or prolonged decline – is not necessarily delayed by as long as inferences from cross-country analyses suggest,
• demand-side stimulus plays an important supporting role in promoting recovery, alongside action to remote supply-side restraints, because of the presence of underutilised but productive resources; increased public expenditure can therefore be helpful in accelerating recovery – if it can be financed without violating macroeconomic constraints and applied without undermining structural reforms,
• simple linear models are usable as a tool for simulating the likely effects of demand-side stimuli, and of identifying the economic linkages that need to be strengthened, and the supply-side bottlenecks that need to be removed, if the recovery process is to proceed smoothly and rapidly.

1
Chapter 1: Introduction
International attention has inexorably been drawn to countries which have experienced economic collapse, i.e. a multi-year contraction of their per capita income as a consequence of conflict, mismanagement, state failure or international sanctions.1 Once the circumstances causing collapse have changed the international community feels a humanitarian impulse to intervene heavily to restore economic health and livelihoods, and to curtail negative spill-over effects on other countries. A common characteristic of collapsed economies is taken to be that the normal domestic machinery for receiving and administering international assistance is impaired, leaving aid donors without effective local interlocutors at times of acute humanitarian need. External assistance is therefore often channelled during decline, and in the early stages thereafter, through special projects and organisations outside the normal structure of government with a remit to provide immediate relief and resettlement support and to help with urgent programmes of rehabilitation. Thereafter, often with good reason, it concentrates on the supply side of the process of recovery – the repair of infrastructure, the restoration and re-equipment of public services and the supply of inputs for agriculture and industry. However, economic recovery – defined here as the return from collapse to the level of prosperity existing prior to collapse – involves the interplay of supply-side and demand-side stimuli, some of which emerge spontaneously, while others require policy assistance. Producers, especially those in the small-scale and informal sectors whose market is primarily domestic, can flourish as before only when effective demand for their products and services revives. The result is a diversity of economic recovery experiences. In the worst cases, progress may be slow and frustrating because of a proliferation of impediments, both on the supply-side and on the demand-side of local economies. Even if the obstacles to revived production are progressively removed demand for non-exportable goods and services may be slow to materialise. The early lack of effective demand by a still moribund formal sector may retard income growth in the informal sector. This effect may be aggravated by food aid and other donor-financed imports destined for the destitute but which are diverted to the local market and which drive down the prices of locally produced products. There are, however, other cases where economies recover strongly from their misfortunes, especially where final demand is able to expand rapidly in the initial stage of revival. The possible sources of rising effective demand for locally produced goods and services include increases in export sales, increases in public employment and recurrent and capital expenditure financed by revived domestic revenues or external aid and, as the recovery process advances, rising domestic consumers’ expenditure. This paper focuses on the demand side of the recovery process in low-income countries. Its purposes are two-fold: (a) to consider the evidence on patterns of post-collapse economic recovery, and the role therein of demand-side stimuli, (b) to explore the use of a simplified input-output framework to highlight the factors which may encourage the growth in demand during phases of recovery in some countries, but discourage it in others. It also suggests using an input-output framework, that recovery from collapse could be significantly faster in Iraq than it has been found to be in some low-income countries that have experienced economic decline due to conflict or mismanagement.
1 This definition of ‘collapse’ excludes the cases of short-lived economic contraction as a consequence of financial crises such as those experienced by Asian and Latin American countries in the 1990s. Also excluded from the purview of this paper are the middle income transition countries that experienced generally short-lived economic contraction in the 1990s.

2
The framework may be useful in assessing policy choices and consequences for income generation and distribution, even when no statistically constructed input-output table exists. For instance, it is likely to show that, if most food is produced locally and is a large element in the consumption bundle, policies to raise consumers’ expenditure may well make recovery pro-poor. In predominantly urban societies with strong backward linkages from consumers’ expenditure to commercial, personal and professional services and underemployed capacity, rising public expenditure is likely to be employment creating. However, macroeconomic constraints on expenditure increases will probably, in the absence of real capacity constraints, retard economic recovery. The paper looks at these issues, first in the case of a typical low-income economy, then in the special case of Iraq. The approach adopted in the following chapters is illustrative rather than empirical, though the worked examples are as realistic as possible. The first part of the paper, chapter 2, reviews some of the conclusions of recent literature on economic recovery. The second part, chapters 3-5, presents outline characteristics of typical collapsed low-income economies, distinguishing between those which remain predominantly rural, and those which are extractive industry-based and largely urban, including Iraq – a collapsed oil economy. In the third part, chapter 6 discusses the application of the input-output framework to such economies, and chapter 7 presents illustrative applications.

3
Chapter 2: Recent research on economic collapse and recovery
This paper is concerned not only with recovery from conflict, but also with cases of recovery from economic mismanagement and other misfortunes that leave institutions reasonably intact. However, economic decline and collapse are often conflict-related. Conflict in poor developing countries has become the focus of attention in the international development community, and recent literature on economic collapse has concentrated largely on the causes, characteristics and consequences of conflict, on its prevention, and on the profile of post-conflict recovery. In its statement of institutional policy on the matter the World Bank divides post-conflict reconstruction activity into two phases (World Bank, 1998). In the first phase it envisages a heavy emphasis on preparatory activity, but includes also the likely need to undertake urgent tasks of demobilisation, resettlement, ad hoc employment creation projects and immediately needed repairs to public infrastructure and public service facilities. The second phase of reconstruction should, in the Bank’s recommendation, be devoted to implementing the large-scale physical, economic, institutional and social projects that have been prepared in the earlier phase. With specific reference to Africa, Mikhailof et al. advocate consideration of a broad agenda of post-conflict reconstruction activities, including the restoration of transport links and power supplies, support for the revival of farm production and produce marketing, and an array of structural and institutional reforms – to be undertaken step-by-step (Mikhailof et al., 2002). Collier et al. have surveyed the corpus of research findings on the characteristics of economies and societies in conflict, and having recently emerged from conflict (Collier et al., 2003) Their principal observation of relevance to this paper is that the effects of conflicts that bring about economic decline tend to be highly persistent, and can last for up to a decade after the definitive return to peace. During this period, especially at the beginning, military expenditure by governments is abnormally high – some 1.7% of GDP higher than the norm for peaceful countries of similar per capita income. With weakened revenue collection capabilities, losses of trained and experienced manpower and weakened administrative capacity, post-conflict social service provision is persistently deficient, both in coverage and in quality, with adverse consequences for health and education, and thus for human capital development. The social consequences of reduced public expenditure can be greatly compounded by the direct legacy of disease and trauma left by the years of conflict, and by the slow return of refugees and internally displaced persons to their homes. Collier et al. also observe that post-conflict countries’ economic recovery is also hampered by the deterioration and destruction of transport, communications, and public utility infrastructure that occurred in the time of conflict, and by the persistence in inhabited and cultivated areas of unexploded ordnance and anti-personnel mines. Producers, small-scale and large-scale, have lost assets through looting and theft, and are unable immediately to resume production. Investment in post-conflict environments is often slow to recover because of physical insecurity and the threat of renewed outbreaks of fighting, and because the fiscal-legal-judicial institutional frameworks which define the environment in which the private sector operates remain dysfunctional for a prolonged period of time. The latter may exert a particular and persistently adverse effect on formal sector enterprises. The high levels of capital flight and of emigration of professional and skilled personnel persist after the advent of peace. Addison et al. in a series of papers in recovery from conflict in Africa,2 emphasise the importance of improving the quality of state institutions, stimulating private investment and instituting reforms that foster broad-based growth if recovery is to be sustained, and if the tensions that caused of conflict are to be eased (Addison, ed. 2003). The physical reconstruction of infrastructure is but 2 With a focus on Angola, Mozambique, Ethiopia, Eritrea and Guinea-Bissau
4
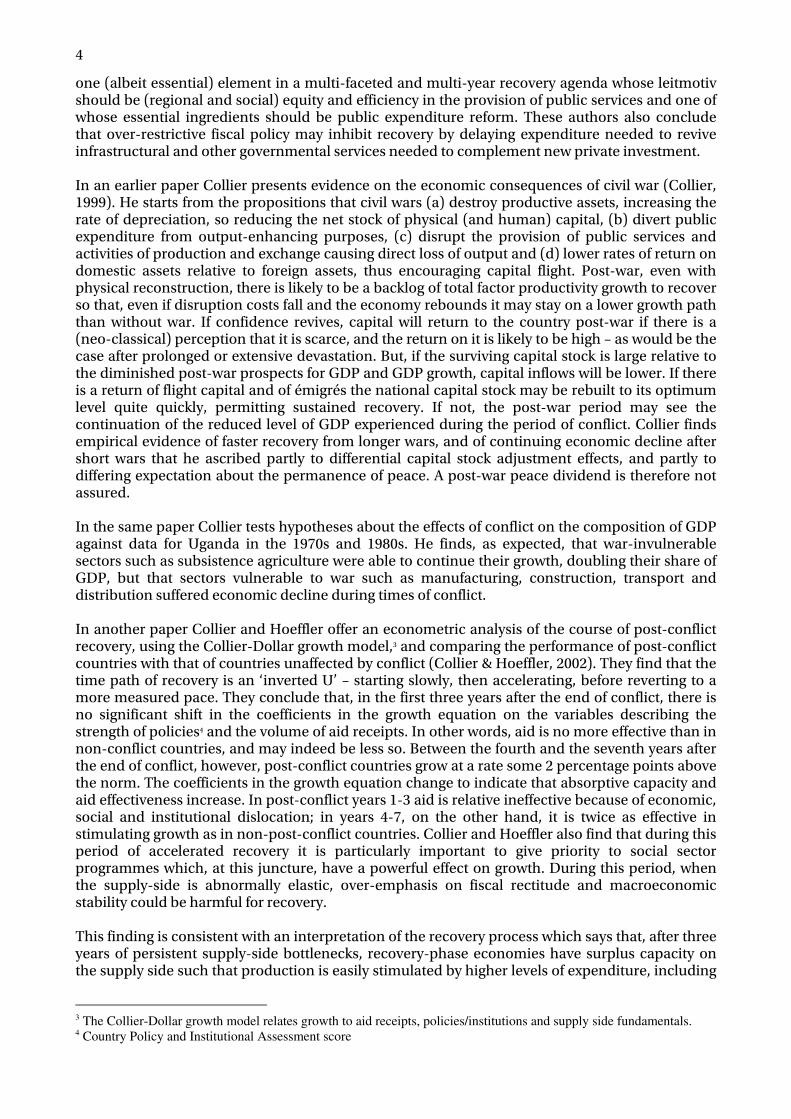
one (albeit essential) element in a multi-faceted and multi-year recovery agenda whose leitmotiv should be (regional and social) equity and efficiency in the provision of public services and one of whose essential ingredients should be public expenditure reform. These authors also conclude that over-restrictive fiscal policy may inhibit recovery by delaying expenditure needed to revive infrastructural and other governmental services needed to complement new private investment. In an earlier paper Collier presents evidence on the economic consequences of civil war (Collier, 1999). He starts from the propositions that civil wars (a) destroy productive assets, increasing the rate of depreciation, so reducing the net stock of physical (and human) capital, (b) divert public expenditure from output-enhancing purposes, (c) disrupt the provision of public services and activities of production and exchange causing direct loss of output and (d) lower rates of return on domestic assets relative to foreign assets, thus encouraging capital flight. Post-war, even with physical reconstruction, there is likely to be a backlog of total factor productivity growth to recover so that, even if disruption costs fall and the economy rebounds it may stay on a lower growth path than without war. If confidence revives, capital will return to the country post-war if there is a (neo-classical) perception that it is scarce, and the return on it is likely to be high – as would be the case after prolonged or extensive devastation. But, if the surviving capital stock is large relative to the diminished post-war prospects for GDP and GDP growth, capital inflows will be lower. If there is a return of flight capital and of émigrés the national capital stock may be rebuilt to its optimum level quite quickly, permitting sustained recovery. If not, the post-war period may see the continuation of the reduced level of GDP experienced during the period of conflict. Collier finds empirical evidence of faster recovery from longer wars, and of continuing economic decline after short wars that he ascribed partly to differential capital stock adjustment effects, and partly to differing expectation about the permanence of peace. A post-war peace dividend is therefore not assured. In the same paper Collier tests hypotheses about the effects of conflict on the composition of GDP against data for Uganda in the 1970s and 1980s. He finds, as expected, that war-invulnerable sectors such as subsistence agriculture were able to continue their growth, doubling their share of GDP, but that sectors vulnerable to war such as manufacturing, construction, transport and distribution suffered economic decline during times of conflict. In another paper Collier and Hoeffler offer an econometric analysis of the course of post-conflict recovery, using the Collier-Dollar growth model,3 and comparing the performance of post-conflict countries with that of countries unaffected by conflict (Collier & Hoeffler, 2002). They find that the time path of recovery is an ‘inverted U’ – starting slowly, then accelerating, before reverting to a more measured pace. They conclude that, in the first three years after the end of conflict, there is no significant shift in the coefficients in the growth equation on the variables describing the strength of policies4 and the volume of aid receipts. In other words, aid is no more effective than in non-conflict countries, and may indeed be less so. Between the fourth and the seventh years after the end of conflict, however, post-conflict countries grow at a rate some 2 percentage points above the norm. The coefficients in the growth equation change to indicate that absorptive capacity and aid effectiveness increase. In post-conflict years 1-3 aid is relative ineffective because of economic, social and institutional dislocation; in years 4-7, on the other hand, it is twice as effective in stimulating growth as in non-post-conflict countries. Collier and Hoeffler also find that during this period of accelerated recovery it is particularly important to give priority to social sector programmes which, at this juncture, have a powerful effect on growth. During this period, when the supply-side is abnormally elastic, over-emphasis on fiscal rectitude and macroeconomic stability could be harmful for recovery. This finding is consistent with an interpretation of the recovery process which says that, after three years of persistent supply-side bottlenecks, recovery-phase economies have surplus capacity on the supply side such that production is easily stimulated by higher levels of expenditure, including
3 The Collier-Dollar growth model relates growth to aid receipts, policies/institutions and supply side fundamentals. 4 Country Policy and Institutional Assessment score
5
expenditure on wages and salaries in labour-intensive social services. It is this expenditure, rather than the human capital-building effects of social sector programmes, that is the cause of dramatic improvements in growth performance during the middle years of the decade of recovery. As regards aid inflows, though they may not appear econometrically to be growth-enhancing in the earliest stages of recovery, they may nevertheless be fulfilling a vital role in financing the repair of institutional and physical damage at a time when domestic output is low, and so laying the bases for later rapid recovery. Recent assessments of the agenda and processes of recovery from economic collapse have thus concentrated on the aftermath of conflict, and have emphasised the public policy and supply-side tasks that need to be tackled to overcome the multiple sources of post-conflict economic and social dislocation and institutional dysfunction, to restore public services, and to re-create a climate of investor confidence. They have paid little explicit attention to the role of demand in stimulating production at different stages of the recovery process. However, the evidence of Collier et al. on the acceleration of growth during the middle portion of the post-conflict decade suggests the emergence of surplus capacity, and thus of an opportunity to stimulate growth by increasing final demand. The questions on which this paper now seeks to throw light are: • what the characteristics are of countries where recovery comes sooner and faster and is more
sustained, • whether the prescriptions for intervention in support of recovery outlined above provide a not
only necessary but also sufficient general framework and approach, and • what differences there are between the recovery process in predominantly rural countries with
smallholder agriculture and that in urbanised countries heavily dependent on extractive industries.
Chapters 3, 4 and 5 now look at the collapse and recovery records of eight poor countries and Iraq, and at some relevant characteristics, both common and distinctive.

6
Chapter 3: Features and characteristics of collapse and recovery in non-oil economies
The research conclusions reviewed above are now qualified in the light of the varying experiences of eight countries for which there is a track record of seven or more years of recovery from collapse. The main structural characteristics of these countries’ economies are then used as the basis for constructing a descriptive ‘model’ of economic recovery from collapse in non-oil low-income countries. In these countries collapse is usually associated with civil war or other forms of state- or policy- failure with broadly comparable consequences, though with many specific differences. Their experiences form a basis for reflecting on recovery policies.
3.1 Eight country cases
All of the eight countries – Cameroon, Cambodia, Ethiopia, Mozambique, Nicaragua, Rwanda, Uganda and Zambia – have to date made at least partial recoveries in per capita GDP, though this has been minimal in the case of Zambia, and weak in Ethiopia and Nicaragua.5 The progress of their real GDPs and real per capita GDPs since 1975 is charted in Figures. 1 and 2. Two of the countries in this sample – Cameroon and Zambia – experienced collapse for reasons related not to conflict but to a dramatic decline in their export earnings and government revenues. The six others were all conflict-affected, though other factors such as economic mismanagement contributed additionally to the collapse in the incomes of some of them.
Figure 1: Collapsed economies’ real GDP 1975-2001
0
20
40
60
80
100
120
140
160
180
1975
1976
1977
1978
1979
1980
1981
1982
1983
1984
1985
1986
1987
1988
1989
1990
1991
1992
1993
1994
1995
1996
1997
1998
1999
2000
2001
Inde
x N
os.
(19
95=
100
)
Ethiopia Mozambique Cameroun Nicaragua Rwanda Uganda Zambia
Source : WDI
5 The circumstances of the economic decline and recovery of these countries are summarised in Annex 1.
7
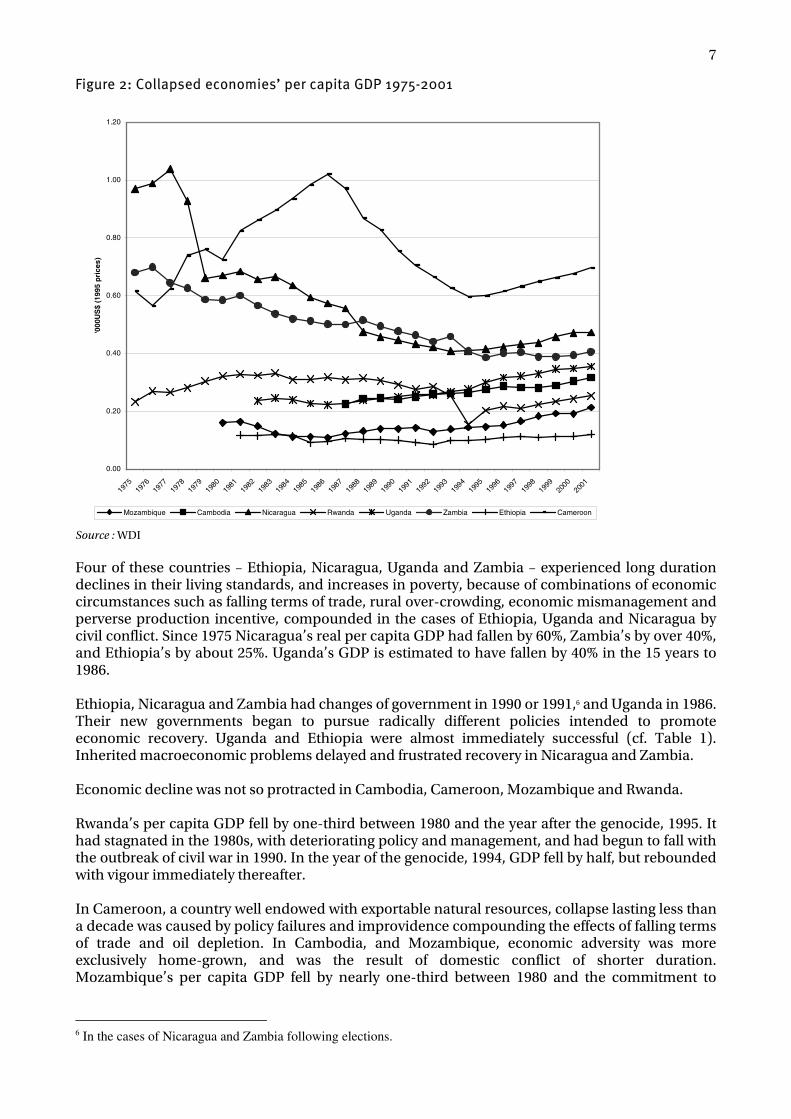
Figure 2: Collapsed economies’ per capita GDP 1975-2001
0.00
0.20
0.40
0.60
0.80
1.00
1.20
1975
1976
1977
1978
1979
1980
1981
1982
1983
1984
1985
1986
1987
1988
1989
1990
1991
1992
1993
1994
1995
1996
1997
1998
1999
2000
2001
'000
US
$ (1
995
pri
ces)
Mozambique Cambodia Nicaragua Rwanda Uganda Zambia Ethiopia Cameroon
Source : WDI Four of these countries – Ethiopia, Nicaragua, Uganda and Zambia – experienced long duration declines in their living standards, and increases in poverty, because of combinations of economic circumstances such as falling terms of trade, rural over-crowding, economic mismanagement and perverse production incentive, compounded in the cases of Ethiopia, Uganda and Nicaragua by civil conflict. Since 1975 Nicaragua’s real per capita GDP had fallen by 60%, Zambia’s by over 40%, and Ethiopia’s by about 25%. Uganda’s GDP is estimated to have fallen by 40% in the 15 years to 1986. Ethiopia, Nicaragua and Zambia had changes of government in 1990 or 1991,6 and Uganda in 1986. Their new governments began to pursue radically different policies intended to promote economic recovery. Uganda and Ethiopia were almost immediately successful (cf. Table 1). Inherited macroeconomic problems delayed and frustrated recovery in Nicaragua and Zambia. Economic decline was not so protracted in Cambodia, Cameroon, Mozambique and Rwanda. Rwanda’s per capita GDP fell by one-third between 1980 and the year after the genocide, 1995. It had stagnated in the 1980s, with deteriorating policy and management, and had begun to fall with the outbreak of civil war in 1990. In the year of the genocide, 1994, GDP fell by half, but rebounded with vigour immediately thereafter. In Cameroon, a country well endowed with exportable natural resources, collapse lasting less than a decade was caused by policy failures and improvidence compounding the effects of falling terms of trade and oil depletion. In Cambodia, and Mozambique, economic adversity was more exclusively home-grown, and was the result of domestic conflict of shorter duration. Mozambique’s per capita GDP fell by nearly one-third between 1980 and the commitment to
6 In the cases of Nicaragua and Zambia following elections.
8
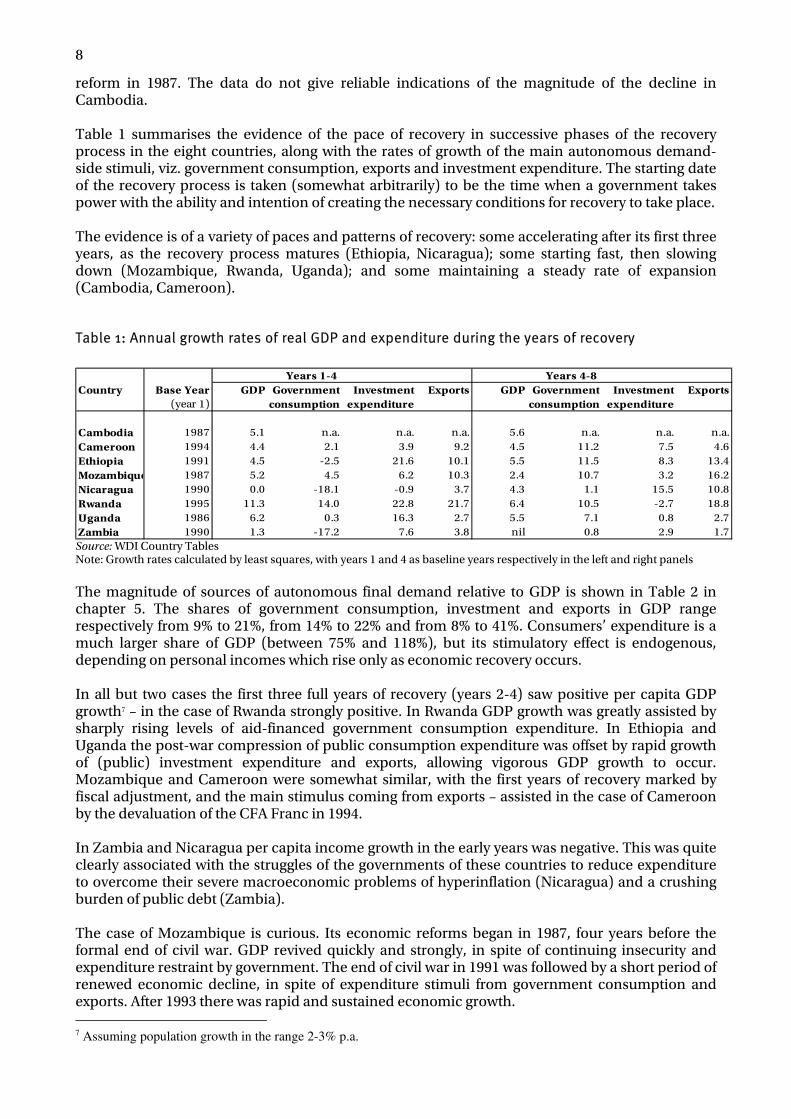
reform in 1987. The data do not give reliable indications of the magnitude of the decline in Cambodia. Table 1 summarises the evidence of the pace of recovery in successive phases of the recovery process in the eight countries, along with the rates of growth of the main autonomous demand-side stimuli, viz. government consumption, exports and investment expenditure. The starting date of the recovery process is taken (somewhat arbitrarily) to be the time when a government takes power with the ability and intention of creating the necessary conditions for recovery to take place. The evidence is of a variety of paces and patterns of recovery: some accelerating after its first three years, as the recovery process matures (Ethiopia, Nicaragua); some starting fast, then slowing down (Mozambique, Rwanda, Uganda); and some maintaining a steady rate of expansion (Cambodia, Cameroon).
Table 1: Annual growth rates of real GDP and expenditure during the years of recovery
Years 1-4 Years 4-8Country Base Year GDP Government Investment Exports GDP Government Investment Exports
(year 1) consumption expenditure consumption expenditure
Cambodia 1987 5.1 n.a. n.a. n.a. 5.6 n.a. n.a. n.a.Cameroon 1994 4.4 2.1 3.9 9.2 4.5 11.2 7.5 4.6Ethiopia 1991 4.5 -2.5 21.6 10.1 5.5 11.5 8.3 13.4Mozambique 1987 5.2 4.5 6.2 10.3 2.4 10.7 3.2 16.2Nicaragua 1990 0.0 -18.1 -0.9 3.7 4.3 1.1 15.5 10.8Rwanda 1995 11.3 14.0 22.8 21.7 6.4 10.5 -2.7 18.8Uganda 1986 6.2 0.3 16.3 2.7 5.5 7.1 0.8 2.7Zambia 1990 1.3 -17.2 7.6 3.8 nil 0.8 2.9 1.7
Source: WDI Country Tables Note: Growth rates calculated by least squares, with years 1 and 4 as baseline years respectively in the left and right panels The magnitude of sources of autonomous final demand relative to GDP is shown in Table 2 in chapter 5. The shares of government consumption, investment and exports in GDP range respectively from 9% to 21%, from 14% to 22% and from 8% to 41%. Consumers’ expenditure is a much larger share of GDP (between 75% and 118%), but its stimulatory effect is endogenous, depending on personal incomes which rise only as economic recovery occurs. In all but two cases the first three full years of recovery (years 2-4) saw positive per capita GDP growth7 – in the case of Rwanda strongly positive. In Rwanda GDP growth was greatly assisted by sharply rising levels of aid-financed government consumption expenditure. In Ethiopia and Uganda the post-war compression of public consumption expenditure was offset by rapid growth of (public) investment expenditure and exports, allowing vigorous GDP growth to occur. Mozambique and Cameroon were somewhat similar, with the first years of recovery marked by fiscal adjustment, and the main stimulus coming from exports – assisted in the case of Cameroon by the devaluation of the CFA Franc in 1994. In Zambia and Nicaragua per capita income growth in the early years was negative. This was quite clearly associated with the struggles of the governments of these countries to reduce expenditure to overcome their severe macroeconomic problems of hyperinflation (Nicaragua) and a crushing burden of public debt (Zambia). The case of Mozambique is curious. Its economic reforms began in 1987, four years before the formal end of civil war. GDP revived quickly and strongly, in spite of continuing insecurity and expenditure restraint by government. The end of civil war in 1991 was followed by a short period of renewed economic decline, in spite of expenditure stimuli from government consumption and exports. After 1993 there was rapid and sustained economic growth. 7 Assuming population growth in the range 2-3% p.a.

9
In the later years of recovery (years 5-8) government consumption was expanding fast in five of the countries for which there are data. Nicaragua and Zambia are the exceptions. This was accompanied in Ethiopia, Mozambique and Rwanda by faster export growth. However, the relationship between final demand and GDP growth is less obvious in this period because three of the countries experienced somewhat slower GDP growth. In Cameroon, Ethiopia, Rwanda and Uganda government consumption (and, for Cameroon and Ethiopia, investment) was growing fast without serious inflationary consequences, indicating prima facie a stimulatory effect. However, only in Uganda is it clear that government consumption was the main autonomous motive force behind recovery, as investment expenditure marked time and exports continued to grow only slowly. In Nicaragua, in years 5-8, there was effective stimulus from investment expenditure and exports – both of which were large relative to GDP (cf. Table 2). In Zambia, however, insufficient external financing, combined with continued low export growth, precluded demand-side stimulus. In the absence of productivity growth on the supply-side the economy continued to stagnate in the mid 1990s, only gathering steam after 1996. Elsewhere, the main sources of economic growth seem to have been productivity and income increases internal to the domestic private sector. In summary, six of the collapsed economies in this sample of eight were able to achieve real per capita GDP growth from the start of their recovery periods, and five were able to sustain average real per capita GDP growth over eight years. In countries whose economies failed to revive there was static or falling real final demand – specifically of government consumption, for which the justification was the pressing need for macroeconomic adjustment. The experiences the majority of these countries are not consistent with the picture derived from econometric evidence reviewed in Chapter 2 that countries affected by short-lived conflicts are likely to suffer several years of low growth, post-conflict, before their economies revive. The reasons for this are various, and some of them are considered in more depth in Chapter 5. The rural economy, still predominant in all of the eight countries apart from Zambia, has been resilient in phase of economic collapse, and was well placed to rebound with the revival of security, mobility and effective market demand. Conflict was sometimes localised, and not seriously destructive of infrastructure. And, as will be argued later, successful immediate recovery was accompanied by demand-side stimulus from export growth and/or from effective and timely external assistance – for the most urgent tasks of physical rehabilitation, and to provide finance for government consumption and investment expenditure. Neither do these countries’ experiences lend particular credence to the conclusion that recovery from prolonged, asset-destroying, conflict is likely to be especially rapid. Rwanda’ recovery from the short-lived trauma of genocide was stellar, while Ethiopia’s recovery from thirty years of warfare has been more pedestrian. In Uganda, episodes of civil war and invasion by Tanzania left the country with deteriorated main roads and power supplies, but these proved to be non-binding constraints on recovery once security was restored. Six of the eight countries’ recovery paths are inconsistent with the ‘inverted U’ hypothesis that growth starts slowly, and then accelerates around year 4. Only Ethiopia and Nicaragua conformed to this pattern, and in these countries the principal reasons are macroeconomic and on the demand-side, rather than structural and on the supply-side. Elsewhere the rate of growth was either little changed or slower in the second phase of recovery. The evidence presented here also suggests no necessary difference between the recovery processes of conflict-affected and non conflict-affected countries. Though Zambia’s recovery has been slight, devaluation and reforms in Cameroon set that country on an unwavering path of moderate per capita income growth at a rate comparable to that of post-conflict countries.

10
The experience of all eight countries emphasises the importance of credible structural reforms that remove institutional barriers and price disincentives to production and export growth, in combination with the stimulus of government consumption expenditure, in promoting and sustaining the momentum of recovery. The most significant retardant factor has been the necessity for vigorous fiscal adjustment at the beginning of the recovery phase.
11
Chapter 4: Collapse of an oil economy: the special case of Iraq
4.1 Iraq as an oil economy8
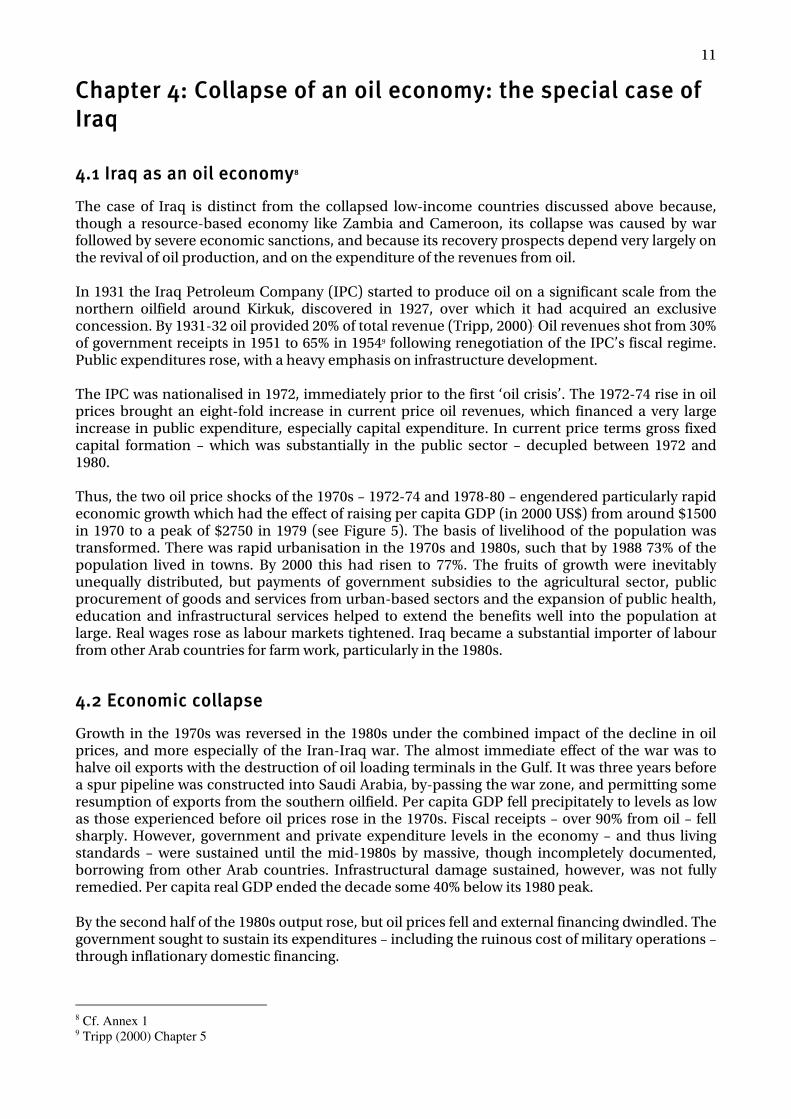
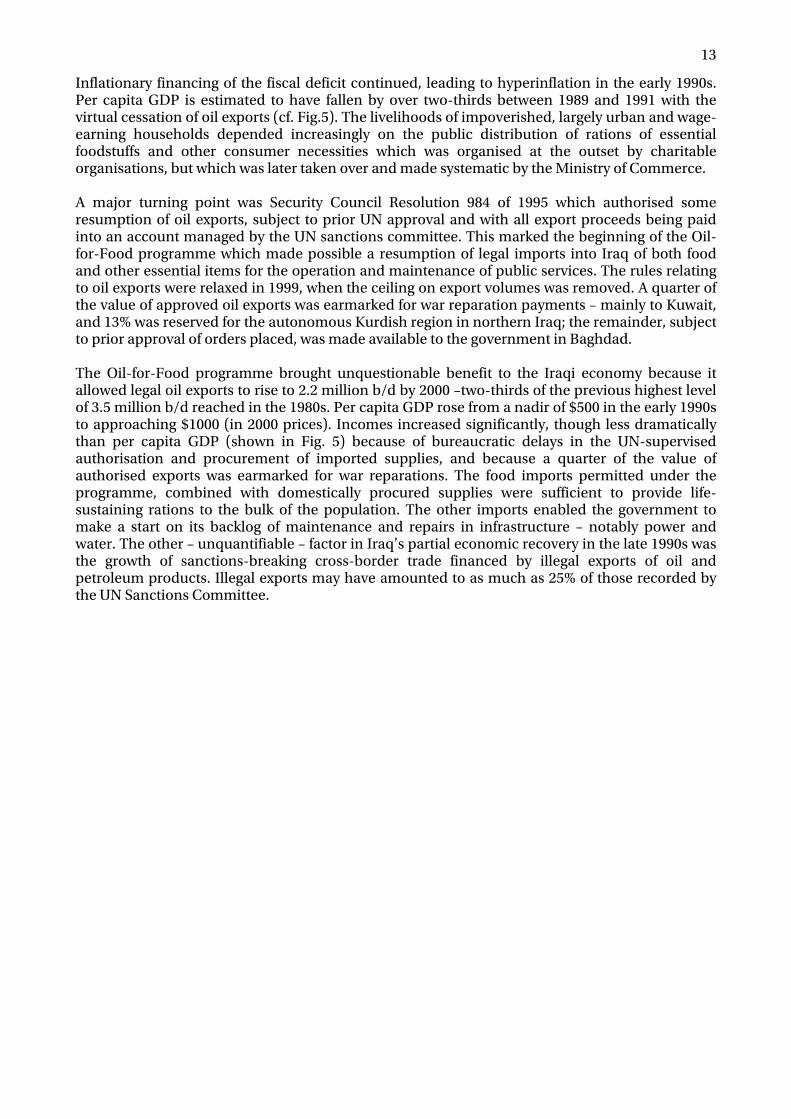
The case of Iraq is distinct from the collapsed low-income countries discussed above because, though a resource-based economy like Zambia and Cameroon, its collapse was caused by war followed by severe economic sanctions, and because its recovery prospects depend very largely on the revival of oil production, and on the expenditure of the revenues from oil. In 1931 the Iraq Petroleum Company (IPC) started to produce oil on a significant scale from the northern oilfield around Kirkuk, discovered in 1927, over which it had acquired an exclusive concession. By 1931-32 oil provided 20% of total revenue (Tripp, 2000). Oil revenues shot from 30% of government receipts in 1951 to 65% in 19549 following renegotiation of the IPC’s fiscal regime. Public expenditures rose, with a heavy emphasis on infrastructure development. The IPC was nationalised in 1972, immediately prior to the first ‘oil crisis’. The 1972-74 rise in oil prices brought an eight-fold increase in current price oil revenues, which financed a very large increase in public expenditure, especially capital expenditure. In current price terms gross fixed capital formation – which was substantially in the public sector – decupled between 1972 and 1980. Thus, the two oil price shocks of the 1970s – 1972-74 and 1978-80 – engendered particularly rapid economic growth which had the effect of raising per capita GDP (in 2000 US$) from around $1500 in 1970 to a peak of $2750 in 1979 (see Figure 5). The basis of livelihood of the population was transformed. There was rapid urbanisation in the 1970s and 1980s, such that by 1988 73% of the population lived in towns. By 2000 this had risen to 77%. The fruits of growth were inevitably unequally distributed, but payments of government subsidies to the agricultural sector, public procurement of goods and services from urban-based sectors and the expansion of public health, education and infrastructural services helped to extend the benefits well into the population at large. Real wages rose as labour markets tightened. Iraq became a substantial importer of labour from other Arab countries for farm work, particularly in the 1980s.
4.2 Economic collapse
Growth in the 1970s was reversed in the 1980s under the combined impact of the decline in oil prices, and more especially of the Iran-Iraq war. The almost immediate effect of the war was to halve oil exports with the destruction of oil loading terminals in the Gulf. It was three years before a spur pipeline was constructed into Saudi Arabia, by-passing the war zone, and permitting some resumption of exports from the southern oilfield. Per capita GDP fell precipitately to levels as low as those experienced before oil prices rose in the 1970s. Fiscal receipts – over 90% from oil – fell sharply. However, government and private expenditure levels in the economy – and thus living standards – were sustained until the mid-1980s by massive, though incompletely documented, borrowing from other Arab countries. Infrastructural damage sustained, however, was not fully remedied. Per capita real GDP ended the decade some 40% below its 1980 peak. By the second half of the 1980s output rose, but oil prices fell and external financing dwindled. The government sought to sustain its expenditures – including the ruinous cost of military operations – through inflationary domestic financing.
8 Cf. Annex 1 9 Tripp (2000) Chapter 5
12
Figure 3: Iraq: GDP 1960-1990 (at 2000 prices)
0
5000
10000
15000
20000
25000
30000
35000
40000
1960
1961
1962
1963
1964
1965
1966
1967
1968
1969
1970
1971
1972
1973
1974
1975
1976
1977
1978
1979
1980
1981
1982
1983
1984
1985
1986
1987
1988
1989
1990
US
$ m
illio
ns
Sources: World Development Indicators, IFS, OPEC and author’s estimates
Figure 4: Iraq: GDP 1990-2000 (2000 prices)
0
5000
10000
15000
20000
25000
30000
1990 1991 1992 1993 1994 1995 1996 1997 1998 1999 2000
US
$ m
illio
ns
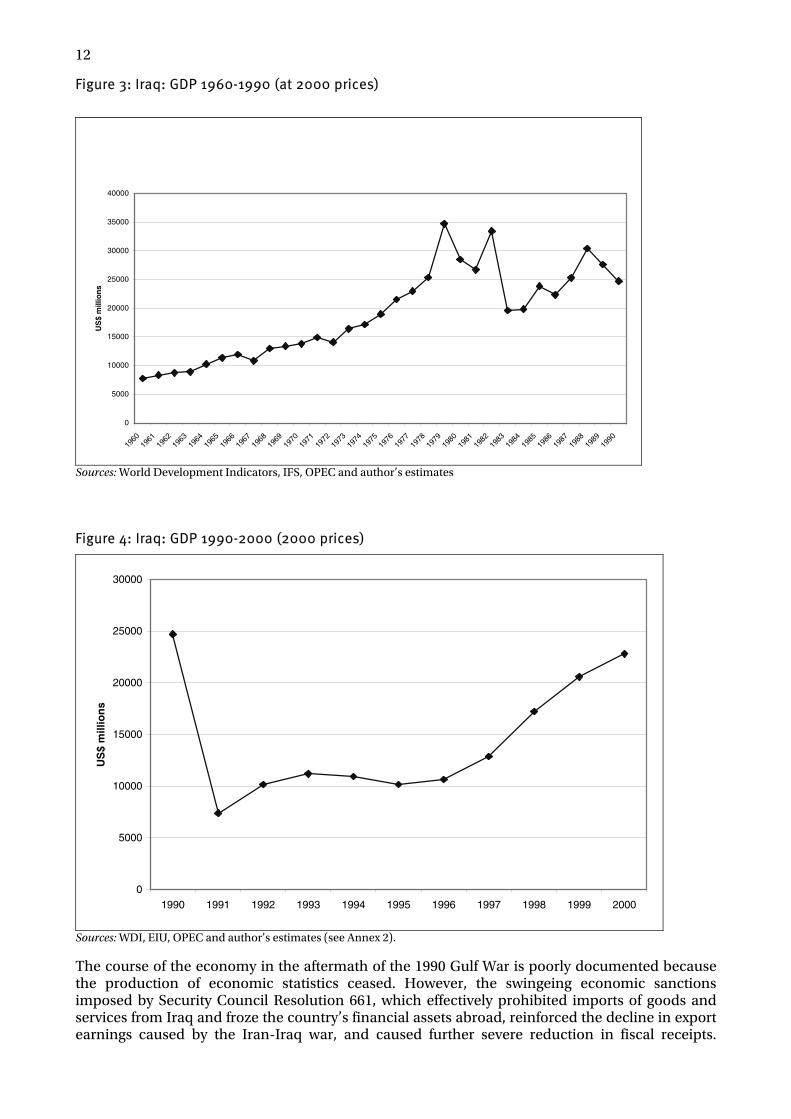
Sources: WDI, EIU, OPEC and author’s estimates (see Annex 2). The course of the economy in the aftermath of the 1990 Gulf War is poorly documented because the production of economic statistics ceased. However, the swingeing economic sanctions imposed by Security Council Resolution 661, which effectively prohibited imports of goods and services from Iraq and froze the country’s financial assets abroad, reinforced the decline in export earnings caused by the Iran-Iraq war, and caused further severe reduction in fiscal receipts.
13
Inflationary financing of the fiscal deficit continued, leading to hyperinflation in the early 1990s. Per capita GDP is estimated to have fallen by over two-thirds between 1989 and 1991 with the virtual cessation of oil exports (cf. Fig.5). The livelihoods of impoverished, largely urban and wage-earning households depended increasingly on the public distribution of rations of essential foodstuffs and other consumer necessities which was organised at the outset by charitable organisations, but which was later taken over and made systematic by the Ministry of Commerce. A major turning point was Security Council Resolution 984 of 1995 which authorised some resumption of oil exports, subject to prior UN approval and with all export proceeds being paid into an account managed by the UN sanctions committee. This marked the beginning of the Oil-for-Food programme which made possible a resumption of legal imports into Iraq of both food and other essential items for the operation and maintenance of public services. The rules relating to oil exports were relaxed in 1999, when the ceiling on export volumes was removed. A quarter of the value of approved oil exports was earmarked for war reparation payments – mainly to Kuwait, and 13% was reserved for the autonomous Kurdish region in northern Iraq; the remainder, subject to prior approval of orders placed, was made available to the government in Baghdad. The Oil-for-Food programme brought unquestionable benefit to the Iraqi economy because it allowed legal oil exports to rise to 2.2 million b/d by 2000 –two-thirds of the previous highest level of 3.5 million b/d reached in the 1980s. Per capita GDP rose from a nadir of $500 in the early 1990s to approaching $1000 (in 2000 prices). Incomes increased significantly, though less dramatically than per capita GDP (shown in Fig. 5) because of bureaucratic delays in the UN-supervised authorisation and procurement of imported supplies, and because a quarter of the value of authorised exports was earmarked for war reparations. The food imports permitted under the programme, combined with domestically procured supplies were sufficient to provide life-sustaining rations to the bulk of the population. The other imports enabled the government to make a start on its backlog of maintenance and repairs in infrastructure – notably power and water. The other – unquantifiable – factor in Iraq’s partial economic recovery in the late 1990s was the growth of sanctions-breaking cross-border trade financed by illegal exports of oil and petroleum products. Illegal exports may have amounted to as much as 25% of those recorded by the UN Sanctions Committee.
14
Figure.5: Iraq: per capita GDP 1970-2000 (at 2000 prices)
0
500
1000
1500
2000
2500
3000
1970
1971
1972
1973
1974
1975
1976
1977
1978
1979
1980
1981
1982
1983
1984
1985
1986
1987
1988
1989
1990
1991
1992
1993
1994
1995
1996
1997
1998
1999
2000
US
$
Source: WDI, IFS, OPEC, author’s estimates (see Annex 2).
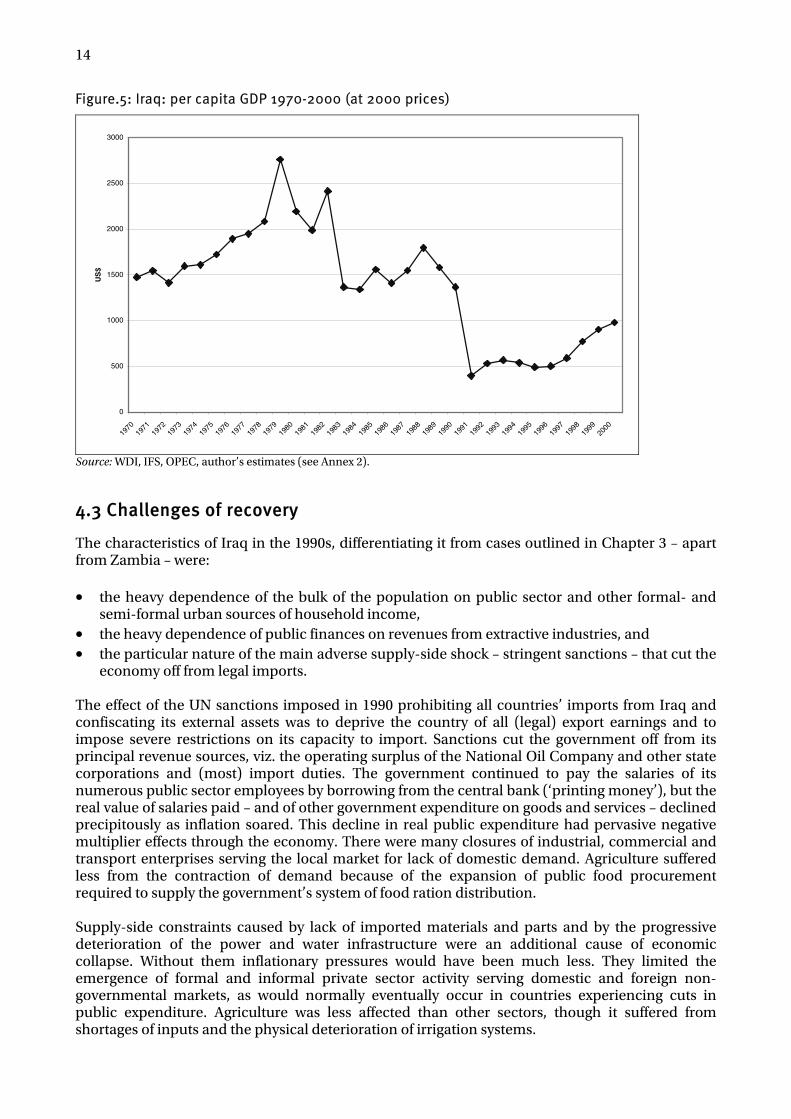
4.3 Challenges of recovery
The characteristics of Iraq in the 1990s, differentiating it from cases outlined in Chapter 3 – apart from Zambia – were: • the heavy dependence of the bulk of the population on public sector and other formal- and
semi-formal urban sources of household income, • the heavy dependence of public finances on revenues from extractive industries, and • the particular nature of the main adverse supply-side shock – stringent sanctions – that cut the
economy off from legal imports. The effect of the UN sanctions imposed in 1990 prohibiting all countries’ imports from Iraq and confiscating its external assets was to deprive the country of all (legal) export earnings and to impose severe restrictions on its capacity to import. Sanctions cut the government off from its principal revenue sources, viz. the operating surplus of the National Oil Company and other state corporations and (most) import duties. The government continued to pay the salaries of its numerous public sector employees by borrowing from the central bank (‘printing money’), but the real value of salaries paid – and of other government expenditure on goods and services – declined precipitously as inflation soared. This decline in real public expenditure had pervasive negative multiplier effects through the economy. There were many closures of industrial, commercial and transport enterprises serving the local market for lack of domestic demand. Agriculture suffered less from the contraction of demand because of the expansion of public food procurement required to supply the government’s system of food ration distribution. Supply-side constraints caused by lack of imported materials and parts and by the progressive deterioration of the power and water infrastructure were an additional cause of economic collapse. Without them inflationary pressures would have been much less. They limited the emergence of formal and informal private sector activity serving domestic and foreign non-governmental markets, as would normally eventually occur in countries experiencing cuts in public expenditure. Agriculture was less affected than other sectors, though it suffered from shortages of inputs and the physical deterioration of irrigation systems.
15
The sanctions regime, therefore, caused a serious reduction of output in much of the Iraqi economy, and some deterioration of productive potential through neglect of maintenance. But it did not cause large-scale physical destruction of physical capacity. Furthermore institutional, administrative and managerial potential largely survived, though there was some depletion of professional and technical skills through emigration, deterioration in the quality of technical training and deprivation of contact with foreign know-how. Harm done to the supply side of the economy was therefore mostly of a kind that was quite quickly reversible once sanctions were mitigated or removed. The economy was operating in the early 1990s at levels well below productive capacity, even though capacity was slowly contracting. The demonstration of this came after 1996, and even more so after 1999, when first limited, and then unlimited, legal oil exports were authorised by the Security Council, permitting a resumption of imports of food, supplies and spare parts for use in the public sector and for public distribution. Increasingly well-organised smuggling of oil and refined products out of the country further raised Iraq’s import capacity. The vigorous (albeit poorly documented) economic revival that occurred in the late 1990s and that lasted until 2001 was the product not only of rising oil output but also of some loosening of infrastructure bottlenecks through repairs and maintenance, and thus of some supply-side constraints on domestic production. The course of economic recovery in Iraq, after the lifting of sanctions, though different from the one available to other developing countries in the aftermath of economic collapse, may well be able to count on a similarly high supply-side elasticity. With the resumption of receipts of revenue from oil the Iraqi government should be able, without incurring the inflationary consequences experienced during sanctions, to increase the real value of public service wage and salary payments, and to procure goods and services from domestic and foreign suppliers for tackling the backlog of maintenance of public infrastructure. Government and household expenditures thus financed can elicit a vigorous and early supply response within the limits of available surplus capacity, encompassing the sectors of transport, retail and wholesale trade, personal and financial services, light-manufacturing and, to an extent, agriculture. Early attention to relieving infrastructure bottlenecks in power and water through the repair and replacement of equipment can carry forward the recovery process by giving traders and manufacturers the confidence to invest in stocks and new equipment, and to hire labour.

16
Chapter 5: Economic structures and policies for economic recovery
This chapter looks at some common characteristics of economic collapse. It then considers structural features which dispose countries to rapid recovery, or which may retard or inhibit recovery, and whether there macroeconomic limits to the use of public expenditure as a stimulus. It is preparatory to later chapters which examine the usefulness of a linear model in charting the course of recovery. For the purposes of exposition, countries considered are schematically divided into two groups: ‘general case’ countries where, at the time of collapse, the rural economy played a predominant role, and ‘urbanised case’ countries where populations were highly urbanised and where extractive (and downstream) industries were the main determinants of economic fortune. The urbanised-extractive industry country cases in point are Iraq and Zambia; the ‘general’ country cases are the seven other countries discussed in Chapter 3.10 The chapter concludes with a presentation of, and some reflections on, donor consensus policies for assisting collapsed economies to make good their recovery.
5.1 Characteristics of ‘general case’ collapsed economies
With the exception of Zambia, all the countries discussed in Chapter 3 typically have (a) the predominance of the rural economy in production, (b) a preponderantly rural population, (c) mainly commodity-based export earnings, and (d) large balance of trade (and current account) deficits, of the order of 10-20% of GDP. In the rural economy there is a traditional and fairly resilient, albeit poverty-stricken, peasant economy. Alongside this, there are ‘modern’ economic activities – such as commercial agriculture, mining, processing and other manufacturing activities. These sectors provide the bulk of exports, with ‘modern’ enterprises marketing the exportable produce of small farmers and pastoralists. The left-hand panel in Table 2 summarises the main structural features of these economies, before or after their collapse. These features can be used to derive the illustrative stylised facts of an illustrative general model of low-income economies in potential need of assistance with post-collapse recovery assistance. They are also the basis of the illustrative quantitative model whose properties are discussed in chapter 7 below.
Table 2: Collapsed economies' economic structures (Shares of GDP at factor cost)
General Case Urbanised Cases (rural, informal activities dominant) (extractive industries
dominant)Cambodia1 Cameroon2 Ethiopia1 Mozambique2 Nicaragua2 Rwanda3 Uganda1 Iraq4 Zambia1
Exports Goods & Services 30.0 26.0 14.6 12.3 39.6 7.7 12.7 16.1 41.0Imports Goods & Services 46.4 23.0 23.8 33.6 85.7 18.5 22.7 25.7 45.3Household Consumption 81.2 74.8 86.4 97.7 117.5 87.1 90.3 55.7 82.2Govt. Consumption 9.1 8.5 12.8 10.0 21.4 12.4 10.7 34.8 17.6Investment 20.7 16.7 17.7 22.4 34.3 14.4 17.9 25.6 18.1VA Agriculture 50.0 42.1 52.3 37.2 41.4 33.5 49.4 7.5 18.5VA Manufacturing 8.3 10.6 7.0 8.5 7.1 4.9 7.5 5.5 24.6VA Other Industry, Mining 4.9 11.5 4.1 10.4 21.0 16.6 6.8 45.5 11.3VA Services 32.4 35.8 36.5 43.9 57.7 48.1 36.3 41.5 45.7Notes: 1. 1995 3. 1991
2. 1996/1997 4. 1986 (NB Exports/GDP ratio depressed by war, currency over-valuation and low oil price)
10 Zambia is treated here as an ‘urbanised’ economy though only 40% of its population lives in urban areas because, during the years of economic decline and at the beginning of the recovery period ‘industry’ (including mining) accounted for nearly 50% of GDP and mining and manufacturing still supply over 80% of merchandise exports.
17
Activities in the urban sectors of countries conforming to this general model are predominantly governmental, administrative, financial and commercial. The financial and commercial sectors service enterprises in the ‘modern’ productive sectors and are the conduit for external transactions. In the interstices of the ‘modern’ economy there is typically a vigorous and adaptable non-agricultural ‘informal’ economy in which large numbers of people are engaged. Informal petty traders provide local distribution of domestically produced and imported foodstuffs and other consumer goods required by poor people. The informal sector also produces many of the cheap goods consumed by the poor. In urban areas the informal sector also supplies a variety of services to the employees of the formal sectors. In countries conforming to this pattern typically 65-80% of the population is rural. Sixty-seventy percent of the labour force works mainly in agriculture, 15-20% in non-rural, formal, employment (including administration), and the remainder in the urban informal sector. The institutional superstructure of these countries is usually fragile, with informal sector largely escaping the systematic purview of law enforcement and tax collection. Public administration is considered by most citizens as oppressive, arbitrary and to be avoided. Economic shocks to these economies – of the kind engendered by civil war, or gross economic predation, gross exchange rate overvaluation, and other mismanagement by governments – disrupt the supply side, producing a number of inter-related reactions:11 • The modern productive sectors of the economy are adversely affected at an early stage. This is
because they tend to be import-dependent, and/or dependent on sound transport, communications and financial links with the exterior, or dependent on export markets. Physical or institutional insecurity, and policies that increase their costs and/or deny them access to the means of effecting external payments, rapidly undermine their operation, leading if not to closure at least to reduced output, sales and profitability.
• Contraction in the modern productive sectors reduced fiscal revenues from taxes on trade and incomes. The state may react by printing money, promoting inflation and the erosion of real incomes in public services, or by directly reducing public expenditure. Public services diminish in quantity and quality. Deteriorating public health services causes mortality rates to rise.
• Some formal sector employees are laid-off; more are obliged to moonlight to make ends meet as the purchasing power of wages and salaries falls.
• The informal sector is less directly and immediately affected, except in conflict zones, and for the producers of (generally farm) exports. The production and marketing of subsistence goods for the local market continues, though it may face mounting logistical obstacles. The supply of labour to the informal sector increases with the contraction of employment in the formal sector and migration to the informal, thus increasing competition between suppliers of goods and services, and in some cases breaking down relationships of trust on which informal business transactions depend. This, and the loss of ability to sell goods and services to the domestic formal sector and to export markets, erodes incomes and increases income poverty.
• In conflict zones where there is high physical insecurity even the informal economy breaks down, leading to population displacement and refugee problems, and a swelling of the informal sectors in urban areas where security is relatively good and there is some expectation of humanitarian relief.
Economic collapse in economies conforming to this model is neither sudden nor total because of the resilience of the informal sector. Economic recovery may be early and robust because, as urban (including government) sector demand and exports increase, the informal and export-oriented sectors are in a position to supply. Then, as the process matures, and the supply-side 11 The eight country profiles in Annex 1 illustrate these points in particular cases.
18
slack is taken up, the pace of recovery may slow. Alternatively, recovery may be progressive, as the tasks of re-establishing security, rehabilitating power, transport and communications, restoring economic and social institutions, and waiting for new formal sector enterprises to form, are slowly fulfilled. Their fulfilment may be retarded by the loss of a critical mass of trained and experienced staff and/or a lack of resources to pay for them to work satisfactorily, and because of the time lags involved in reviving business confidence among potential investors.
5.2 Characteristics of collapsed ‘urbanised’ economies
In urbanised, mineral-based, economies the contraction of the export-oriented formal sector has more dramatic effects on general economic well-being than in the case of predominantly rural economies because of the relatively much greater size of the tax-financed public sector. The key feature of economic collapse in Zambia and Iraq has been the inability of these countries’ large extractive industry sectors to maintain production and export earnings, and thus to sustain and increase their revenue contributions to the national exchequer. In boom years high receipts from extractive industries encourage governments to increase public consumption and investment expenditure. High export receipts also make possible high levels of public borrowing from abroad to finance investment. In Zambia, in 1975, before the decline of copper prices – and mining output – government consumption expenditure was 27% of GDP, and gross capital formation (mostly in the public sector) was 41% of GDP. By 1990, after 15 years of erratic – and mismanaged – decline, government consumption and investment shares of GDP were respectively 19% and 18%. In the mid-1990s these shares were even lower (cf. Table 2). The somewhat similar consequences of falling oil revenues in Iraq are described in Chapter 4 – though the effects of reduced oil exports in the 1980s were mitigated by aid and credits from Arab donors. Reduced public expenditure has a ripple effect on the urban economy, and more generally on domestic-market-oriented producers. Real public wage and salary payments and real public procurement fall, creating unemployment, or at least reduced activity levels and incomes, among domestic suppliers of investment and consumption goods. The falling tide lowers most boats. The main exceptions to general economic decline are subsistence agriculture and those export-oriented activities which are not affected by the causes of the fall in earnings in extractive industries. Unfortunately, in many extractive industry-based economies persistent Dutch Disease effects (i.e. real currency appreciation) have often undermined the international competitiveness of the domestic producers of non-mineral tradable goods and services, rendering economic adjustment and re-orientation towards production for export, in the event of falling mineral receipts and with falling investment levels, slow and painful. The most expedient route to economic recovery from export-earnings-induced collapse in an urbanised and largely formal economy is likely to involve either a revival of high-revenue-generating export earnings or of their substitution by some source of finance for public expenditure – such as aid. Raising public expenditure towards former levels – in real per capita terms – is likely to be by far the most quick-acting stimulus to economic revival. It will work much more rapidly than waiting for the emergence, often from small beginnings, of new export-oriented sectors capable of winning international market share, or for the slow expansion of enterprises serving the depressed domestic market. Reviving past patterns of revenue generation and expenditure brings dangers. It maintains or increases exposure to external shocks, and may suppress incentives for necessary long-term economic re-orientation and diversification. However, on conventional assumptions about time preference, the alternative may be less attractive if the means to finance fast-track revival are available.
5.3 Macroeconomics of aid for economic recovery
In the phase of collapse there is a distinction in macroeconomic characteristics between states where governments remain sufficiently intact to extract an inflation tax by borrowing from the

19
monetary authorities to finance their fiscal deficits, and states where there is no longer any emission of domestic currency. In the former – all except Cambodia in the sample of eight – there tends to be high and unstable inflation, with falling Money/GDP ratios. This inflation is aggravated by diminished access to foreign exchange receipts – because of falling exports, diminished external assistance etc. – causing domestic supply shortages and a depreciation of the free market exchange rate. There is also likely to be an aggravated problem of external indebtedness due to default on service payments during the period of collapse. In the latter – e.g. Somalia, Afghanistan – prices tend to be stable or falling because the medium of exchange is either foreign currency or old banknotes of which there is no new emission. Turning to macroeconomic policies for the phase of recovery, when the possibility arises of a rapid increase in domestic expenditures – whether financed by external aid or by a recovery of export earnings and of domestic revenues – two related issues have to be faced. These are: (a) whether any step increase in the demand for labour or other domestically-produced goods and services will encounter supply-side bottlenecks, so causing inflation, and (b) whether any deficit financing is permissible in increasing public expenditure outlays. In the country cases reviewed in Chapter 3 the start of economic recovery was accompanied by an early abatement of the inflationary pressures, which had sometimes been acute during preceding phases of decline, as in Mozambique, Nicaragua, Uganda and Zambia (Fig. 6). The pass-through of exchange rate depreciation into higher domestic prices (and, in one case drought) delayed this process by 1-4 years in Cameroon, Uganda and Zambia. The decline in inflation occurred both in countries such as Zambia and Nicaragua, where demand-side stimulus was restrained, and in the other cases where it was more full-throttle. Only in Cambodia did very high rates of inflation persist for over 5 years from the start of recovery.
Figure 6: Recovery phase inflation
-50.00
0.00
50.00
100.00
150.00
200.00
1 2 3 4 5 6 7 8 9 10 11 12
Years from Start of Recovery
An
nu
al p
erce
nta
ge
incr
ease
in G
DP
def
lato
r
Cambodia Cameroon Ethiopia Mozambique Rwanda Uganda Zambia
Source: WDI Note: Inflation in Nicaragua in Years 1 and 2 of the recovery period was 5000% and 4500%, declining to 23% in Year 3. It is omitted from the diagram for reasons of scale.
This benign outcome seems to have been the consequence of a combination of two factors, viz. an elastic supply of labour at going rates of remuneration and an adequate supply of inputs and other

20
complementary factors coming either from domestic sources or courtesy of international donors. The feared supply bottlenecks were only seriously evident from the inflation record in Zambia, which suffered a drought and food shortages in the years immediately following the start of recovery, and in Cambodia, where there was persistent physical insecurity. This confirms the case, already argued in Chapter 3, for saying that, in predominantly rural economies, there is often a high level of early period supply-side elasticity. Where there is prima facie evidence of this the consequences of large, early-stage, increases in final demand may be considered non-threatening for macroeconomic stability. There remains the question of part of the early-recovery-phase increase in expenditure can be deficit-financed, for example by borrowing from the central bank, or ‘printing money’. There are obvious inflationary dangers in increasing the money supply by expanding domestic credit, particularly in collapsed economies where the velocity of circulation of money may be very high (or, equivalently, where the M2/GDP ratio has fallen very low) as a result of prior loss of confidence in the currency and high inflationary expectations. As can be seen in Fig. 7, the ratio of M2 to GDP has been less than 15% in 5 out of the 8 countries considered until well into the recovery phase, meaning that £1 added to the money supply could raise monetary demand by £7.50 or more.
Figure 7: Recovery phase M2/GDP ratios
0.00
10.00
20.00
30.00
40.00
50.00
60.00
70.00
1 2 3 4 5 6 7 8 9 10 11 12 13
Years from Start of Recovery
M2
as %
of
GD
P
Cambodia Cameroon Ethiopia Mozambique Nicaragua Rwanda Uganda Zambia
Source: WDI
If the domestic supply side is elastic with respect to monetary demand, the effect of higher demand should be to increase the M2/GDP ratio as the transactions demand for money in the economy rises with higher levels of activity. If the rate of inflation is falling, the demand for money as a temporary store of value should also rise, thus further raising the M2/GDP ratio. The evidence in Fig. 7 indicates that where economic recovery is successful, recovery is indeed accompanied by monetary deepening, i.e. an increase in the demand for money, in all countries except Ethiopia (where the M2/GDP ratio has always been exceptionally high). But this typically does not start until 3-5 years into the recovery period, and then does not proceed at any consistent or predictable rate. The initial fillip given to inflation by exchange rate depreciation may in the first instance reduce the demand for money. Thereafter, however, as the M2/GDP ratio rises the scope for seignorage increases, allowing governments to cover some of their fiscal deficit by central bank

21
borrowing without provoking higher inflation. Nevertheless, deficit financing should be cautious, and await firm monetary evidence that it can proceed without risk to the delicate flower of reviving confidence in the national currency. In devising macroeconomic and fiscal policies for the immediate recovery period, therefore, distinctions are needed between: • countries which inherit high inflation from their period of decline, and • countries with low inflation; and between: • pure demand stimulus from deficit financing, and • higher public expenditure backed by external financing. If there is an inheritance of high inflation there have to be strict monetary policy limits on deficit financing, and there may have to be restrained use of public expenditure as an instrument for stimulus, even if it is backed by donor financing, unless accompanied by vigorous action to eliminate the most binding supply side constraints. The provision of assistance, even in the form of budget support, will act as a powerful solvent of supply-side constraints linked to the capacity to import, i.e. to the balance of payments. If the country concerned inherits a low rate of inflation there should be fewer inhibitions about raising levels of public expenditure and incurring deficits – certainly if these are backed by higher inflows from donors, and even in the absence of these, unless there is a balance of payments constraint. This implies that, in the absence of substantial receipts of donor assistance or in tax receipts from export-oriented activities, there can well be a tighter budget constraint on increases public expenditure intended to administer a sharp demand-side stimulus to a collapsed economy early in its recovery phase. But policy should be set in the light of the inflationary inheritance.
5.4 Common policy prescriptions
Conventional policy prescriptions for economic recovery in economies with these characteristics have been extensively covered in the literature reviewed in Chapter 2. They are based on a strategy combining assistance with humanitarian relief and resettlement, and institutional and infrastructural reconstruction. With varying orderings of priority the main prescribed activities are: • the restoration (or maintenance) of physical security – as a basic precondition for the revival of
economic activity and the provision of government services; this may call for external intervention pending the deployment of national law enforcement services;
• the revival of informal sector; this usually occurs spontaneously and quite quickly as security, transport and communication are restored, and as access to markets improves; however, an over-supply of humanitarian assistance may depress market prices for foodstuffs and other essentials;
• the resettlement of refugees, displaced persons and ex-combatants – usually by helping them to resume informal sector activity; resettlement programmes need organisation and external funding, and are often slow to start;
• the restoration of state institutions providing basic security, law enforcement, social and economic services; these services’ revival may be slowed by a paucity of budget resources and by the prior loss of trained and experienced staff, and by the persistence of bad habits of corruption, dereliction of duty and oppressiveness previously acquired;
• macroeconomic stabilisation, with the mobilisation of external resources to limit the extent of needed fiscal adjustment, and to finance the restoration of public services, pending the revival of domestic revenues;
22
• the revival of formal sector economic activity and of export-oriented production – which is often predicated not only on a return to physical security but also on measures of institutional and infrastructural rehabilitation; major rehabilitation of and new investment in formal sector enterprises is often delayed until there is assurance that economic recovery will persist;
• exchange rate adjustment, where needed to recreate incentives for export production and for the rehabilitation of export-oriented industries;
• rehabilitation and reconstruction of infrastructure: neglected maintenance over lengthy periods often gives rise to the need for programmes of rehabilitation work lasting several years in transport infrastructure and public utilities; however, the worst bottlenecks can often be relieved quite quickly.
The implicit assumption underlying the strategy is that the supply-side of the economy will revive spontaneously once the physical bottlenecks and insecurity are removed, and when confidence in policies and institutions revives. The sequencing of the supply-side response is rarely made explicit. The ordering of policy actions and aid interventions tends to be opportunistic. External assistance takes a variety of forms, depending on donors’ perceptions of needs, ranging from the financing of relief, demobilisation and resettlement, through programmes of physical reconstruction and institutional rebuilding, to balance of payments and budgetary support. Objectives are defined in terms of the proximate targets for restoring production and public services. There is little, if any, consideration of the second-round effects of donor-financed expenditures. These (often essential) measures of support are thus framed within a solely supply-side perspective on the recovery process, without explicit reference to the role of demand-side stimuli, and without consideration of the different labour market and income-earning opportunity characteristics of mainly urban and mainly rural economies.

23
Chapter 6: Modelling economic recovery
This paper now uses a linear, input-output, model to explore some of the features of recovery from economic collapse, in particular those which are dependent on inter-sector flows of expenditure and on the revival of effective demand through government, investment and household expenditure and through export earnings. The model pre-supposes infinitely elastic supply, constant returns to scale, and fixed factor proportions technology. Economic activity is essentially constrained by demand. These assumptions are in general invalid in the longer term in growing economies operating close to their productive potential where patterns of consumption and investment expenditure are altering, where factors are substitutable and where there are rising marginal costs. For this reason linear (or Leontief) models have fallen out of favour as tools for economic forecasting and planning. Their main contemporary application lies as component parts of whole-economy computable general equilibrium models used for the purpose of comparative static policy analysis, showing how expenditure and relative price shocks maybe expected to ripple through the economy, and what distributional effects they may have. However, such models may well have short term application in studying recently collapsed economies where there is evidence of availability of idle but potentially productive resources – of labour, land and physical capital, and where a feature of economic collapse has been a contraction of effective demand for domestic goods and services. This contraction may have been caused by physical insecurity, the disruption of transport and communications links, reduced public revenues and expenditures, lower aid, loss of investor confidence, capital flight, (for exports) over-valued exchange rates etc. In economies, and sectors of economies, where: • there are no serious factor-, input- or managerial constraints on the supply-side, or • external assistance effectively relieves bottlenecks without creating scarcities of domestic
factors of production and inputs, Revived effective demand is likely to elicit a supply response. Linear models can help to evaluate the strength of the supply response to be expected from different prospective sources and levels of demand-side stimulus, whether in the form of higher public consumption and investment expenditure, or revived export earnings.
The argument of this paper is that the assumption of constant returns to scale may be broadly representative of particular phases of the process of economic recovery. As an instrument for policy analysis, however, the input-output framework can be discretionarily adjusted to take known or suspected supply-side bottlenecks into account. The effects of supply-side bottlenecks and other factors that may alter input-output relationships in production and that cause variations in the expenditure patterns of households, enterprises and the government can be dealt with by discretionary adjustment to input coefficients. This can be done for supply-constrained tradable goods and services by lowering the coefficients on domestic output satisfying intermediate or final demand, thus allowing a larger share of demand to be met by imports. Simulations of increases in final demand, after this adjustment, will produce larger trade deficits – a sign of the macroeconomic imbalances that are to be expected if effective demand is increased in the face of supply-side constraints.
6.1 Structure of the model
Linear models calculate the sum of the direct, indirect and induced effects of increases on final demand – defined as exports, and consumers’, investors’ and government expenditure:

24
• the direct effect of final demand increases is the higher output that is elicited from different sectors of the domestic economy, and a rise in imports; higher domestic output comprises an increase in value added, and higher intermediate consumption of goods and services from other sectors.
• the indirect effect is the increase in output (including value added) in sectors supplying intermediate inputs required to make the outputs needed to satisfy the increase in final demand;
• the induced effect arises from expenditure in the domestic economy of increases of income (value added) generated by the direct and indirect effects of the initial increases in final demand, mainly by households.
The direct and indirect effects are conventionally summarised using linear algebra in the formula: ∆Y = (I-A)-1∆X where ∆Y is the vector of increases in the value of output, A is the matrix of coefficients of domestically supplied intermediate consumptions, and ∆X is the vector of autonomous increases in final demand that cause the economy to expand. Consequential increases in value added can be represented by the expression: ∆V = v(I-A)-1∆X where v is the vector of value added coefficients, i.e. shares of value added in the output of each sector, and ∆V is the vector of sectoral increases in value added. A proportion of the increases in value added (wages, profits, rents)12 is either saved or removed through direct taxation. The remainder is spent, mainly in the form of consumers’ expenditure, thus provoking a further round of direct and indirect expansionary effects. The first round of induced effects generates output of: Y’ = c∆V [(I-A)-1κ] where c is the share of value added spent on household consumption, and κ is the vector of sector shares in households’ consumption in final demand. First round induced effects on value added are: V’ = v(c∆V [(I-A)-1κ]). There is an income multiplier effect, as the first round of induced effects produces further increases in value added, and thus subsequent increases in consumers’ expenditure (see Annex 3). The direct, indirect and induced effects of raised final demand are stronger if direct expenditures are directed towards domestically produced goods and services, if there are strong backward inter-sectoral linkages, and/or if the value added share of output is high. Conversely, if final expenditure largely leaks out of the economy into imports, or is devoted to domestic products with weak backward linkages and low value added ratios, its effect in stimulating domestic economic activity is more limited. For the purposes of the numerical illustrations in the following sections of this paper it is assumed that changes in government expenditure, investment expenditure and export earnings are in some sense exogenous shocks, but that the portion of final demand represented by consumers’ expenditure is endogenous to the model. In other words, consumers’ expenditure is determined by household income which is a (variable but generally high) share of value added in each sector 12 Value added at factor cost, i.e. factor income net of indirect tax

25
which is calculated by the model. Consumers’ propensities to consume out of income are assumed to be fixed.
6.2 Application of the model to collapsed economies
Two particular problems arise with particular acuity in applying models of this type to collapsed economies: • Empirical estimation of coefficients. The construction of input-output models for quantitative
policy analysis involves the use in combination of sources of data for the most recent feasible year, including national and sectoral expenditure accounts, surveys of agriculture and manufacturing production, household budget surveys, fiscal accounts and trade statistics. There are commonly major discrepancies and definitional differences between these sources that require meticulous and systematic reconciliation. In collapsed economies there are usually few data sources of quality and timeliness, and they are almost always insufficient in scope and coverage to allow the construction of statistically valid input-output tables. However, if the models are used for qualitative, rather than quantitative, policy analysis, it matters less that the coefficients used are based on the meticulous exploitation of statistical sources than that they should be plausible orders of magnitude based on a reading of the most reliable data sources. Model-based simulations based on approximate but plausible coefficient have no value as rigorous forecasts, but can nevertheless be used to build pictures of rough orders of magnitude and of the likely relative sizes of the economic consequences of possible policy measures and of conceivable expenditure shocks.
• Choice of baseline for coefficients. An economy in collapse self-evidently has intermediate and final expenditure and value added coefficients that are different from those which it had before collapse and dislocation occurred. The question therefore arises which set of coefficients is most appropriate to modelling the recovery process. The answer should in principle depend on the pattern of expenditures and of income generation at the margin during the recovery process. If this pattern is closer to the pattern ruling prior to collapse pre-collapse coefficients should be used; otherwise, post-collapse coefficients (if ascertainable) are appropriate. The belief underlying the examples shown in this paper is that income and expenditure patterns during recovery, at least beyond its initial stage, are most likely to resemble those found prior to collapse. The reason for this is that, in the short-medium-term, many existing production processes have low elasticities of substitution between factors and inputs, and that, as consumers’ tastes and preferences are little changed from pre-crisis times, households will use additional income earned during recovery to revert to their pre-crisis consumption bundles. The use of pre-collapse input-output tables to chart the likely course of recovery makes simplifying and potentially misleading assumptions. However, the results are likely to be less misleading than alternative procedures for the purposes of qualitative policy analysis. The main alternatives would be to estimate and apply input-output coefficients descriptive of the post-collapse, dislocated, state of the economy, or of some half-way-house between this state and the pre-collapse state. These coefficients, if they could in practice be found, might be more appropriate in the very short term, but, as recovery proceeds, as external assistance is provided to relieve supply and infrastructural bottlenecks, and as linkages, at the margin, increasingly approximate to pre-collapse transaction patterns, they would rapidly cease to be relevant. Thus, pre-collapse coefficients are the least bad option for planning, and for understanding the pathways of demand expansion, beyond the very short term.
To these points may be added a third issue, viz.
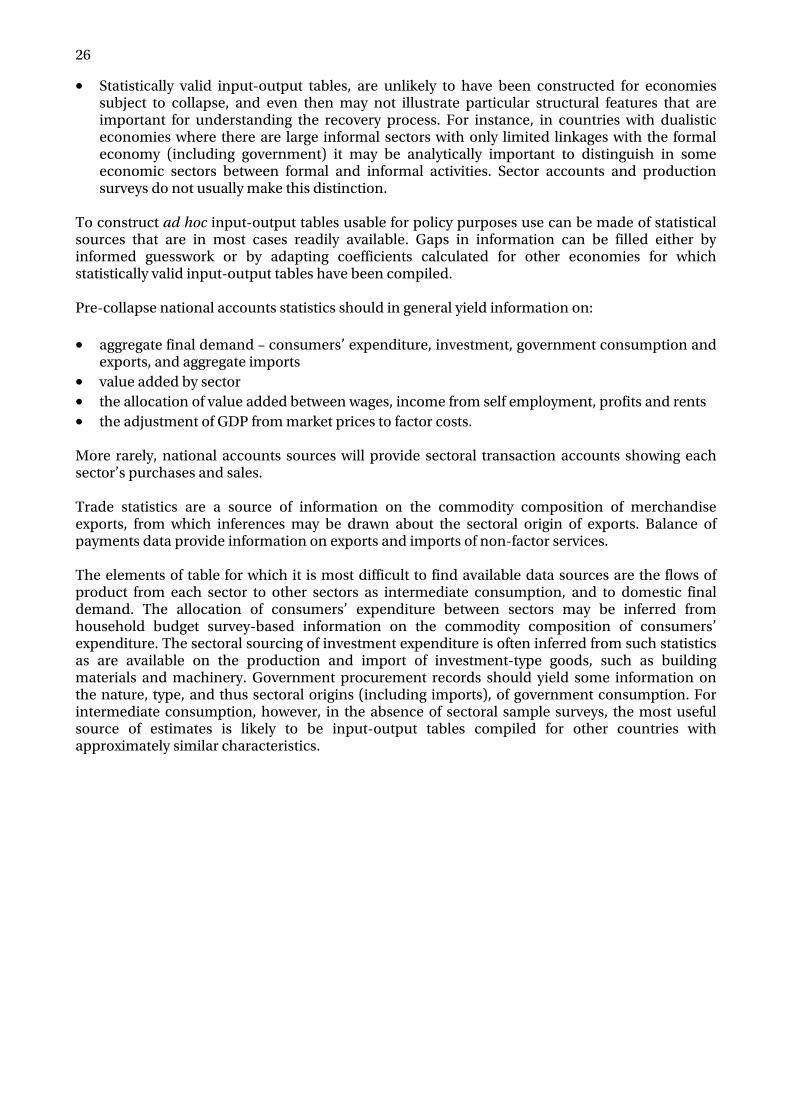
26
• Statistically valid input-output tables, are unlikely to have been constructed for economies subject to collapse, and even then may not illustrate particular structural features that are important for understanding the recovery process. For instance, in countries with dualistic economies where there are large informal sectors with only limited linkages with the formal economy (including government) it may be analytically important to distinguish in some economic sectors between formal and informal activities. Sector accounts and production surveys do not usually make this distinction.
To construct ad hoc input-output tables usable for policy purposes use can be made of statistical sources that are in most cases readily available. Gaps in information can be filled either by informed guesswork or by adapting coefficients calculated for other economies for which statistically valid input-output tables have been compiled. Pre-collapse national accounts statistics should in general yield information on: • aggregate final demand – consumers’ expenditure, investment, government consumption and
exports, and aggregate imports • value added by sector • the allocation of value added between wages, income from self employment, profits and rents • the adjustment of GDP from market prices to factor costs. More rarely, national accounts sources will provide sectoral transaction accounts showing each sector’s purchases and sales. Trade statistics are a source of information on the commodity composition of merchandise exports, from which inferences may be drawn about the sectoral origin of exports. Balance of payments data provide information on exports and imports of non-factor services. The elements of table for which it is most difficult to find available data sources are the flows of product from each sector to other sectors as intermediate consumption, and to domestic final demand. The allocation of consumers’ expenditure between sectors may be inferred from household budget survey-based information on the commodity composition of consumers’ expenditure. The sectoral sourcing of investment expenditure is often inferred from such statistics as are available on the production and import of investment-type goods, such as building materials and machinery. Government procurement records should yield some information on the nature, type, and thus sectoral origins (including imports), of government consumption. For intermediate consumption, however, in the absence of sectoral sample surveys, the most useful source of estimates is likely to be input-output tables compiled for other countries with approximately similar characteristics.

27
Chapter 7: Illustrative applications of the I-O framework to economic recovery
7.1 General case of low-income countries
To illustrate how input-output models can be used to assist with qualitative policy analysis a hypothetical model of a typical ‘general case’ collapsed economy has been constructed. This is shown in Table 3. Activity in this hypothetical economy has, for present purposes been condensed into four sectors, two of which – agriculture and transport-and-trade – are subdivided into formal and informal sub-sectors. All numbers in the table are percentages of total value added (at factor cost) which is, in the penultimate row of the final column, is given the value of 100. The ‘personal and administrative services’ sector (Sector 6) comprises also financial and property (e.g. housing) services, and the whole of public service delivery, whether by public sector or private sector providers. Services paid for by the government through its budget are shown as being supplied to the government, and those paid for by households are shown as being supplied to consumers. The first panel of figures in the table shows the value of intermediate consumption of each productive sector, the value of imports used in production, and the value added created in production. The second panel of figures shows the final demand – disaggregated by consumers’ expenditure (C), investment expenditure (I), government consumption (G) and exports (X) – for the products of each productive sector, and for imports. The final column gives the total value of output – for both intermediate and final consumption – for each productive sector, total imports, and total value added. The typical characteristics of this economy are: • the large informal (smallholder) agriculture sector, supplies most of the food consumed in the
country, and produces 20% of GDP; it has few backward linkages, except to informal traders and transporters,
• the formal agricultural sector (estates) mainly produces exportable agricultural commodities – half of all exports of goods and services, by value – generating 22% of GDP,
• there is a mining (and manufacturing) sector producing 30% of export earnings, • there are utility companies and small-medium sized industrial enterprises with extensive (but
not intensive) backward and forward linkages, that also supply final demand, • the formal sector predominates in transport, trade and tourism, producing 17% of GDP and 8%
of export earnings, • there is a sizeable personal, administrative, financial, professional and property services sector
producing 20% of GDP, much of it in the public sector, nearly 40% of the value of whose output is directly paid for from the government’s budget,
• government consumption amounts to 18% of GDP (at factor cost); in the absence of major subsidy and transfer programmes government recurrent expenditure is of the same order of magnitude as a share of GDP,
• there is a large external deficit on trade in goods and non-factor services of 20% of GDP.
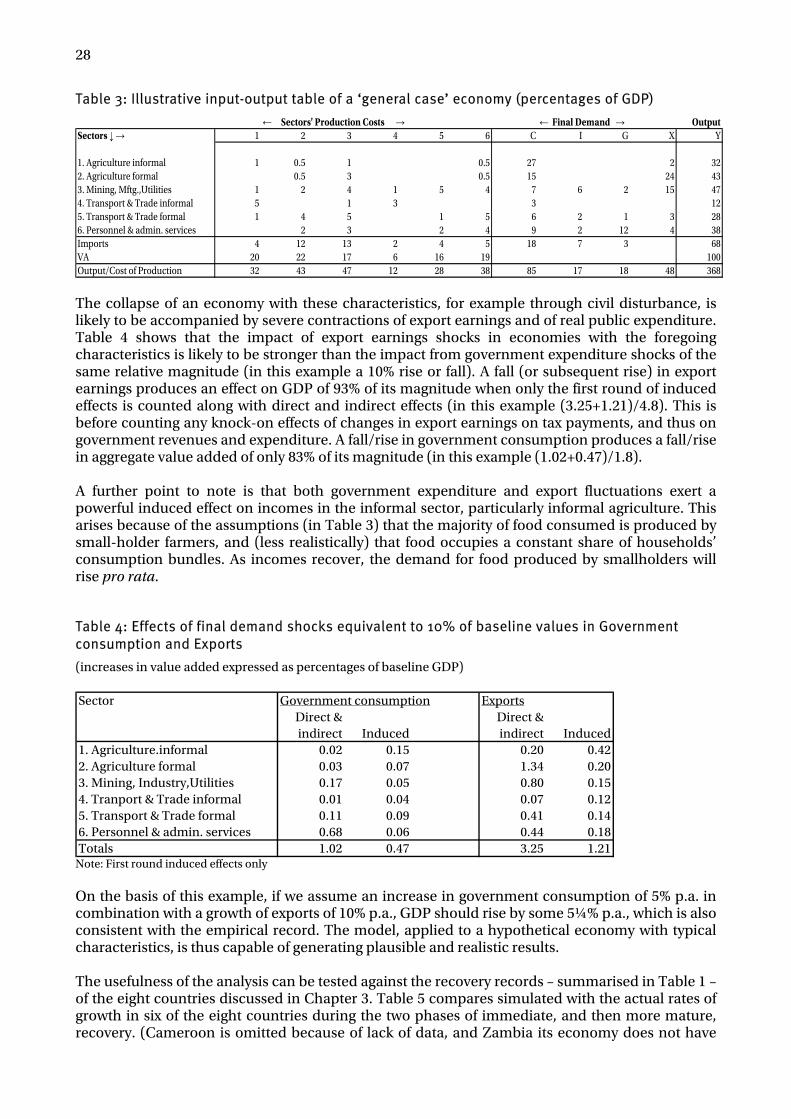
28
Table 3: Illustrative input-output table of a ‘general case’ economy (percentages of GDP)
← Sectors' Production Costs → ← Final Demand → OutputSectors ↓ → 1 2 3 4 5 6 C I G X Y
1. Agriculture informal 1 0.5 1 0.5 27 2 322. Agriculture formal 0.5 3 0.5 15 24 433. Mining, Mftg.,Utilities 1 2 4 1 5 4 7 6 2 15 474. Transport & Trade informal 5 1 3 3 125. Transport & Trade formal 1 4 5 1 5 6 2 1 3 286. Personnel & admin. services 2 3 2 4 9 2 12 4 38Imports 4 12 13 2 4 5 18 7 3 68VA 20 22 17 6 16 19 100Output/Cost of Production 32 43 47 12 28 38 85 17 18 48 368
The collapse of an economy with these characteristics, for example through civil disturbance, is likely to be accompanied by severe contractions of export earnings and of real public expenditure. Table 4 shows that the impact of export earnings shocks in economies with the foregoing characteristics is likely to be stronger than the impact from government expenditure shocks of the same relative magnitude (in this example a 10% rise or fall). A fall (or subsequent rise) in export earnings produces an effect on GDP of 93% of its magnitude when only the first round of induced effects is counted along with direct and indirect effects (in this example (3.25+1.21)/4.8). This is before counting any knock-on effects of changes in export earnings on tax payments, and thus on government revenues and expenditure. A fall/rise in government consumption produces a fall/rise in aggregate value added of only 83% of its magnitude (in this example (1.02+0.47)/1.8). A further point to note is that both government expenditure and export fluctuations exert a powerful induced effect on incomes in the informal sector, particularly informal agriculture. This arises because of the assumptions (in Table 3) that the majority of food consumed is produced by small-holder farmers, and (less realistically) that food occupies a constant share of households’ consumption bundles. As incomes recover, the demand for food produced by smallholders will rise pro rata.
Table 4: Effects of final demand shocks equivalent to 10% of baseline values in Government consumption and Exports
(increases in value added expressed as percentages of baseline GDP) Sector Government consumption Exports
Direct & Direct &indirect Induced indirect Induced
1. Agriculture.informal 0.02 0.15 0.20 0.422. Agriculture formal 0.03 0.07 1.34 0.203. Mining, Industry,Utilities 0.17 0.05 0.80 0.154. Tranport & Trade informal 0.01 0.04 0.07 0.125. Transport & Trade formal 0.11 0.09 0.41 0.146. Personnel & admin. services 0.68 0.06 0.44 0.18Totals 1.02 0.47 3.25 1.21
Note: First round induced effects only On the basis of this example, if we assume an increase in government consumption of 5% p.a. in combination with a growth of exports of 10% p.a., GDP should rise by some 5¼% p.a., which is also consistent with the empirical record. The model, applied to a hypothetical economy with typical characteristics, is thus capable of generating plausible and realistic results. The usefulness of the analysis can be tested against the recovery records – summarised in Table 1 – of the eight countries discussed in Chapter 3. Table 5 compares simulated with the actual rates of growth in six of the eight countries during the two phases of immediate, and then more mature, recovery. (Cameroon is omitted because of lack of data, and Zambia its economy does not have

29
‘general case’ characteristics). The simulated growth rates are calculated simply and solely from the pro-forma input-output multipliers shown on Table 4 and the rates of autonomous final demand increase shown in Table 1, without adapting the coefficients to country circumstances, and without counting other dynamic effects. It transpires that the highly simplified linear model, using aprioristic, uniform, coefficients, provides a reasonable guide to actual rates of GDP growth in the immediate recovery period in all cases except Uganda. The performance of the linear model during the subsequent, mature, phase of recovery, however, is unsatisfactory. Evidence from this limited sample of countries, therefore, suggests, if anything, that GDP growth in the initial phase of recovery is more dependent on demand-side stimulus than it is in later years, emphasising the points that supply-side elasticities should not be underestimated at this early stage, and that the provision of external assistance to finance government consumption and investment expenditure will very likely produce multiplier effects which accelerate the pace of recovery.
Table 5: Annual growth rates during Initial & mature phases of recovery
Years 1-4 Years 4-8
Simulated Actual Simulated Actual
Cameroon 4.75 4.40 4.40 4.5Ethiopia 6.10 4.50 8.43 5.5Mozambique 5.83 5.20 9.12 2.4Nicaragua -1.12 0.00 6.42 4.3Rwanda 13.85 11.30 9.71 6.4Uganda 2.75 6.20 2.34 5.5Notes:Years from start of recovery (cf.Table 1). Actuals as in Table 1 Interpreting the post-collapse recovery scenario using an input-output framework in this way lends credence to the finding of Collier & Hoeffler that there is usually a vigorous supply-side response. As seen in Chapter 3, the response may come earlier than conventional wisdom believes. Users of the input-output model should bear this in mind, and not harbour over-pessimistic assumptions about the efficacy of expenditure instruments in stimulating recovery. Only overriding constraints on macroeconomic management should caution against their use. The main instruments of policy for stimulating recovery, thus, are (a) consumption and investment expenditure by government to restore government and infrastructural services, (b) supply-side measures to revive export production and to ensure that supply in the domestic market rises in line with domestic demand, and (c) direct assistance to households and (generally) informal sector micro- and small-scale enterprises in the form of payments for relief, resettlement and agricultural rehabilitation. The effects on GDP of direct donor support to households are harder to estimate using this model. This assistance may take the form of consumption subsidies in kind which raise household incomes but have virtually no effect on output, and thus on GDP. (Or it may have a negative effect by reducing incentives to produce). Assistance may also take the form of gifts of tools, inputs and planting materials whose use accelerates the revival of production in the informal sector, complementing the positive effects on growth of beneficial demand-side shocks arising from government expenditure. Assistance for mine clearance and the restoration of transport infrastructure can be thought of similarly as having effects primarily in enlarging supply-side bottlenecks and accelerating the recovery of production, with effects on demand that are at best minor and in general insignificant.
30
7.2 The case of Iraq
The same approach used to make quantitative illustration of the recovery process in the general case can also be used explore the recovery of a collapsed oil economy, Iraq. There are no published statistics on the Iraqi economy since the early 1990s, and even then published data were insufficient to construct a statistically valid input-output table. The following analysis is based on inferences from reports about structures and sector shares in the late 1980s – a time when the economy had not yet suffered its collapse of the 1990s, but when it was still under the distorting and debilitating influence of the Iran-Iraq war. It demonstrates that, once sanctions are removed, immediate bottlenecks in oil, power and water supply are enlarged, and financed is mobilised to rehabilitate a long under-maintained capital stock, the economy could quickly grow back into its erstwhile shape. Prior to the war of March-April 2003 Iraq experienced internal physical security, and had governmental institutions which, after allowance for the effect of sanctions and for the Ba’ath regime’s expenditure priorities and corruption, provided quite efficient and effective public and infrastructural services. The period of economic collapse, whatever the failings of economic governance, was not characterised by a collapse of public institutions and of public order. No allowance is therefore made here, in charting the course of post-war recovery, for the deleterious effects of subsequent looting, sabotage and anarchy on productive capacity, nor for the apparent inability of foreign contractors to operate unfamiliar and worn-out equipment in key sectors as effectively as Iraqi technicians had been able to do before the 2003 war. Table 6, organised on the same principles as Table 3 above, approximately illustrates the pre-collapse structure of the Iraqi economy. Value added is divided, for analytical purposes into household incomes, net of direct tax and profits and direct taxes. This is done to highlight the importance of the public sector in most branches of activity, and the high proportion of GDP that enters the government’s account from direct taxes and public enterprise surpluses. The dominant feature of the economy is the oil sector, which supplies 90% of export earnings, contributes 39% of GDP, but has very weak backward linkages to other sectors of the domestic economy. Public consumption at 32% of GDP is high by the standards of developing countries; it is largely devoted to the purchase of public (civil and security) services whose backward linkages – through public procurement – to the rest of the economy are strong. Public expenditure swells the overall size of the personal, administrative, financial and professional service sector which contributes 22% of GDP. The next largest contributor to GDP is the transport and trade sector provides services needed as inputs into agriculture and the government and to meet the consumption needs of a large urban population. Industry, comprising public utilities, resource-based (mainly chemical) industries and import-substitution consumer goods industries contributes more to GDP than agriculture which produces part only of the food and soft commodities required by the economy.
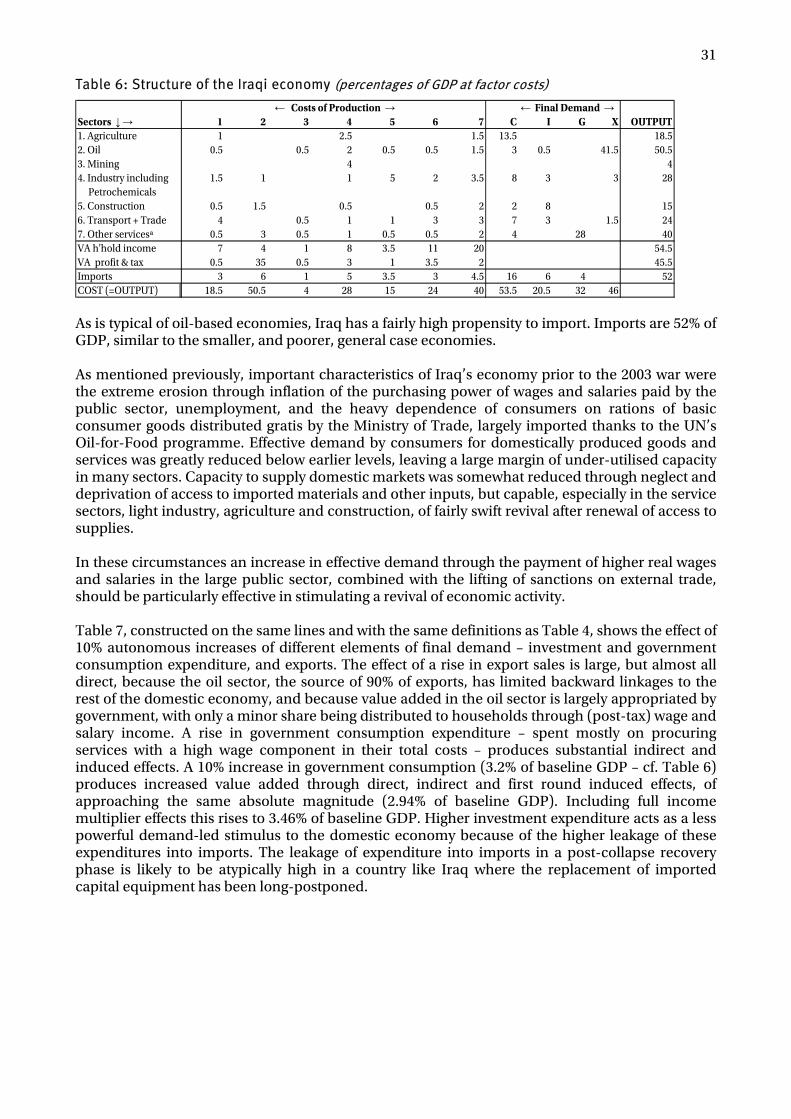
31
Table 6: Structure of the Iraqi economy (percentages of GDP at factor costs)
← Costs of Production → ← Final Demand →Sectors ↓ → 1 2 3 4 5 6 7 C I G X OUTPUT1. Agriculture 1 2.5 1.5 13.5 18.52. Oil 0.5 0.5 2 0.5 0.5 1.5 3 0.5 41.5 50.53. Mining 4 44. Industry including 1.5 1 1 5 2 3.5 8 3 3 28 Petrochemicals5. Construction 0.5 1.5 0.5 0.5 2 2 8 156. Transport + Trade 4 0.5 1 1 3 3 7 3 1.5 247. Other servicesª 0.5 3 0.5 1 0.5 0.5 2 4 28 40VA h'hold income 7 4 1 8 3.5 11 20 54.5VA profit & tax 0.5 35 0.5 3 1 3.5 2 45.5Imports 3 6 1 5 3.5 3 4.5 16 6 4 52COST (=OUTPUT) 18.5 50.5 4 28 15 24 40 53.5 20.5 32 46 As is typical of oil-based economies, Iraq has a fairly high propensity to import. Imports are 52% of GDP, similar to the smaller, and poorer, general case economies. As mentioned previously, important characteristics of Iraq’s economy prior to the 2003 war were the extreme erosion through inflation of the purchasing power of wages and salaries paid by the public sector, unemployment, and the heavy dependence of consumers on rations of basic consumer goods distributed gratis by the Ministry of Trade, largely imported thanks to the UN’s Oil-for-Food programme. Effective demand by consumers for domestically produced goods and services was greatly reduced below earlier levels, leaving a large margin of under-utilised capacity in many sectors. Capacity to supply domestic markets was somewhat reduced through neglect and deprivation of access to imported materials and other inputs, but capable, especially in the service sectors, light industry, agriculture and construction, of fairly swift revival after renewal of access to supplies. In these circumstances an increase in effective demand through the payment of higher real wages and salaries in the large public sector, combined with the lifting of sanctions on external trade, should be particularly effective in stimulating a revival of economic activity. Table 7, constructed on the same lines and with the same definitions as Table 4, shows the effect of 10% autonomous increases of different elements of final demand – investment and government consumption expenditure, and exports. The effect of a rise in export sales is large, but almost all direct, because the oil sector, the source of 90% of exports, has limited backward linkages to the rest of the domestic economy, and because value added in the oil sector is largely appropriated by government, with only a minor share being distributed to households through (post-tax) wage and salary income. A rise in government consumption expenditure – spent mostly on procuring services with a high wage component in their total costs – produces substantial indirect and induced effects. A 10% increase in government consumption (3.2% of baseline GDP – cf. Table 6) produces increased value added through direct, indirect and first round induced effects, of approaching the same absolute magnitude (2.94% of baseline GDP). Including full income multiplier effects this rises to 3.46% of baseline GDP. Higher investment expenditure acts as a less powerful demand-led stimulus to the domestic economy because of the higher leakage of these expenditures into imports. The leakage of expenditure into imports in a post-collapse recovery phase is likely to be atypically high in a country like Iraq where the replacement of imported capital equipment has been long-postponed.
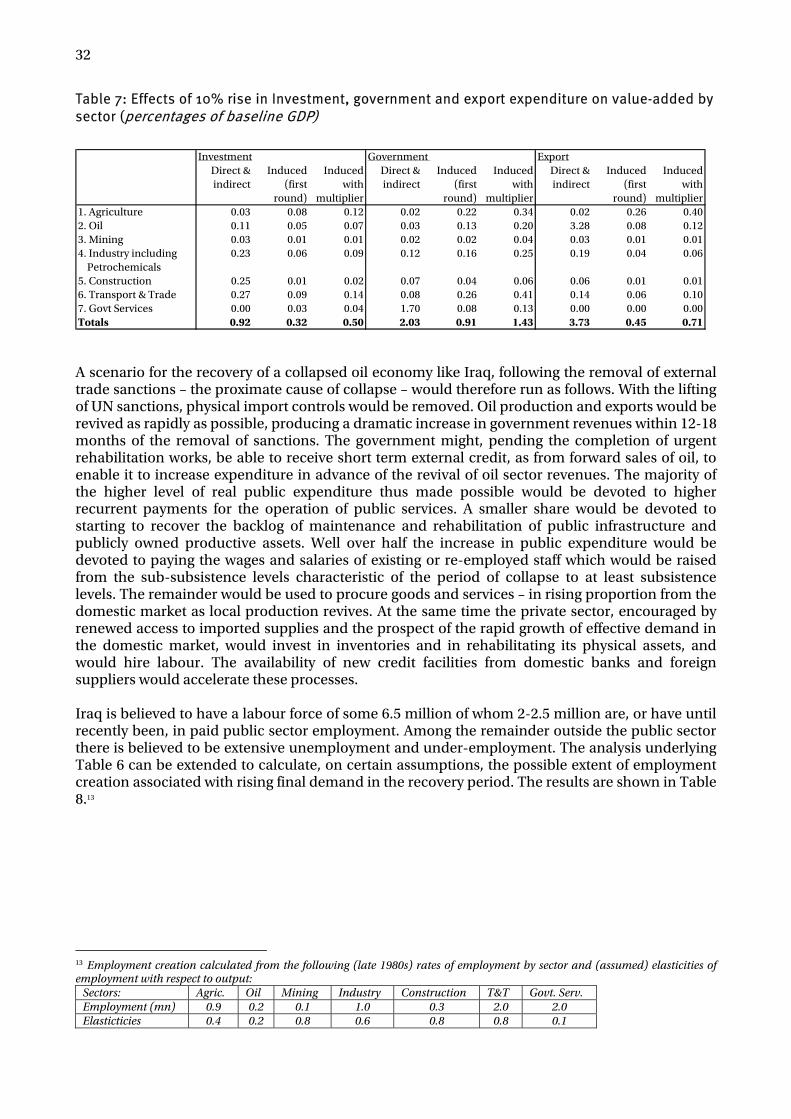
32
Table 7: Effects of 10% rise in Investment, government and export expenditure on value-added by sector (percentages of baseline GDP)
Investment Government Export
Direct & Induced Induced Direct & Induced Induced Direct & Induced Inducedindirect (first with indirect (first with indirect (first with
round) multiplier round) multiplier round) multiplier1. Agriculture 0.03 0.08 0.12 0.02 0.22 0.34 0.02 0.26 0.402. Oil 0.11 0.05 0.07 0.03 0.13 0.20 3.28 0.08 0.123. Mining 0.03 0.01 0.01 0.02 0.02 0.04 0.03 0.01 0.014. Industry including 0.23 0.06 0.09 0.12 0.16 0.25 0.19 0.04 0.06 Petrochemicals5. Construction 0.25 0.01 0.02 0.07 0.04 0.06 0.06 0.01 0.016. Transport & Trade 0.27 0.09 0.14 0.08 0.26 0.41 0.14 0.06 0.107. Govt Services 0.00 0.03 0.04 1.70 0.08 0.13 0.00 0.00 0.00Totals 0.92 0.32 0.50 2.03 0.91 1.43 3.73 0.45 0.71 A scenario for the recovery of a collapsed oil economy like Iraq, following the removal of external trade sanctions – the proximate cause of collapse – would therefore run as follows. With the lifting of UN sanctions, physical import controls would be removed. Oil production and exports would be revived as rapidly as possible, producing a dramatic increase in government revenues within 12-18 months of the removal of sanctions. The government might, pending the completion of urgent rehabilitation works, be able to receive short term external credit, as from forward sales of oil, to enable it to increase expenditure in advance of the revival of oil sector revenues. The majority of the higher level of real public expenditure thus made possible would be devoted to higher recurrent payments for the operation of public services. A smaller share would be devoted to starting to recover the backlog of maintenance and rehabilitation of public infrastructure and publicly owned productive assets. Well over half the increase in public expenditure would be devoted to paying the wages and salaries of existing or re-employed staff which would be raised from the sub-subsistence levels characteristic of the period of collapse to at least subsistence levels. The remainder would be used to procure goods and services – in rising proportion from the domestic market as local production revives. At the same time the private sector, encouraged by renewed access to imported supplies and the prospect of the rapid growth of effective demand in the domestic market, would invest in inventories and in rehabilitating its physical assets, and would hire labour. The availability of new credit facilities from domestic banks and foreign suppliers would accelerate these processes. Iraq is believed to have a labour force of some 6.5 million of whom 2-2.5 million are, or have until recently been, in paid public sector employment. Among the remainder outside the public sector there is believed to be extensive unemployment and under-employment. The analysis underlying Table 6 can be extended to calculate, on certain assumptions, the possible extent of employment creation associated with rising final demand in the recovery period. The results are shown in Table 8.13
13 Employment creation calculated from the following (late 1980s) rates of employment by sector and (assumed) elasticities of employment with respect to output:
Sectors: Agric. Oil Mining Industry Construction T&T Govt. Serv. Employment (mn) 0.9 0.2 0.1 1.0 0.3 2.0 2.0 Elasticticies 0.4 0.2 0.8 0.6 0.8 0.8 0.1

33
Table 8: Effect of 10% rise in government or investment expenditure or exports on sector output and GDP growth and on sector employment
Government Expenditure Investment ExportsGDP& Employment GDP& Employment GDP& Employment
Output '000 Output '000 Output '0001. Agriculture 4.78% 17.2 2.06% 7.4 2.26% 8.12. Oil 0.59% 0.2 0.45% 0.2 8.66% 3.53. Mining 3.61% 2.9 3.07% 2.5 3.82% 3.14. Industry* 3.35% 20.1 2.85% 17.1 2.69% 16.25. Construction 3.01% 7.2 6.17% 14.8 2.43% 5.86. Transport & Trade 3.31% 53.0 2.82% 45.1 4.64% 74.37. Govt Services 8.31% 16.6 0.20% 0.4 0.00% 0.0∆ GDP 3.46% 0.92% 4.43%∆ Non-oil GDP 5.29% 2.15% 1.68%GDP multiplier 1.08 0.69 0.15∆ Employment 117.3 87.4 110.9
* includes Petrochemicals In this table the 3.46% GDP growth produced by a 10% rise in government consumption is the same as the sum of direct, indirect and induced effects shown in Table 7 as arising from the same stimulus. The same applies to stimuli from investment and exports. In this table, however, the growth rates of sectoral value added are percentages of baseline value added shown in Table 6. Thus the combined direct, indirect and induced increase in agricultural value added produced by a 10% rise in government expenditure of 0.36 shown in Table 7 represents a 4.76% rise in baseline value added in agriculture of 7.5 given in Table 6. The assumptions underlying the calculation of employment creation are that higher final demand will not increase employment in the public service (where prior to April 2003 employment was maintained), but that there will be increases in employment in other sectors proportional to the growth in output. A 10% increase in government consumption could, on these assumptions, create 117 000 jobs in the rest of the economy, i.e. an approximately 3% increase in employment.
7.3 A recovery scenario
Input-output models are comparative static instruments for policy analysis which have little general value in economic forecasting. However, in circumstances of underemployment of productive resources and of supply-side elasticity they can be used to depict and quantify aspects of the recovery process. Using the representation of the Iraqi economy just outlined it is therefore possible to construct a partial scenario for economic recovery and employment creation in Iraq, based on the assumptions that oil production will soon return to, and perhaps exceed, former levels, and that the government will be able to use oil revenues to finance public expenditure. Further assumptions are that investment expenditure will also rise with the expenditure of external financing on reconstruction projects.14 On the basis of: • plausible increases in oil output (whose effects are mitigated by an expected decline in price)
14 A reconstruction needs assessment led by the World Bank completed in September 2003 concluded that Iraq required reconstruction financing amounting to $55 billion to be committed over a period of four years. Disbursements would occur over a much longer period. It is unlikely that commitments of external finance will approach the recommended sum within the indicated period. For the purposes of this paper, therefore, it is assumed that (incremental) disbursements of externally-financed investment expenditure will amount to $2.5 billion in 2004, $3 billion in 2005, and $3.5 billion in 2006.
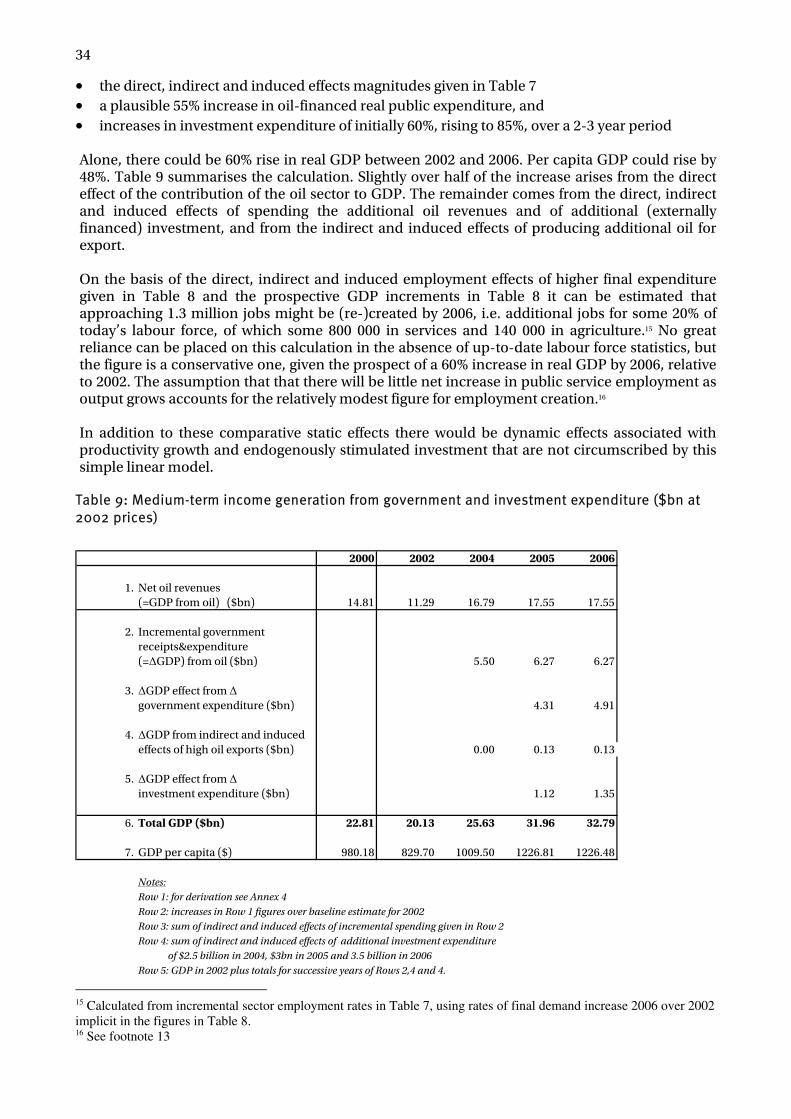
34
• the direct, indirect and induced effects magnitudes given in Table 7 • a plausible 55% increase in oil-financed real public expenditure, and • increases in investment expenditure of initially 60%, rising to 85%, over a 2-3 year period Alone, there could be 60% rise in real GDP between 2002 and 2006. Per capita GDP could rise by 48%. Table 9 summarises the calculation. Slightly over half of the increase arises from the direct effect of the contribution of the oil sector to GDP. The remainder comes from the direct, indirect and induced effects of spending the additional oil revenues and of additional (externally financed) investment, and from the indirect and induced effects of producing additional oil for export. On the basis of the direct, indirect and induced employment effects of higher final expenditure given in Table 8 and the prospective GDP increments in Table 8 it can be estimated that approaching 1.3 million jobs might be (re-)created by 2006, i.e. additional jobs for some 20% of today’s labour force, of which some 800 000 in services and 140 000 in agriculture.15 No great reliance can be placed on this calculation in the absence of up-to-date labour force statistics, but the figure is a conservative one, given the prospect of a 60% increase in real GDP by 2006, relative to 2002. The assumption that that there will be little net increase in public service employment as output grows accounts for the relatively modest figure for employment creation.16 In addition to these comparative static effects there would be dynamic effects associated with productivity growth and endogenously stimulated investment that are not circumscribed by this simple linear model.
Table 9: Medium-term income generation from government and investment expenditure ($bn at 2002 prices)
2000 2002 2004 2005 2006
1. Net oil revenues(=GDP from oil) ($bn) 14.81 11.29 16.79 17.55 17.55
2. Incremental governmentreceipts&expenditure (=∆GDP) from oil ($bn) 5.50 6.27 6.27
3. ∆GDP effect from ∆government expenditure ($bn) 4.31 4.91
4. ∆GDP from indirect and inducedeffects of high oil exports ($bn) 0.00 0.13 0.13
5. ∆GDP effect from ∆investment expenditure ($bn) 1.12 1.35
6. Total GDP ($bn) 22.81 20.13 25.63 31.96 32.79
7. GDP per capita ($) 980.18 829.70 1009.50 1226.81 1226.48
Notes:Row 1: for derivation see Annex 4Row 2: increases in Row 1 figures over baseline estimate for 2002Row 3: sum of indirect and induced effects of incremental spending given in Row 2Row 4: sum of indirect and induced effects of additional investment expenditure of $2.5 billion in 2004, $3bn in 2005 and 3.5 billion in 2006Row 5: GDP in 2002 plus totals for successive years of Rows 2,4 and 4.
15 Calculated from incremental sector employment rates in Table 7, using rates of final demand increase 2006 over 2002 implicit in the figures in Table 8. 16 See footnote 13
35
The calculations underlying Table 8 do not, because of the limitations of the model, take account of the beneficial effects of the re-monetisation of consumer transactions for the revival of the economy. With the ending of sanctions oil revenues flow through the Treasury, and public employees are beginning to be paid cash wages with a purchasing power which will eventually enable them to dispense with the administratively distributed rations in kind on which they have hitherto depended. Whereas the multiplier effect of the consumption of rations has been weak – because of administrative rigidities and because many rationed goods have been imported under the Oil-for-Food programme – the multiplier effect of the expenditure of cash wages on the incomes of the urban services, agriculture and light industrial sectors will be much stronger. Alas, this rather optimistic recovery scenario may be undermined in reality by two orders of supply side constraint that have, in the short run, prolonged, and exacerbated the resumed economic decline that set in after 2000 (see Table 8, row 6). The first of these factors is the looting, sabotage and lawlessness that have broken out after the 2003 war, and which have seriously reduced the production capacities of the oil, utilities and infrastructure sectors. Oil from the northern oilfield could not be exported until well into the first quarter of 2004. The second factor is the state of the oil wells now in production. Notwithstanding the relatively high levels of daily production achieved since 1999, which continued, on-and-off, into the beginning of 2003, the techniques used to maintain these rates of production are believed to have undermined their sustainability, leading to then likelihood of a period of reduced output. The rates of revenue increase on which Table 8 is predicated may therefore be exaggerated, and the GDP growth to which higher oil revenue gives rise may be deferred for a year or two.
36
Chapter 8: Conclusion
This paper has emphasised the importance of the demand-side of the process of recovery from economic collapse, notably on the roles of government consumption in stimulating and sustaining recovery. It is a commentary on, but not a refutation of, the received wisdom – summarised in the first part of the paper – on the characteristic features of economic decline and recovery in developing countries. The second part of the paper reviewed a small sample of recovery episodes in eight low-income countries whose prior economic collapse had differing characteristics. The evidence points to the common occurrence of rapid and sustained recover more or less ab initio after removal of the causes of collapse. Most of the eight countries grew sufficiently fast to raise per capita incomes from the start of their recovery periods, and sustained this performance over eight years. Cases are found of both initial low growth followed by acceleration, and of initial high growth followed by deceleration. Rapid recovery is associated with strong demand-side stimuli and underutilised capacity on the supply side, and with the rapid removal of supply-side bottlenecks. Recovery is retarded in cases where macroeconomic circumstances, such as a legacy of high inflation and debt, make it impossible to finance demand-side stimulus domestically, where export growth is insufficient, and where external financing is inadequate to overcome supply-side constraints. If there is no need for stern measures of macroeconomic adjustment, recovery tends to be more vigorous where there has been least disruption to production processes and to commercial relationships in distribution, or where these can rapidly be re-established and rehabilitated. Cet. par, it is less likely to be strong case where collapse has been accompanied by wide-scale economic disruption, institutional failure, insecurity and a loss of social capital, as well as the physical deterioration of productive and infrastructural assets. Some countries with vigorous informal sectors revive strongly, even after such experiences. The experiences of the eight countries warns against generalising the empirical conclusions reached from the study of panel data on post-conflict countries which stress the likelihood that initial stage recovery will be slow. There is no inevitability about the delayed action recovery pattern identified by Collier and Hoeffler. The third part of the paper argued that there can be value in using a simple input-output model – which need not be statistically valid – as a framework for analysing the pathways of the impact of demand-side stimuli during the recovery phase. This can show, where there is latent or actual supply elasticity, through what channels higher levels of final demand, particularly in the form of public expenditure, can accelerate recovery. Government consumption has an especially strong effect in urban economies where there are many service trades and light industries which satisfy the consumption demands of public employees and of contractors’ staff. This effect will be weaker where public expenditure is smaller, and when public employees spend incremental incomes on imports (rather than domestically produced food and consumer goods), or on capital flight. It was found that a simplified input-output model of a typical predominantly rural economy, using pro forma coefficients, was able to simulate with reasonable accuracy actual years 1-4 GDP growth in five out of six countries of this type on the basis of the recorded levels of autonomous expenditure stimulus to which they were subject. The model performed poorly, however, in simulating actual growth in the later years of mature recovery. There are of course good structural and macroeconomic reasons for not over-expanding programmes of public expenditure during recovery, especially in countries where it is important to encourage resources to flow into the revived production of tradable good and exports. In an

37
economy with ample reserves of mineral wealth, and which has no need to envisage early economic diversification, like Iraq, the longer term dangers posed by a large public sector are less. However, in the light of evidence of falling inflation and monetary deepening during recovery, it is arguable that benign structural and behavioural change should be factored into recovery phase adjustment programmes. Input-output analysis is a tool for exploring the sector-by-sector impact of higher levels of final demand. Its predictive value is in general limited, but, in economies in recovery, it helps to identify the opportunities that expenditure programmes can usefully exploit during the income-elastic phase of the recovery process, and to identify the sectoral distribution of the higher incomes thus generated. Where supply-side bottlenecks persist, it can help to identify those which are most likely to prevent higher expenditures from engendering higher incomes. The paper’s essential message, therefore, is that conventional the supply-side-focused approach to strategies for economic recovery should be complemented by explicit – formal or informal – consideration of the demand-side, and of the potential for accelerating early recovery phase growth of practicable autonomous demand stimuli. The paper ends with a closer look at what light input-output analysis might throw on the post-sanctions recovery of the Iraqi economy – abstracting from the prejudice that political instability, insecurity, sabotage and looting seem likely to cause. It shows that, based on the presumed structure of the economy, the comparative static effects of rising oil production and of prospective government and investment expenditure increases alone could raise GDP by 60% well within the medium-term, lifting Iraq out of the ranks of the low-income countries, back into the lower-middle income bracket. These conclusions are not intended to deny the importance of the conventional economic reconstruction agenda, and of conventional donor assistance priorities. In many instances, after warfare, political turmoil, institutional and infrastructural breakdown, and periods of physical insecurity, sustained recovery is well nigh impossible without the restoration of order, security, public services and transport and communications links. These, with structural reforms to encourage the market economy, to revive exports-oriented activity and to remove supply-side bottlenecks are often essential. In economies which collapse without conflict recovery generally dates from the advent of governments with credible commitments to sound economic management. However, it is as well to remember that there is capacity in many countries – including poor countries – to achieve spontaneous recovery once a measure of confidence in security and stability is restored. In cases where economic collapse has created unemployment or serious real income loss among public employees and other urban workers, and where demand for domestically produced food and other wage goods and services has fallen, a revival of government consumption expenditure can be highly efficacious in accelerating the natural processes of recovery. The implication for aid donors is that, if there are governmental structures through which aid can be disbursed, aid volumes should not be stinted in the early stages of recovery.

38
Bibliography
Addison T., (2003) Africa’s Recovery from Conflict: making peace work for the poor, UNU/WIDER. Collier P., (1999) On the economic consequences of civil war, Oxford Economic Papers, vol. 51. Collier P. & Hoeffler A., (2002) Aid, Policy and Growth in Post-Conflict Societies, World Bank Policy Research Working Paper No. 2902. Collier P., Elliott L, Hegre H., Hoeffler A., Reynal-Querol M., Sambanis N.,(2002) Breaking the Conflict Trap: civil war and development policy, World Bank Policy Research Report. Economist Intelligence Unit (2003) Country Profile: Iraq 2002/2003, 25 July 2002 Library of Congress (US) (1988) Country Studies: Iraq, May 1988 Michailof S., Kostner M., Devictor X., (2002) Post conflict recovery in Africa: an agenda for the Africa Region, World Bank Africa Region Working Paper No. 30 Tripp C., (2000) A History of Iraq, Cambridge World Bank (1998) Post-Conflict Reconstruction: the role of the World Bank
Statistical sources
IMF: International Finance Statistics OPEC: Annual Statistical Report World Bank: World Development Indicators
39
Annex 1: Collapse and recovery – country profiles
Cameroon. Cameroon’s economy grew rapidly at a rate of 7% p.a. between 1960 and 1985 thanks to the combined effects of strong growth in the agricultural sector and on rising petroleum exports. Oil production began to decline in the mid 1980s with the depletion of reserves. At the same time the economy was adversely affected by falling international prices both for oil and for exports of coffee and cocoa. Oil exports fell in value by one-third between 1985 and 1994. Real GDP fell by 25% over this period, and per capita GDP by 40%. Producer prices for smallholder producers of cash crops fell in real terms, as did the government’s expenditure on social sector programmes. Poorly implemented reforms undertaken in 1988 failed to arrest economic decline which only came to a halt after the 50% nominal devaluation of the CFA Franc in 1994. After this the government embarked on a more thoroughgoing programme of structural adjustment and institutional reform. The reforms were initially fumbled, and public expenditure was restrained as the government strove to achieve the primary fiscal surplus it needed to cope systematically with its excessive debt burden and mounting arrears. By 1997 the fiscal crisis was surmounted sufficiently for the government to reach agreement with the IMF on an ESAF programme, and to receive financial support from the donor community. The pace of recovery has been modest, but steady, with GDP growth since 1994 averaging 4.5% p.a., i.e. 1.6% p.a. per capita. The stimulus for this in the mid 1990s was the growth of agricultural exports under the dual incentive of the devaluation and some rise in world prices for Cameroon’s main export commodities. From 1997 onward when the pace of export expansion started to flag, government consumption and investment expenditure began to expand, lending continuing stimulus to the growth of output. Real per capita GDP remains one-third below the level it reached in the early 1980s. Cambodia. The course of Cambodia’s economic collapse due to wholesale disruption and population displacement under the Khmer Rouge regime is not recorded in published statistics. Data is available for the years of recovery from 1987 onward, when security and freedom of movement was restored in much, but not all, of the country, but when there remained many institutional and practical restraints on enterprise and activity, including the presence of landmines in agricultural areas and pervasive state controls. Recovery of real GDP was erratic in the later 1980s, and only accelerated to a more regular and sustained 5.5% p.a. after 1990. The 1990s also saw a return to more stable macroeconomic conditions, assisted by large aid inflows, and to a realistic exchange rate. Growth in these years** was demand-led, but was sectorally and spatially unbalanced. Government and aid agency expenditure increases were the main stimuli, but their effects were initially centred on Phnom Penh and the construction industry. From circa 1995, however, government expenditure growth was curtailed for macroeconomic management reasons, to be replaced as a stimulus on the demand-side by export growth. Ethiopia. Ethiopia experienced a protracted per capita income decline lasting throughout the 1970s and 1980s caused by the effects on its development and on productive incentives of continuous warfare in the country’s northern provinces, and by the Derg Government’s industrial and agrarian policies. The per capita income decline was arrested in the early 1990s, after the fall in the Derg, when the successor government implemented structural reforms to restore incentives, encourage investment and catch up with the backlog in social sector provision. The slow process of recovery was interrupted in 1997 by renewed conflict on the border with Eritrea, and by recurrent drought. During the period of the Derg the productive resources and fiscal capacity of the country were stretched to the limit. Post-war, there was no scope for fiscal stimulus to production. Farm households’ agricultural holdings under the regime of Peasant Associations had been excessively subdivided because of a shortage of cultivable land in the rain-fed highlands. The demobilisation of soldiers at the end of hostilities, and their return to their villages, did not therefore create the same opportunity to raise agricultural output as has been the case in countries
40
where there is untilled land available for cultivation. Inward investment in mining and manufacturing has been below expectation, inter alia because of doubts about the legal and regulatory environment. Though the government enjoyed a rise in receipts of external assistance it had at the same time to reduce the previously oppressive rates of tax, leading to a fall in its overall receipts, and in real public expenditure. Mozambique. Civil war caused Mozambique’s GDP to fall be 30% between 1981 and 1986. Internal communications were seriously interrupted, and there were 3-4 million internally displaced persons. In conflict-affected areas in the centre and north of the country much formal sector activity ceased, and the transport and marketing of informal sector produce was limited to narrow geographical confines. In 1987, the government began reforms to loosen state controls, widen the scope of the market economy through selective privatisation and the liberalisation of prices and marketing. The recovery process dates from this time. However, the government had also to deal with balance of payments and debt crises, and to stabilise public finances, which called for a period of restraint in public expenditure. After the conclusion of a peace settlement in 1991 donors’ assistance increased, permitting more rapid growth in public consumption and investment expenditure for resettlement, the restoration of public service facilities and infrastructure. The course of GDP growth during recovery has been accelerating, apart from a brief reversal in the early 1990s. The average rate of growth in 1987-1995 was 5.3%, and in 1996-99 it was 9.3%. Growth has been consistently high in agriculture, bearing* witness to the capacity of smallholders to weather the disruption of periods of conflict, and to the high elasticity of their supply response to the restoration of security and transport links to markets. Large scale commercial agricultural has yet to return to its pre-war level of activity. The recovery of the formerly fairly large manufacturing sector only started seriously after 1995, and the post-war share of manufacturing in GDP remains much reduced. Peace, however, opened earlier opportunities for service exports to revive strongly, following infrastructure rehabilitation, with the development of the transit corridor to South Africa, and the resumption of power exports. Nicaragua. Nicaragua experienced a decline in per capita GDP lasting from the mid 1970s until the mid 1990s to which political instability, mismanaged state economic controls and nationalisation, inflationary financing, ten years of insurrection, a US trade embargo and, at times, declining terms of trade all contributed. After elections in 1990 a new government took power with a mandate to change the course of economic policy and to pursue market reforms. Early tasks facing the new government were to stabilise the economy, taming the triple digit inflation and settling the arrears of external payments. Public expenditure was curtailed. There were major size reductions in the armed forced and the civil service. Inflows of bilateral aid, promised in abundance in 1990, were interrupted in 1993 on account of concerns about governance, prolonging the period of fiscal austerity. The negative effects of these policies on household incomes were compounded in 1993 by adverse climatic conditions and falling export prices. Economic recovery only began in 1994, led by strong and sustained export growth and rapidly rising levels of investment expenditure – though public expenditure was kept down at its reduced level. By this time inflation had been reduced to single figures, and business confidence was reviving. Rwanda. Rwanda’s preponderantly agricultural economy achieved sustained per capita growth and poverty reduction in the 1970s with the help of substantial aid inflows and prudent macroeconomic and fiscal management. Agriculture was able to expand thanks to productivity increases and some extension of cultivated areas. Economic growth slowed in the 1980s, leading first to stagnation and then a decline in per capita income. Among the factors causing performance to deteriorate were overcrowding and holding size fragmentation in rural areas, falling standards of macroeconomic management, exchange rate overvaluation, declining terms of trade and, with the outbreak of civil conflict in 1990, rising military expenditure. Government controls on labour mobility were inimical to economic adaptation to changes in the external
41
environment. The 40% devaluation in 1990 brought little economic benefit in circumstances of mounting political instability. The genocide of 1994 caused GDP to drop by 50%. However, in spite of major loss of life and population displacement, recovery in the three years 1995 – 1997 was very rapid, averaging 20% p.a. Since then growth has averaged a high 7.5% p.a. The agricultural sector has been the main source of rising GDP, although its export earnings have been adversely affected by low international coffee prices since 1997. In the first phase of recovery the expenditure of international relief by agencies and the government gave a strong impetus to the urban commercial services sector and to the construction and allied sectors. As military expenditure fell government consumption expenditure on social services rose. The effect of rapidly rising government expenditure was to stimulate agriculture by increasing domestic demand for food products, thus raising rural incomes. Uganda. Uganda’s economic decline started with the coup which brought Idi Amin to power in 1972, and continued through years of economic mismanagement, the expulsion of Asians and civil war, until the assumption of power by President Museveni in 1986. Per capita GDP declined by 40% in this period, with the urban, formal and export-oriented sectors most affected. The new government inherited an unsustainable fiscal situation and three-digit inflation. Macroeconomic stabilisation was accomplished, with significant external assistance, in the period 1987-92, accompanied by an exchange rate which was first depreciated and then floated (1993), and by measures of trade, price, marketing and investment policy, and of privatisation, which relaxed state controls and encouraged competition and private sector activity. These reforms were complemented reforms in the public services, including tax administration. Careful macroeconomic management with continuing high levels of external support enabled the country to weather the extreme coffee price fluctuations of the early 1990s and the collapse in world coffee prices in the late 1990s. Growth was stimulated in the first stage of recovery (1986-89) by heavy, donor-financed, expenditure to rehabilitate roads and other deteriorated infrastructure, though recurrent government expenditure was restrained. In the second phase (1990-93) government consumption expenditure grew more rapidly, to the immediate benefit of the urban economy, but with powerful spread effects in the agricultural sector whose continuing growth underpinned the sustained buoyancy of the economy as a whole. Exports only expanded slowly, so the equilibrium of the economy depended in large receipts of external assistance. In the later 1990s there was a growth in private investment as confidence in the liberalised business environment strengthened. This made possible some diversification of exports away from heavy dependence on coffee. Zambia. Zambia’s economy had been in decline for over 15 years when the government that took power in 1990 resolved to cooperate with the IFIs and international donors to tackle the processes of structural adjustment, institutional reform and debt restructuring required as foundations for future economic revival. The fundamental cause of decline had been the preponderant role of copper as the mainstay of Zambia’s economy, the fall in real copper prices since the early 1970s, and the progressive exhaustion of the mines. These problems were compounded by a very heavy burden of external debt contracted in the belief that Zambia was a wealthier country than it turned out to be, and by policies that discouraged investment in copper production and in diversifying sources of export earnings. Reforms had been too little and too late to arrest the decline in per capita GDP which, from its peak in 1974, had fallen by nearly 45% by 1990. Economic recovery has been slow – and insufficient to raise per capita incomes – because it has taken time for the improved policy environment to achieve credibility among investors, because of continued stagnation of earnings in the copper sector, and because, in an already highly taxed economy, there has been no capacity for fiscal stimulus. Government consumption fell 1990-94. The recovery process was also for a time set back by poor relations with donors and suspicions of government corruption.
42
Iraq rise and fall of an oil economy. Present day Iraq was formed in the aftermath of the First World War from three provinces of the former Ottoman empire – Mosul, Baghdad and Basra. Its economy was predominantly agricultural, with wheat and dates as its main exports. In 1931 the Iraq Petroleum Company started to produce oil on a significant scale from the northern oilfield around Kirkuk, discovered in 1927, over which it had acquired an exclusive concession. The government, until them impecunious and prone to financial crises, thereafter enjoyed growing revenues from royalties amounting already in 1931-32 to 20% of total revenue (Tripp, 2000). In 1950 the government of prime minister Nuri Said negotiated a greatly improved formula with the oil company for mobilising oil revenue, based on the one concluded by Saudi Arabia with Aramco. Henceforth the state could receive a 12.5% share of oil production, and a 50% share of oil company profits. Oil revenues shot from 30% of government receipts in 1951 to 65% in 1954 (Tripp, 2000, Chapter 5). Public expenditures rose, with a heavy emphasis on infrastructure development. After the 1958 coup d’état which overthrew the Hashemite monarchy the IPC continued to produce from its Kirkuk oilfield, exporting via a pipeline through Syria, though it lost its unexploited concessions in the south of country. The government set up the publicly owned Iraq National Oil Company in 1964 which began to exploit the southern oilfield of Northern Rumaila near Basra. The IPC was nationalised in 1972, following a disagreement on price with the government at the start of the early 1970s ‘oil crisis’. The oil crisis brought an eight-fold increase in current price oil revenues between 1972 and 1975, which financed a very large increase in public expenditure, especially capital expenditure. In current price terms gross fixed capital formation – which was substantially in the public sector – decupled between 1972 and 1980. The structure of the economy created in the oil boom years of the 1970s persisted largely unchanged until the major economic decline of the 1990s caused by severe economic sanctions. Value added in the oil sector contributed between 33% and 67% of GDP (in current prices), depending on output levels and, more especially, international prices. Of non-oil GDP the share of agriculture was reduced to below 15%, while mining and manufacturing contributed 10%, construction nearly 20%, transport, communications and public utilities approaching 10%, and the remaining split between public administration and other government services (20%) and commercial, financial and other business services (35%). The effects of oil and the expenditure of oil revenues on Iraq in the 1950-80 period were to transform the basis of livelihood of the population. In 1950 the population remained essentially rural. By 1965 51% lived in urban areas. There was rapid urbanisation in the 1970s and 1980s, such that by 1988 73% of the population lived in towns. By 2000 this had risen to 77%. As late as the mid-1970s agriculture was the principle employment of over half the labour force, even though its contribution to GDP had fallen below 10%. By the 1990s, however, and in spite of land reforms implemented by the Ba’ath régime, the labour force in agriculture had fallen to 14% of the total, and was exceeded in size by the industrial labour force (19%). By 1990 the vast bulk of the labour force was employed in urban-based service sectors, thanks to rapid growth of employment in the public services, including the armed forces, and a corresponding growth of employment in commercial, financial and personal services demanded by the urban population. Of a labour force estimated in 2000 at 6.5 million at least 2 million were employed in (mostly central) government service. A majority of workers in industry were the employees of the largely nationalised manufacturing, mining, construction and public utility sectors. As might be expected in an oil-based economy, Iraq’s GDP has been highly responsive to the output and price of oil. When oil prices rise real GDP also increases because of the second round and induced effects of the expenditure of oil revenues on the domestic economy. Thus, the two oil price shocks of the 1970s – 1972-74 and 1978-80 – engendered particularly rapid economic growth

43
which had the effect of raising per capita GDP (in 2000 US$) from around $1500 to a peak of $2750 in 1979 (see Figure 5). The fruits of growth were inevitably unequally distributed, but payments of government subsidies to the agricultural sector, public procurement of goods and services from urban-based sectors and the expansion of public health, education and infrastructural services helped to extend the benefits well into the population at large. Real wages rose as labour markets tightened. Iraq became a substantial importer of labour from other Arab countries for farm work, particularly in the 1980s.

44
Annex 2: Estimation of Iraq’s GDP in the 1980s and 1990s
World Development Indicators (WDI), the source used for data on Iraq’s GDP in the 1970s, is unreliable for the 1980s, and provides no information for the years after 1993. WDI indicates a serious decline in Iraq’s real GDP in the mid-1980s in the years when oil production and oil exports were reviving strongly from the physical damage suffered to oil loading facilities in the initial phases of the Iran-Iraq war. Oil production increased by 150% and exports nearly trebled between 1983 and 1988. Given the large contribution of the oil sector to GDP in Iraq (38% in 1986) a fall in total GDP is inconsistent with so strong an increase in oil sector activity, particularly in view of the continuing large contribution of government services to total GDP during this period. WDI also shows a rapid increase in the 1980s of the GDP deflator. This is inconsistent, given the high share of oil in GDP, with the fall by over 50% during these years of the price of Iraq’s oil exports in US$, and with the fixed rate of exchange of the Iraqi dinar for the dollar. The deflator of oil sector value added was falling steeply, as sector value added in nominal terms was rising much more slowly than it was in constant prices. For the years after 1980, therefore, this paper substitutes for WDI‘s figures on GDP an artificial series constructed from indices of oil production, agricultural production and (estimates of) import volumes. The weights used in constructing this series are oil: 37.5%, agriculture 7.5% and other sectors – for which import volumes are used as a proxy activity level indicator – 55%. The sources used are OPEC’s monthly bulletin of statistics (for oil), FAO data on cereal production (as a proxy for agricultural production) and International Financial Statistics and EIU for imports of goods and services in current prices and for proxy import unit value indices.
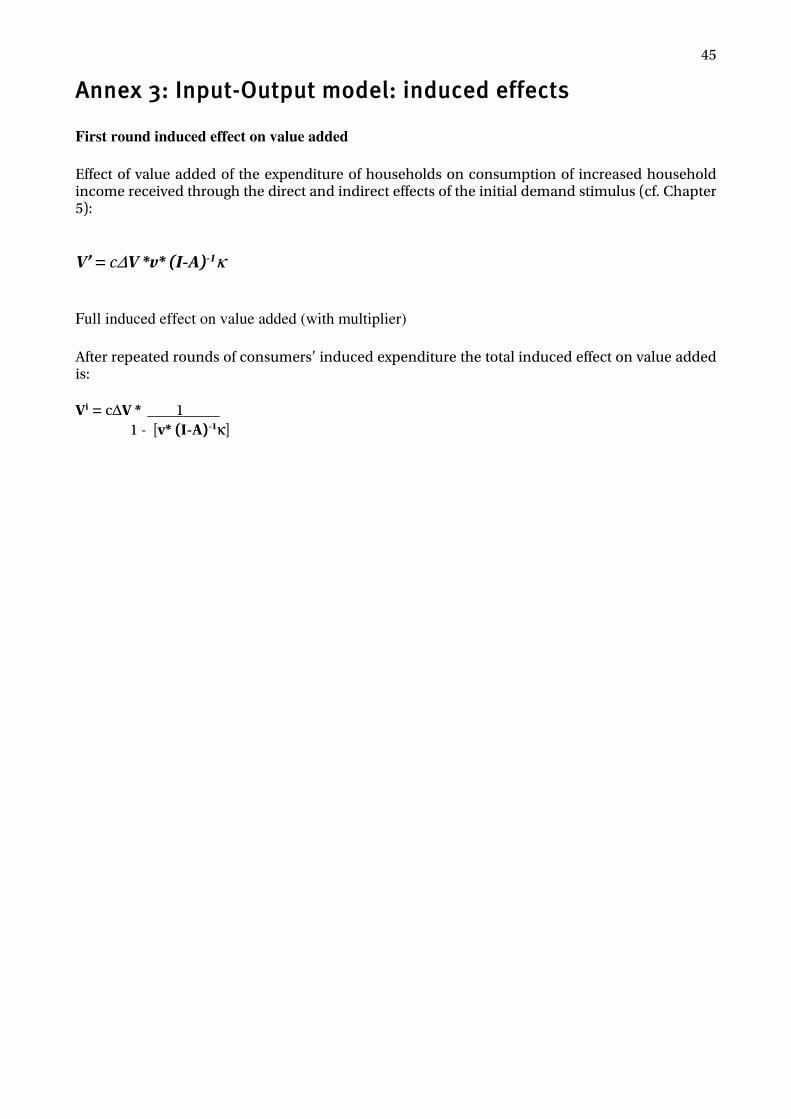
45
Annex 3: Input-Output model: induced effects
First round induced effect on value added Effect of value added of the expenditure of households on consumption of increased household income received through the direct and indirect effects of the initial demand stimulus (cf. Chapter 5):
V’ = c∆V *v* (I-A)-1κ
Full induced effect on value added (with multiplier) After repeated rounds of consumers’ induced expenditure the total induced effect on value added is: Vi = c∆V * ____1_____ 1 - [v* (I-A)-1κ]
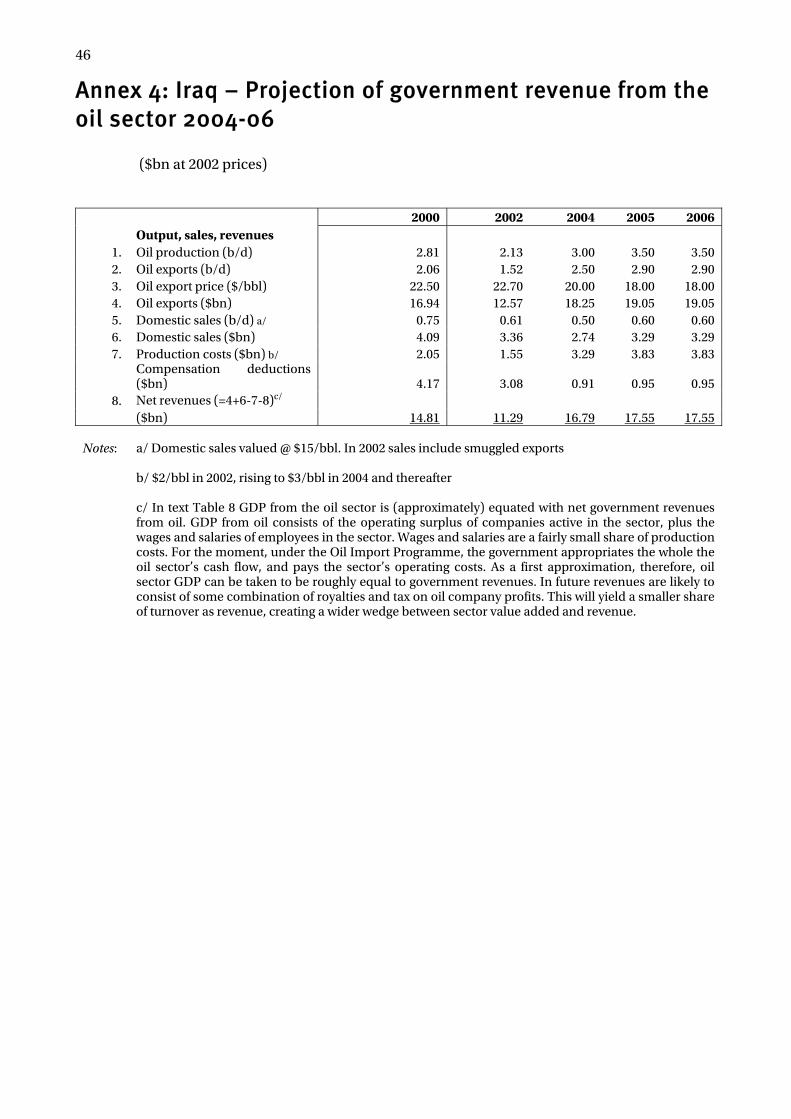
46
Annex 4: Iraq – Projection of government revenue from the oil sector 2004-06
($bn at 2002 prices) 2000 2002 2004 2005 2006 Output, sales, revenues
1. Oil production (b/d) 2.81 2.13 3.00 3.50 3.50 2. Oil exports (b/d) 2.06 1.52 2.50 2.90 2.90 3. Oil export price ($/bbl) 22.50 22.70 20.00 18.00 18.00 4. Oil exports ($bn) 16.94 12.57 18.25 19.05 19.05 5. Domestic sales (b/d) a/ 0.75 0.61 0.50 0.60 0.60 6. Domestic sales ($bn) 4.09 3.36 2.74 3.29 3.29 7. Production costs ($bn) b/ 2.05 1.55 3.29 3.83 3.83
Compensation deductions ($bn) 4.17 3.08 0.91 0.95 0.95
8. Net revenues (=4+6-7-8)c/ ($bn) 14.81 11.29 16.79 17.55 17.55
Notes: a/ Domestic sales valued @ $15/bbl. In 2002 sales include smuggled exports
b/ $2/bbl in 2002, rising to $3/bbl in 2004 and thereafter c/ In text Table 8 GDP from the oil sector is (approximately) equated with net government revenues from oil. GDP from oil consists of the operating surplus of companies active in the sector, plus the wages and salaries of employees in the sector. Wages and salaries are a fairly small share of production costs. For the moment, under the Oil Import Programme, the government appropriates the whole the oil sector’s cash flow, and pays the sector’s operating costs. As a first approximation, therefore, oil sector GDP can be taken to be roughly equal to government revenues. In future revenues are likely to consist of some combination of royalties and tax on oil company profits. This will yield a smaller share of turnover as revenue, creating a wider wedge between sector value added and revenue.