recovery 5.0: a contaminated sediment-water interaction …
TRANSCRIPT

US Army Corps of EngineersBUILDING STRONG®
Carlos E. Ruiz and Terry K. GeraldEnvironmental Laboratory
U.S. Army Engineer Research and Development Center
RECOVERY 5.0: A Contaminated Sediment-Water Interaction Model
Tenth International Conference on Remediation and Management of Contaminated Sediments, New Orleans, Louisiana, February 2019

Innovative solutions for a safer, better worldBUILDING STRONG®
Purpose
Evaluate long-term contaminated sediment -water column interactions► Evaluate no action alternative► Evaluate monitored natural recovery► Evaluate capping► Evaluate reactive capping► Evaluate environmental dredging► Evaluate residuals management

Innovative solutions for a safer, better worldBUILDING STRONG®
Limitations
Steady conditions► Constant residence time/flow rate► Constant suspended solids concentration/TOC► Constant burial rate► Constant bioturbation► Constant decay rates
Uses long-term averages No catastrophic events
► Storm-induced erosion► Flood-induced deposition

Innovative solutions for a safer, better worldBUILDING STRONG®
Description PC based, user friendly Fully mixed water body
and layered bottom sediments
Time-variable Organic contaminants
database Computes sediment and
water contaminant concentrations and fluxes vs. time

Innovative solutions for a safer, better worldBUILDING STRONG®
Schematic of RECOVERY 5.0 Processes

Innovative solutions for a safer, better worldBUILDING STRONG®
Verification/Validation
Compared with analytical solutions Compared with laboratory data Compared with contaminant
transport data from a flooded quarry pit (5 years)
Compared with long-term cap performance data for contaminant isolation (11 years)

Innovative solutions for a safer, better worldBUILDING STRONG®
Model Improvements
Model formulations► Biodiffusion/bioturbation► User-defined partitioning
• Reversible adsorbed metals • Site specific• DOC facilitated
► Mass transfer across discontinuous sediment layers/interfaces
► Thin layers (reactive amendments and geotextiles)
► Groundwater/advective flow (up to 5cm/day)

Innovative solutions for a safer, better worldBUILDING STRONG®
RECOVERY 5.0 GUI

Innovative solutions for a safer, better worldBUILDING STRONG®
RECOVERY 5.0
Innovative solutions for a safer, better worldBUILDING STRONG®
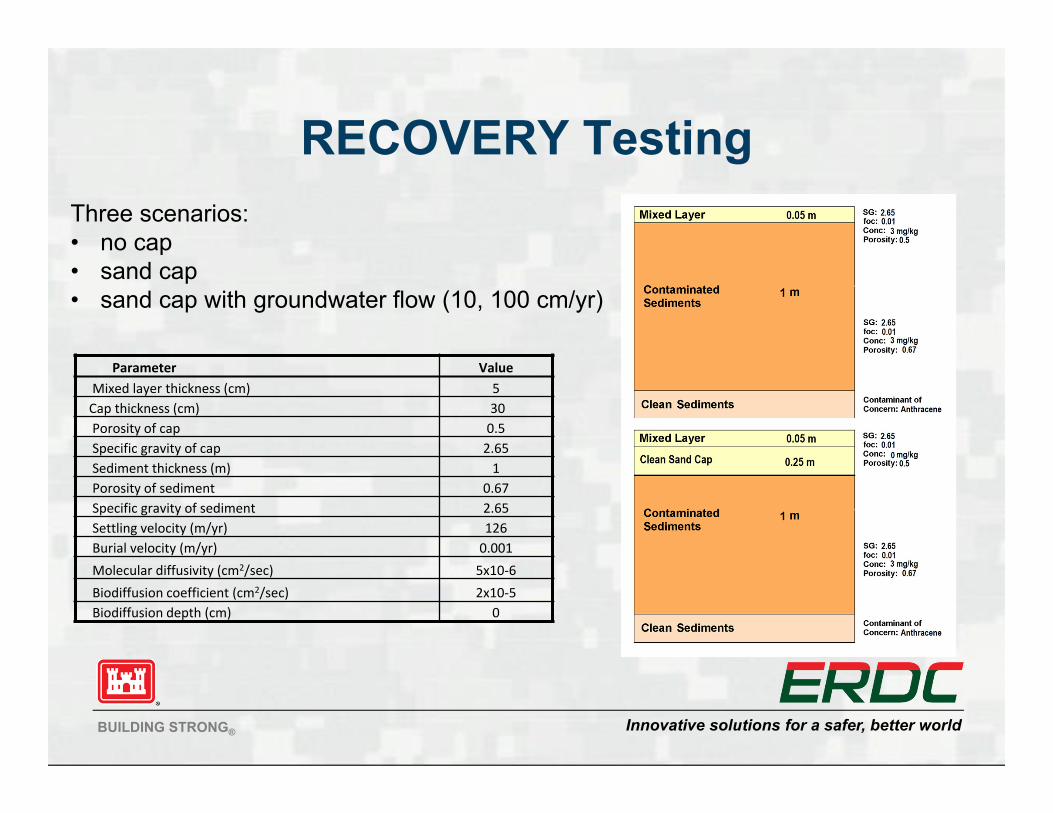
RECOVERY Testing
Parameter ValueMixed layer thickness (cm) 5Cap thickness (cm) 30Porosity of cap 0.5Specific gravity of cap 2.65Sediment thickness (m) 1Porosity of sediment 0.67Specific gravity of sediment 2.65Settling velocity (m/yr) 126Burial velocity (m/yr) 0.001Molecular diffusivity (cm2/sec) 5x10‐6Biodiffusion coefficient (cm2/sec) 2x10‐5Biodiffusion depth (cm) 0
Three scenarios:• no cap• sand cap• sand cap with groundwater flow (10, 100 cm/yr)

Innovative solutions for a safer, better worldBUILDING STRONG®
Testing Results0
20406080
1001201400.00E+00 5.00E+02 1.00E+03
Depth (cm)
Pore water concentration (ug/l)
Anthracene
0 Years
50 Years
100 Years
200 Years
0
20
40
60
80
100
120
1400.00E+00 5.00E+02 1.00E+03
Depth (cm)
Pore water concentration (ug/l)
Anthracene
0 Years
50 Years
100 Years
200 Years
100 cm/yr
10 cm/yr

Innovative solutions for a safer, better worldBUILDING STRONG®
St Louis River Great Lakes Area of Concern (AOC)
Development along the St Louis River (SLR) has contributed to contaminated sediments
► Paper mills► Coal gasification plants► Steel processing
Active in shipping► Iron ore► Coal► Limestone► Grain
Three impairments to the St. Louis River AOC: fish consumption advisory, degradation of the benthos environment and restrictions on dredging.
RECOVERY Application

Innovative solutions for a safer, better worldBUILDING STRONG®
RECOVERY ApplicationCompound
Maximum Concentration
Detected
Level 1 SQT
Midpoint SQT (Cleanup Level)
Level 2 SQT
UnitsMaximum Hazard Quotient
Total PAHs 131,860 1600 12,300 23,000 ug/kg 10.7Acenaphthene 2,600 6.7 47.85 89 ug/kg 54.34
PCBs 1000 60 370 680 ug/kg 3.08Cadmium 5.4 0.99 2.995 5 mg/kg 1.80Chromium 51.7 43 76.5 110 mg/kg 0.68Copper 250 32 91 150 mg/kg 2.74Lead 544 36 83 130 mg/kg 6.5Mercury 3.3 0.18 0.64 1.1 mg/kg 5
Evaluate the Cap performance using a long‐term contaminant transport model
Model evaluation to compare the surficial contaminant concentration of Slips (represented by the mixed layer or bioactive zone) throughout the 100‐year design life with the SQT Level 1 criteria.

Innovative solutions for a safer, better worldBUILDING STRONG®
Slip C CapParameter Value
Mixed layer thickness (cm) 10Mixed layer porosity 0.75Cap thickness (cm) ‐‐ Upper and Lower Cap 15 and 30Porosity of cap ‐‐ Upper and Lower
Cap0.55 and 0.50
Specific gravity of cap ‐‐ Upper and Lower Cap
2.48 and 2.51
Sediment thickness (m) 4.02 and
3.99
Porosity of sediment 0.55 and 0.65
Specific gravity of sediment 2.42 ‐2.59
Settling velocity (m/yr) 136Burial velocity (m/yr) 0.001Molecular diffusivity (cm2/sec) 5 x 10‐6
Biodiffusion coefficient (cm2/sec) 2 x 10‐5
Biodiffusion depth (cm) 0

Innovative solutions for a safer, better worldBUILDING STRONG®
Slip C Results
w/groundwater upwelling of 0.5 cm/day.w/groundwater upwelling of 0.5 cm/day.
w/groundwater upwelling of 0.5 cm/day.

Innovative solutions for a safer, better worldBUILDING STRONG®
Questions?
CAP IT CAP IT