recovering from repeat sprint activity and elite ...vuir.vu.edu.au/22287/1/emma louise...
TRANSCRIPT

Recovering from repeat sprint activity and elite Australian
football training and competition: Do compression garments
help?
by
Miss Emma Louise Gallaher
This thesis is submitted in partial fulfilment of the requirements for the award of
Doctor of Philosophy
Supervisor: Dr Robert J.A. Aughey
Co-supervisor: Professor Rod Snow
Faculty of Arts, Education and Human Development
School of Sport & Exercise Science
Victoria University
2012
1

ABSTRACT
Introduction: Elite athletes constantly search for the edge over their opponent
(Applegate and Grivetti 1997). Indeed, athlete training and competition schedules have
resulted in a need to fully recover rapidly from such sessions (Dawson, Gow et al. 2005;
Cormack, Newton et al. 2008a; Cormack, Newton et al. 2008b; Elias, Varley et al.
2012; Elias, Wyckelsma et al. 2012; Mooney, Cormack et al. 2012). To overcome the
stressors from training and competition, sports compression garments which offer low
levels of compression, are commonly used to enhance recovery due to their ease of use,
accessibility and affordability. Although a substantial body of research exists
investigating compression garment use after a variety of exercise stimuli (Kraemer,
Bush et al. 1998a; Kraemer, Bush et al. 1998b; Kraemer, Volek et al. 2000; Kraemer,
Bush et al. 2001a; Kraemer, Bush et al. 2001b; Chatard, Atlaoui et al. 2004; Kraemer,
French et al. 2004; Duffield and Portus 2007; Duffield, Edge et al. 2008; French,
Thompson et al. 2008; Montgomery, Pyne et al. 2008a; Montgomery, Pyne et al. 2008b;
Davies, Thompson et al. 2009; Duffield, Cannon et al. 2010; Jakeman, Byrne et al.
2010b; Jakeman, Byrne et al. 2010a; Kraemer, Flanagan et al. 2010; De Glanville and
Hamlin 2012), their influence on perceptual, biochemical and performance recovery
after actual team sport training and competition, where physical contact is a key
component, is lacking. Further, the positive physiological actions of compression
garments have mostly been established using a medical style garment, which typically
exert a greater volume of compression, in clinical settings. Recent research has sought
to determine performance, perceptual and physiological differences when wearing
compression garments during exercise that offer varying levels of compression, where
the level of compression (low, medium, or high) made no difference to performance or
physiological measures (Ali, Creasy et al. 2011; Dascombe, Hoare et al. 2011). It
remains unknown if differences in recovery, where the garment is worn exclusively post
exercise, would occur between a sports (low level of compression) and medical (high
level of compression) style garment in team sport scenarios. Thus this thesis
investigated the influence of wearing compression garments on perceptual, biochemical
and performance variables following repeat sprint exercise on consecutive days in
recreationally trained individuals (Chapter 4); following elite Australian football (AF)
2

training (Chapter 5) and competition (Chapter 6). It also included a comparison between
a sports (Spo) and medical (Med) style compression garment. A magnitude based
effects approach, using effect sizes and the smallest worthwhile change was used to
analyse treatment effects.
Main findings and practical recommendations:
• Compression garments exert positive recovery effects on perceived muscle soreness,
fatigue and performance of the countermovement jump.
• There is a high recovery demand after AF training and competition.
• Perceptual measures of muscle soreness and fatigue should not be used as
standalone indicators of readiness to train/compete.
• Medical compression garments do not offer any additional benefits to recovery
compared to sports compression, despite the greater level of pressure exerted on the
body.
• Positive recovery effects are inconsistent within and between exercise modalities.
3

STUDENT DECLARATION
“I, Emma Louise Gallaher, declare that the PhD thesis entitled ‘Recovering from repeat
sprint activity and elite Australian football training and competition: Do compression
garments help’ is no more than 100,000 words in length including quotes and exclusive
of tables, figures, appendices, bibliography, references and footnotes. This thesis
contains no material that has been submitted previously, in whole or in part, for the
award of any other academic degree or diploma. Except where otherwise indicated, this
thesis is my own work. The studies contained in Chapter 4 and 5 were part of larger
studies. Specifically, in Chapter 4, an additional treatment group was included to
investigate anti-oxidant supplementation. In Chapter 5, accelerometer and player load
data was collected for the small sided games component of the training sessions.”
Signature Date
4

ACKNOWLEDGEMENTS
Firstly, to my supervisor, Dr Rob Aughey, thank you. Thank you for accepting the
challenge to step in and take over the role as my principle supervisor. Working with you
has allowed me to work within the elite sporting industry, not only throughout my PhD
candidature, but through employment avenues. I greatly appreciate these opportunities.
Thank you for your support throughout this period in my life. Your work ethic and
knowledge still astounds me, your passion for your job is inspiring. Thank you.
To Professor Rod Snow, thank you for your support and encouragement throughout my
PhD journey. I have always admired your knowledge, and valued your opinions. I aspire
to one day be as knowledgeable as you. Most importantly, thank you for being the
scientific equivalent to a moral compass, and being tough on me when I really needed it.
I have the most amazing parents, whom have made completing my PhD possible. Mum
and Dad, thanks. I don’t think that I would have survived this journey without your
support. Thank you for always being there, and letting me know that all that matters is
trying your hardest. You have both instilled the very best work ethic, and moral values
in me, and I thank you greatly for this. Thank you for listening to me babble on about
scientific stuff, that probably isn’t that exciting to most people, and even more
impressively, for actually knowing what I researched in my PhD. I love you both very
much. Thank you. Claire, I want to thank you so much as well. You have been such a
fantastic sister, and thank you for believing in me.
Kris, thank you for being you. Thank you for supporting me throughout my PhD. I am
so grateful for your support. Thank you for always making me laugh and relax after
those harder days. You always reminded me of what is actually important, something
5

that I really appreciate. Finally, thank you for indulging my love of sport science, and
truly being a nerd, and bringing home chocolate at just the right time.
Thank you to all of my friends who have stood by me, and encouraged me throughout
my PhD. Sarah, I’m finished! I promised you that I would. Thank you for being the best
friend I could ever have.
Completing my PhD thesis was made all the more fun with the company of my fellow
post-graduate students, in particular Emily Walker, James Zois, Matthew Varley, Luke
Boyd and George Elias. Thank you for sharing this rollercoaster journey with me. I
would particularly like to thank Luke Boyd, whom I worked closely with during data
collection at the Western Bulldogs Football Club.
I am extremely grateful to the laboratory staff at Victoria University, Mr Brad Gatt,
Miss Jessica Meilak, and Mr Ian Fairweather. Thank you all for your continuous
support and assistance, for without your help the studies within this thesis would have
been impossible to conduct.
I am extremely grateful to the Western Bulldogs Football Club, it’s players, staff and
volunteers who made Chapter 5 and Chapter 6 possible. I would like to extend a special
thank you to the players of the Western Bulldogs Football Club for participating in these
studies, and for making it an enjoyable experience. Finally, thank-you to Mr Bill
Davoren. Without your help and support these studies would certainly not have been
possible. Thank you for welcoming me into your club and providing such support. I will
be forever grateful for the opportunities that you have created for me.
Thank you to Dr Stuart Cormack for your assistance with issues pertaining to
countermovement jump testing. Thank you for the tricky questions.
6
To the participants who were involved in Chapter 4, thank you for your involvement.
Without your participation this study would not have been possible. I hope that you
enjoyed your involvement.
I extend a heartfelt thank you to Miss Emma Goff, for without Emma’s hard work, and
excellent research skills, Chapter 4 would not have been possible. Thank you for your
commitment to the project, your hard work and attention to detail. It was also fantastic
getting to know you, and I especially enjoyed your visit to Canberra. I also owe
Matthew Varley a thank you for his help in collecting the blood samples in Chapter 4.
Thank you to both Skins and JOBST for the supply of compression garments. Your
support was invaluable to the projects.
Finally, and thank you Kris for this one, “If it was easy, everyone would do it”. I will
remember that one forever....
7

PUBLICATIONS
The following publications are presented in support of this thesis:
Gallaher E., Boyd L., Stepto N., Snow R., and Aughey R.J. (2010). Compression
garments enhance recovery following Australian Football training. Journal of Science
and Medicine in Sport (Australian Conference of Science and Medicine in Sport,
Queensland). Vol. 13 Supp 1:e39-e40.
Boyd L.J., Gallaher E., Ball K., Stepto N.K., and Aughey R.J. (2010). “Practical
application of accelerometers in Australian football”. Journal of Science and Medicine
in Sport (Australian Conference of Science and Medicine in Sport, Queensland). Vol.
13 Supp 1:e14-e15.
8

TABLE OF CONTENTS
ABSTRACT .................................................................................................................... 2
STUDENT DECLARATION ........................................................................................ 4
ACKNOWLEDGEMENTS ........................................................................................... 5
PUBLICATIONS ............................................................................................................ 8
TABLE ............................................................................................................................. 9
LIST OF TABLES ........................................................................................................ 18
LIST OF FIGURES ...................................................................................................... 20
LIST OF ABBREVIATIONS ...................................................................................... 22
CHAPTER 1. INTRODUCTION ............................................................................ 23
CHAPTER 2. REVIEW OF LITERATURE ......................................................... 26
2.1 Introduction ...................................................................................................... 26
2.2 The activity profile of Australian Football ..................................................... 28
2.2.1 Activity patterns in Australian football games ............................................... 28
2.2.2 The activity profile of Australian football training ........................................ 31
2.3 Fatigue occurs during Australian football ..................................................... 32
9

2.4 Potential causes/mechanisms of fatigue .......................................................... 34
2.4.1 Reduced neural drive contributes to fatigue associated with in-session
performance declines. ................................................................................................. 34
2.4.2 Ionic imbalances contribute to fatigue ........................................................... 35
2.4.3 Exercise induced accumulations of inorganic phosphate and its effect on
calcium homeostasis contributes to fatigue development. ......................................... 36
2.4.4 Magnesium and adenosine triphosphate in peripheral fatigue. ...................... 37
2.5 Athletes experience fatigue for hours to days following exercise. ................ 38
2.5.1 Performance decrements are evident hours to days following team sport
exercise. ...................................................................................................................... 38
2.6 Exercise induced muscle damage .................................................................... 42
2.6.1 Muscle damage impairs force generating capacity......................................... 42
2.6.2 Mechanical and metabolic factors contribute to the manifestation of exercise
induced muscle damage .............................................................................................. 43
2.6.3 Muscle damage impairs the recovery of muscle glycogen ............................. 44
2.6.4 Team sport activities contribute to exercise induced muscle damage. ........... 46
2.6.5 Team sport athletes experience muscle damage. ............................................ 46
2.6.6 Force production and running economy are compromised by muscle
damage.................................................................................................................48
2.6.7 Delayed onset of muscular soreness: a symptom of exercise induced muscle
damage ........................................................................................................................ 48
10

2.6.8 Delayed onset muscle soreness is detrimental to performance indicators...... 52
2.6.9 Central fatigue, muscle damage and muscle soreness: a possible interaction. 53
2.7 Recovery is an important component of the athletes training schedule ...... 54
2.7.1 Recovery and Australian Football .................................................................. 55
2.8 Compression garments: a practical tool used to assist post exercise recovery
.............................................................................................................................58
2.8.1 Garment considerations .................................................................................. 58
2.8.2 Compression garment mechanisms ................................................................ 62
2.8.3 Compression garments as a recovery tool in un-trained populations ............. 70
2.8.4 Compression garments as a recovery tool in trained populations .................. 72
2.9 Practical tools to assess recovery ..................................................................... 77
2.9.1 Statistical analysis of treatment effects: the use of magnitude based effects . 78
2.9.2 The countermovement jump ........................................................................... 79
2.9.3 The measurement of muscle damage to assess post exercise recovery .......... 82
2.9.4 Measurement of perceptions of soreness and fatigue to assess recovery ....... 86
2.10 The placebo effect in sports performance: possible action of compression
garments ........................................................................................................................ 87
2.11 Summary of the literature ............................................................................... 89
2.12 Significance/influence on athletic performance ............................................. 91
11

2.13 Statement of the problem ................................................................................. 91
2.14 Specific aims of the studies .............................................................................. 92
2.14.1 Chapter 4: The effects of compression garments on high intensity
intermittent exercise performance and recovery on consecutive days. ...................... 92
2.14.2 Chapter 5: Recovery following elite Australian football training. ............. 92
2.14.3 Chapter 6: Recovery effects of medical and sports compression garments
after elite Australian football competition. ................................................................. 92
CHAPTER 3. GENERAL METHODS ................................................................... 94
3.1 Biochemical sampling and analysis ................................................................. 94
3.2 Perceptual measures ......................................................................................... 95
3.3 Performance measurement: Countermovement jump ................................. 95
3.4 Statistical analysis ............................................................................................. 98
3.4.1 Data preparation ............................................................................................. 98
3.4.2 Analysis of treatment effects .......................................................................... 98
3.4.3 Reliability ..................................................................................................... 100
CHAPTER 4. THE EFFECTS OF COMPRESSION GARMENTS ON HIGH
INTENSITY INTERMITTENT EXERCISE PERFORMANCE AND
RECOVERY ON CONSECUTIVE DAYS .............................................................. 101
4.1 Introduction .................................................................................................... 101
12

4.2 Methods ........................................................................................................... 104
4.2.1 Participants ................................................................................................... 104
4.2.2 Familiarisation Sessions ............................................................................... 104
4.2.3 Experimental overview ................................................................................. 105
4.2.4 Repeat sprint exercise protocol..................................................................... 106
4.2.5 Recovery intervention................................................................................... 107
4.2.6 Assessment of acute and cumulative responses to RSE ............................... 107
4.3 Results .............................................................................................................. 107
4.3.1 Acute responses to repeat sprint exercise and acute recovery responses ..... 111
4.3.2 Cumulative responses to repeat sprint exercise and cumulative recovery
responses ................................................................................................................... 113
4.4 Discussion ........................................................................................................ 115
4.5 Conclusions ..................................................................................................... 120
CHAPTER 5. RECOVERY FOLLOWING ELITE AUSTRALIAN FOOTBALL
TRAINING 121
5.1 Introduction .................................................................................................... 121
5.2 Methods ........................................................................................................... 124
5.2.1 Participants ................................................................................................... 124
5.2.2 Experimental overview ................................................................................. 124
13

5.2.3 Measurements ............................................................................................... 125
5.2.4 Warm ups ...................................................................................................... 126
5.2.5 Session RPE and calculation of internal load ............................................... 126
5.2.6 Recovery intervention................................................................................... 126
5.3 Results .............................................................................................................. 128
5.3.1 Training session 1 (TR1) .............................................................................. 128
5.3.2 Training Session 2 (TR2) ............................................................................. 133
5.3.1 Training Session 1 versus Training Session 2 .............................................. 137
5.4 Discussion ........................................................................................................ 137
5.4.1 Training session one ..................................................................................... 138
5.4.2 Training session two ..................................................................................... 140
5.4.3 Inconsistent effects between TR1 and TR2 .................................................. 143
5.5 Conclusion ....................................................................................................... 144
CHAPTER 6. RECOVERY EFFECTS OF MEDICAL AND SPORTS
COMPRESSION GARMENTS AFTER ELITE AUSTRALIAN FOOTBALL
COMPETITION ......................................................................................................... 146
6.1 Introduction .................................................................................................... 146
6.2 Methods ........................................................................................................... 148
6.2.1 Participants ................................................................................................... 148
14

6.2.2 Experimental overview ................................................................................. 148
6.2.3 Session RPE and internal load on participants ............................................. 149
6.2.4 Recovery intervention................................................................................... 149
6.3 Results .............................................................................................................. 150
6.4 Discussion ........................................................................................................ 156
6.5 Conclusions ..................................................................................................... 161
CHAPTER 7. GENERAL DISCUSSION AND CONCLUSIONS ..................... 162
7.1 Introduction .................................................................................................... 162
7.2 Australian football training and competition are strenuous, imposing large
recovery demands. ...................................................................................................... 162
7.3 Sports and medical compression garments elicit similar recovery effects 165
7.4 Compression garments do not consistently enhance the recovery of
performance. ............................................................................................................... 169
7.5 Mixed recovery outcomes occur for perceptual parameters with
compression garment use. .......................................................................................... 170
7.5.1 Positive recovery effects for perceived fatigue and muscle soreness are
inconsistent. .............................................................................................................. 170
7.5.2 A placebo effect may influence perceptual recovery with sports compression
garment use. .............................................................................................................. 171
15
7.5.3 Perceptual responses may be uncoupled from performance in recreational
exercisers and elite athletes. ..................................................................................... 173
7.6 Recovery effects are inconsistent across exercise modalities ...................... 173
7.7 Final conclusions and practical recommendations ...................................... 174
CHAPTER 8. LIMITATIONS AND RECOMMENDATIONS FOR FUTURE
RESEARCH 176
CHAPTER 9. APPENDICIES ............................................................................... 183
9.1 Compression garment instructions and diary (Chapter 5) ......................... 183
9.2 Participant recruitment flyer ........................................................................ 184
9.2.1 Chapter 4 ...................................................................................................... 184
9.3 Information to participants ........................................................................... 185
9.3.1 Chapter 4 ...................................................................................................... 185
9.3.2 Chapter 5 & Chapter 6 .................................................................................. 188
9.4 Cardiovascular and other risk factors questionnaire ................................. 192
9.4.1 Chapter 4 ...................................................................................................... 192
9.4.2 Chapter 5 & Chapter 6 .................................................................................. 194
9.5 Consent form ................................................................................................... 197
9.5.1 Chapter 4 ...................................................................................................... 197
16

9.5.2 Chapter 5 & Chapter 6 .................................................................................. 199
9.6 Perceptual measurements .............................................................................. 201
9.6.1 Chapter 4: Visual analogue scale and rating of perceived exertion. ............ 201
9.6.2 Chapter 5 & Chapter 6: Visual analogue scale ............................................. 202
9.6.3 Chapter 5 & Chapter 6: Rating of Perceived Exertion Scale ....................... 203
9.7 Raw plasma Myoglobin values ...................................................................... 204
9.7.1 Chapter 4: Raw plasma Myoglobin values ................................................... 204
9.7.2 Chapter 5: Raw plasma Myoglobin values ................................................... 204
9.7.3 Chapter 6: Raw plasma Myoglobin values ................................................... 205
REFERENCES ........................................................................................................... 206
17

LIST OF TABLES
Table 2.1: Locomotive activities of AF games using global positioning system (GPS)
technology. ............................................................................................................. 30
Table 2.2: The occurrence of muscle soreness following laboratory and field based
exercise stimuli. ...................................................................................................... 51
Table 2.3: Reliability of measures obtained using a countermovement jump................ 81
Table 2.4: Changes in Myoglobin concentration following various exercise modalities.
................................................................................................................................ 84
Table 4.1: Acute and cumulative biochemical and perceptual responses to repeat sprint
activity. ................................................................................................................. 112
Table 5.1: Internal load units (au) for training session one (TR1). .............................. 129
Table 5.2: The percentage change in perceived fatigue, muscle soreness and plasma
Myoglobin concentration ([Mb]) following training session 1 (TR1). ................ 131
Table 5.3: Internal load units (au) training session two (TR2). .................................... 133
Table 5.4: The percentage change in perceived fatigue, muscle soreness and plasma
Myoglobin concentration ([Mb]) following training session two (TR2). ............ 135
Table 5.5: Training session one versus training session two. ....................................... 137
Table 6.1: Internal load units (au) obtained from the game and total time spent on the
field (min) during the game. ................................................................................. 150
Table 6.2: Perceptual responses to Australian football competition. ........................... 151
18
Table 6.3: Change in plasma Myoglobin ([Mb]) concentration (ng.ml-1) following elite
Australian football competition. ........................................................................... 154
Table 6.4: Countermovement jump variables following Australian football competition.
.............................................................................................................................. 155
Table 7.1: Perceptual, performance and muscle damage responses compared to baseline
after Australian Football training and competition. .............................................. 163
Table 7.2: Overview of recovery effects for sports and medical compression garments
after repeat sprint exercise, Australian football training and competition............ 167
Table 9.1: Raw plasma Myoglobin concentration (ng/ml). .......................................... 204
Table 9.2: Raw plasma Myoglobin concentration (ng/ml). .......................................... 204
Table 9.3: Raw plasma Myoglobin concentration (ng/ml). .......................................... 205
Table 9.4: Raw plasma Myoglobin concentration (ng/ml). .......................................... 205
19

LIST OF FIGURES
Figure 2.1: Recovery continuum. ................................................................................... 38
Figure 2.2 Graduated Compression Garments ............................................................... 59
Figure 2.3 Classification of compression ....................................................................... 60
Figure 2.4: The arrangement of inlay and body yarn in flat knit (A) and circular knit
fabric (B). ................................................................................................................ 60
Figure 2.5: The fibres that make up body and inlay yarn. .............................................. 61
Figure 2.6: Negative, positive and n on-significant magnitudes. ................................... 79
Figure 2.7: The release and breakdown of muscle damage markers after exercise…...83
Figure 4.1: Overview of the repeat sprint exercise (RSE) protocol. ............................ 106
Figure 4.2: Effect of compression garments on sprint performance per repeat sprint
exercise session (RSE)........... ............................................................................... 109
Figure 4.3: Effect of compression garments on sprint performance per set, for work in
kilojoules (A) and peak velocity in meters per second (B). ................................. 110
Figure 4.4: Individual acute changes in perceived muscle soreness following a single
RSE. ...................................................................................................................... 113
Figure 4.5: Individual changes in perceived fatigue. .................................................... 114
Figure 5.1: Experimental overview .............................................................................. 125
Figure 5.2: Sports compression garment. ..................................................................... 127
Figure 5.3: Medical compression garment. .................................................................. 128
20

Figure 5.4: Countermovement jump flight time. .......................................................... 130
Figure 5.5: Individual muscle soreness responses to training session 1 (TR1). ........... 132
Figure 5.6: Countermovement jump flight time. .......................................................... 134
Figure 5.7: Individual muscle soreness responses to training session two (TR2). ....... 136
Figure 6.1: Experimental overview. ............................................................................. 149
Figure 6.2: Individual muscle soreness responses to an Australian Football game. .... 152
Figure 6.3: Individual perceived fatigue responses to an Australian Football game. .. 153
21
LIST OF ABBREVIATIONS
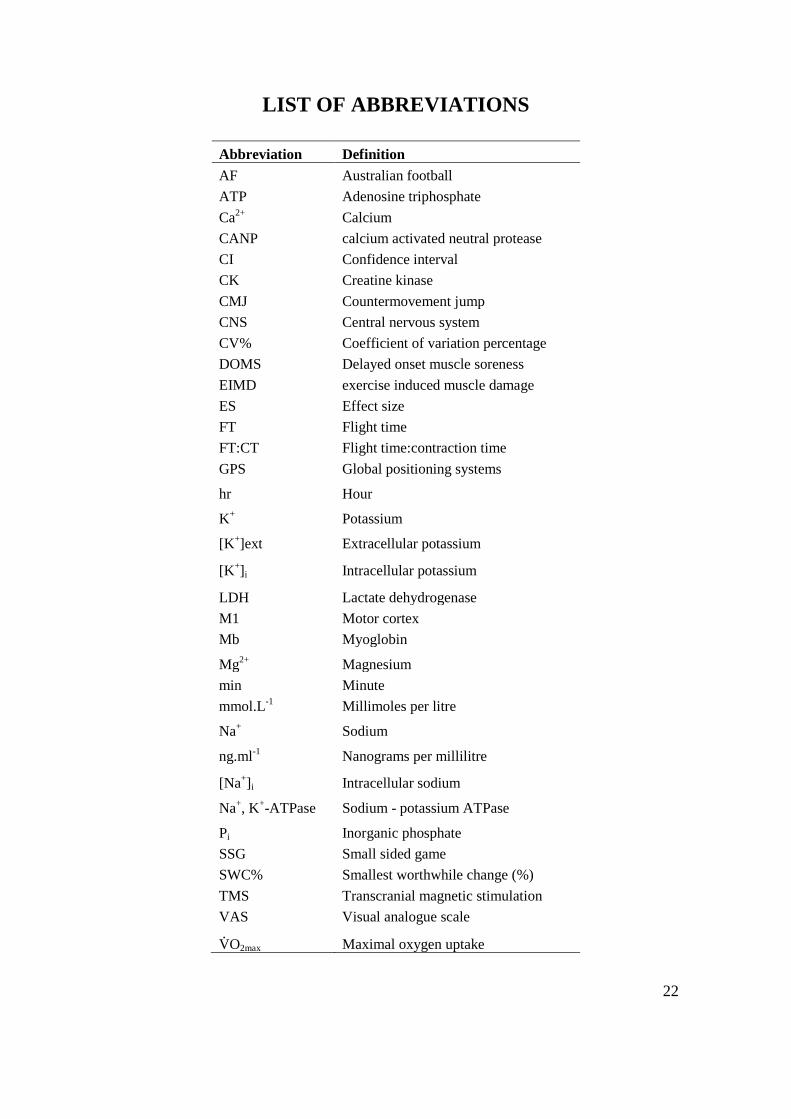
Abbreviation Definition AF Australian football ATP Adenosine triphosphate Ca2+ Calcium CANP calcium activated neutral protease CI Confidence interval CK Creatine kinase CMJ Countermovement jump CNS Central nervous system CV% Coefficient of variation percentage DOMS Delayed onset muscle soreness EIMD exercise induced muscle damage ES Effect size FT Flight time FT:CT Flight time:contraction time GPS Global positioning systems
hr Hour
K+ Potassium
[K+]ext Extracellular potassium
[K+]i Intracellular potassium
LDH Lactate dehydrogenase M1 Motor cortex Mb Myoglobin
Mg2+ Magnesium min Minute mmol.L-1 Millimoles per litre
Na+ Sodium
ng.ml-1 Nanograms per millilitre
[Na+]i Intracellular sodium
Na+, K+-ATPase Sodium - potassium ATPase
Pi Inorganic phosphate SSG Small sided game SWC% Smallest worthwhile change (%) TMS Transcranial magnetic stimulation VAS Visual analogue scale
V.O2max Maximal oxygen uptake
22
CHAPTER 1. INTRODUCTION
Recovery is an essential component of the elite athlete training regime (Calder 1990;
Calder 1991). Primarily, the aim of recovery is to return physiological (Gill, Beaven et
al. 2006; Montgomery, Pyne et al. 2008a), psychological (Duffield, Edge et al. 2008;
Montgomery, Pyne et al. 2008b; Vaile, Halson et al. 2008b) and performance variables
(Duffield, Edge et al. 2008; Montgomery, Pyne et al. 2008b; Vaile, Halson et al. 2008a;
Duffield, Cannon et al. 2010) to normal ‘pre-exercise’ levels. If successful, recovery
interventions should allow the athlete to train optimally, with the ultimate goal to
enhance sporting performance. Further, recovery should facilitate training adaptations
experienced by the athlete (Kentta and Hassmen 1998), via minimising fatigue, muscle
damage and muscle soreness.
Training and playing often result in both acute and prolonged fatigue, muscle damage,
muscle soreness, and performance decrements (Mohr, Krustrup et al. 2003; Dawson,
Gow et al. 2005; Rampinini, Coutts et al. 2007; Ascensao, Rebelo et al. 2008; Cormack,
Newton et al. 2008a; Bradley, Sheldon et al. 2009; Duffield, Coutts et al. 2009;
Rampinini, Impellizzeri et al. 2009; Aughey 2010; Coutts, Quinn et al. 2010). It is not
surprising that recovery interventions have gained such popularity. Although a growing
body of research has been conducted on a variety of recovery modalities, each method
is not fully understood. Therefore, investigating different recovery methods and their
effect on fatigue, muscle damage/soreness, and performance is warranted.
Compression garments are a popular recovery modality worn by recreational exercises
and elite athletes alike. Physiologically, compression garments exert positive actions
through alterations to the vascular and lymphatic systems (Swedborg 1984; Mayberry,
23

Moneta et al. 1991; Yasuhara, Shigematsu et al. 1996; Johansson, Lie et al. 1998;
Jonker, de Boer et al. 2001; Beidler, Douillet et al. 2009). Wearing compression
garments also blunts the pro-inflammatory cytokine response in patients suffering from
DVI and leg ulcerations (Beidler, Douillet et al. 2009). More recently, it has been
established in recreationally active participants, that tissue oxygenation during exercise
is increased with the use of compression garments (Ali, Creasy et al. 2011; Coza, Dunn
et al. 2012), reflecting increases in muscle blood flow. Compression garments may also
offer positive effects through a reduction in muscle oscillation (Kraemer, Bush et al.
1998a; Doan, Kwon et al. 2003), improved proprioception (Kraemer, Bush et al. 1998a;
Pearce, Kidgell et al. 2009) and the comfort of the garment (Kraemer, Bush et al.
1996). Some authors also suggest that wearing compression garments permit the limbs
to remain in anatomical positions when not used and that this restriction in movement
enhances the regeneration and repair process (Kraemer, Bush et al. 1998a; Kraemer,
Bush et al. 2001a; Kraemer, Bush et al. 2001b).
Despite the wealth of information detailing the influence of compression garments on
vascular and lymphatic distribution in clinical populations, and recovery responses after
laboratory and non sporting scenarios (Kraemer, Bush et al. 1998a; Kraemer, Bush et al.
1998b; Kraemer, Volek et al. 2000; Kraemer, Bush et al. 2001a; Kraemer, Bush et al.
2001b; Chatard, Atlaoui et al. 2004; Kraemer, French et al. 2004; Duffield and Portus
2007; Duffield, Edge et al. 2008; French, Thompson et al. 2008; Davies, Thompson et
al. 2009; Duffield, Cannon et al. 2010; Jakeman, Byrne et al. 2010b; Jakeman, Byrne et
al. 2010a; Kraemer, Flanagan et al. 2010; De Glanville and Hamlin 2012), less evidence
is available concerning high level athletic performance. Due to the discrepancies in the
exercise interventions and the recovery effects of wearing the garments in the few
24

studies focussing on compression garments and actual sporting scenarios (Gill, Beaven
et al. 2006; Montgomery, Pyne et al. 2008a; Montgomery, Pyne et al. 2008b), it is very
difficult to decipher clear outcomes of compression garment research within the athlete
population.
This thesis will explore the influence of such garments on fatigue, muscle
soreness/damage and performance through a comprehensive review of the literature
(Chapter 4); the presentation of three novel studies (Chapter 4, 5 and 6); and a final
discussion with concluding remarks (Chapter 7) and future directions to address the
limitations of this thesis (Chapter 8).
25

CHAPTER 2. REVIEW OF LITERATURE
2.1 Introduction
Australian football (AF) is a team sport comprising a substantial level of physical
contact overlaid on a large volume of player running. This review begins with a
discussion of the activity profiles of AF athletes (Section 2.2), thus highlighting the
necessity to optimise recovery in this sport. The fatigue an athlete experiences during
competition and training is considered transient, where recovery occurs within seconds
to minutes of exercise cessation. Factors involved in such recovery are discussed in
Section 2.3. Athletes may also experience prolonged fatigue, persisting for several hours
to days (Section 2.5), which may impact subsequent performance. It is also likely that
there is some overlap between these two broad categories of fatigue, where some of the
fatigue experienced during exercise will recover quickly after exercise has ceased, with
other elements taking hours to days to recover. The review then addresses the
occurrence of muscle damage in team sport athletes (Section 2.6), and examines
mechanisms underlying such damage (Section 2.6.2 and 2.6.4) as well as its impact on
subsequent performance (Section 2.6.6). The reader is then lead to a discussion on the
muscle soreness associated with muscle damage, its role in reduced performance
(Section 2.6.8) as well as the possible link between muscle soreness and central fatigue
during subsequent exercise sessions (Section 2.6.9). The review then moves to a
discussion pertaining to recovery concepts (Section 2.7), including the importance of
recovery in AF (Section 2.7.1). Practical tools by which the efficacy of recovery
modalities can be investigated will also be briefly considered (Section 2.9).
26

The use of compression garments to augment between session recovery is extremely
fashionable in elite sport, particularly AF. The efficacy of compression garments for
recovery is discussed in the context of accelerating the recovery of performance, as well
as perceptual and biochemical parameters (Section 2.8). Studies investigating the
influence of these garments, where they have been worn exclusively during exercise
will not be discussed in this review. Such studies do not shed light on the actions of
compression garments to augment recovery. Studies will however be discussed when
the garments have been worn during exercise and the subsequent recovery period, and
solely in the recovery period. These studies better highlight the recovery properties of
this intervention. Finally, this review culminates with a summary of the key ideas
explored (Section 2.11), and the central aims of the thesis (Section 2.14).
Literature was located over a five year period (up to October 2012) using a combination
of database searches (PubMed, MEDLINE, Google Scholar; with key words including
‘compression’, ‘compressive’, ‘garment’, ‘stocking’, ‘exercise’, ‘sport’, ‘recovery’,
‘performance’, ‘muscle soreness’, ‘fatigue’, ‘muscle damage’, ‘team sport’, ‘elite’,
‘athlete’, and ‘movement demands’) and extensive follow up through reference sections
of identified papers. To establish inclusion criteria, a compression garment, in the
context of sport and exercise, was defined as a garment that is worn to apply pressure to
a particular area of the body with the intention of mitigating exercise induced
discomfort, or aiding aspects of current or subsequent exercise performance; and of a
construction that permits prolonged wear if required.
27

2.2 The activity profile of Australian Football
2.2.1 Activity patterns in Australian football games
Australian football athletes compete on a weekly basis across a seven month period
(Ebert 2000). Games have a duration of ~120 min, consisting of four 20 min quarters in
addition to ‘time on’ equivalent periods when the ball is out of play (Ebert 2000;
Dawson, Hopkinson et al. 2004b). Players cover approximately 108 to 150 m.min-1
(Coutts, Quinn et al. 2010; Aughey 2011). Further, athletes undertake a maximal
acceleration on average once each minute (Aughey 2010). In addition, more than 50%
of all sprints undertaken involve a change of direction (Dawson, Hopkinson et al.
2004b). During finals games, the number of maximal accelerations approximately
doubles, and there is also an increase in the amount of high intensity running (9%) and
total distance covered (11%) (Aughey 2011). Table 2.1 is presented as traditional and
contemporary GPS analysis.
There is a high level of physical contact in AF games when the ball is in dispute, and
players repeatedly collide with both opposition players and the ground (Dawson,
Hopkinson et al. 2004b). Excluding foot contact with the ground, midfielders and
ruckmen (centre players, who help set up scoring shots, recover the ball from the
backline and trap the ball further forward) make contact with the ground 21-23 times
per game (Dawson, Hopkinson et al. 2004b). Players are also involved in numerous
tackles with opposition players (Dawson, Hopkinson et al. 2004b). The combination of
repetitive physical contact and locomotive activities in AF suggests that a considerable
level of muscle damage and soreness will be induced (Zuliani, Bonetti et al. 1985;
Thompson, Nicholas et al. 1999; Takarada 2003). It is likely that levels will exceed that
of team sports such as soccer, where players cover roughly 37% less distance (Mohr, 28

Krustrup et al. 2003) and lack similar levels of physical contact as AF. What’s more, the
greater distance covered at various speeds and accelerations and decelerations is
associated with a greater volume of muscle damage as measured by plasma creatine
kinase concentrations in elite junior AF athletes during competition matches (Young,
Hepner et al. 2012). Additionally, 24 and 48 hr after elite AF competition, elite AF
athletes still experienced elevated muscle soreness (257%, 161%), perceived fatigue
(190%, 95%), and reduced CMJ flight time:contraction time ratio performance (-15%, -
11%) (Elias, Wyckelsma et al. 2012). This game related muscle soreness tends to
dissipate after three days, regardless of game load. Using a rating scale adopted from the
Borg CR-10 method, general muscle soreness was 4.6 ± 1.1 units 24 hr post game, falling to
1.9 ± 1.0 by day six (Montgomery and Hopkins 2012). Further, there is only a small
increase in general muscle soreness (0.22 ± 0.07 to 0.50 ± 0.13 units; mean±SD) in the three
days following high load games relative to low load games.
29

Table 2.1: Locomotive activities of AF games using global positioning system (GPS) technology.
Game details Total distance Low to moderate speed High speed High intensity speed Traditional GPS analysis (total distance covered within a set velocity band) 2 games (Duffield, Coutts et al. 2009)
9,380±1,470 m (mean total)
71 % (<7.0 km.hr-1 to 14.4 km.hr-1)
18 % (2,720±850 m) (>14.5 km.hr-1)
11 % (1,070±350 m) (>20.0 km.hr-1)
16 games (Coutts, Quinn et al. 2010) 12,939±1145 m (mean total)
(3,880±633 m)
(>14.4 km.hr-1)
4 seasons (Wisbey, Montgomery et al. 2009)
Forwards: 11,700±2,000 m; nomadic players: 12,300±1,900 m; defenders: 11,900±1,700 m
Contemporary GPS analysis (the distance covered within a set velocity band per minute of actual game play) 29 games; Distances covered in games were reported per unit of game time (m.min-1) (Aughey 2010)
127±17 m.min-1
12,734±1,596 m; (total distance)
89±11 m.min-1
9,011±1,137 m (0.01 and 4.17 m.sec-1 or 0.036 to 15.0 km.hr-1)
34±9 m.min-1;
3,334±756 m (4.17 to 10.00 m.sec-1 or 15.0 to 36.0 km.hr-1)
3 in-season games, 3 finals game; Distances covered in games were reported per unit of game time (m.min-1) (Aughey 2011)
119.0 ± 16.0 to 137.9 ± 17.7 m.min-1 during in-season games; 130.6 ± 33.7 to 152.7 ± 17.8 m.min-1 during finals games.
Distances covered at low-moderate (<7.0 km.hr-1 to 14.4 km.hr-1 (Duffield, Coutts et al. 2009); (0.036 to 15.0 km.hr-1) (Aughey 2010)), high (14.5 to 20 km.hr-
1 (Duffield, Coutts et al. 2009); >14.4 km.hr-1 (Coutts, Quinn et al. 2010)), and high intensity speeds (> 20 km.hr-1 (Duffield, Coutts et al. 2009); 14.9 to 36.0 km.hr-1 (Aughey 2010)) are expressed in absolute terms (m) using traditional analysis, and relative to game time played (m.min-1) as per the contemporary analysis approach. The ranges for each ‘speed zone’ vary according to the investigation.
30

2.2.2 The activity profile of Australian football training
The activity profile of AF training is reflective of game activities (Dawson, Hopkinson et al.
2004a; Loader, Montgomery et al. 2012), and is likely to contribute to fatigue, muscle
damage, soreness and reductions in performance (Elias, Varley et al. 2012). Specifically, fast-
running and sprinting efforts during training reflect those of game activities (Dawson,
Hopkinson et al. 2004a). Moreover, the frequency of change of direction when sprinting
during games is replicated during training (Dawson, Hopkinson et al. 2004a). Players conduct
a similar number of high intensity movements during training and game play (Dawson,
Hopkinson et al. 2004a). The movement demands and intensity levels of drills classified as
game-specific conditioning simulate those of competitive game play, while skill refining drills
of both moderate and low physiological intensity do not replicate these characteristics
(Loader, Montgomery et al. 2012). These training sessions are repeated up to three times per
week, in addition to two or more resistance training sessions as well as individual skill
sessions (Cormack, Newton et al. 2008a). The strenuous nature of these training sessions is
likely to be compounded by the repetition of these tasks across the week. Indeed, cumulative
fatigue is evident during team sport training and tournament scenarios. A three day
international handball tournament reduced CMJ performance by 6.7% and 20 m sprint ability
by 3.7% (Ronglan, Raastad et al. 2006b). A five day handball training camp elicited
reductions in knee extension strength (-8.4%) and jump height (-6.9%) (Ronglan, Raastad et
al. 2006b). Similarly, substantial cumulative fatigue from three consecutive days of basketball
play was evident in several performance measures and elevations in the subjective rating of
general fatigue. There were small impairments in line-drill ability, which decreased by
0.5+1.8 s (mean±90% confidence limits); a moderate decrement in 20-m acceleration of
31

0.04+1.3 sec; and a large to very large decrement in agility of 0.1+1.2 sec. Sit and reach test
performance decreased by 5.4+4.0 cm and general fatigue had a very large increase of 2.2+1.5
arbitrary units (scale 1–10) (Montgomery, Pyne et al. 2008b).
Australian football training sessions result in changes in perceptual and performance
parameters, with athletes still recovering 24-48 hr later (Elias, Varley et al. 2012).
Immediately following training, acute decreases in sprint performance (0.71-1.10%) were
evident along with increased perceived muscle soreness (1.4 to 2.7 %) and fatigue (2.8 to 4.8
%). Muscle soreness and perceived fatigue were evident 24 and 48 hr after training, with
some athletes still displaying impaired repeat sprint performance (4%).
2.3 Fatigue occurs during Australian football
Fatigue can be defined as a reduction in muscle force and/or power with continuous or
repeated muscle contractions which can be restored after a period of recovery (McKenna,
Bangsbo et al. 2008). Fatigue can result from disturbances in the nervous system (central
fatigue) and/or within skeletal muscle (peripheral fatigue). The activity profile of team sport
athletes during the latter stages of competitive game play suggest that players experience in-
game fatigue (Mohr, Krustrup et al. 2003; Rampinini, Coutts et al. 2007; Bradley, Sheldon et
al. 2009; Duffield, Coutts et al. 2009; Rampinini, Impellizzeri et al. 2009; Aughey 2010;
Coutts, Quinn et al. 2010) which is likely attributable to both central and peripheral factors.
This in-session fatigue likely differs from the fatigue that persists for hours to days following
competition and training (see Section 2.4). There is, however, some overlap between these
two broad categories of fatigue. Indeed, factors which contribute to in-session fatigue may not
reach full recovery immediately after exercise, for example fatigue associated with glycogen
depletion (Jacobs, Westlin et al. 1982; Zehnder, Rico-Sanz et al. 2001). As such, these factors
32

can also be involved in prolonged fatigue, where performance may be impaired for hours to
days.
In-session fatigue is characterised by performance declines during the actual game or training
session. Elite AF athletes experience reductions in total distance and higher speed running
distance later in games (Duffield, Coutts et al. 2009; Aughey 2010; Coutts, Quinn et al. 2010).
Similarly, reductions in high intensity running distance and maximal accelerations also occur
later in AF games (Aughey 2010). However, in-session fatigue is not limited purely to the
latter stages of competition or training, a player may partake in a strenuous period of play
during any stage of the session, during which their performance may decline during the latter
stage of this period. Elite soccer players also display reductions in high intensity running
during the latter portion of games (Mohr, Krustrup et al. 2003; Rampinini, Coutts et al. 2007;
Bradley, Sheldon et al. 2009; Rampinini, Impellizzeri et al. 2009). Although this does not
provide actual proof of fatigue per se, just reduction in distances covered, reductions in
measures of performance are also observed after game play that are more indicative of
fatigue. Indeed, as discussed in Section 2.5.1, lower body maximal voluntary contractions,
squat jump, drop jump, countermovement jump, lower limb strength, and sprint test
performance are all depressed after team sport activity (Hoffman, Nusse et al. 2003;
Ascensao, Rebelo et al. 2008; Cormack, Newton et al. 2008a; Oliver, Armstrong et al. 2008;
Duffield, Cannon et al. 2010; McLean, Coutts et al. 2010). It is possible that if an athlete has
not fully recovered from the sessions preceding game play, e.g. training or competition, that
an earlier onset of in-game performance declines may occur.
33

2.4 Potential causes/mechanisms of fatigue
2.4.1 Reduced neural drive contributes to fatigue associated with in-session performance
declines.
Central fatigue represents the loss of force through inadequate activation of motor neurons
(Baker, Kostov et al. 1993; Taylor, Allen et al. 2000). Central fatigue may be a consequence
of local reflex effects on the motor neuron or higher centres, reduced cortical drive, or
reduced descending drive via descending spinal pathways (Kernell 1969; Garland 1991;
Macefield, Hagbarth et al. 1991; Garland and Kaufman 1995; Taylor, Allen et al. 2000;
Gandevia 2001). Ultimately, the CNS is not ‘driving’ the muscles as intensely as required to
maintain muscle force or power.
The manifestation of central fatigue may be the consequence of either conscious or
unconscious mechanisms (Taylor, Allen et al. 2000). In the first instance, the individual may
feel that the sensations are not tolerable and intentionally lower the level of activity or
intensity of exercise (Taylor, Allen et al. 2000). Alternatively, afferent feedback from
working muscles, joints or tendons may inhibit motor activity at spinal and supraspinal levels,
through unconscious mechanisms (Taylor, Allen et al. 2000). This may lead to an obligatory
decrement in performance that no amount of voluntary effort can overcome (Taylor, Allen et
al. 2000). Central fatigue is likely to recover within 30 – 60 min following exercise cessation
(Brasil-Neto, Pascual-Leone et al. 1993; Samii, Wassermann et al. 1996; Lentz and Nielsen
2002; Verin, Ross et al. 2004). However, through an interaction with muscle soreness, a
reduced neural drive may play a role in a more prolonged fatigue, which may influence
performance for a period of hours to days (See Section 2.5.9).
34
2.4.2 Ionic imbalances contribute to fatigue
The exact physiological mechanisms that contribute to fatigue during intermittent high
intensity exercise remain largely unknown. However it is possible that ionic imbalances may
in part contribute to in-session fatigue. Disruptions to the intra- and extra-cellular balance of
the cations Na+ and K+ may contribute to transient declines in skeletal muscle contractile
function (Clausen 2003). The exercise induced alterations to muscle intracellular Na+
concentration ([Na+]i) (Gonzalez-Serratos, Somlyo et al. 1978; Sjogaard, Adams et al. 1985;
Fong, Atwood et al. 1986; Juel 1986; Nagaoka, Yamashita et al. 1994) and extracellular K+
concentration ([K+]ext) (Sjogaard, Adams et al. 1985; Green, Bulow et al. 1999; Green,
Langberg et al. 2000; Juel, Pilegaard et al. 2000; Nielsen, Mohr et al. 2004) evoke reductions
(~10-15 mV) in the resting membrane potential, rendering the membrane depolarised
(Westerblad and Lannergren 1986; Balog, Thompson et al. 1994; Light, Comtois et al. 1994;
Comtois, Light et al. 1995; Balog and Fitts 1996; Karelis, Peronnet et al. 2005; Street, Nielsen
et al. 2005), manifesting in a loss of excitability of muscle (Hodgkin and Horowicz 1959;
Renaud and Mainwood 1985; Lannergren and Westerblad 1986; Juel 1988; Renaud 1989;
Clausen, Andersen et al. 1993; Renaud and Comtois 1994; Cairns, Flatman et al. 1995;
Cairns, Hing et al. 1997). This primarily results from depolarisation and the inactivation of
voltage dependent Na+ channels (Hodgkin and Huxley 1952; Hodgkin and Horowicz 1959;
Ildefonse and Roy 1972; Ruff, Simoncini et al. 1988), lowering action potential amplitude
(Renaud and Light 1992; Ruff 1999) and the force generating capacity of the muscle. The
reduced maximal activity of the Na+, K+-ATPase with fatiguing exercise (Yonemura 1967;
Fowles, Green et al. 2002; Fraser, Li et al. 2002; Yensen, Matar et al. 2002; Leppik, Aughey
et al. 2004; Aughey, Gore et al. 2005; Petersen, Murphy et al. 2005; Aughey, Clark et al.
2006; Aughey, Murphy et al. 2007) jeopardises the maintenance of the transport capacity of
35

Na+ and K+, and ultimately muscle excitability (Clausen 2003), culminating in a reduction in
muscle force generating capacity (McKenna, Bangsbo et al. 2008). These changes are
involved primarily in transient fatigue as observed by the return of plasma K+ levels to near
pre exercise levels 10 min following exercise, and Na+, K+-ATPase recovery within 3 hr of
recovery (Petersen, Murphy et al. 2005). In the presence of muscle damage, independent of
transient fatigue, cellular structures may become damaged. As a consequence, ionic
disturbances may occur, and possibly persist for hours to days whilst the damage is apparent.
See sections 2.6.3.
2.4.3 Exercise induced accumulations of inorganic phosphate and its effect on calcium
homeostasis contributes to fatigue development.
The accumulation of Pi during repetitive muscular contraction (Dawson, Gadian et al. 1978)
contributes to transient muscular fatigue through an impaired cross-bridge attachment and
reduction of maximum Ca2+ activated force (Pate and Cooke 1989; Millar and Homsher 1990;
Martyn and Gordon 1992; Phillips, Wiseman et al. 1993; Gordon, Homsher et al. 2000;
Dahlstedt, Katz et al. 2001); a dampened sarcoplasmic reticulum Ca2+ release (Fryer, Owen et
al. 1995; Westerblad and Allen 1996; Posterino and Fryer 1998 ; Kabbara and Allen 1999;
Duke and Steele 2000; Dahlstedt, Katz et al. 2001; Duke and Steele 2001); and a reduced
myofilament Ca2+ sensitivity (Godt and Nosek 1989; Millar and Homsher 1990; Martyn and
Gordon 1992; Fryer, Owen et al. 1995; Dahlstedt, Katz et al. 2001). As little is known as to
the exact mechanisms of fatigue during high intensity intermittent activity such as team sport
exercise, it can only be speculated that the accumulation of Pi plays a role. However, as Pi
recovery occurs within 1-3 minutes of exercise cessation (Harris, Edwards et al. 1976;
Yoshida 2002), it is unlikely that Pi accumulation and its effects on Ca2+ regulation will
36

contribute substantially to between session fatigue, and is involved to a greater extent in
transient fatigue.
2.4.4 Magnesium and adenosine triphosphate in peripheral fatigue.
A large part of the intracellular pool of magnesium (Mg2+) is present as MgATP. As the
affinity of ATP for Mg2+ is approximately tenfold greater than that of ADP, ATP hydrolysis
leads to a rise in intracellular magnesium ([Mg2+]i)(Leyssens, Nowicky et al. 1996; Blazev
and Lamb 1999b). The accumulation of intracellular magnesium ([Mg2+]i) and associated
reduction in adenosine triphosphate (ATP) leads to sub-optimal Ca2+ release from the
sarcoplasmic reticulum, culminating in a reduction in force generating capacity. These factors
are normally recovered within minutes (Edwards, Hill et al. 1977) and thus unlikely to alter
the between session recovery of athletes. Nonetheless, during exercise, contraction induced
increases in cytoplasmic Mg2+ strongly inhibit the Ca2+ release channel (Meissner, Darling et
al. 1986; Lamb and Stephenson 1991; Lamb and Stephenson 1994; Laver, O'Neill et al. 2004)
with sarcoplasmic reticulum Ca2+ release decreasing by ~40% (Meissner, Darling et al. 1986;
Westerblad and Allen 1992; Dutka and Lamb 2004). Additionally, reductions in [ATP]i
reduce sarcoplasmic reticulum Ca2+ release by ~20% (Owen, Lamb et al. 1996; Blazev and
Lamb 1999a; Blazev and Lamb 1999b; Dutka and Lamb 2004). Elevated [Mg2+]i also inhibits
the sarcoplasmic reticulum Ca2+ pump function (Krause 1991), and competes with Ca2+ for
binding sites on parvalbumin (a calcium binding albumin protein located in fast twitch
skeletal muscle cells) (Robertson, Johnson et al. 1981). However as these mechanisms of
fatigue have been largely established from single muscle fibre experiments using animal
models (mouse, rat, rabbit and toad), it is unknown if these fatigue mechanisms will transfer
to intermittent high intensity activity such as team sport games and training in human skeletal
muscle.
37
2.5 Athletes experience fatigue for hours to days following exercise.
2.5.1 Performance decrements are evident hours to days following team sport exercise.
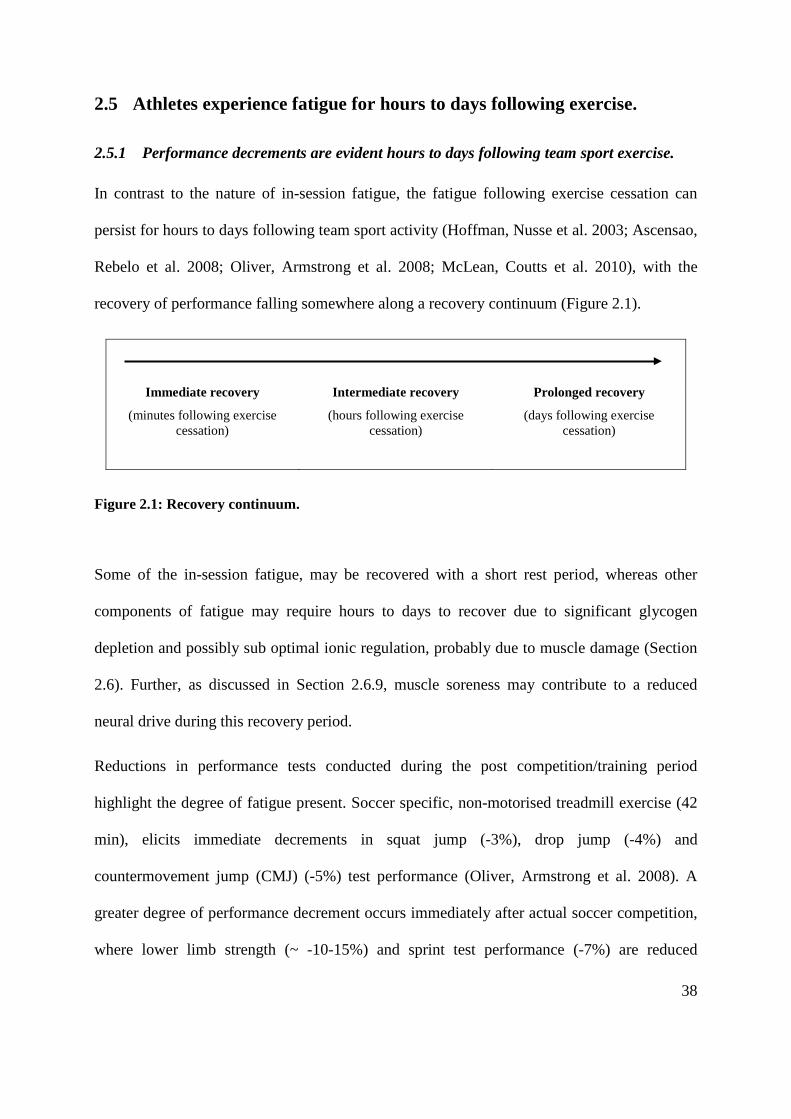
In contrast to the nature of in-session fatigue, the fatigue following exercise cessation can
persist for hours to days following team sport activity (Hoffman, Nusse et al. 2003; Ascensao,
Rebelo et al. 2008; Oliver, Armstrong et al. 2008; McLean, Coutts et al. 2010), with the
recovery of performance falling somewhere along a recovery continuum (Figure 2.1).
Immediate recovery
(minutes following exercise cessation)
Intermediate recovery
(hours following exercise cessation)
Prolonged recovery
(days following exercise cessation)
Figure 2.1: Recovery continuum.
Some of the in-session fatigue, may be recovered with a short rest period, whereas other
components of fatigue may require hours to days to recover due to significant glycogen
depletion and possibly sub optimal ionic regulation, probably due to muscle damage (Section
2.6). Further, as discussed in Section 2.6.9, muscle soreness may contribute to a reduced
neural drive during this recovery period.
Reductions in performance tests conducted during the post competition/training period
highlight the degree of fatigue present. Soccer specific, non-motorised treadmill exercise (42
min), elicits immediate decrements in squat jump (-3%), drop jump (-4%) and
countermovement jump (CMJ) (-5%) test performance (Oliver, Armstrong et al. 2008). A
greater degree of performance decrement occurs immediately after actual soccer competition,
where lower limb strength (~ -10-15%) and sprint test performance (-7%) are reduced
38

(Ascensao, Rebelo et al. 2008). Female soccer players also experience post game declines in
squat jump and CMJ test performance 24 hr following competition (Hoffman, Nusse et al.
2003). Elite AF athletes experience similar reductions in test performance as soccer players
immediately after competition. Specifically, CMJ flight time (-4%), mean power (-9%),
relative mean power (-8%), relative mean force (-2%) and flight time:contraction time
(FT:CT) (-17%) are substantially depressed immediately post game (Cormack, Newton et al.
2008a). What’s more, test performance decrements in these elite AF athletes are still evident
24 hr later with all CMJ variables still depressed (-3% to -17%). These athletes had still not
recovered three days after competition, where CMJ mean (-6%) and relative (-6%) power
were still lower than baseline (Cormack, Newton et al. 2008a). Similarly, in the 48 hr
following elite rugby league competition, players experienced reductions in CMJ FT, with
CMJ test performance recovery occurring within four days following competition (McLean,
Coutts et al. 2010).
Tournament scenarios where multiple competition games are conducted in a short period of
time elicit similar levels of fatigue to single game/training sessions. In the scenarios described
below, the level of fatigue measured through performance tests does not appear to accumulate
to a greater extent compared to after a single exercise bout. For example a three day
international handball tournament caused reductions in CMJ performance (-7%) and 20 m
sprint performance (-4%) (Ronglan, Raastad et al. 2006a). Similarly, athletes experienced
reductions in knee extension strength (-8%) and jump height (7%) after a five day handball
training camp (Ronglan, Raastad et al. 2006a). Line drill ability (-0.4%), 20 m sprint (-1%),
agility (-2%), and sit and reach (5%) performance also decreased in state level basketball
players following three games separated by 24 hr (Montgomery, Pyne et al. 2008b).
39

An accumulation of fatigue is not always present during hockey tournaments (Spencer,
Bishop et al. 2005; Jennings, Cormack et al. 2011). Such discrepancies may be due to
differences in recovery time permitted or movement analysis approach. Time motion analysis
through video footage suggests fatigue accumulation is evident during an elite, three game,
international hockey tournament, played over four days (Spencer, Rechichi et al. 2005). The
locomotive profile of these elite athletes changed across the tournament, reflecting this
fatigue. In particular, athletes spent more time standing and striding, with the number of
repeated sprints and time spent jogging decreased across the tournament (Spencer, Rechichi et
al. 2005). Yet when elite hockey players participated in a world class hockey tournament,
with six games played over nine days, exercise intensity, measured using 5 Hz GPS, was
maintained (Jennings, Cormack et al. 2011). The inclusion of recovery days separating games
two and three, three and four, and four and five may account for this difference compared to
the former study, with only one rest day separating games one and two. It is also possible that
different tactical strategies or analysis methods could explain the differences between these
studies (Rampinini, Coutts et al. 2007). High level junior soccer players also display
accumulated fatigue during a four day tournament. Indeed, repeated match-play in a
tournament led to decrements in several match-performance variables (total distance and
high-intensity running distance) and subjective ratings of fatigue and recovery (Rowsell,
Coutts et al. 2011).
In contrast to the more transient fatigue observed during exercise (Section 2.3), force deficits
due to changes in muscle function may persist for hours to days, and are observed following
team sport exercise (Section 2.5.1). This prolonged fatigue is not exclusively related to a
reduced availability of high energy phosphates, associated metabolites or Ca2+ regulation, as
these variables return close to homeostatic values within 10-60 min (Harris, Edwards et al.
40

1976; Edwards, Hill et al. 1977; Hill, Thompson et al. 2001; Petersen, Murphy et al. 2005).
Additionally, prolonged fatigue is unlikely entirely the result of changes in neuromuscular
transmission or excitation of the sarcolemma, as voluntary activation (VA) remains
unchanged in most exercise scenarios (Edwards, Hill et al. 1977; Baker, Kostov et al. 1993).
Instead the slow recovery of depleted glycogen stores associated with exercise induced
muscle damage (EIMD) (Section 2.6.3) and disruption to the musculature also through EIMD
(Section 2.6.1) are likely causes of prolonged dampened force generation. It is important to
note that damage to the musculature may influence the ability to regulate ionic balance, which
may indirectly contribute to a prolonged reduction in force generating capacity during
subsequent exercise bouts. It is customary to make a distinction between exercise induced
muscle fatigue and muscle damage, although unquestionably the two phenomena overlap
(Allen, Lamb et al. 2008). This review acknowledges the link between the two, particularly as
recovery from both muscle damage and fatigue may take hours to days, however for the
purpose of this review, each area is addressed separately. A reduced neural drive may also
contribute to a more prolonged depression in force generating capacity through the influence
of post exercise muscle soreness (Section 2.6.9). The prolonged duration to recover between
sessions becomes problematic when multiple high intensity and damaging exercise sessions
are conducted in close proximity, such as the schedule of AF athletes (Cormack, Newton et al.
2008a), particularly if depleted glycogen stores are not recovered. Indeed recovery of muscle
structures from exercise induced muscle damage (EIMD) may take 1-3 days (Friden,
Sjostrom et al. 1983; Newham, McPhail et al. 1983) as indicated by streaming, broadening
and total disruption to the sarcomere Z-lines following eccentric exercise (Friden, Sjostrom et
al. 1983). Such muscle injury is likely to elicit prolonged force depression through damage to
cellular structure and contents (Friden, Sjostrom et al. 1983; Newham, McPhail et al. 1983;
41

Jones, Newham et al. 1986; Clarkson and Tremblay 1988; Stauber, Clarkson et al. 1990;
Friden and Lieber 1992; Gibala, MacDougall et al. 1995; Hortobagyi, Houmard et al. 1998;
Lieber and Friden 1999; Friden and Lieber 2001).
2.6 Exercise induced muscle damage
2.6.1 Muscle damage impairs force generating capacity.
Exercise induced muscle damage (EIMD) involves the breakdown of muscle fibres (Lippi,
Schena et al. 2008) where cellular contents are released into the extracellular space and
circulation. Muscle damage is likely to contribute to a reduced force generating capacity in
the hours and days following exercise through disruption to the intracellular muscle structure,
sarcolemma and the extracellular matrix (Friden, Sjostrom et al. 1983; Newham, McPhail et
al. 1983; Jones, Newham et al. 1986; Clarkson and Tremblay 1988; Stauber, Clarkson et al.
1990; Friden and Lieber 1992; Gibala, MacDougall et al. 1995; Hortobagyi, Houmard et al.
1998; Lieber and Friden 1999; Friden and Lieber 2001). Prolonged reductions in neural drive
following exercise may be attributed to the muscle soreness associated with EIMD (Section
2.5.9). Further, glycogen restoration is hindered in the presence of EIMD (Section 2.5.3).
Prolonged impairment of muscle function (Friden, Sjostrom et al. 1983; Gibala, MacDougall
et al. 1995; Hortobagyi, Houmard et al. 1998); and delayed onset muscle soreness (DOMS),
stiffness and swelling (Newham, Mills et al. 1983; Jones, Newham et al. 1987; Clarkson,
Nosaka et al. 1992; Cleak and Eston 1992; Rodenburg, Bar et al. 1993) are typical outcomes
of EIMD. Accordingly, recovery research has concentrated on investigating the efficacy of
strategies to abate these outcomes (Kraemer, Bush et al. 2001a; Kraemer, Bush et al. 2001b;
Byrne, Twist et al. 2004; Duffield, Edge et al. 2008; French, Thompson et al. 2008;
Montgomery, Pyne et al. 2008a; Montgomery, Pyne et al. 2008b; Davies, Thompson et al.
2009; Jakeman, Byrne et al. 2010b; Jakeman, Byrne et al. 2010a). Evidence from histological 42

examination suggests that muscle damage is present up to three days following damaging
eccentric exercise (Friden, Sjostrom et al. 1983; Newham, McPhail et al. 1983), with
elevations in biomarkers of muscle damage such as plasma [Mb] elevated 24 hr following a
variety of exercise modalities (Refer to Table 2.2). This reiterates the need for recovery
interventions aimed at accelerating the repair of the musculature, particularly when multiple
sessions are conducted within a short period, as is the case for most team sport athletes.
2.6.2 Mechanical and metabolic factors contribute to the manifestation of exercise
induced muscle damage
Mechanical and metabolic factors act synergistically in the manifestation of EIMD
(Armstrong, Warren et al. 1991; Kuipers 1994; Sorichter, Puschendorf et al. 1999).
Mechanical stress, the strain placed on the muscle during contraction, or the application of
external forces such as a tackle (Pointon and Duffield 2012) or making contact with the
ground or opponent, contribute to EIMD. The mechanical manifestation of EIMD is depicted
through the greater prevalence of EIMD following eccentric contractions (Davies and White
1981; Armstrong, Oglivive et al. 1983; Friden, Sjostrom et al. 1983; Newham, Mills et al.
1983; Schwane, Johnson et al. 1983; McCully and Faulkner 1985; Stauber 1989).
Specifically, during muscular contraction, a lower number of fibres are recruited during
eccentric, versus concentric contractions. These individual fibres endure a greater level of
mechanical stress, increasing their susceptibility to micro-trauma, and eventuating in focal
damage (Davies and White 1981; Enoka 1996).
Metabolic deficiencies in the working muscle, typically associated with fatigue (eg ATP, see
Section 2.4.4) are hypothesised to increase the susceptibility of the muscle fibre to mechanical
stress and contribute to EIMD. This model helps explain EIMD incidence during concentric
contraction based activities. Specifically, an increased permeability of the cell membrane, due 43

to mechanical forces, facilitates an influx of Ca2+ into the cell, raising [Ca2+]i (Armstrong
1984). An elevated [Ca2+]i facilitates surges in intracellular calcium activated neutral
protease’s (CANP’s) (Sayers and Hubal 2008). Desmin and α-actinin, cytoskeletal proteins
involved in maintaining the integrity of the myofiber, are substrates for the action of calpain,
a CANP (Fridén and Lieber 1996; Lieber, Thornell et al. 1996). This leads to the degradation
of cytoskeletal proteins, increasing the susceptibility of the z-lines to contraction induced
damage (Sayers and Hubal 2008). Additionally, a reduction in [ATP]i may induce damage
within the muscle fibres, more so in the presence of severe glycogen depletion (Tee, Bosch et
al. 2007). The focal and restricted damage to fibres with almost complete glycogen depletion
in marathon runners (Warhol, Siegel et al. 1985) illustrates this point.
2.6.3 Muscle damage impairs the recovery of muscle glycogen
Glycogen depletion, and more specifically an impaired recovery of glycogen levels post
exercise, may result in performance decrements during subsequent sessions. This is
particularly true when the preceding exercise contains a substantial eccentric component.
Glycogen levels, and their role in future performance, are an example of the overlap between
muscle damage and fatigue, where muscle damage compromises the structural integrity of the
cell, impacting on future force generating capacity (fatigue).
Muscle glycogen stores become depleted during team sport competition such as soccer
(Jacobs, Westlin et al. 1982; Leatt and Jacobs 1989; Zehnder, Rico-Sanz et al. 2001;
Krustrup, Mohr et al. 2006). Post exercise glycogen accumulation is impaired in eccentrically
exercised muscle (Widrick, Costill et al. 1992). Eccentric exercise superimposed on
previously glycogen depleted muscles results in sub-optimal recovery of glycogen stores in
endurance trained men, compared to a glycogen depleted control leg (Widrick, Costill et al.
1992). These non-strength trained men completed eccentric knee extensions to fatigue 12 hr 44

following a cycle ergometer test to fatigue. Eighteen hours after exercise, the eccentrically
exercised leg contained 15% less glycogen than the control leg. After 72 h of recovery, this
difference had increased to 24% (Widrick, Costill et al. 1992). Similarly, eccentrically
exercised muscles contained 27% less glycogen than non-eccentrically exercised control
muscle after 72 hr of recovery (Costill, Pascoe et al. 1990). In untrained healthy individuals,
this may last for 10 or more days following intense 45 min eccentric cycling exercise
(O'Reilly, Warhol et al. 1987). The infiltration of phagocytic cells in the initial hours
following the exercise stimuli has been suggested as a possible mechanism modulating
carbohydrate metabolism (Costill, Pascoe et al. 1990). If multiple damage inducing exercise
sessions are conducted with minimal recovery time, for example during the hectic training
and competition schedule of athletes, they may enter subsequent exercise bouts with less than
optimal glycogen stores. The amount of high intensity activity conducted during intermittent
multiple sprint exercise is in fact compromised with low pre-exercise glycogen stores
(Balsom, Wood et al. 1999), presenting as in-session fatigue. Low glycogen levels may
impact on force generating capacity during subsequent exercise sessions. Glycogen depletion
is likely to influence Ca2+, Na+, and K+ transport through alterations to the sarcoplasmic
reticulum and Na+, K+-ATPase (Entman, Keslensky et al. 1980; Friden, Seger et al. 1989;
Okamoto, Wang et al. 2001; Dutka and Lamb 2007; Ortenblad, Nielsen et al. 2011).
Glycogen depletion may also reduce Ca2+ sensitivity of the myofilament (Helander,
Westerblad et al. 2002), and result in a reduction in tricarboxylic acid cycle intermediates,
also contributing to fatigue (Sahlin, Katz et al. 1990; Helander, Westerblad et al. 2002).
Interestingly, when young elite soccer players followed their normal diet (4.8±1.8g.kg-1 body
mass of CHO), muscle glycogen concentration had returned to pre exercise levels 24 hr
following a soccer running task designed to simulate game running profiles and cause muscle
45

glycogen depletion (Zehnder, Rico-Sanz et al. 2001). Although glycogen levels had
statistically returned to baseline levels, these athletes were experiencing an approximate 10%
deficit in muscle glycogen content at this time point. The authors note that cumulative deficits
in glycogen replenishment of 10%, as observed in this group of athletes, might provoke
decrements in future performance (Zehnder, Rico-Sanz et al. 2001).
2.6.4 Team sport activities contribute to exercise induced muscle damage.
Activities integral to successful team sport performance have the potential to elicit EIMD.
High intensity running, intermittent running, distance running, plyometrics and resistance
training each induce EIMD through the eccentric component of the stretch shortening cycle
(Armstrong, Oglivive et al. 1983; Hikida, Staron et al. 1983; Sherman, Armstrong et al. 1984;
Warhol, Siegel et al. 1985; Williams 1985; Saxton, Donnelly et al. 1994; Nicol, Komi et al.
1996; Chambers, Noakes et al. 1998; Kyrolainen, Takala et al. 1998; Avela, Kyrolainen et al.
1999; Thompson, Nicholas et al. 1999). Physical contact activities also elicit muscle damage,
indeed traditional boxing generates more pronounced increases in biochemical markers of
muscle damage ([CK] and [Mb]) versus shadow boxing (Zuliani, Bonetti et al. 1985). It is not
apparent if the movement patterns of the boxers differed between the conditions, possibly
contributing to such differences. What’s more, rugby competition tackle frequency is strongly
correlated (r=0.92, P<0.01) with biochemical indices of muscle damage [CK] (Takarada
2003).
2.6.5 Team sport athletes experience muscle damage.
Team sports that comprise a substantial level of physical contact overlaid on high volumes of
player running, elicit EIMD (Hoffman, Maresh et al. 2002; Takarada 2003; Hoffman, Kang et
al. 2005; Ascensao, Rebelo et al. 2008; Ispirlidis, Fatouros et al. 2008). This is despite the
high level of pre-conditioning that elite athletes possess due to the frequent repetition of 46

eccentric actions in their weekly training and competition cycles. Indeed, the protective effect
of prior eccentric contractions has been well established (Nosaka and Newton 2002; Bowers,
Morgan et al. 2004; Nosaka, Newton et al. 2005; Chen, Chen et al. 2009). Typical increases in
muscle soreness, biochemical markers of muscle damage and optimal angle of the muscle are
lessened during a second bout of eccentric exercise repeated as early as 48 hr later in
untrained participants (Nosaka and Newton 2002), with effects lasting up to six months
(Nosaka, Clarkson et al. 1991). What’s more, this ‘protection’ is evident in well trained
college athletes. In fact muscle damage was not exacerbated when an eccentric arm exercise
was repeated three days after the initial stimulus (Chen and Nosaka 2006). Clearly, any
intervention aiming to minimise muscle soreness and muscle damage elicited by training or
game play must provide small, but meaningful effects within the elite athlete setting, as
increases in muscle damage and soreness may be smaller in magnitude compared to untrained
individuals.
The physical contact in team sport activity contributes substantially to overall EIMD. Peak
plasma [Mb] and [CK] in one player with a bruised thigh, resulting from a tackle by an
opposing player during rugby competition, were 1.7- and 2.4-fold higher than the remaining
14 players tested (Takarada 2003). American football players experience game induced
elevations in serum [Mb] (Hoffman, Maresh et al. 2002), with concomitant increases in serum
[CK] after a ten day training camp (Hoffman, Kang et al. 2005). Soccer games, with lower
levels of physical contact than American football, AF or rugby, highlight the involvement of
game activities other than physical contact to total muscle damage. Plasma [Mb], [CK] and
[lactate dehydrogenase] ([LDH]) are all elevated following soccer competition, persisting up
to 72 hr (Ascensao, Rebelo et al. 2008; Ispirlidis, Fatouros et al. 2008).
47

2.6.6 Force production and running economy are compromised by muscle damage
Muscle function and force generating capacity are impaired following EIMD (Newham, Jones
et al. 1987; Clarkson, Nosaka et al. 1992), with reductions of more than 50 % persisting for
up to ten days after eccentric arm curl activity in untrained participants (Newham, Jones et al.
1987; Clarkson, Nosaka et al. 1992; Byrne, Twist et al. 2004). Jump test performance,
reflective of force production, is also reduced after weighted barbell squats (70% body mass
load), which, in active, non-resistance trained individuals, can persist for up to three days
(Byrne and Eston 2002), further highlighting the role of EIMD in prolonged fatigue.
Elite AF athletes spend approximately 71 % of game time running at low to moderate
velocities (<7.0 to 14.4 km.hr-1 or 1.9 to 4.0 m.sec-1) (Duffield, Coutts et al. 2009). Given the
duration spent at these velocities, running economy becomes important for overall game
performance. When running economy is high, an athlete is able to conserve more energy for
game activities that require large energy expenditure, such as jumping, tackling, accelerating
and high velocity running. Running economy in athletes may be compromised through the
modification of the normal gait pattern secondary to EIMD. Specifically, this manifests
through an altered pattern of motor unit activation, compromised range of motion about the
knee, ankle, and/or the hip, and general discomfort associated with the symptoms of DOMS
(Braun and Dutto 2003). Running economy appears less sensitive to the detrimental effects of
EIMD in untrained individuals, possibly due to less refined gait patterns (Paschalis,
Koutedakis et al. 2005).
2.6.7 Delayed onset of muscular soreness: a symptom of exercise induced muscle damage
Damage and inflammation of non-contractile connective tissue, myobifrillar membranes and
intracellular structures such as the sarcomere, following muscular overuse, or high levels of
48

impact through physical contact, result in DOMS (Jones, Newham et al. 1987; Jones,
Newham et al. 1989).
It is likely that the oedema after EIMD (Sayers and Hubal 2008) is responsible for the
sensation of DOMS (Dierking and Bemben 1998). When exercise intensity reaches a certain
threshold, myofibrilar cell membrane permeability alters, allowing the release of enzymes and
proteins into the interstitial space (Brancaccio, Limongelli et al. 2006; Brancaccio, Maffulli et
al. 2007). Consequently, capillary osmotic pressure gradients allow fluids to shift from the
vascular to the interstitial space (Wilcock, Cronin et al. 2006). Simultaneously, increases in
capillary permeability and blood flow to the sites of EIMD (Wilcock, Cronin et al. 2006)
generate abnormal increases in interstitial fluid in localised areas after tissue damage
(Armstrong 1986; Smith and Miles 2000). This oedema surrounding muscle fibers stimulates
free nerve endings (pain receptors), eliciting painful sensations in the muscle (Dierking and
Bemben 1998). It is possible that interventions that can minimise oedema will potentially
reduce the painful sensation of DOMS.
In the presence of DOMS, palpation, stretching or activation of the damaged muscle elicits
painful sensations (Byrne, Twist et al. 2004), developing within 12-24 hr following a variety
of exercises (Table 2.2), with heightened sensations 24-72 hr after exercise (Asmussen 1956;
Newham, Mills et al. 1983; Armstrong 1984; Jones, Newham et al. 1987; Newham 1988;
Jones, Newham et al. 1989; Clarkson, Nosaka et al. 1992; Cleak and Eston 1992). When
untrained participants are exposed to unaccustomed activity, DOMS prevails for 24-48 hours
(Asmussen 1956; Newham, McPhail et al. 1983); however it is not uncommon for painful
sensations to persist for three days (Thompson, Nicholas et al. 1999). Yet when untrained
participants complete protocols designed to induce very high levels of EIMD, such as passive
arm curl exercise, the duration of DOMS is at its greatest, with symptoms persisting for five 49

days (Kraemer, Bush et al. 2001b; Jakeman, Byrne et al. 2010b; Jakeman, Byrne et al. 2010a).
The duration of DOMS in untrained participants is largely dictated by the type of activity. In
contrast to untrained individuals, athletes typically experience DOMS across a shorter
duration, particularly when exposed to high intensity activity such as competition. This may
be due in part to the protective effect of prior eccentric contractions (Nosaka and Newton
2002; Bowers, Morgan et al. 2004), which in the elite training and competition environment
are repeated regularly. Indeed, when team sport athletes partake in actual or simulated game
play, athletes tend to experience DOMS for 24 – 48 hr (Dawson, Gow et al. 2005; Ingram,
Dawson et al. 2009; McLean, Coutts et al. 2010; Ascensao, Leite et al. 2011).
50

Table 2.2: The occurrence of muscle soreness following laboratory and field based exercise stimuli.
Exercise type Participant details Duration of muscle soreness
Laboratory based studies
Triceps extension and step ups until fatigue (Asmussen 1956) Female students 48 hr 15 or 20 min step test (46 cm) (Newham, Mills et al. 1983) 4 healthy normal participants Pain first evident 8-10 hr post exercise, peaked
24-48 hr post. 90 min of intermittent shuttle running and walking (Loughborough Intermittent Shuttle Test: LIST) (Thompson, Nicholas et al. 1999)
16 male students Peak at 24-48 hr, and persisted for 72 hr.
Passive arm curl exercise (Kraemer, Bush et al. 2001b) 20 non strength trained females 5 days
51.0±1.5 min downhill treadmill run (-16.5%; 8.7±0.3 km.hr-1) (Kingsley, Kilduff et al. 2006)
8 recreationally active males Immediately, 24 hr and 48 hr post exercise.
90 minute intermittent shuttle run (Bailey, Erith et al. 2007) 20 healthy males 0, 1, 24 and 48 hr post exercise.
80 min of simulated team sports exercise followed by a 20-m shuttle run test to exhaustion (Ingram, Dawson et al. 2009)
11 male team sport athletes 0, 24 and 48 hr post exercise.
Plyometric activity (Jakeman, Byrne et al. 2010b; Jakeman, Byrne et al. 2010a) Untrained females 72 hr Field based studies
Marathon (Sherman, Armstrong et al. 1984) 10 trained male runners 3 days Australian football game (sub elite) (Dawson, Hopkinson et al. 2004b) 17 well trained sub elite AF athletes 48 hr post game. Ironman Triathlon (Suzuki, Peake et al. 2006) 9 well trained triathletes Immediately post and 24 hr post race. 3 day basketball tournament (Montgomery, Pyne et al. 2008b) 29 male state level basketball players End of the tournament. Soccer game (Ispirlidis, Fatouros et al. 2008) 24 professional soccer players 0, 24 and 48 hr post game. Rugby game (McLean, Coutts et al. 2010) 12 professional rugby players 48 hr post game. Soccer game (friendly) (Ascensao, Leite et al. 2011) 20 male junior soccer players 30 min post, 24 and 48 hr post game. Australian football training (Elias, Varley et al. 2012) 14 professional Australian football
athletes 0, 1, 24 and 48 hr post training.
Australian football game (Elias, Wyckelsma et al. 2012) 24 professional Australian football athletes
1, 24 and 48 hr post game.
Rugby league game (Webb, Harris et al. 2012) 21 professional rugby league athletes 1, 18 and 42 hr post game.
51

2.6.8 Delayed onset muscle soreness is detrimental to performance indicators.
The deleterious effect of DOMS on performance is well established (Armstrong 1986;
Clarkson, Nosaka et al. 1992; MacIntyre, Reid et al. 1995; Dierking and Bemben 1998;
Clarkson and Sayers 1999; Rawson, Gunn et al. 2001; Braun and Dutto 2003). Although
muscle soreness is a symptom of muscle damage, these parameters are investigated
independently using different tools. The occurrence of DOMS is ascertained through
questionnaires of the individuals’ level of soreness, whereas muscle damage is determined
through obtaining concentrations of biochemical markers of muscle damage found in the
blood (Brancaccio, Limongelli et al. 2006), through the muscle biopsy technique (Friden and
Lieber 1992), ultrasound (Warren, Lowe et al. 1999), diffusion tensor imaging and magnetic
resonance imaging (McMillan, Shi et al. 2011).
Muscle soreness is accompanied by an attenuation of maximal force in the affected muscles,
both for voluntary and involuntary contractions (Armstrong 1986; Clarkson, Nosaka et al.
1992; MacIntyre, Reid et al. 1995; Clarkson and Sayers 1999; Braun and Dutto 2003). When
DOMS affects muscles around a particular joint, there is typically a reduction in range of
motion of that joint (Dierking and Bemben 1998; Rawson, Gunn et al. 2001; Lee, Goldfarb et
al. 2002). Of practical significance, functional impairments associated with DOMS
(Armstrong 1986; Clarkson, Nosaka et al. 1992; MacIntyre, Reid et al. 1995; Dierking and
Bemben 1998; Rawson, Gunn et al. 2001; Braun and Dutto 2003) may impact an athlete’s
weekly preparation for competition. Reciprocal inhibition around a joint also acts as a
protective mechanism in response to the pain associated with movement when experiencing
DOMS (Willer 1977; Sandrini, Serrao et al. 2005). This may interfere with the athletes
normal biomechanics when completing conditioning and skill based tasks.
52

Despite a poor relationship with histological evidence of muscle damage (Newham, Mills et
al. 1983; Jones, Newham et al. 1986) and measures of muscle function (Newham, Mills et al.
1983; Rodenburg, Bar et al. 1993; Nosaka, Newton et al. 2002), DOMS is commonly used as
a gauge of EIMD. This assumption can lead to practical problems when the absence of
DOMS is used as a signal to resume normal training, particularly as the muscle is likely to
remain in a compromised state (Byrne, Twist et al. 2004). Specifically, function may be
impaired before soreness actually arises (Jones, Newham et al. 1986; Rodenburg, Bar et al.
1993; Nosaka, Newton et al. 2002).
2.6.9 Central fatigue, muscle damage and muscle soreness: a possible interaction.
Central fatigue may play a role in prolonged fatigue through its overlap with muscle damage,
specifically the soreness ensuing from such exercise. It has been hypothesised that muscle
soreness, secondary to damage inducing exercise, may reduce neural drive to the muscles
(Racinais, Bringard et al. 2008). For example, motor system excitability can be modified by
experimental tonic pain induced either in muscles or in subcutis (layer of connective tissue
below the dermis) (Le Pera, Graven-Nielsen et al. 2001). This inhibition of motor evoked
potentials was observed during the peak-pain and persisted also after the disappearance of the
pain sensation (Le Pera, Graven-Nielsen et al. 2001). It has also been suggested that increased
group III and IV muscle afferent inputs may induce H-reflex depression when muscle
soreness progresses as muscle pain is believed to reflect activity in group III and IV muscle
afferents (O'Connor and Cook 1999). As such, muscle soreness may reduce the neural drive to
the muscles, and reduce force generating capacity and performance. There is also a conscious
element to central fatigue during exercise, where the individual may feel that the sensations
(of soreness) are not tolerable and intentionally lower the level of activity or intensity of
exercise (Taylor, Allen et al. 2000). This becomes problematic in the elite sporting world.
53
Athletes are commonly required to compete in weekly competition, as well as multiple
training sessions before competing again, often with only short recovery periods provided.
Central fatigue secondary to EIMD may also be detrimental to game performance in
tournament scenarios, where multiple competitive games are conducted with minimal
recovery time. In some cases, more than one game is played per day, for example during
rugby sevens tournaments, further compounding this fatigue.
2.7 Recovery is an important component of the athletes training schedule
Complete recovery from exercise is defined as the post exercise return of variables to a pre-
exercise homeostatic range (Calder 1990; Calder 1991). Rest alone, given time, will normally
achieve this (Kentta and Hassmen 1998). When either 1) the athlete has failed to recover
within this time; or 2) 72 hr are not available to dedicate to rest for recovery (Kentta and
Hassmen 1998), actions may need to be taken to accelerate natural recovery processes.
Accordingly, recovery interventions are incorporated into the training program. Such
interventions are adopted with the intent to return test performance parameters to pre-exercise
levels (Duffield, Edge et al. 2008; Montgomery, Pyne et al. 2008b; Vaile, Halson et al. 2008a;
Duffield, Cannon et al. 2010) and to abate perceptions of muscle soreness and fatigue
(Duffield, Edge et al. 2008; Montgomery, Pyne et al. 2008b; Vaile, Halson et al. 2008b). On a
mechanistic level, such interventions also endeavour to reduce circulating concentrations of
biochemical indicators of muscle damage and inflammation (Gill, Beaven et al. 2006;
Montgomery, Pyne et al. 2008a). Specifically, inflammation exacerbates existing disruptions
to skeletal muscle tissue, as this immune response is coupled with secondary damage via
transient hypoxia as well as the non-specific cytotoxic actions of leukocytes (MacIntyre, Reid
et al. 1996; Kyriakides, Austen et al. 1999; Owen, Wong del et al. 2011). The importance
54

however of reducing biochemical indicators of muscle damage to functional impairments
remains to be elucidated. See section 2.9.2 for more detail.
Recovery interventions also aim to allow the athlete to tolerate higher training loads, and to
optimise the quality at which they perform each session. A plethora of recovery interventions
have been suggested to successfully augment recovery and are frequently incorporated into
the athlete’s schedule, despite sufficient evidence to confirm their effectiveness and validity in
athletic scenarios.
The consequences of inadequate recovery are likely tied to the training principle
supercompensation. Ultimately, physical preparation is underpinned by supercompensation,
whereby the breakdown (training) process is succeeded by the recovery process, resulting in
an ‘overshoot’ or rebound in adaptation and performance improvement (Viru 1984). Training
and recovery constitute the two underpinning factors related to supercompensation. When
multiple training-recovery cycles are completed with inadequate recovery, residual fatigue,
muscle damage, inflammation and soreness from previous sessions build up (Duffield, Edge
et al. 2008; Montgomery, Pyne et al. 2008a). Such a mismatch has the potential to lead to the
accumulation of fatigue and training stressors which take time to recover from, ultimately
impairing the athlete’s performance.
2.7.1 Recovery and Australian Football
There is a growing body of research investigating recovery interventions following AF
competition and training (Dawson, Gow et al. 2005; Elias, Varley et al. 2012; Elias,
Wyckelsma et al. 2012; Bahnert, Norton et al. 2013). Stretching, pool walking and hot
showers alternated with cold water immersion immediately post game, in addition to a
standard ‘next day’ pool recovery session (25-30 min) compared to a control were
55

investigated in sub elite AF athletes (Dawson, Gow et al. 2005). The rapidity of recovery of
muscle soreness 15 hr following competition was not different between conditions. Yet
players who partook in a recovery condition were better able to maintain vertical jump, and 6
second cycling performance 15 hr after the game compared to the control condition, where
decrements were actually observed in these parameters. Performance ratios indicated that pool
walking produced a greater recovery of vertical jump performance 15 hr post game compared
to the control group (Dawson, Gow et al. 2005). In those same athletes, the recovery of
cycling power during a six second maximal test was enhanced with the use of stretching for
recovery compared to the control group (Dawson, Gow et al. 2005). Effects for both recovery
conditions were reported as moderate to large (ES>0.3) (Dawson, Gow et al. 2005). However,
this superior recovery compared to the control was diminished 48 hr post game, with no
differences between conditions. The authors concluded that the recovery of muscle soreness,
flexibility and power at 48 hr post game was not enhanced by performing an immediate post
game recovery beyond that achieved by performing only next day recovery training (Dawson,
Gow et al. 2005).
Elias and colleagues investigated the use of cold and contrast water immersion after elite AF
training (Elias, Varley et al. 2012) and competition. After elite AF training, for restoring
physical performance and psychometric measures, cold water immersion was more effective than
contrast water immersion, with passive recovery being the least effective. Twenty four hours after
training, repeat-sprint time had deteriorated by 4.1% for athletes in the passive treatment, and
1.0% for contrast water immersion, but was fully restored with the use of cold water immersion
(0.0%). What’s more, 24 and 48 hr after training, both immersion treatments attenuated changes
in mean muscle soreness, with cold water immersion (0.6±0.6 and 0.0±0.4) more effective than
contrast water immersion (1.9±0.7 and 1.0±0.7) and passive recovery exerting a minimal effect
56

(5.5±0.6 and 4.0±0.5). Similarly, after 24 and 48 hr, both immersion treatments effectively
reduced changes in perceived fatigue, with cold water immersion (0.6±0.6 and 0.0±0.6) being
more successful than contrast water immersion (0.8±0.6 and 0.7±0.6) and the passive treatment
having the smallest effect (2.2±0.8 and 2.4±0.6) (Elias, Varley et al. 2012).
Similar results were observed after elite AF competition (Elias, Wyckelsma et al. 2012). Repeat-
sprinting performance remained slower 24 and 48 hr after the game for athletes receiving the
passive (3.9% and 2.0%) and contrast water immersion treatments (1.6% and 0.9%), but was
restored with cold water immersion (0.2% and 0.0%) use. Soreness after 48 hr was most
effectively attenuated by cold water immersion (ES 0.59±0.10) but remained elevated for athletes
who used contrast water immersion (ES 2.39±0.29) or no immersion at all (ES 4.01±0.97).
Similarly, cold water immersion more successfully reduced fatigue after 48 hr (ES 1.02±0.72)
compared to contrast water immersion (ES 1.22±0.38) and passive recovery (ES 1.91±0.67).
Declines in static and countermovement jump were also ameliorated best by cold water
immersion (Elias, Wyckelsma et al. 2012).
A more recent study tracked elite AF athletes across a 23 game season monitoring a full squad
of 44 footballers on a weekly basis (Bahnert, Norton et al. 2013). Players were required to
choose from a number of recovery modalities available immediately post-game. These
included floor stretching, pool stretching, bike active recovery, pool active recovery, cold-
water immersion, contrast therapy and use of a compression garment. Perceptual measures of
recovery were recorded throughout the week and a test of physical performance was
conducted two days post-game. Game performance ratings were also recorded. Perceptual
recovery among players was enhanced through the selection of specific combinations of
recovery protocols post game. However, no links were found between recovery protocols and
physical or game performance measures. Players who chose cold water immersion, floor
57

stretching, use of a compression garment and no active recovery (either bike or pool) in
varying combinations post game, had an increased probability of also reporting greater
perceptual recovery in the following week. The inclusion of the cold water immersion
modality was part of all five protocols that significantly enhanced perceived recovery. There
was an average of about twice the probability of feeling ‘recovered’ versus ‘un recovered’
when cold water immersion was included as part of the recovery protocol post game. The
authors noted that players varied in their preferred combinations of post-game recovery
modalities. They suggested that such variety reflects personal preference and perceived
benefit and the fact that relatively little specific guidance can be confidently provided by
conditioning staff concerning optimal recovery (Bahnert, Norton et al. 2013).
The pool of research presently available suggests that cold water immersion plays an
important role as a post training and game recovery modality. However little is known
regarding the efficacy of compression garments in this scenario.
2.8 Compression garments: a practical tool used to assist post exercise
recovery
2.8.1 Garment considerations
Compression as a treatment for human disease dates back to Hippocrates 450 BC, utilised
primarily in the treatment of venous disorders and leg ulcers (Gladfelter 2007). This
progressed to body wrapping in the treatment of soft tissue injury to minimise swelling and
edema and to minimise scar tissue formation following burns (Gladfelter 2007). The
introduction of synthetic fabrics in 1983, including nylon, in addition to the progressive
development of women’s undergarments, saw the increase in the number of surgeons using
58

commercially available undergarments in postoperative care of patients (Gladfelter 2007).
Today, compression garments are designed to cover a small section such as the part of a limb
or to cover whole body segments such as items of clothing, e.g. pants and tops.
Compression garments are constructed from an elastic material, with a graduated compression
design most commonly adopted (Linnitt and Davies 2007a). Compression is measured in
millimetres of mercury (mmHg), which refers to the pressure exerted at the ankle by the
garment at rest (100% of the compression is at the ankle, this then reduces to 40% at the thigh
(Figure 2.3).
Figure 2.2 Graduated Compression Garments Source: (Linnitt and Davies 2007b)
There are differing classifications of compression available, including the German RAL
GZ387 (for Hohenstein Institute tested hosiery), French Standard ASQUAL and British
Standard BS 6612 (Figure 2.4) (Bianchi and Todd 2000; Clark and Krimmel 2006; Linnitt
and Davies 2007a). Sports compression garments typically fall into the lower of the three
59

classes, class I, due to the lower level of compression exerted, with medical garments
typically being allocated class II and III.
Figure 2.3 Classification of compression Source: Linnitt and Davies 2007
As a broad principle, the level of compression is directly proportional to the tension with
which the compression device is applied, and inversely related to the size of the limb
according to Laplace’s Law (Clark and Krimmel 2006). The tension exerted by a compression
garment is related to both the type of yarn used in its construction, and the knitting technique
used to produce the fabric. The fabric selected to make compression garments is produced by
knitting two types of yarn together. Inlay yarn provides the compression and body yarn
delivers the thickness and stiffness of the knitted fabric (Figure 2.5) (Clark and Krimmel
2006).
A
B
Figure 2.4: The arrangement of inlay and body yarn in flat knit (A) and circular knit fabric (B). Source: Clark and Krimmel 2006.
60

Both types of yarn are produced by wrapping polyamide or cotton around a stretchable core
such as latex or elastane (Lycra) (Figure 2.6). The wrapping can be adjusted to vary the
stretchability and power of the yarn. The stretchability is a measure of how far the yarn can be
elongated, and the power is a measure of how easily it stretches. High power yarn is less easy
to stretch and is stiffer than its low power counterpart, and thus applies greater compression
(Figure 2.6). The thickness, texture and appearance of the knitted fabric can also be changed
by adapting the wrapping of the yarn. Higher levels of compression are achieved by
increasing the thickness of the elastic core of the inlay yarn, although adjustments may also be
made to the body yarn (Clark and Krimmel 2006).
Figure 2.5: The fibres that make up body and inlay yarn. The wrapping of the outer fibre
around the stretchable core can be adjusted to vary the stretchability and power of the yarn.
Looase wrapping (a) means the yarn has more stretch and less power than a yarn in which the
fibres are tightly wrapped (b). Source: Clark and Krimmel 2006.
Proper fit is essential in the optimisation of compression garment use (Kraemer, Bush et al.
1996). With high compression or with compression used to treat extreme soft tissue injury,
compression may augment feelings of discomfort during the period the garment is used 61

despite the positive results because of mechanical blocking of edema (Kraemer, Bush et al.
1996; Kraemer, Bush et al. 2001a; Kraemer, Bush et al. 2001b; Silver, Fortenbaugh et al.
2009). Proper fit (e.g. seams not problematic or constrictive) and feel (e.g. garment material)
are important mediators of garment efficacy, particularly when worn for long periods of time.
Adequate compression and proper construction create the potential for optimal skin contact,
which is vital for proprioception (Kraemer, Flanagan et al. 2010). It is also an important
consideration that garment movement is minimal and stays in contact with the skin to prevent
air bubbles breaking the linkage with the skin, and thus the stimulation of skin receptors
(Kraemer, Flanagan et al. 2010).
Today, commercially available sports compression garments are worn by individuals ranging
from recreational exercisers to elite athletes in a bid to accelerate post exercise recovery and
to gain an edge over their opponent. Thirty one studies have investigated the effect of wearing
compression garments on indicators of performance and recovery from exercise, with sixteen
focused specifically on recovery from exercise (Born, Sperlich et al. 2013). Yet only three
studies have explored compression garment use exclusively during the recovery period, with
elite athletes in actual sporting scenarios (Gill, Beaven et al. 2006; Montgomery, Pyne et al.
2008a; Montgomery, Pyne et al. 2008b). Compression garments are widely used by team
sport athletes in training and competition scenarios to aid their recovery. It is clear that despite
the current body of research on compression garments, little is known regarding their efficacy
for these elite athletes in actual training and competition scenarios.
2.8.2 Compression garment mechanisms
Section 2.4 discussed potential causes and mechanisms of fatigue that may contribute to in-
session and between session fatigue. It is unlikely however that compression garments will
influence these physiological factors. Instead, clinically, compression garments exert positive 62

actions through alterations to the vascular and lymphatic systems (Swedborg 1984; Mayberry,
Moneta et al. 1991; Yasuhara, Shigematsu et al. 1996; Johansson, Lie et al. 1998; Jonker, de
Boer et al. 2001; Beidler, Douillet et al. 2009). Specifically, these garments compress
superficial limb tissues, which in turn compress underlying superficial veins, reduce their
diameter, increase blood flow velocity and reduce pooling (Morris and Woodcock 2004). A
reduction in pooling in the deep veins may lessen the risk of stasis during surgery, prevent
travel deep vein thrombosis and minimise deep venous insufficiency (DVI) (Morris and
Woodcock 2004). In deep veins such as the popliteal vein, peak flow velocity and vein
diameter increase when wearing compression garments in both healthy patients and those
suffering DVI (Mayberry, Moneta et al. 1991). The authors state that this increase may reflect
an increase in deep venous blood flow as a result of compression of the superficial venous
system by the compression garment (Mayberry, Moneta et al. 1991). Over the course of daily
activity, or simulated daily activity, oedema and swelling in the legs of healthy individuals is
reduced with compression stocking application (14–18 mmHg at the ankle) (Jonker, de Boer
et al. 2001) and compression hosiery (7.6–15.4 mmHg at the ankle) (Kraemer, Volek et al.
2000). These effects presumably result from a reduced hydrostatic pressure gradient across
the vessel walls. Reductions in lymphodema also occur with the use of compression garments
in a variety of patients such as mastectomy patients (Swedborg 1984), leg lymphodema
patients (Yasuhara, Shigematsu et al. 1996), post-operative leg lymphodema patients
(Johansson, Lie et al. 1998), and healthy volunteers with no symptoms of chronic venous
insufficiency (Jonker, de Boer et al. 2001). Ultimately, these physiological changes act to aid
the natural action of the ‘muscle pump’. Wearing compression garments also blunts the pro-
inflammatory cytokine response in patients suffering from DVI and leg ulcerations (Beidler,
Douillet et al. 2009). Elderly patients with myocardial infarct also benefit from wearing
63

compression garments. Specifically, patients experienced increases in calf blood volume,
facilitating reductions in deep vein thrombosis (Mayberry, Moneta et al. 1991). These
physiological mechanisms, attributed to the positive actions of compression garments, have
been predominantly investigated in clinical settings, yet the manufacturers of sports
compression garments hypothesise that such clinical effects are transferable to a healthy, elite
athlete population. However, as it is presumed that the vascular and lymphatic systems of
these individuals are well functioning, it is unknown if such a leap from clinical to athletic
populations can be made. Indeed, these mechanisms may not actually be operational due to
the absence of pathologies in this population group.
Tissue oxygenation is increased when wearing compression garments during exercise tasks
(Dascombe, Hoare et al. 2011; Coza, Dunn et al. 2012). At slower running velocities (8–10
km.h–1), wearing either an undersized (21.7±4.3 mmHg at ankle) or regular size (19.2±3.2
mmHg at the ankle) full lower body compression garment significantly increased muscle
blood flow and oxygen utilization, as well as oxygen pulse compared with the control
condition in well trained middle-distance runners and triathletes (Dascombe, Hoare et al.
2011). During the faster running velocities (>12 km.h–1), both garments significantly
increased deoxygemoglobin concentration of the vastus lateralis, which coincided with a
decrease in heart rate and tissue oxygenation index, suggestive of an improvement in venous
flow and cardiac return (Dascombe, Hoare et al. 2011). Similar observations have been made
in recreationally active participants. Tissue oxygenation during isolated calf exercise
increased with the use of compression garments compared to a control (Coza, Dunn et al.
2012). The garment type used was not revealed. It is unknown if increases in tissue
oxygenation are seen when such garments are worn purely in the post exercise period.
64

The mechanism by which wearing compression garments may facilitate an enhanced recovery
following damaging exercise scenarios is likely to be different to that in a clinical setting.
Some authors suggest that wearing compression garments permit the limbs to remain in
anatomical positions when not used and that this restriction in movement enhances the
regeneration and repair process (Kraemer, Bush et al. 1998a; Kraemer, Bush et al. 2001a;
Kraemer, Bush et al. 2001b). However, it is not entirely clear how this may actually enhance
such processes, nor do the authors provide any evidence or explanation for possible
mechanisms.
It is theorised that compression garments may help reduce possible secondary muscle
damage, initiated by metabolic/chemical pathways which may create further damage due to
factors such as Ca2+ influx, decreased membrane resistance, and free-radical production
(Montgomery, Pyne et al. 2008a). The authors provide no evidence that this may in fact be the
case or even plausible. It is unclear as to exactly how abating secondary muscle damage
would actually occur consequent to the use of compression garments. It is also suggested that
wearing compression garments may accelerate the restoration of membrane permeability, as
highlighted by lower levels of biomarkers of damage (Montgomery, Pyne et al. 2008a)
measured during recovery. Yet once again, no evidence is presented to support this theory.
Indeed, simply observing a lower concentration of such biomarkers of damage does not
indicate restoration of membrane permeability. It is postulated that alterations to the vascular
(Mayberry, Moneta et al. 1991) and lymphatic (Jonker, de Boer et al. 2001) systems when
wearing compression garments are able to hasten the removal of biochemical markers of
muscle damage. It is theorised that following initial injury a cascade of events occur during
the inflammatory and repair process whereby neutrophils are released (Hurme, Kalimo et al.
1991; Tidball 1995) initiating the phenomena of secondary damage (Smith, Kruger et al.
65

2008). Neutrophils generate free radicals during phagocytosis (Evans and Cannon 1991), with
neutrophil depletion prior to ischaemia-reperfusion injury reducing muscle damage by almost
40% in mouse skeletal muscle (Kyriakides, Austen et al. 1999). Blood flow increases due to
compression garment use (Mayberry, Moneta et al. 1991) are hypothesised to increase the
clearance of biochemical indices from the site of damage, and thus the concentration in the
blood. This may provide an indirect indication of an increased clearance of neutrophils from
the site of damage, and possibly attenuate secondary muscle damage. It remains purely
speculative if [Mb] provides an indication of neutrophil clearance from the site of injury, and
if secondary muscle damage contributes significantly to overall muscle damage and thus the
general recovery process.
It is more plausible that mechanical blocking of oedema, elicited by wearing compression
garments (Kraemer, Bush et al. 2001a; Kraemer, Bush et al. 2001b) may minimise the
sensations of muscle soreness, lessening the stimulation of free nerve endings by exercise
induced oedema (Dierking and Bemben 1998). Specifically, the compression garments may
increase the hydrostatic pressure applied to the muscle tissue, facilitating lymphatic drainage
and reducing fluid extraction from the capillaries (Kraemer, Bush et al. 2001a). Such
reductions in muscle soreness are suggested to improve the functional muscle capacity
(Jakeman, Byrne et al. 2010a). It is well established that muscle soreness is detrimental to
subsequent performance (Armstrong 1986; Clarkson, Nosaka et al. 1992; MacIntyre, Reid et
al. 1995; Dierking and Bemben 1998; Clarkson and Sayers 1999; Rawson, Gunn et al. 2001;
Braun and Dutto 2003). By reducing oedema with the use of compression garments following
damaging exercise, the degree of muscle soreness, and possibly the associated performance
impairment, may be lessened. As discussed in Section 2.5.9, this may help minimise the
impact of a reduced neural drive associated with muscle soreness on subsequent performance.
66

Research however is yet to confirm such a relationship, with possible associations only
speculated.
Vertical muscle oscillation is reduced when wearing compression garments. Longitudinal and
anterior-posterior muscle oscillation of the thigh are decreased during vertical jump landing
when compression shorts were worn versus loose fitting shorts (Doan, Kwon et al. 2003).
Similar results were seen during a vertical jump landing study where compression shorts were
compared to a control (Kraemer, Bush et al. 1998a). This was accompanied by a greater
ability to maintain power output during repeated vertical jumps when wearing the
compressive garment (Kraemer, Bush et al. 1998a). Reductions in oscillatory disruption of the
musculature being compressed by the garment may reduce the amount of fatigue due to
enhanced neurotransmission and more optimal mechanics at the molecular level of the muscle
(McComas 1996). The reduction in muscle movement may be important in augmenting
repetitive jump performance by producing a short ground contact (Kraemer, Bush et al.
1998a). Reduction in muscle movement and other oscillation related fatigue mechanisms
require further study. It is plausible that a reduction in such oscillation related fatigue may
improve recovery of performance measures such as a jumping task even when the garment
has been removed.
Proprioception is positively influenced by compression garment use (Kraemer, Bush et al.
1998a; Pearce, Kidgell et al. 2009). When active males and females replicated hip positions
while supine, when wearing compression garments compared to control, error scores were
lower at 45° and 60°, while no differences were detected at 30° and 90° (Kraemer, Bush et al.
1998a). The authors postulated surface compression could act on receptors in the skin to
enhance proprioception (Barrack, Skinner et al. 1989; Perlau, Frank et al. 1995), particularly
when the limb is distanced from an endpoint of the range of motion.
67

The question of the level of compression required in recovery scenarios to elicit positive
physiological, performance and perceptual responses in elite athletes remains unknown.
Indeed, much of the research underpinning physiological actions of compression garments has
been established using medical, high level, compression garments, particularly within clinical
settings as discussed above. Despite this, sports, but not medical compression garments, have
been used to investigate the potential enhancement of post exercise recovery. It was suggested
in the 1980’s, in a clinical environment, that the pressure exerted by compression garments
should be at least 18 mmHg at the ankle, and 8 mmHg at the level of mid-thigh in lower limb
garments (Lawrence and Kakkar 1980). A similar ‘pressure requirement’ of compression
garments to obtain optimal physiological and recovery responses in elite-athletes has not been
investigated, and thus current recommendations for compression levels have not been made.
Research has recently explored differences between compression garments offering high and
low levels of compression in their efficacy to enhance performance and elicit physiological
alterations (Ali, Creasy et al. 2011; Dascombe, Hoare et al. 2011). These investigations have
been limited to during exercise only, with no exploration as to differences in recovery
efficacy. Ali and colleagues had male and female competitive runners complete a 10 km time
trial on an outdoor 400 m track wearing either control (0 mmHg), low (12–15 mm Hg),
medium (18–21 mmHg), or high (23–32 mmHg) knee high graduated compression garments
in a randomized counterbalanced order (Ali, Creasy et al. 2011). Time trial performance was
not different between groups, however low and medium compression garments resulted in
greater maintenance of leg power (CMJ height) after the time trial versus control and high
compression garments. The authors found no difference in physiological measures (lactate
and heart rate), with similar rating of perceived exertion (RPE) values with each garment
type. There were however treatment effects for perceptions of compression garment comfort,
68

where the low level garment was more comfortable than medium and high. The high level
garment was also perceived as tighter than all other groups, with the medium garment tighter
than low and control (Ali, Creasy et al. 2011).
Similarly, Dascombe et al (2011) failed to detect performance differences between a regular
fit and an undersized lower body compression garment. Well trained triathletes and middle
distance runners completed separately, a progressive maximal test and a time to exhaustion
test at 90% V.O2max on a motorised treadmill wearing either a manufacturer recommended
‘normal’ fitting (19.2 ± 3.2 mmHg calf region and 13.7 ± 2.3 mmHg thigh region), or
undersized (21.7 ± 4.3 mmHg calf region and 15.9 ± 2.6 mmHg thigh region) full lower body
compression garment. Under the control condition participants wore loose fitting shorts
exerting minimal compression. At slower running velocities (~8–10 km.hr-1), both
compression garment conditions significantly increased muscle blood flow, oxygen utilization
and oxygen pulse compared with control. During the faster running velocities (>12 km.hr-1),
both garment conditions significantly increased the deoxyhemoglobin concentration within
the vastus lateralis, which coincided with a decrease in heart rate and tissue oxygenation
index. This is suggestive of an improvement in venous flow and cardiac return. However, no
performance improvements were observed between the garment conditions. The authors note
that overall, the limited physiological changes and absence of performance benefits while
wearing the undersized compared with the regular sized garment and control conditions
suggest that increasing the compression gradient of lower body compression garments did not
benefit endurance running performance (Dascombe, Hoare et al. 2011).
During the progressive maximal test, a significant decrease in heart rate was observed in both
garment conditions during moderate intensity running (12–16 km.hr-1). The authors postulate
that this may be the result of an increase in venous return and subsequent stroke volume, via 69

the Frank- Starling mechanism (Moss and Fitzsimons 2002). Indeed, this finding supports
previous research that has reported a non significant trend for heart rate to be lower during a
10 km run when wearing lower body compression garments (Ali, Caine et al. 2007). In
support of the hypothesis of improved venous function and return, the deoxyhemoglobin
concentration within the vastus lateralis was significantly increased in the regular sized
garment condition across several speeds (approx. 10–16 km.hr-1). Wearing both garment types
increased oxygen consumption and oxygen pulse at 8 km.hr-1 (Dascombe, Hoare et al. 2011).
Yet these results contrast those presented by Bringard and colleagues (2006) who reported
that wearing lower body compression garments significantly lowered the oxygen required and
improved the metabolic efficiency during submaximal running (ie 12 km.hr-1). However
Dascombe et al suggest their results indicate an increased oxygen requirement at lower
running velocities to overcome the increased resistance to movement that wearing lower body
compression may cause.
Although the work of Ali et al (2011) and Dascombe et al (2011) highlighted no advantage to
wearing garments offering higher levels of compression, it is unknown if compression
differences would elicit different recovery responses when worn purely as a recovery tool.
Indeed, a direct comparison of medical (high level compression) and sports compression (low
level compression) garments in an athletic population in the post exercise period is warranted.
2.8.3 Compression garments as a recovery tool in un-trained populations
Wearing compression garments exerts the strongest positive effects on post exercise recovery
in untrained individuals, notably following severely damaging protocols (Kraemer, Bush et al.
2001a; Kraemer, Bush et al. 2001b). In untrained individuals, wearing a compressive arm
sleeve enhances recovery beyond a control treatment one to five days following passive
isokinetic dynamometry arm curl exercise (Kraemer, Bush et al. 2001a; Kraemer, Bush et al. 70

2001b; Jakeman, Byrne et al. 2010b; Jakeman, Byrne et al. 2010a). Higher torque and power
values in addition to superior elbow angle maintenance resulted when participants wore the
compressive arm sleeve (Kraemer, Bush et al. 2001a; Kraemer, Bush et al. 2001b). Further,
these participants experienced lower levels of soreness with active range of motion, and
palpation two to five days after exercise compared to their control counterparts (Kraemer,
Bush et al. 2001a; Kraemer, Bush et al. 2001b). During the recovery period, global
assessments of soreness were lower (days four and five) when wearing compression garments
compared to no compression (Kraemer, Bush et al. 2001b). Wearing the compressive arm
sleeve also blunted the normal elevation in serum [CK], however serum [LDH] and serum
[cortisol] were not influenced by compression garment use (Kraemer, Bush et al. 2001a;
Kraemer, Bush et al. 2001b). No changes in serum [LDH] were observed during the recovery
period compared to pre-exercise values, explaining why compression did not alter serum
[LDH]. It is important to note that plasma concentrations of such markers reflect not only the
rate of release of these proteins and enzymes, but also the rate of removal of such markers
from the plasma. Thus it is difficult to determine if concentrations reflect changes to clearance
rates alone when using interventions such as compression garments. Participants wearing the
compression garments also experienced less swelling compared to the control condition, as
indicated through changes in bicep circumference measured with a spring loaded tape
measure (Kraemer, Bush et al. 2001a; Kraemer, Bush et al. 2001b). It is likely that the
compression garments produced a mechanical blocking of oedema (Kraemer, Bush et al.
2001a; Kraemer, Bush et al. 2001b), which could have lessened the perception of muscle
soreness, through reducing the stimulation of free nerve endings by exercise induced oedema
(Dierking and Bemben 1998).
71
Untrained females experienced an improved recovery when wearing compression garments
for 12 hours following plyometric activity, compared to their control counterparts (Jakeman,
Byrne et al. 2010b; Jakeman, Byrne et al. 2010a). These participants experienced an
accelerated recovery of test performance, specifically squat jump, CMJ and isokinetic muscle
strength, 24 to 96 hr following the preceding plyometric activity (Jakeman, Byrne et al.
2010b; Jakeman, Byrne et al. 2010a). Further, one hour post exercise, those wearing
compression garments experienced lower perceptions of muscle soreness, with effects lasting
up to 76 hr. The authors attribute this to the garment abating oedema (Jakeman, Byrne et al.
2010b; Jakeman, Byrne et al. 2010a). Interestingly, the improved test performance and
perception of muscle soreness after, wearing a compression garment did not facilitate lower
levels of plasma CK beyond the control participants, despite substantial elevations in both
groups (Jakeman, Byrne et al. 2010b; Jakeman, Byrne et al. 2010a).
2.8.4 Compression garments as a recovery tool in trained populations
When worn for recovery, the most consistently reported positive action of compression
garments on trained individuals is the blunting of muscle soreness (Duffield, Edge et al. 2008;
French, Thompson et al. 2008; Montgomery, Pyne et al. 2008b; Davies, Thompson et al.
2009; Duffield, Cannon et al. 2010). Accelerated recovery of performance and biochemical
variables, however appears less likely. Based on the research presented below, it is difficult to
decipher clear guidelines regarding compression garment use in trained individuals for the
purpose of enhancing recovery.
It is unclear as to whether compression garment use following resistance exercise is beneficial
for recovery in resistance trained individuals. Countermovement jump height was maintained
when wearing compression garments overnight (12 hr) following resistance exercise
compared to a control (French, Thompson et al. 2008). Of concern, 30 m sprint performance 72

was actually 2 % slower in the treatment group, but not in the control group. However, lower
soreness was evident in the compression garment group compared to the control (French,
Thompson et al. 2008). It appears, in this population group, that there is dissociation between
the recovery performance and perceptual measures. The recovery of elbow flexion and
extension angle, and not force production, correlates with measures of soreness (Rodenburg,
Bar et al. 1993), possibly explaining this uncoupling. In that same study, wearing
compression garments did not influence post exercise serum [Mb]. In both the control and
treatment group the [Mb] had fully recovered in the 24 hr period post exercise (French,
Thompson et al. 2008). It remains unclear if compression garments enhance recovery at some
stage in the first 24 hrs, but it is clear that at 24 hrs the recovery state is identical. Despite
reductions in muscle soreness, compression garment use did not influence serum [CK], even
though unlike serum [Mb], serum [CK] was still elevated 24 hr after the exercise.
Compression garments were also ineffective at abating swelling, as measured by mid-calf and
thigh girth, in these participants. However mid-thigh girth was only elevated immediately post
exercise, and only in the control group, making comparisons difficult (French, Thompson et
al. 2008). Wearing compression garments contributed to higher feelings of vitality in recovery
following resistance exercise, in resistance trained individuals (Kraemer, Flanagan et al.
2010). It is possible that this sensation is associated with placebo effects.
Five minute maximum cycling power of trained elderly cyclists was maintained to a greater
extent when compression garments were worn for 80 minutes following an initial five minute
cycling bout (Chatard, Atlaoui et al. 2004). The 80 min recovery period is less likely to reflect
the competition demands of elite athletes, unless they are competing in a tournament scenario
with multiple games/heats completed per day. The training schedule of the elite athlete
includes multiple sessions per day, when the recovery period is only short in duration like this
73

current study, compression garments may be useful at maintaining the athlete’s performance,
however the completion of only 5 min of cycling exercise limits possible extrapolations to
field sports. The role of the placebo effect in this positive response is discussed in Section
2.10.
When a longer duration cycling protocol is adopted, positive effects on subsequent
performance are also evident (De Glanville and Hamlin 2012). Team sport trained participants
who wore a lower body compression garment for 24 hr separating two 40 km cycling time
trials were better able to maintain their follow up performance time (ES ±90% CI; -1.2 ±
0.4%). This improvement resulted in a substantially higher average power output after
wearing the compression garment compared with that after the placebo garment (ES ±90% ;
3.3 ± 1.1%) (De Glanville and Hamlin 2012). Interestingly, the author’s hypothesized that
performance improvements may be due in part to an improved glucose metabolism via
compression garment mediated blood flow increases, yet the garments were only worn during
recovery and not the actual exercise bout. The authors did not however measure muscle
glycogen levels, blood flow, blood glucose levels or to control dietary intake. To support this
hypothesis, the authors reference the moderately higher (9.3%) but unclear blood lactate
concentration at 40-km in the compression relative to the placebo group following the second
time trial. The authors do however cite the observed trend towards a lower oxygen cost during
the second cycling bout with compression use compared to placebo, suggesting that lower
oxygen consumption may be due to a move toward greater carbohydrate and less fat use in
oxidative phosphorylation. They also postulate that an increase in carbohydrate metabolism in
the compression group was not because of any change in diet but may have resulted from
increased muscle glycogen storage secondary to enhanced glucose availability via the blood.
The theory presented by the researchers is theoretically possible. It remains unclear however,
74

if such increases in blood flow due to wearing compression garments actually aid in an
increased delivery of glucose to glycogen storage sites, and if the effect of this increased
delivery outweighs that of consuming additional carbohydrates in the diet.
It currently remains unclear if similarly positive recovery responses to compression garment
use occur in team sport athletes. Academy level female netball and male basketball players
wore compression (48 hr) following drop jump exercise, and experienced mixed recovery
outcomes. Agility and CMJ test performance were superior with compression garment use
compared to the control. Yet despite a decline in sprint test times (5, 10, 20 m), wearing
compression garments did not alter sprint recovery beyond that of the control group. Wearing
compression also failed to impact serum [CK], [LDH] or mid-thigh circumference. Indices of
muscle damage however, were not elevated in the post exercise period (Davies, Thompson et
al. 2009), most likely accounting for the inability to detect differences between groups.
Importantly, lower levels of muscle soreness in the netball participants compared to the
control occurred with compression garment use (Davies, Thompson et al. 2009).
More promising effects of compression garments were seen when cricket players wore full
length lower body, and long sleeve garments during, and for 24 hr, following throwing
activities and a 30 min intermittent repeat sprint protocol (Duffield and Portus 2007).
Consistent with the pool of compression garment research, wearing this type of garment
facilitated lower muscle soreness in both the upper and lower body. Creatine kinase
concentration was lower 24 hr later in players wearing compression garments versus the
control (Duffield and Portus 2007). As the participants also wore the compression garments
during the exercise in addition to 24 hr of recovery, it is difficult to clearly differentiate the
‘during exercise’ effect of the garments from possible recovery effects.
75

Much of the investigation into the influence of post exercise compression garment use has
focused on rugby players following actual and simulated games as well as sprint and
plyometric exercise. Recovery was not enhanced when moderately trained rugby players wore
compression garments during, and for 24 hr of recovery, following a 10 min sprint and
plyometric jumping protocol. Peak extension force for quadriceps, peak flexion force for
hamstrings, or knee extensor peak twitch force two or 24 hr post exercise remained unaltered
compared to the control (Duffield, Cannon et al. 2010). However, knee extensor peak twitch
force was the only variable depressed at two hours post. Wearing compression garments did
however result in lower levels of muscle soreness at 24 hr compared to the control condition.
Aspartate amino transferase, an enzyme found in skeletal muscle and used primarily as a
marker of liver function (Kirsch, Eichele et al. 1984), was also lower 24 hr later with the use
of compression garments. However, despite significant increases in C-reactive protein and
[CK] at 24 hr, these indices remained unaltered consequent to compression garment usage
(Duffield, Cannon et al. 2010). Likewise, compression garments worn during a 15 hr recovery
period (and the exercise bout), separating two simulated team games, did not enhance in-
game repeat 20 m sprint performance, or dynamometer peak power in elite junior rugby
players (Duffield, Edge et al. 2008). It appears that there was no substantial performance
decrement in either the treatment or control group when the simulated game was repeated,
most likely explaining the inability to detect a treatment effect for performance. On the other
hand, wearing compression was effective at dampening muscle soreness 24 hr following the
first game, and also 48 hr following the second game compared to the control condition
(Duffield, Edge et al. 2008). Capillary [CK] remained unaltered (Duffield, Edge et al. 2008),
however following elite rugby competition, transdermal [CK] was lower in athletes wearing
compression (12 hr overnight) compared to a control at 36 and 84 hr of recovery (Gill,
76

Beaven et al. 2006). Transdermal samples show a high correlation with plasma constituents at
rest and during exercise and recovery (r2>0.67) (Cook 2002).
Agility and line drill ability improved beyond control when compression garments were worn
during recovery between three consecutive basketball games, separated by 24 hr
(Montgomery, Pyne et al. 2008b). Of concern, there were greater decrements in vertical jump
and 20 m acceleration in compression versus control (Montgomery, Pyne et al. 2008b).
Soreness as well as fatigue were lower (50%) when wearing compression garments for 18 hr
during recovery (Montgomery, Pyne et al. 2008b). Serum [Mb] however remained unaltered
in athletes wearing compression garments (Montgomery, Pyne et al. 2008a).
2.9 Practical tools to assess recovery
The true test that an athlete has achieved full recovery is the repetition of the actual
performance. For example, the ability to replicate the number of maximal accelerations in a
game. Unfortunately, it is not practical to replay a game, or possible to replicate the game and
context of the acceleration exactly. The appropriate selection of tools to investigate post
exercise recovery is crucial. Importantly, practicality and reliability must be considered. This
is pertinent when investigating recovery in elite athletes, where athlete access is often limited,
and thus measures must be obtained quickly. Further, when investigations occur during
important phases of training and competition, invasive measures may not always be feasible,
despite their ability to often deliver a greater amount of information, compared to less
invasive techniques. The subsequent sections will briefly discuss practical tools to assess
recovery.
77

2.9.1 Statistical analysis of treatment effects: the use of magnitude based effects
When assessing the influence of an intervention on particular parameters, it is important to
consider the magnitude of the smallest worthwhile enhancement in the given parameter, and
the uncertainty or noise in the test result (Hopkins 2004). Traditionally, inferential statistics
are used to test the null-hypothesis, where a ‘P’ value is produced for an outcome statistic.
The P value is the probability of obtaining any value larger than the observed effect,
regardless of sign, (i.e. positive or negative) if the null hypothesis were true. When P<0.05,
the null hypothesis is rejected and the outcome is said to be statistically significant (Fisher
1970). However, the P value does not provide information regarding the direction or size of
the effect or, given sampling variability, the range of likely values (Batterham and Hopkins
2006). In fact, depending on sample size and variability, among other things, an outcome
statistic with P<0.05 could represent an effect that is mechanistically, practically, or clinically
irrelevant. On the other hand, a non-significant result of P>0.05 does not always imply the
absence of a worthwhile effect. A combination of large measurement variability, and a small
sample size may actually overshadow important effects (Batterham and Hopkins 2006).
When assessing elite athletes, the smallest worthwhile enhancement in a given parameter,
such as performance, is often small (Hopkins 2004) and may be missed by traditional
inferential statistics. Hopkins (2004) notes that for elite athletes competing in individual
sports, the smallest worthwhile enhancement in performance would give the athlete an extra
medal per 10 competitions. With this in mind, the required change in performance is 0.3 of
the typical variation in an athlete's performance from competition to competition, equating to
~0.3-1% when expressed as a change in power output, depending on the sport (Hopkins
2004). For team sport athletes, where a direct relationship between team and test performance
is not present, an appropriate default for the smallest change in test performance is one-fifth
78
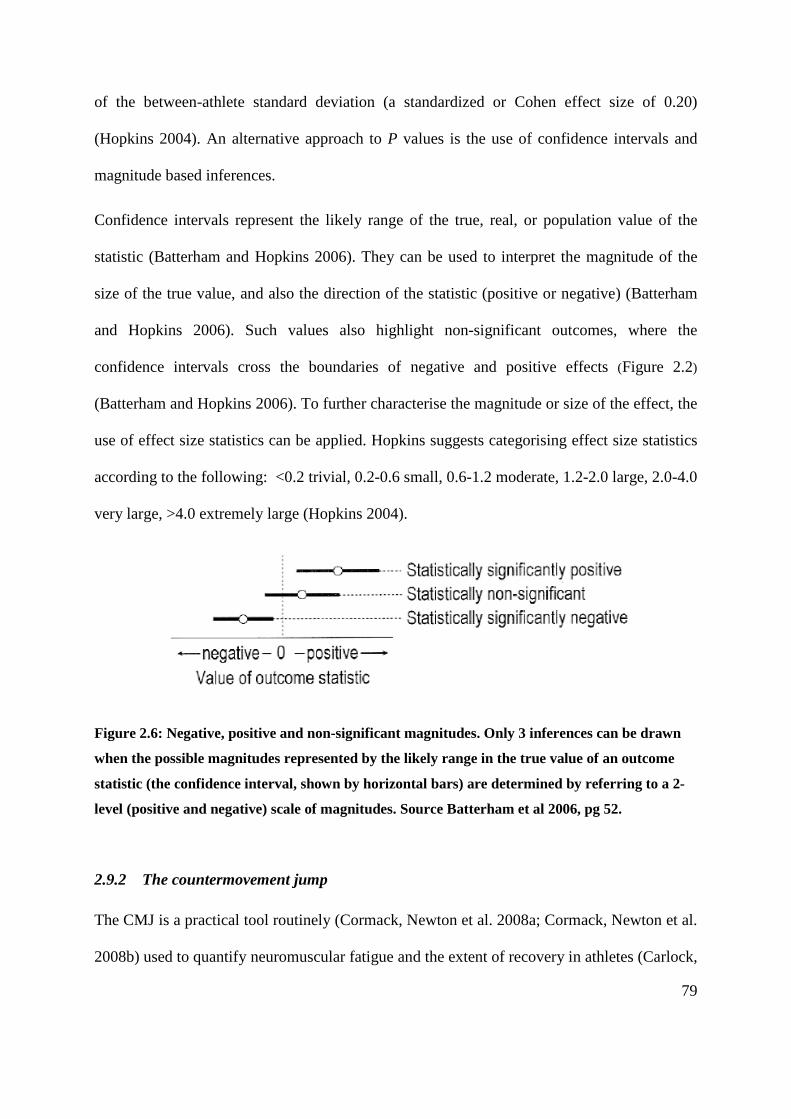
of the between-athlete standard deviation (a standardized or Cohen effect size of 0.20)
(Hopkins 2004). An alternative approach to P values is the use of confidence intervals and
magnitude based inferences.
Confidence intervals represent the likely range of the true, real, or population value of the
statistic (Batterham and Hopkins 2006). They can be used to interpret the magnitude of the
size of the true value, and also the direction of the statistic (positive or negative) (Batterham
and Hopkins 2006). Such values also highlight non-significant outcomes, where the
confidence intervals cross the boundaries of negative and positive effects (Figure 2.2)
(Batterham and Hopkins 2006). To further characterise the magnitude or size of the effect, the
use of effect size statistics can be applied. Hopkins suggests categorising effect size statistics
according to the following: <0.2 trivial, 0.2-0.6 small, 0.6-1.2 moderate, 1.2-2.0 large, 2.0-4.0
very large, >4.0 extremely large (Hopkins 2004).
Figure 2.6: Negative, positive and non-significant magnitudes. Only 3 inferences can be drawn
when the possible magnitudes represented by the likely range in the true value of an outcome
statistic (the confidence interval, shown by horizontal bars) are determined by referring to a 2-
level (positive and negative) scale of magnitudes. Source Batterham et al 2006, pg 52.
2.9.2 The countermovement jump
The CMJ is a practical tool routinely (Cormack, Newton et al. 2008a; Cormack, Newton et al.
2008b) used to quantify neuromuscular fatigue and the extent of recovery in athletes (Carlock,
79

Smith et al. 2004; Cormack, Newton et al. 2008c). The CMJ is far less time consuming and
demanding of the athlete compared to other performance measures such as sprint testing
(single and repeated) and dynamometry. It is essential to quantify the impact of
training/competition on the neuromuscular system to allow effective planning of training
(Cormack, Newton et al. 2008a), to monitor recovery progress, and the effectiveness of
recovery. The elastic behaviour of leg extensor muscles are similar in a vertical jump and
running (Bosco, Montanari et al. 1987). Hence, when running is a principal component of a
sport, a vertical jump assessment, such as the CMJ, is useful for assessing neuromuscular
fatigue (Bosco, Montanari et al. 1987), and displays a high level of reliability (Table 2.3). The
CMJ has been used extensively and validated as an indicator of neuromuscular fatigue
amongst AF athletes (Cormack, Newton et al. 2008a; Cormack, Newton et al. 2008c).
Although this does not reflect the athlete’s ability to replicate in-game physical performance,
it can be used as a monitoring tool. When the athlete’s typical ‘free from fatigue’ jump
performance is determined, as well as their natural variation in said performance, substantial
deviations in performance may indicate fatigue. The CMJ is also used to evaluate changes in
lower limb force and power capabilities following intensive training programs (Sheppard,
Cormack et al. 2008), a predictor of strength and weightlifting performance (Carlock, Smith
et al. 2004; Nuzzo, McBride et al. 2008; Vizcaya, Viana et al. 2009), and a training adaptation
monitoring tool (Cormie, McBride et al. 2009).
80
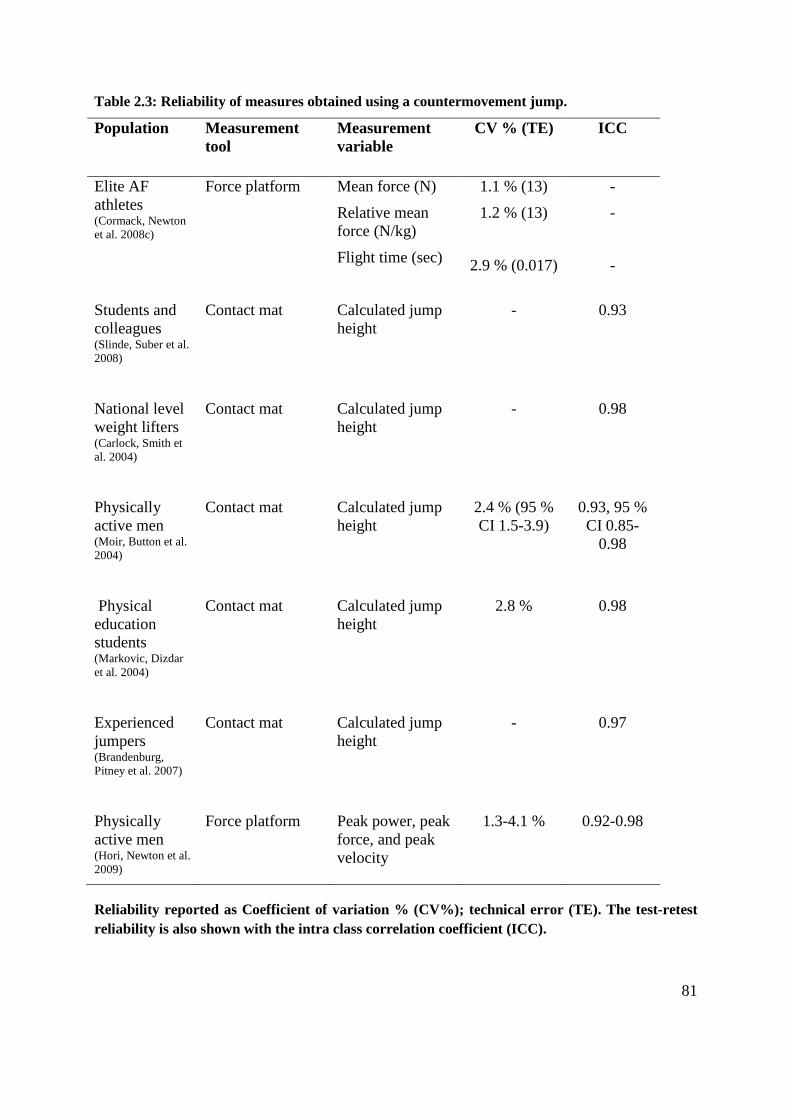
Table 2.3: Reliability of measures obtained using a countermovement jump.
Population Measurement tool
Measurement variable
CV % (TE) ICC
Elite AF athletes (Cormack, Newton et al. 2008c)
Force platform Mean force (N)
Relative mean force (N/kg)
Flight time (sec)
1.1 % (13)
1.2 % (13)
2.9 % (0.017)
-
-
-
Students and colleagues (Slinde, Suber et al. 2008)
Contact mat Calculated jump height
- 0.93
National level weight lifters (Carlock, Smith et al. 2004)
Contact mat Calculated jump height
- 0.98
Physically active men (Moir, Button et al. 2004)
Contact mat Calculated jump height
2.4 % (95 % CI 1.5-3.9)
0.93, 95 % CI 0.85-
0.98
Physical education students (Markovic, Dizdar et al. 2004)
Contact mat Calculated jump height
2.8 % 0.98
Experienced jumpers (Brandenburg, Pitney et al. 2007)
Contact mat Calculated jump height
- 0.97
Physically active men (Hori, Newton et al. 2009)
Force platform Peak power, peak force, and peak velocity
1.3-4.1 % 0.92-0.98
Reliability reported as Coefficient of variation % (CV%); technical error (TE). The test-retest reliability is also shown with the intra class correlation coefficient (ICC).
81

2.9.3 The measurement of muscle damage to assess post exercise recovery
The most commonly employed technique to indirectly quantify the level of muscle damage is
the analysis of blood biochemical markers of muscle damage. Figure 2.7 displays the time
course of release and decay of this biochemical marker. The ability to assess muscle damage
through blood samples is far less invasive, and provides a more practical alternative to muscle
biopsies. When the structural integrity of the muscle fibre is compromised, intracellular
enzymes and proteins, such as CK (isoenzyme CK-MM, found in the myofiber (Crinnion,
Homer-Vanniasinkam et al. 1994)) and Mb, are released and the blood concentration of these
rise (Brancaccio, Limongelli et al. 2006; Brancaccio, Maffulli et al. 2007). Plasma [Mb] is
elevated following half marathon running, American football, soccer, rugby and boxing
(Zuliani, Bonetti et al. 1985; Hoffman, Maresh et al. 2002; Takarada 2003; Lippi, Schena et
al. 2008; Kraemer, Spiering et al. 2009), providing an estimation of the extent of muscle
damage caused by these activities (Table 2.4).
82

Figure 2.7: The release and breakdown of muscle damage markers after exercise. The solid line
represents plasma myoglobin concentration ([Mb]) and the broken line represents plasma
Creatine kinase concentration ([CK]). Adapted from: (Zuliani, Bonetti et al. 1985; Sorichter, Mair et al. 2001;
Takarada 2003; Peake, Nosaka et al. 2005; Peake, Nosaka et al. 2006; Ascensao, Rebelo et al. 2008; Ispirlidis, Fatouros et al. 2008;
Lippi, Schena et al. 2008; Neubauer, Konig et al. 2008; Kraemer, Spiering et al. 2009).
0
200
400
600
800
1000
1200
0
100
200
300
400
500
600
0 1 2 3 4 5 6 7 8
Plas
ma
[CK]
(U/L
)
Plas
ma
[Mb]
(ng/
ml)
Mb (ng/ml) CK (U/L)24 hr 48 hr 72 hr 96 hr Baseline 0 hr 3 hr
83

Table 2.4: Changes in Myoglobin concentration following various exercise modalities.
Exercise mode Pre exercise [Mb] concentration (ng.ml-1)
Post exercise [Mb] concentration (ng.ml-1)
24 h Post exercise [Mb] concentration (ng.ml-1)
Laboratory based research
Downhill running well trained (10 % decline, 45 min) (Peake, Suzuki et al. 2005)
~25 ~450 ~ 70
20 min downhill running (16 % decline) (Sorichter, Mair et al. 2001)
57; 43-63 (median; IQR)
500 (median) 60 (median)
Field based research Rugby game (Takarada 2003)
- Positive correlation (r=0.85) between [Mb] and number
of tackles. - Peak [Mb] (45min post) was 980±166 ng.ml-1. - One participant exhibited a post game [Mb] of 1641
ng.ml-1 consequent to a tackle.
Soccer game (Ascensao, Rebelo et al. 2008)
~25 ~350 ~50
21km Half Marathon (Lippi, Schena et al. 2008)
36.3 102 (note: 73 % of samples were above reference values)
47 (note: 27 % of samples above reference value)
Ironman triathlon (Neubauer, Konig et al. 2008)
- ~ 2000 ~ 500
American Football (Kraemer, Spiering et al. 2009)
~ 45 - 95 (ng.ml-1) (18-20 hr post)
Boxing (3 x 3min rounds with 1 min rest) (Zuliani, Bonetti et al. 1985)
15 (ng.ml-1) 52±27 (ng.ml-1) 75±36 (5 hr post); 27±21 (16 hr post)
Values are expressed in nanograms per milliliter (ng.ml-1), and mean ± standard deviation.
84

Plasma/serum concentration of creatine kinase ([CK]) is the other widely investigated
biochemical indicator of muscle damage. Figure 2.7 displays the time course of release and
decay of this biochemical marker. The use of CK to investigate muscle damage and the
effectiveness of an intervention is questionable. Specifically, [CK] varies markedly (Nosaka,
Clarkson et al. 1991; Aughey 2011), with high and low responders (Nosaka and Clarkson
1996). Participants exposed to the same exercise can experience a large variation in post
exercise peak [CK] activity, which in one study ranged from 236 to 25,244 IU.L-1(Nosaka and
Clarkson 1996). The authors note that this variability could be partly explained by an
adaptation or training effect (Nosaka and Clarkson 1996). However short-term immobilisation
after eccentric exercise does blunt the CK, but not Mb response, where the lymphatic
transport of CK is likely responsible (Sayers and Clarkson 2003). As such, when the level of
activity post exercise cannot be controlled, CK may be an inappropriate marker.
Circumference measurements of limbs are taken as an indicator of acute changes in limb
volume (Chleboun, Howell et al. 1995; Eston and Peters 1999) which are likely to occur from
osmotic fluid shifts or inflammation associated with muscle-damage (Fielding, Violan et al.
2000). Investigations typically do not take into consideration the possible contribution of
increased muscle blood flow to post exercise changes in limb circumferences. In addition to
the practical and non-invasive nature of this measure, it also displays a good level of
reliability (technical error of measurement = 1.48% to 4.59%).
85

2.9.4 Measurement of perceptions of soreness and fatigue to assess recovery
Perceptions of soreness and fatigue are anecdotally used by coaches and practitioners as an
indication of the state of recovery, and readiness to train. This provides a practical and non-
invasive means to investigate the level of recovery experienced, with such assessment
completed through the use of questionnaires. A commonly used form is the visual analogue
scale (VAS). The VAS has been used extensively in clinical settings displaying good
reliability (Spearmans r = 0.60 to 0.77) (Boonstra, Schiphorst Preuper et al. 2008). This scale
is also commonly used in sporting settings and sport science research (Cleather and Guthrie
2007; Montgomery, Pyne et al. 2008b). Indeed, the 7-point Likert scale and VAS display
similar sensitivity to muscle soreness caused by eccentric contractions during the first 96
hours after plyometric exercises (Impellizzeri and Maffiuletti 2007). However, correlations
between levels of muscle soreness and functional performance are not always strong
(Rodenburg, Bar et al. 1993). Following eccentric arm curl exercise, force production did not
correlate with measures of soreness. The authors suggest that when possible, more objective
measures, such as that of plasma [CK] or [Mb] be measured, as these are more tightly
correlated with functional performance during 24, 48, 72 and 96 hr of recovery (Spearmans r
= -0.47 to -0.90) (Rodenburg, Bar et al. 1993). However within actual sporting scenarios, it is
not always possible for practitioners to collect blood samples, particularly in the elite
environment. Thus subjective measures of soreness and fatigue may be warranted, as long as
the weak correlations to performance are understood by the practitioner. When using a VAS,
participants are asked to rank their perception of soreness and fatigue on an unmarked
horizontal line (100 mm in length) with ‘No soreness/fatigue’ and ‘Very severe
soreness/fatigue’ at each end. The participant’s score is then calculated based on the number
of millimetres their ‘ranking’ (in the form of a marked line on the scale provided) is placed
86

from the ‘No soreness/fatigue’ end of the scale (Wewers and Lowe 1990). Consequently this
provides a quick, easy, and practical tool to assess athlete perceived soreness and fatigue.
2.10 The placebo effect in sports performance: possible action of
compression garments
The placebo effect occurs when a positive outcome results from the belief that a beneficial
treatment has been received (Clark, Hopkins et al. 2000). Ultimately, the placebo effect
catalyses or reinforces the individuals expectation of the intervention via a ‘belief
intervention’ (Beedie and Foad 2009). Increased expectations of an intervention lead to
increased activity in the medial orbitofrontal frontal cortex (Plassmann, O'Doherty et al.
2008), an area of the brain that encodes for expected pleasantness (McClure, Li et al. 2004;
Rolls, Grabenhorst et al. 2008). What’s more, increased activity in the medial orbitofrontal
frontal cortex is seen even when participants are prompted to think about a particular stimuli,
without actual exposure (Rolls, Grabenhorst et al. 2008). Psychological variables including
motivation, expectancy and conditioning, and the interaction of these variables with
physiological variables, may be significant factors in eliciting both positive and negative
outcomes (Beedie and Foad 2009). The individual’s belief in the intervention may increase
motivation and perhaps a greater than usual attention to training and recovery. Such
responses, although behavioural, satisfy the definition of a placebo effect.
Wearing compression garments for recovery between cycling bouts assisted in the
maintenance of cycling power compared to a control condition (Chatard, Atlaoui et al. 2004).
Of interest, fifty percent of participants reported that the garments could have modified their
second performance either a bit, or a lot, with the authors noting that a placebo effect could
87

not be ruled out (Chatard, Atlaoui et al. 2004). However, the contribution of the placebo
effect in this case is not completely certain, as a placebo group was not included for
comparison.
Determining the contribution of the placebo effect, particularly when participants have
previously worn compressions garments, and possess pre-existing beliefs regarding their
actions is difficult. For example, netball circuit (Higgins, Naughton et al. 2009) and cycling
time trial performance (De Glanville and Hamlin 2012) are both superior when wearing
compression garments compared to a placebo group. It may be argued that this reflects a
‘true’ effect for compression garments. However, participants in both investigations were well
trained, and it is likely that they previously had worn compression garments, and were able to
differentiate between wearing a ‘real’ versus placebo compression garment. This may have
led them to perform better when wearing the ‘real’ garment. Additionally, this population
type is likely to possess pre-existing beliefs regarding the efficacy of such garments as a
recovery tool, further contributing to the improved performance. However, in both
experiments, participants were randomised in a counterbalanced order into the placebo or
compression garment group, and were blinded to their condition (Higgins, Naughton et al.
2009; De Glanville and Hamlin 2012). It is expected that this designed swamped the placebo
effect, particularly if the participants truly believed they were wearing compression garments
in the placebo conditions. Without information regarding which condition participants
believed they were in, and if they believed compression garments were a useful recovery tool,
these theories remain speculative. Ultimately, it is impossible to rule out the likelihood that
the placebo effect may account for some of the effectiveness of compression garments on post
exercise recovery.
88

2.11 Summary of the literature
Australian football training and competition are characterised by a considerable level of
physical contact (Dawson, Hopkinson et al. 2004b; Dawson, Hopkinson et al. 2004a) overlaid
on large volumes of high intensity, intermittent running based activity (Duffield, Coutts et al.
2009; Aughey 2010; Coutts, Quinn et al. 2010; Aughey 2011). Reductions in in-game
performance suggest that elite AF players experience fatigue during games (Duffield, Coutts
et al. 2009; Aughey 2010; Coutts, Quinn et al. 2010). This more temporary fatigue is likely
attributed to disturbances to ionic (Pate and Cooke 1989; Clausen 2003) and metabolic
(Dawson, Gadian et al. 1978; Meissner, Darling et al. 1986; Dutka and Lamb 2004) regulation
in addition to an altered central drive (Kernell 1969; Garland 1991; Macefield, Hagbarth et al.
1991; Garland and Kaufman 1995; Taylor, Allen et al. 2000; Gandevia 2001). These athletes
also experience reductions in performance attributed to fatigue that may last hours to days
following training/competition (Hoffman, Nusse et al. 2003; Ascensao, Rebelo et al. 2008;
Cormack, Newton et al. 2008a; Oliver, Armstrong et al. 2008; McLean, Coutts et al. 2010),
with the recovery of performance falling somewhere along a continuum. Some of the in-
session fatigue may be recovered with a short rest period, whereas other components of
fatigue may require hours to days to recover. Further, as discussed in Section 2.6.9, muscle
soreness may also contribute to a reduced neural drive during this recovery period. It is likely
that prolonged performance reductions are attributed in part to EIMD, with indicators of
EIMD present following team sport exercise (Hoffman, Maresh et al. 2002; Takarada 2003;
Hoffman, Kang et al. 2005; Ascensao, Rebelo et al. 2008; Ispirlidis, Fatouros et al. 2008)
(Section 2.6.5). Ultimately, recovery interventions, with the aim to return performance,
perceptual and biochemical parameters to within homeostatic ranges, focus on abating
fatigue, muscle damage and soreness.
89

Compression garments, a fashionable recovery intervention amongst the athlete population,
are proposed to accelerate between session recovery, based on alterations to the lymphatic and
vascular systems as outlined through clinical research (Swedborg 1984; Mayberry, Moneta et
al. 1991; Yasuhara, Shigematsu et al. 1996; Johansson, Lie et al. 1998; Jonker, de Boer et al.
2001). Indeed, these garments are proposed to reduce oedema, and subsequently muscle
soreness through the mechanical blocking of the oedema (Kraemer, Bush et al. 2001a;
Kraemer, Bush et al. 2001b; Beidler, Douillet et al. 2009). This in turn may accelerate the
post exercise recovery of performance. It is also suggested that wearing compression
garments permits the limbs to remain in anatomical positions when not used, affording
straight-line tissue repair geometrics (Kraemer, Bush et al. 1998a; Kraemer, Bush et al.
2001a; Kraemer, Bush et al. 2001b). Wearing compression garments exerts the strongest
positive effects on post exercise recovery in untrained individuals, notably following severely
damaging protocols (Kraemer, Bush et al. 2001a; Kraemer, Bush et al. 2001b; Jakeman,
Byrne et al. 2010b; Jakeman, Byrne et al. 2010a), with lower levels of muscle soreness and a
greater recovery of performance (Kraemer, Bush et al. 2001a; Kraemer, Bush et al. 2001b).
The impact on biochemical parameters does vary depending on the indices assessed
(Kraemer, Bush et al. 2001a; Kraemer, Bush et al. 2001b; Jakeman, Byrne et al. 2010b;
Jakeman, Byrne et al. 2010a), and in some cases remains completely unaltered (Jakeman,
Byrne et al. 2010b; Jakeman, Byrne et al. 2010a). When worn for recovery, the most
consistently reported positive action of compression garments on trained individuals is the
blunting of muscle soreness (Duffield, Edge et al. 2008; French, Thompson et al. 2008;
Montgomery, Pyne et al. 2008b; Davies, Thompson et al. 2009; Duffield, Cannon et al. 2010).
When assessing the recovery of performance, well trained participants experienced an
improved recovery in some but not all variables (French, Thompson et al. 2008; Montgomery,
90

Pyne et al. 2008b; De Glanville and Hamlin 2012), with the recovery of some performance
parameters actually worsened with compression garment use compared to a control (French,
Thompson et al. 2008; Montgomery, Pyne et al. 2008b). The biochemical responses to
wearing compression garments, with specific reference to muscle damage, are currently
unknown amongst trained individuals (French, Thompson et al. 2008; Montgomery, Pyne et
al. 2008a). Research is yet to investigate possible recovery differences between medical and
sports style compression within athletic scenarios. Further, the efficacy of such garments
when worn during recovery following AF activities remains unknown.
2.12 Significance/influence on athletic performance
The use of recovery interventions, in particular compression garments, is a topical issue.
There is a large body of evidence to suggest that their use is ineffective at enhancing recovery.
Consequently, athletes and exercise practitioners have been unable to make informed
decisions about whether compression garments might be the most appropriate recovery
modality for their athletes. Further research is required to enable coaches and athletes alike to
base their choice of recovery intervention on scientific evidence.
2.13 Statement of the problem
The present thesis investigated the efficacy of post exercise compression garment use to
enhance recovery. Specifically, performance, perceptual and physiological parameters were
investigated. Compression garment use is prevalent amongst team sport athletes, particularly
AF. This particular code of football is characterised by high locomotive and physical
activities, deeming it an appropriate model to investigate the influence of compression
garment use on recovery. Current research on the influence of compression garments on
performance, perceptual and biochemical parameters is sparse and in-conclusive. Further,
91
research has failed to investigate the influence of compression garment use on recovery in
elite athlete post training and in-season competition settings. As such, high quality research
pertaining to changes in said variables secondary to compression garment usage is warranted.
2.14 Specific aims of the studies
This thesis aimed to investigate the influence of post-exercise compression garment usage on
the augmentation of recovery.
2.14.1 Chapter 4: The effects of compression garments on high intensity intermittent
exercise performance and recovery on consecutive days.
This study aimed to elucidate the influence of between session sports compression garment
use on recovery when worn between three once daily repeat sprint exercise sessions in
recreationally active individuals.
2.14.2 Chapter 5: Recovery following elite Australian football training.
The purpose of this investigation was to explore the influence of wearing compression (sport
and medical) garments to facilitate recovery from two elite AF training sessions. Further, this
investigation aimed to illustrate possible recovery differences present between medical and
sports compression garments. This investigation also sought to determine if positive recovery
effects associated with wearing compression garments would be consistent and reproducible
when two elite AF training sessions were conducted.
2.14.3 Chapter 6: Recovery effects of medical and sports compression garments after elite
Australian football competition.
First, this study aimed to investigate whether wearing compression (medical and sports)
garments could accelerate post competition recovery in elite AF athletes. A secondary aim of
this investigation was to decipher possible differences in the recovery capacity between 92

medical and sports compression garments. This investigation also aimed to elucidate
performance, perceptual and biochemical responses to elite AF competition.
93

CHAPTER 3. GENERAL METHODS
General methods used in Chapter 4, 5 and 6 are described below. Chapter specific methods
are detailed within the methods section of each relevant chapter.
3.1 Biochemical sampling and analysis
Prior to blood sampling, participants lay quietly for 5 min to minimise posture induced fluid
shifts (Fawcett and Wynn 1960). A 22 gauge needle was inserted into an antecubital vein, and
blood was drawn into a 5 mL (Chapter 4 and Chapter 6) or 10 mL (Chapter 5) syringe. Whole
blood (0.5 mL) was analysed for haematocrit and haemoglobin in duplicate using electrical
resistance detection (Sysmex K-800, TOA Medical Electronics CO, LTD, Kobe, Japan). From
these measurements plasma volume changes were calculated (Dill and Costill 1974).
Remaining whole blood was transferred into a sterile vacutainer containing EDTA (Greiner
Bio One, Frickenhausen, Germany) and was centrifuged (Allegra™ 25R Centrifuge, Palo
Alto, CA, USA) at 2500 RPM for 10 min at 4°C to separate plasma and stored at -80°C prior
to subsequent analysis of plasma Myoglobin concentration ([Mb]).
Plasma [Mb] was determined by a commercially available enzyme immunoassay kit
(Myoglobin Enzyme ImmunoAssay Test Kit, Oxis International Inc, Foster City California,
USA). In all chapters, plasma [Mb] samples were tested in duplicate at all sample points.
These duplicate measures were used in a custom spreadsheet (Hopkins 2000) to determine the
reliability of the assay. The reliability (coefficient of variation, as a percentage (CV%) for this
measure was 11.7% (Chapter 4), 9.1% (Chapter 5), and 7.3% (Chapter 6) (Hopkins 2000).
The smallest worthwhile change (SWC) (Section 3.4.2) in plasma [Mb] was 14.8% and
11.6% in Chapters 4 and 6. Chapter 5 consisted of two individual components, the SWC% for
94

plasma [Mb] was 12.3% for training session 1 and 9.2% for training session 2 (Batterham
and Hopkins 2006).
3.2 Perceptual measures
Perceived muscle soreness and fatigue were ascertained via two independent visual analogue
scales (Chapter 4, 5 and 6). See appendices in Section 9.6.1 and 9.6.2 for the VAS scales
used. Perceptions of soreness and fatigue were ranked on an unmarked horizontal line (100
mm in length) with ‘No soreness/fatigue’ and ‘Very severe soreness/fatigue’ at each end.
Scores were calculated based on the number of millimetres the ‘ranking’ (in the form of a
marked line on the scale provided) was placed from the ‘No soreness/fatigue’ end of the scale
(Gould D, Kelly D et al. 2001). A rating of perceived exertion (RPE) (Chapter 4, 5, and 6)was
recorded immediately after the completion of exercise using a 10 point scale (Borg 1982) .
The SWC for perceived muscle soreness was 23.0% in Chapter 4. The SWC for perceived
muscle soreness was 17.4% and 8.1% for training session 1 and 2 in Chapter 5, and 11.9% in
and 6. The SWC% for perceived fatigue was 16.5% in Chapter 4. The SWC for perceived
fatigue was 13.7% and 6.7% for training session 1 and 2 in Chapter 5, and 11.1% in Chapter
6.
3.3 Performance measurement: Countermovement jump
Prior to all testing, the force platform was calibrated following the associated softwares
standard procedures. With hands on hips, players performed a single CMJ (Cormack, Newton
et al. 2008a) on a commercially available force plate (400 Series Performance Plate – Fitness
Technology, Adelaide, Australia) connected to a computer running software (Ballistic
Measurement System – Fitness Technology, Adelaide, Australia) (Chapter 5 and 6). A sample
95

rate of 200 Hz was set (Hori, Newton et al. 2009). The depth of the CMJ was self-selected
(Domire and Challis 2007).
A warm up was conducted prior to baseline measures at ‘Pre’ and follow up testing of the
CMJ. In Chapter 5, players completed a standardised six minute warm up, including three
practice CMJ prior to testing at Pre and 24 hr post (+24). In Chapter 6, players completed a 10
min AF specific warm up at a self-selected intensity prior to Pre game testing, and moderate
intensity cycling (3 min) on a stationary bicycle was completed prior to the +40 CMJ taken 40
hr following the game. Post game (Chapter 6) CMJ measures were not preceded by a warm
up as this sample time point was immediately after the game. The CMJ warm up technique
differed between Pre and +40 in Chapter 6 due to the availability of equipment and a different
testing location.
The most useful CMJ variables for monitoring neuromuscular fatigue in an elite AF
population are flight time (FT, seconds), and flight time:contraction time ratio (FT:CT)
(Cormack, Newton et al. 2008a; Cormack, Newton et al. 2008c). Consequently, FT (Chapter
5 and Chapter 6) and FT:CT (Chapter 6) were acquired at each sample point.
In Chapter 5, athletes performed a CMJ prior to each of the training sessions conducted,
which were separated by seven days. Athletes had experienced a three day break from training
activities prior to each of the training sessions. These CMJ scores for FT were analysed using
a custom spreadsheet to determine the level of reliability of CMJ FT, producing a coefficient
of variation (CV%) of 36.9%. In Chapter 6, athletes performed a CMJ prior to the main
training session leading up to the game (approximately -72 hr) as well as part of the pre game
program. The CMJ test scores were compared using a custom spreadsheet to determine the
level of reliability of CMJ FT and FT:CT. Expressed as a CV%, they were 2.8% (FT) and
18.7% (FT:CT) respectively. The difference in the time between CMJ sampling for reliability 96

purposes in Chapter 5 (7 days) and Chapter 6 (3 days) may have contributed to this
discrepancy in CV% for FT. This effect was possibly compounded by the effect of previous
training sessions (Chapter 5) which may have influenced jump performance, despite a three
day break prior to each of the training sessions. Data collection in the pre-season phase could
have exacerbated this effect due to the typically high training loads. Indeed, although not
required to attend formal training with the club during this three day break, athletes were not
prohibited from partaking in activities that may have influenced neuromuscular fatigue levels.
What’s more, athletes were not required by the club to complete the same activities in the
three days preceding each of the training sessions. In both Chapter 5 and 6 access to athletes
was limited, and thus familiarisation and more thorough reliability testing was not possible.
The reliability of CMJ FT displayed in the athletes in Chapter 5 and 6 is vastly different to
that displayed by other elite AF athletes (CV% =3.1%) (Cormack, Newton et al. 2008c).
Similarly, the reliability of CMJ FT:CT displayed in athletes in Chapter 6 was also different
to that displayed by other elite AF athletes (CV% =8.2%) (Cormack, Newton et al. 2008c).
Limited access to the athletes prevented familiarisation of the countermovement jump, likely
contributing to this measurements variability. The athletes were expected to be familiar with
correct CMJ technique, as they partook in weekly CMJ testing as part of their weekly
monitoring conducted by sport science staff. The SWC% (Batterham and Hopkins 2006) for
CMJ FT was identified as 6.8% and 1.0% for training session 1 and 2 in Chapter 5; and 1.6%
in Chapter 6. In Chapter 6, the SWC% (Batterham and Hopkins 2006) identified for FT:CT
was 6.9%.
97

3.4 Statistical analysis
3.4.1 Data preparation
Change scores for all raw data were plotted against pre-test values to identify any
heteroscedasticity (non-uniformity of error) in the data. Data was subsequently log
transformed to increase the uniformity in the effect of the treatment. These analyses were
conducted using processes embedded in custom designed spreadsheets (Hopkins 2006b) used
for each chapter to identify treatment effects for both cross over trials (Chapter 4) and parallel
group trials (Chapter 5 and 6). In Chapter 5, CMJ FT data was normalised against Pre values
prior to analysis using the methods described below. Within the spreadsheets, the smallest
effect was set to Cohen’s effect size 0.2, representing a small effect. This is an acceptable
threshold when there is no clear indication in the participant groups used as to the smallest
important value to include (Hopkins 2006b). This threshold was used by the spreadsheet to
estimate the chances any treatment effect was a true effect, termed a substantial effect. Ninety
percent confidence intervals were set in each batch of analysis to determine the likely range of
the true value. Data were excluded as outliers if their value was greater than, or less than, two
times the standard deviation of the mean.
3.4.2 Analysis of treatment effects
All data were analysed using effect size statistics to determine the magnitude of treatment
effects on performance, perceptual and biochemical variables. The final outcome statistic
represented the difference in a change, which is the difference between groups in their mean
change due to the experimental and control treatments using a pair-wise comparison. This was
expressed as a percentage (%) with the associated effect size and 90% confidence intervals
(%, ES±90%CI). Magnitudes of change were classified as a substantial increase or decrease
98

when there was a ≥ 75% likelihood of the effect being equal to or greater than the SWC
estimated as 0.2 x between subject standard deviation (small ES). If the chance of higher or
lower differences was >5 %, the true difference was assessed as ‘unclear’. Effect size
statistics were classified according to the following: <0.2 trivial, 0.2-0.6 small, 0.6-1.2
moderate, 1.2-2.0 large, 2.0-4.0 very large, >4.0 extremely large (Hopkins 2004). Effects with
less certainty were classified as trivial and where the ± 90% CI of the ES crossed the
boundaries of ES -0.2 and 0.2, the effect was reported as unclear (Batterham and Hopkins
2006). Where a treatment effect is observed, the chances (% and qualitative) that the true
value of the statistic is mechanistically or practically probable is reported. The qualitative
probabilities are defined by the following scale: <0.5%, almost certainly not, <5%, very
unlikely, <25%, unlikely, probably not, 25-75%, possibly, possibly not, >75%, likely,
probably, >95%, very likely, >99.5%, almost certainly (Hopkins 2006b).
To determine potential differences in the duration that compression garments were worn
(Medical lower body compression garment: Med; and a commercially available sports style
compression garment: Spo) (Chapter 5 and 6), a custom spreadsheet designed for the analysis
of post-only crossover trial with adjustment for a predictor (Hopkins 2006b) was used. This
same spreadsheet was used to determine differences in internal loads (Chapter 5 and 6),
minutes of game time played (Chapter 6), and session RPE (Chapter 5 and 6).
To assess between group differences in the magnitudes of change in variables in Chapter 4, a
custom spreadsheet designed for the analysis of a pre-post crossover trial with adjustment for
a predictor (i.e. covariate) was used (Hopkins 2006b). Each variable was assessed in an
individual spreadsheet, with pair-wise comparisons made between each time point. Work (kJ)
conducted during repeat sprint exercise bout one was used as a covariate in the analysis of
perceptual and biochemical variables (Chapter 4). As order effects were not accounted for in
99

the spreadsheet, participants were randomised to the control and treatment group in a
counterbalanced manner. Chapter 5 and 6 used a custom designed spreadsheet to assess a
parallel groups trial (Chapter 5 only) (Hopkins 2006b). A separate spreadsheet was used for
each treatment comparison.
To assess between group differences in variables at a specific sample time point in Chapter 4,
5 and 6, a custom spreadsheet for the analysis of a post-only crossover trial, with adjustment
for a predictor where required (Chapter 4), was used (Hopkins 2006b). These differences were
expressed as a percentage difference and ES±90% CI.
In Chapter 4, Pearsons correlation (r) for the change in perceived muscle soreness and fatigue
was calculated using a custom spreadsheet (Hopkins 2000). The variance explained (R2) was
calculated for this relationship as r2 x 100, and expressed as a percentage.
The SWC% for perceptual, biochemical and performance parameters was calculated as 2 x
the between subject standard deviation expressed as a coefficient of variation (Batterham and
Hopkins 2006) which was calculated through processes embedded within a custom
spreadsheet (Hopkins 2006b).
3.4.3 Reliability
Analysis of reliability with a custom spreadsheet (Hopkins 2000) was used to determine the
reliability of countermovement jump performance (Chapter 5 and 6) and plasma [Mb]
(Chapter 4, 5 and 6). Reliability was expressed as the coefficient of variation (CV%). Due to
the subjective nature of perceptual measures of perceived fatigue and muscle soreness, the
CV% was not calculated.
100

CHAPTER 4. THE EFFECTS OF COMPRESSION
GARMENTS ON HIGH INTENSITY INTERMITTENT
EXERCISE PERFORMANCE AND RECOVERY ON
CONSECUTIVE DAYS
4.1 Introduction
The positive effects of compression garment use for recovery of performance tests, perceptual
and biochemical parameters are typically reported following severely damaging exercise
protocols executed by untrained participants (Kraemer, Bush et al. 2001a; Kraemer, Bush et
al. 2001b; Jakeman, Byrne et al. 2010b; Jakeman, Byrne et al. 2010a). These studies typically
have the advantage of tighter control, but may therefore lack external validity if trying to
extrapolate results to athletic scenarios and populations. It is thus a lot less clear if trained
individuals can gain positive recovery effects from these garments (Duffield, Edge et al.
2008; Montgomery, Pyne et al. 2008a; Montgomery, Pyne et al. 2008b).
When more typical athletic exercise has been used in compression studies, there has been a
failure to elicit performance decrements, and thus proper investigation of compression for the
recovery of performance. For example, sprint performance and tackling power were
unchanged following a rugby circuit, deeming recovery effects of compression garments
inconclusive (Duffield, Edge et al. 2008). Positive recovery effects on test performance were
also unclear 24 hr following a sprint and plyometric protocol, where lower body strength was
not diminished (Duffield, Cannon et al. 2010).
In a study that did induce performance decrements, 30 m sprint times were actually worse
when wearing compression garments for recovery following resistance exercise (French,
101

Thompson et al. 2008). Likewise, athletes wearing compression between three basketball
games actually performed worse at a vertical jump and 20 m acceleration test compared to
control participants (Montgomery, Pyne et al. 2008b). However, those who wore the garments
did perform better for agility and line drill ability compared to control (Montgomery, Pyne et
al. 2008b). It is unclear as to why such discrepancies in the recovery of performance occurred
within the one study.
Whether wearing compression garments influences post exercise markers of muscle damage
remains to be elucidated. Following drop jump (Davies, Thompson et al. 2009) and resistance
exercise (French, Thompson et al. 2008) performed by trained individuals, serum [CK] and
[Mb] were not elevated, making comparisons with control groups difficult. Therefore
protocols using trained participants must be sufficiently damaging to overcome the pre-
conditioning ‘protective’ effects of prior exercise (Nosaka and Newton 2002; Bowers,
Morgan et al. 2004; Nosaka, Newton et al. 2005; Chen, Chen et al. 2009). Yet despite an
elevated serum [CK] following resistance exercise performed by trained individuals, wearing
compression garments did not facilitate lower serum [CK] compared to control (French,
Thompson et al. 2008). It may be that the variable nature of plasma and serum CK responses
following exercise (Nosaka, Clarkson et al. 1991; Aughey 2011) precluded observation of an
effect of compression garments. When the protocol is sufficiently demanding, and an
appropriate marker is used, such as the plasma Mb response following three days of
basketball game play, compression garments did not lower serum [Mb] compared to control
(Montgomery, Pyne et al. 2008a). However the influence of game activities such as jumping
and sprint number, which contribute to muscle damage, were not accounted for. Thus a study
with a controlled number of high intensity activities, known to be fatiguing is required to help
answer this question. It is also quite possible that compression garments do not actually
102

influence the concentration of circulating biochemical markers of muscle damage. Without
information on the rate of entry, and clearance of such markers into the blood, it is difficult to
determine.
Positive effects of compression on perceived muscle soreness are observed following not only
severely damaging protocols performed by untrained individuals, such as eccentric arm curl
exercise (Jakeman, Byrne et al. 2010b; Jakeman, Byrne et al. 2010a) and plyometric activity
(Jakeman, Byrne et al. 2010b; Jakeman, Byrne et al. 2010a), but also following exercise
protocols that attempt to mimic training and game activities (Duffield, Edge et al. 2008;
French, Thompson et al. 2008; Montgomery, Pyne et al. 2008b; Davies, Thompson et al.
2009; Duffield, Cannon et al. 2010). Similarly, lower perceived fatigue and higher ratings of
vitality are observed following basketball game play (Montgomery, Pyne et al. 2008b) and
resistance exercise (Kraemer, Flanagan et al. 2010) with compression. Perceptual parameters
appear more easily influenced not only by the exercise protocol adopted, but also through the
use of compression garments for recovery. It is anticipated that the most common effects of
compression garments are improved perceptual measures, and that they may be in part
attributed to the placebo effect (Chatard, Atlaoui et al. 2004; Higgins, Naughton et al. 2009;
De Glanville and Hamlin 2012).
This study therefore sought to investigate performance, physiological and perceptual recovery
effects of compression garments following an exercise task both known to elicit fatigue and
with external validity to team sport (Duffield, Coutts et al. 2009; Aughey 2010; Coutts, Quinn
et al. 2010; Aughey 2011). A further aim of this investigation was to test if compression
garments were able to augment recovery in an acute 24 hr period as well as following
repeated daily exercise, which more accurately reflects the training schedule and tournament
scenarios of elite athletes.
103

4.2 Methods
Data collected for this study was part of a larger investigation. A third group was included in
this larger investigation where participants ingested a pre-exercise antioxidant supplement (N-
Acetyl Cysteine). A one week wash out period was provided between each condition. When
participating in the control and sports compression condition, participants did not consume
this antioxidant supplement. This chapter will deal exclusively with the results obtained from
the control and sports compression groups only. The results pertaining to antioxidant
supplementation are beyond the scope of this thesis.
4.2.1 Participants
Nine healthy, recreationally active individuals (7 males and 2 females; 25.1 ± 3.7 yrs; height
174.1 ± 8.7 cm; body mass 70 ± 12.6) (Mean ± Standard Deviation)) gave written informed
consent to participate. All participants completed each component of the study. The
experimental protocol was approved by the Victoria University Human Research Ethics
Committee. Sample size estimation on the fly (Hopkins 2006a) was used whereby the
magnitudes of change observed in all parameters was assessed against the SWC.
4.2.2 Familiarisation Sessions
Prior to familiarisation, participants performed a Yo-Yo Intermittent Recovery Test 1 (Yo-Yo
IR1) (Bangsbo, Iaia et al. 2008). The motorised treadmill speed during the warm up prior to
the repeat sprint exercise (RSE) was set at 60% of the participant’s peak speed, correlating to
their predicted V.O2peak, as determined from their Yo-Yo IR1 result (Serpiello, McKenna et al.
2011). Participants completed two familiarisation sessions on the non motorised treadmill to
gain awareness and confidence with the equipment. Each familiarisation session required the
participant to undertake a condensed version of the RSE protocol. Participants performed two
104

sets of five 4-second sprints on the non-motorised treadmill. Each sprint was interspersed by
20 seconds passive recovery, with four and a half minutes passive recovery between each set
(Serpiello, McKenna et al. 2011).
4.2.3 Experimental overview
Participants were instructed to refrain from physical activity and caffeine consumption in the
24 hours preceding all testing sessions. Seven days following the final familiarisation,
participants commenced the testing phase of the study (See Figure 4.1). The RSE was
conducted once daily, for three consecutive days. This was repeated twice, with a one week
wash-out period between conditions. Two hours prior to RSE, participants consumed sport
drink (GatoradeTM 750 mL) across a one hour period. Plasma [Mb] (See Section 3.1), and
perceived muscle soreness and fatigue data (See Section 3.2) were collected pre (Pre) and
after (Post) each of the three RSE sessions (RSE1, RSE2 and RSE3), and 24 hr (+24)
following RSE3. Participants removed compression garments before completing the measures
24 hr post each of the RSE sessions. A further perceptual measure, rating of perceived
exertion (RPE) (See Section 3.2) was collected Post each RSE. Chilled water (250 mL) was
consumed during each RSE session. Dietary intake, particularly carbohydrate, was not
controlled as it was unlikely that glycogen depletion would influence performance
(Hargreaves, McKenna et al. 1998).
105

Figure 4.1: Overview of the repeat sprint exercise (RSE) protocol. The open bars denote each 4
second sprint. WU = warm up; CMJ = countermovement jump; VAS = Visual analogue scale
(measurement of perceived muscle soreness and fatigue); RPE = rating of perceived exertion.
4.2.4 Repeat sprint exercise protocol
Each RSE session, conducted on a non-motorised treadmill (Woodway Force 3, Waukesha,
WI, USA), consisted of three sets of 5 x 4 sec sprints, with each sprint separated by 20 sec,
and each set separated by 4.5 min. Motivation was kept constant throughout each RSE
session. The start point for sprint calculation was defined as a velocity attainment of 1 m.sec-1;
from then, a 4 sec period was calculated (Serpiello, McKenna et al. 2011). All sprint data was
calculated using custom software. Peak and mean values for velocity (m.sec-1) and power
(watts) in addition to total work (J) were calculated and averaged per RSE session, as well as
per set. The fatiguing nature of this protocol has previously been established (Serpiello,
McKenna et al. 2011). Specifically, decrements in mean power (-4.8%, ES±90%; CI -0.21 ±
0.07), peak power (-9.2%, -0.28 ± 0.11) and mean velocity (-2.2%, -0.18 ± 0.33) occur from
set one to three of an individual RSE session. The fatiguing nature of this protocol remains
after ten sessions of RSE training where mean power in set 3 remained 4.1% lower than set 1
(-0.19 ± 0.06), and mean velocity remained lower by 2.1% (-0.17 ± 0.06) (Serpiello,
McKenna et al. 2011).
Repeat sprint protocol
CM J
VAS
Blood Sample CM J
VAS RPE
Blood
Sample
20 s passive
4.5 min passive
WU
-8 -6 -2 0 15 +1 +3 time (min)
106

4.2.5 Recovery intervention
In a counterbalanced cross-over design, participants were randomly assigned to control (Con)
or lower body sports compression garment groups (Spo; recovery range, RY400, Skins
Australia). The Spo garments were from fabric containing 76% Nylon and 24% Spandex and
were graduated in nature, designed to exert the highest level of pressure, decreasing when
moving more proximally. Participants were only made aware of their treatment allocation
once they had completed the RSE protocol on the first day. Only loose clothing was permitted
in Con. The Spo participants were only permitted to wear the compressive garments supplied;
all other clothing was to be loose fitting. Compression garments were worn during recovery
between each RSE session and removed overnight. Participants recorded when they put
on/took off their compression garments. Participants were instructed that no other recovery
modalities were permitted at this time.
4.2.6 Assessment of acute and cumulative responses to RSE
To control for differences across groups, perceptual and biochemical results were adjusted for
Work (J) completed during RSE1 as a covariate. To determine the acute response (immediate
and 24 hr) to the RSE and acute recovery, comparisons between Pre RSE1 to both Post RSE1
and Pre RSE2 (i.e. 24 hr Post RSE1) were made. Cumulative responses to RSE and the
recovery intervention were determined via comparisons between Pre RSE1 and Pre RSE3 (i.e.
24 hr Post RSE2) and 24 hr Post RSE3.
4.3 Results
The magnitude of treatment effects for perceptual parameters exceeded the SWC (Table 4.1).
The 90% CI indicates the likely range in which the true value may lie. The observed range of
90% confidence intervals (90% CI) for changes in plasma [Mb] were large and thus effects
107
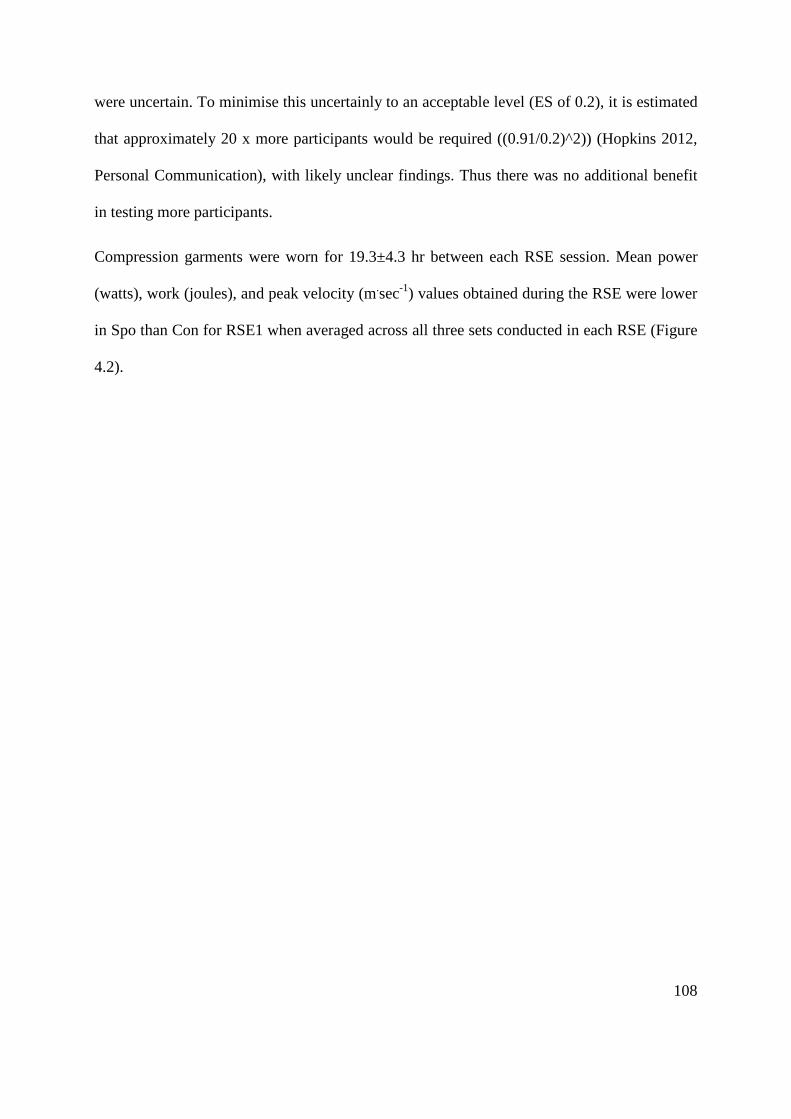
were uncertain. To minimise this uncertainly to an acceptable level (ES of 0.2), it is estimated
that approximately 20 x more participants would be required ((0.91/0.2)^2)) (Hopkins 2012,
Personal Communication), with likely unclear findings. Thus there was no additional benefit
in testing more participants.
Compression garments were worn for 19.3±4.3 hr between each RSE session. Mean power
(watts), work (joules), and peak velocity (m.sec-1) values obtained during the RSE were lower
in Spo than Con for RSE1 when averaged across all three sets conducted in each RSE (Figure
4.2).
108
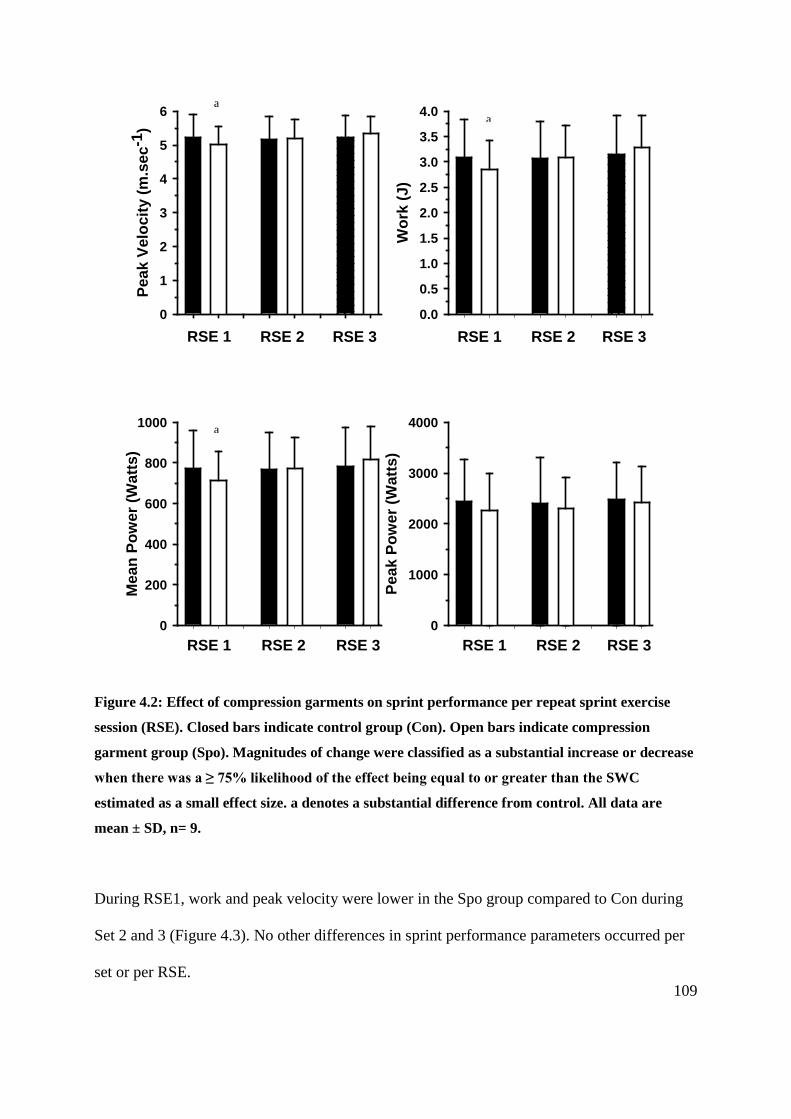
X Data
1 2 3 4 5 6 7 8
Peak
Pow
er (W
atts
)
0
1000
2000
3000
4000
X Data
1 2 3 4 5 6 7 8
Mea
n Po
wer
(Wat
ts)
0
200
400
600
800
1000
X Data
1 2 3 4 5 6 7 8
Wor
k (J
)
0.0
0.5
1.0
1.5
2.0
2.5
3.0
3.5
4.0
RSE 1 RSE 2 RSE 3
RSE 1 RSE 2 RSE 3 RSE 1 RSE 2 RSE 3
RSE 11 2 3 4 5 6 7 8
Peak
Vel
ocity
(m.s
ec-1
)
0
1
2
3
4
5
6
RSE 2 RSE 3
Figure 4.2: Effect of compression garments on sprint performance per repeat sprint exercise
session (RSE). Closed bars indicate control group (Con). Open bars indicate compression
garment group (Spo). Magnitudes of change were classified as a substantial increase or decrease
when there was a ≥ 75% likelihood of the effect being equal to or greater than the SWC
estimated as a small effect size. a denotes a substantial difference from control. All data are
mean ± SD, n= 9.
During RSE1, work and peak velocity were lower in the Spo group compared to Con during
Set 2 and 3 (Figure 4.3). No other differences in sprint performance parameters occurred per
set or per RSE.
a
a
a
109
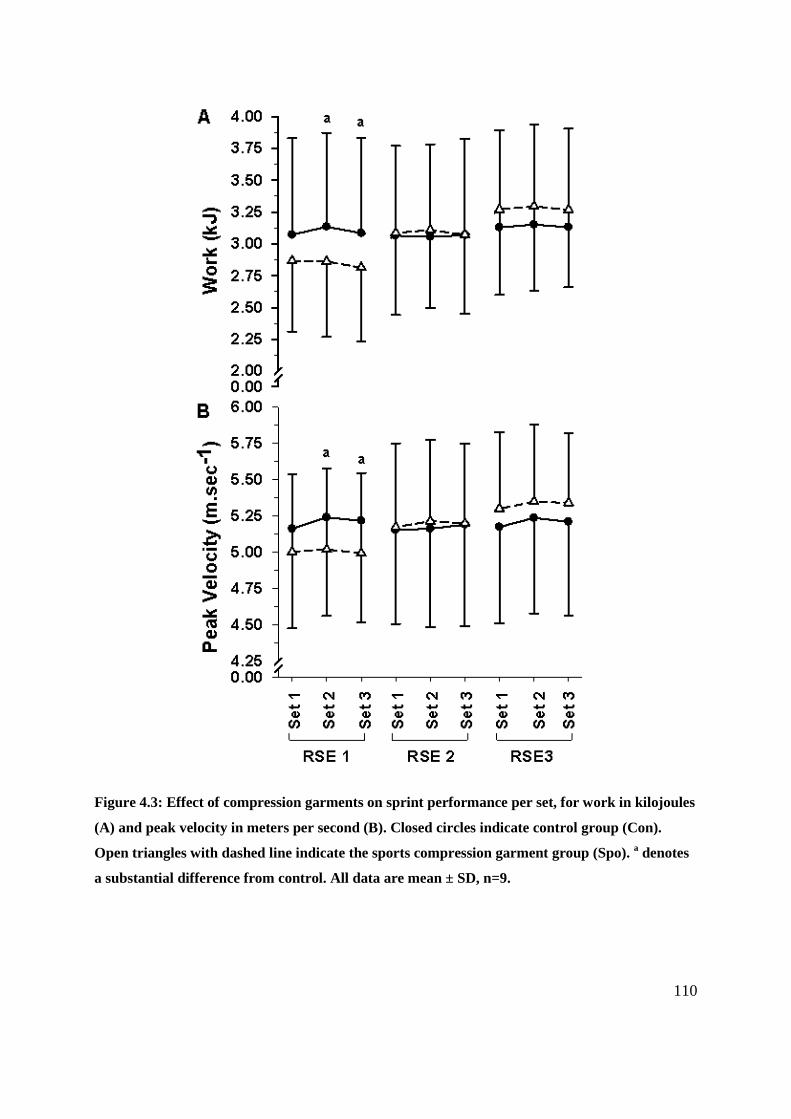
Figure 4.3: Effect of compression garments on sprint performance per set, for work in kilojoules
(A) and peak velocity in meters per second (B). Closed circles indicate control group (Con).
Open triangles with dashed line indicate the sports compression garment group (Spo). a denotes
a substantial difference from control. All data are mean ± SD, n=9.
110

The average RPE per RSE session was 7.2±1.5. The RPE for the control during RSE1, 2 and
3 was 8.0±0.8, 7.6±1.3 7.8±1.1 and 7.1±1.4, 7.1±1.5, 7.3±1.6 for the compression garment
group. The RPE did not change with day or group.
4.3.1 Acute responses to repeat sprint exercise and acute recovery responses
Decrements in running performance representative of neuromuscular fatigue were not present
when sprint performance was compared between all three sets in each RSE across the three
days (Figure 4.2 and Figure 4.3).
The SWC in perceived fatigue and muscle soreness was 16.5% and 23.0%. The immediate
increase in perceived fatigue in Con and Spo after a single RSE was 13.5- and 5.7-fold larger
than the SWC. In Con, elevated perceived fatigue persisted for 24 hr, and was 1.6-fold larger
than the SWC. Control also displayed a substantial increase in muscle soreness immediately
after the first RSE, which was 7.4 times greater than the SWC. In Con, this heightened
soreness persisted 24 hr later, the magnitude of which was 3.4-fold larger than the SWC
(Table 4.1). Participants wearing Spo had a smaller increase in soreness from Pre RSE1 than
control to 24 hr following RSE 1 (-50.3%, 0.8±0.9, extremely large) (Table 4.1), with the
magnitude of this treatment effect being 3.4-fold greater than the SWC. The probability of
this treatment effect was 88% (likely-probably). Individual muscle soreness responses to a
single RSE displayed a high level of individual variation and are displayed in Figure 4.4.
A single RSE did not elicit an increase in plasma [Mb] immediately, or 24 hr after RSE.
There were no differences between Spo and Con in the change in plasma [Mb]. Outliers in
both Con and Spo were removed for plasma [Mb], which bore no influence on the results.
Refer to Table 9.1 in Chapter 9 (Appendix) for raw plasma Myoglobin values (mean±standard
deviation).
111

Table 4.1: Acute and cumulative biochemical and perceptual responses to repeat sprint activity.
Con
Spo
Acute Response Cumulative Response
Acute Response Cumulative Response
SWC
% Pre RSE1 – Post RSE1
Pre – 24 hr Post RSE1
Pre RSE1 – 24 hr Post RSE2
Pre RSE1 - 24 hr Post RSE3
Pre RSE1 – Post RSE1
Pre – 24 hr Post RSE1
Pre RSE1 – 24 hr Post RSE2
Pre RSE1 - 24 hr Post RSE3
[Mb] 14.8% 3.1 % 42.3 % 23.5 % 30.6 %
-2.5 % 11.8 % 12.1 % 75.5 % a
0.20±0.28 unclear
0.10±0.22 unclear
0.19±0.37 unclear
0.24±0.29 unclear
0.04±0.43 unclear
0.18±0.70 unclear
0.18±0.80 unclear
0.89±0.93 moderate
Soreness 23.0%
169.6 % a,b 78.2 % a b 121.0 % 78.9 % b
17.0 % -29.8 % -29.1% -51.0 % a 0.63±0.78 moderate
0.36±0.49 small
0.50±1.16 unclear
0.37±0.74 unclear
0.12±0.35 unclear
-0.28±0.59 unclear
-0.27±0.59 unclear
-0.56±0.69 small
Fatigue 16.5%
223.9 % a,b 26.8 % a 59.6 % a b 40.3 % a
93.7 % a 25.6 % -17.2 % -30.6 % 1.5±0.93
large 0.30±0.49
small 0.60±0.54 moderate
0.43±0.29 small
0.59±0.36 small
0.20±0.41 unclear
-0.17±0.55 unclear
-0.32±0.62 unclear
Immediate changes in plasma [Mb], perceived muscle soreness and fatigue were compared acutely from Pre RSE1 to immediately Post RSE1. Acute recovery was assessed by comparing Pre RSE1 and 24 hr Post RSE1. Cumulative changes were measured by comparing Pre RSE1 to 24 hr Post RSE2 and Pre RSE1 to 24hr Post RSE3. Values are % change between the two time points, ES±90% CI and the effect size descriptor for the control group (Con) and sports compression garment group (Spo). The SWC expressed as a percentage represents estimated as 0.2 x between-subject standard deviation expressed as a CV (%) for each parameter. a denotes a substantial increase or decrease between the two time points, b denotes a substantial difference between the Con and Spo in the change between the two time points.
112

Pre RSE1
Perc
eive
d m
uscl
e so
rene
ss (a
u)
0
20
40
60
80
100
Post RSE1
Figure 4.4: Individual acute changes in perceived muscle soreness following a single RSE.
Closed circles indicate control group (Con, n=9). Open triangles with dashed line indicate the
sports compression garment group (Spo, n=9).
4.3.2 Cumulative responses to repeat sprint exercise and cumulative recovery responses
A cumulative reduction in muscle soreness occurred in participants wearing compression 24
hr following RSE3 compared to Pre RSE1 (Table 4.1). This change in muscle soreness was
2.2-fold greater than the SWC. The Con had a substantially larger (52.5%, -0.7±0.6,
moderate) increase in muscle soreness versus Spo from RSE1 to 24 hr after RSE3, 2.3-fold
larger than the SWC (Table 4.1). The probability of this treatment effect was 88% (likely-
probably).
The substantial elevation in perceived fatigue in Con 24 hr following RSE2 and RSE3 was
3.6 and 2.4-fold larger than the SWC identified for this parameter. A similar effect was not 113
apparent for Spo (Figure 4.5 and Table 4.1). Perceived fatigue was lower (-42.0%, 0.6±0.5,
moderate) in Spo than Con 24 hr following two consecutive days of RSE compared to pre
study levels (Table 4.1). The level of this treatment effect was 2.6 times larger than the SWC
for perceived fatigue, with a 94% likelihood of a true effect (likely probably – very likely).
Pre RSE1
Perc
eive
d fa
tigue
(au)
0
10
20
30
40
50
60
70
24 hr Post RSE
Figure 4.5: Individual changes in perceived fatigue. The change in perceived fatigue was
compared from Pre RSE1 to 24 hr following RSE2 (i.e. pre RSE3). Closed circles indicate
control group (Con, n=7). Open triangles with dashed line indicate the sports compression
garment group (Spo, n=9).
The SWC in plasma [Mb] was 14.8%. Plasma [Mb] was 5.1-fold greater than the SWC 24 hr
following the third RSE compared to Pre RSE1 in Spo (Table 4.1). The plasma [Mb]
response to RSE was not different between the two groups when assessing cumulative
changes. 114

4.4 Discussion
Perceptual recovery is enhanced between multiple days of high intensity exercise when
wearing sports compression. Indeed, participants experienced less soreness 24 hr after
completing not only one, but three such sessions with compression use. Further, perceptions
of fatigue were lower 24 hr after two of these sessions when using the sports garments for
recovery, compared to control participants. Neither acute nor cumulative recovery of
treadmill running performance or biochemical parameters were enhanced with compression
use, most likely resulting from an insufficiently taxing protocol. This study also suggests that
there is an uncoupling between performance and perceptual measures.
Participants wearing Spo experienced less muscle soreness both acutely and after completing
three RSE sessions compared to Con. The magnitude of the treatment effect for acute and
cumulative recovery was double that of the SWC for muscle soreness. The literature
consistently points toward a blunting of muscle soreness as a key outcome of compression
garment use for recovery (Kraemer, Bush et al. 2001a; Kraemer, Bush et al. 2001b; Duffield,
Edge et al. 2008; French, Thompson et al. 2008; Montgomery, Pyne et al. 2008b; Davies,
Thompson et al. 2009; Duffield, Cannon et al. 2010; Jakeman, Byrne et al. 2010b; Jakeman,
Byrne et al. 2010a). It is important to note that the initial increase in muscle soreness was
substantially greater in Con versus Spo. The completion of more work during RSE1 by Con
is the likely culprit facilitating this difference, despite its inclusion as a covariate in the
analysis. As symptoms of muscle damage (i.e. muscle soreness) are unlikely to present until
24-48 hr following exercise (Thompson, Nicholas et al. 1999), this initial increase in soreness
is more likely a representation of the discomfort associated with fatigue initially after the high
intensity RSE, than DOMS per se.
115

Physiologically, compression garments are suggested to offer positive effects on muscle
soreness through a mechanical blocking of oedema (Kraemer, Bush et al. 2001a; Kraemer,
Bush et al. 2001b) which is associated with muscle damage (Jones, Newham et al. 1987;
Jones, Newham et al. 1989). It is believed this occurs through a reduced hydrostatic pressure
gradient across the vessel walls (Jonker, de Boer et al. 2001). In fact oedema and swelling in
the legs of healthy individuals are reduced with compression stocking application (Jonker, de
Boer et al. 2001) and even compression hosiery (Kraemer, Volek et al. 2000). This
mechanism can only be speculated as the current study did not measure oedema, or any
physiological parameters that may indicate vessel wall hydrostatic pressure. Lower plasma
[Mb] might however indicate a reduction in oedema as plasma [Mb] (Brancaccio, Limongelli
et al. 2006; Brancaccio, Maffulli et al. 2007) and oedema (Jones, Newham et al. 1987; Jones,
Newham et al. 1989) are both associated with muscle damage. The reduction in muscle
soreness in this study in Spo was not accompanied by lower plasma [Mb] levels; in fact
plasma [Mb] remained elevated above pre study levels throughout the measurement period,
whilst muscle soreness was actually lower than pre study levels. Ultimately, the plasma [Mb]
data do not support the notion of a reduction in oedema driving the lower perceived muscle
soreness.
Sports compression abated perceived fatigue 24 hr after high intensity running conducted on
two consecutive days. The magnitude of this treatment effect was ~2.5-fold greater than the
SWC. Similarly, following three days of basketball game play, Spo use between games
facilitated 50% less perceived fatigue compared to control participants (Montgomery, Pyne et
al. 2008b). In the present study, similar to muscle soreness, Con did however experience a
greater increase in perceived fatigue immediately following the first RSE compared to the
treatment group. This difference in perceived fatigue is surprising given the greater amount of
116

work conducted during RSE1 by Con versus Spo was accounted for as a covariate in the
analysis. It is important to note that this initial difference in perceived fatigue cannot be
attributed to actual treatment effects, as treatments (Con/Spo) were not allocated until after
RSE1 was completed.
An enhanced perceptual recovery with Spo may also be driven by placebo effects.
Participants wearing Spo rated their muscle soreness as even lower than prior to starting the
study when assessed 24 hr after the third RSE. Sports compression participants also reported
lower perceived fatigue than prior to commencing the study, this time 24 hr after completing
two RSE sessions. At the same time, Con displayed substantial elevations in perceived
fatigue, and a trend towards elevated muscle soreness. As physiological mechanisms
underpinning these effects are yet to be confirmed, it would be negligent to dismiss the role
of a placebo effect.
The placebo effect has been explored in compression garment research, however it has been
limited to its influence on performance parameters (Chatard, Atlaoui et al. 2004) with no
reference yet to perceptions of muscle soreness or fatigue. For example, wearing compression
garments for recovery between cycling bouts assisted in the maintenance of cycling power
compared to a control condition (Chatard, Atlaoui et al. 2004). Of interest, fifty percent of
participants reported that the garments could have modified their second performance either a
bit, or a lot (Chatard, Atlaoui et al. 2004), highlighting the placebo effect. However, when the
garments were worn during a 40 min treadmill run (80% V.O2max) by competitive runners,
there were no differences between a placebo (12–15 mmHg at ankle) and standard sports
style lower body compression garment (23–32 mmHg at ankle) for plasma Creatine Kinase,
117

[Mb], jump height or muscle soreness (Ali, Creasy et al. 2010). It is possible that the two
levels of compression were too similar to allow for the detection of possible placebo effects.
Participants maintained sprint performance, irrespective of compression garment use as the
RSE did not elicit within, or between session decrements in sprint performance. Previous use
of this protocol in a similar participant population demonstrated reductions in mean power in
set 3 versus set 1 (-4.8%, ES±90%CI = -0.21 ± 0.07), peak power (-9.2%, -0.28 ± 0.11), and
mean velocity (-2.2%, -0.18 ± 0.33) (Serpiello, McKenna et al. 2011). Even after ten sessions
of repeated sprint training, decrements in performance were observed. For example, mean
power in set 3 was 4.1% lower than set 1 (-0.19 ± 0.06, P=0.006), and mean velocity was
reduced by 2.1% (-0.17 ± 0.06, P=0.014) (Serpiello, McKenna et al. 2011). Prior knowledge
of the RSE protocol through familiarisation may have contributed to the development of a
conservative pacing strategy in these participants (Billaut, Bishop et al. 2011), prohibiting
performance decrements. This may have been exacerbated with the knowledge of the
repetition of the RSE across three consecutive days, in contrast to its use by Serpiello et al
(2011), with only a single RSE bout performed after familiarisation. Indeed pacing occurs
during short repeated-sprint efforts in anticipation of the number of sprints that are included
in the trial (Billaut, Bishop et al. 2011). It is also plausible that 24 hr of recovery was
sufficient between RSE to permit performance maintenance. In the current study, the Con
actually performed more work, and attained higher peak velocities compared to Spo during
RSE1, specifically set 2 and 3. It is unclear why this occurred, despite the random allocation
of participants.
Regardless of intervention, the RSE was expected to elicit elevations in plasma [Mb]
(Williams 1985; Friden, Seger et al. 1988; Thompson, Nicholas et al. 1999; Howatson and
Milak 2009). Despite Con completing more work during the initial RSE session, those who
118

wore compression garments for recovery had elevated plasma [Mb] 24 hr following the final
RSE compared to pre study levels, with a similar elevation not present in Con. There was
however no clear difference between the two conditions in this change. Although asked to
refrain from activity between RSE sessions, it is possible that those wearing Spo partook in
activities that elicited muscle damage, possibly accounting for this elevation. It is otherwise
uncertain why Spo and not Con displayed elevated plasma [Mb]. Serum [Mb] also remained
unchanged with Spo use by elite basketball athletes between three games played across three
consecutive days (Montgomery, Pyne et al. 2008a).
An uncoupling between perceptual measures and performance occurred in these
recreationally active participants. Indeed Con maintained their performance despite acute and
cumulative muscle soreness and fatigue. Conversely, the lower than pre study levels of
muscle soreness and fatigue 24 hr after RSE1, 2 and 3 were not coupled with an enhanced
running performance in Spo. Rugby players experienced this uncoupling after a simulated
rugby circuit, where they were able to maintain performance 24 hr after the circuit despite
elevated perceived soreness (Duffield, Edge et al. 2008). Further, measurements of muscle
soreness only show a moderate (Hopkins 2011) correlation (r= -0.38) with the recovery of
force production following damaging eccentric arm curl exercise (Rodenburg, Bar et al.
1993). Ratings of fatigue and soreness are used in conjunction with an array of measures in
predicting an athlete’s readiness to train/compete. Thus it is important that these measures are
used in conjunction with a battery of tools to ascertain a more global overview of the athlete’s
condition and readiness to train/compete. Indeed, it may be possible for an athlete who is
experiencing muscle soreness and perceived fatigue to still perform to the required level.
However, the longer term consequences of residual soreness and fatigue may have greater
implications on performance (Lehmann, Foster et al. 1993; Kentta and Hassmen 1998).
119

4.5 Conclusions
Sports compression garment use was beneficial at improving the recovery of perceived
muscle soreness after repeat sprint activity performed on not only one occasion, but after the
completion of three sessions. Similarly, cumulative perceived fatigue was abated with sports
compression use, proving the garments to be useful in the recovery of perceptual parameters
of both soreness and fatigue. The mechanisms facilitating this effect remain unknown.
Despite evidence to the contrary in previous research, the insufficiently taxing nature of the
RSE protocol prevented conclusions regarding the influence of sports compression on the
maintenance of running performance, or plasma [Mb]. Perceived soreness and fatigue were
uncoupled from performance, and each should be treated with caution if being used as a
standalone indicator of recovery and readiness to train/compete.
120
CHAPTER 5. RECOVERY FOLLOWING ELITE
AUSTRALIAN FOOTBALL TRAINING
5.1 Introduction
The optimisation of recovery is crucial for Australian football (AF) athletes undertaking
multiple training sessions per week. Training sessions result in fatigue, muscle damage,
muscle soreness and performance reductions (Boyd, Gallaher et al. 2010; Elias, Varley et al.
2012) due to the similarity in activity profiles to actual games (Dawson, Hopkinson et al.
2004a) and the larger load incurred. These sessions are repeated up to three times per week,
in addition to resistance exercise and individual skill sessions during the competitive phase of
the year (Cormack, Newton et al. 2008a). Compression garments are routinely worn after
training sessions to improve between session recovery, despite a dearth of consistent
evidence to support their use.
Clinically, medical compression garments (Med) exert positive actions through reduced
lymphodema (Jonker, de Boer et al. 2001) and increased blood flow (Mayberry, Moneta et al.
1991; Coza, Dunn et al. 2012). Reduced exercise-induced oedema may facilitate decreased
muscle soreness (Dierking and Bemben 1998) in the ensuing recovery period, and possibly
even the functional impairments associated with such soreness (Armstrong 1986; Clarkson,
Nosaka et al. 1992; MacIntyre, Reid et al. 1995; Ruff 1999; Green, Langberg et al. 2000;
Rawson, Gunn et al. 2001). Assuming these systems are well functioning in elite athletes, it is
unknown if clinically meaningful physiological responses, which translate into an improved
recovery in the hours following exercise, will occur. Further, in studies that have obtained
these positive results, medical grade compression, that exerts a higher compressive action
rather than sports grade garments, were used. Dascombe and colleagues (2011) attempted to 121

decipher if an undersized compression garment (21.7 ± 4.3 mmHg calf region and 15.9 ± 2.6
mmHg thigh region) offered greater effects on performance and tissue oxygenation than a
regular sized compression garment (21.7 ± 4.3 mmHg calf region and 15.9 ± 2.6 mmHg thigh
region) worn during a progressive maximal test and time to exhaustion test. The authors
noted no difference between garment types in performance or physiological parameters
(Dascombe, Hoare et al. 2011). It is possible that the difference in the level of compression
offered between the two garment types was not sufficient to detect differences. Currently, it is
not know if a Med garment offers additional benefits to a Spo garments when worn during
the recovery period exclusively.
It is difficult to decipher the effectiveness of compression garments for team sport athlete
recovery, as studies often report vastly inconsistent findings, within and between studies, or
do not use typical training sessions. For example, positive recovery effects on performance
measures were not identified after sprint and plyometric activity (Duffield, Cannon et al.
2010), or a rugby circuit (Duffield, Edge et al. 2008), as performance had recovered to pre
exercise levels at the time of assessment. Conversely academy netball and basketball athletes
who wore Spo (48 hr) following drop jump exercise experienced mixed recovery outcomes.
Agility and CMJ performance were superior with garment use compared to the control.
However wearing Spo did not allow athletes to maintain sprint performance to a greater
extent versus the control (Davies, Thompson et al. 2009). Similarly, agility and line drill
ability were maintained to a greater extent with Spo use than the control 24 hr after a three
day basketball tournament consisting of three games (Montgomery, Pyne et al. 2008b). Of
concern however, there were greater decrements in vertical jump and 20 m acceleration with
Spo versus control (Montgomery, Pyne et al. 2008b). With such large inconsistencies across
the literature, it is uncertain if recovery effects are in fact consistent and reproducible if
122

investigated after more than one exercise session in isolation. This is an important
consideration, as team sport athletes complete multiple training sessions across the week.
Unlike the recovery of performance measures, more consistent positive recovery effects are
reported across the literature for perceptual measures. Perceived muscle soreness is reduced
with the use of Spo for recovery. Academy netball and basketball athletes reported lower
perceived muscle soreness than the control with Spo use 48hr after drop jump exercise
(Davies, Thompson et al. 2009). Muscle soreness was also lower in rugby athletes after sprint
and plyometric activity (Duffield, Cannon et al. 2010) and simulated rugby circuits (Duffield,
Edge et al. 2008). Further, muscle soreness and perceived fatigue were lower with Spo
between three basketball games (Montgomery, Pyne et al. 2008b). This being the only study
using athletes to assess perceived fatigue. As such, it is anticipated, that these positive
recovery effects on perceptual parameters would be reproducible within the same group of
athletes after more than one training session.
Clear effects of compression garments on biochemical markers of muscle damage during
recovery are not apparent in the literature. Plasma C-reactive protein (Duffield, Cannon et al.
2010) and plasma [CK] (Duffield, Edge et al. 2008; Duffield, Cannon et al. 2010) remained
unaltered with Spo use by rugby players after sprint and plyometric activity (Duffield,
Cannon et al. 2010) or simulated rugby circuits (Duffield, Edge et al. 2008). Serum [Mb] also
remained unchanged with Spo use during a three day basketball tournament (Montgomery,
Pyne et al. 2008a). Conversely, after elite rugby union competition, transdermal [CK] was
lower in athletes wearing Spo (12 hr overnight) compared to the control at both 36 and 84 hr
of recovery (Gill, Beaven et al. 2006). Thus it appears unlikely that compression garments
will influence post exercise circulating biochemical markers of muscle damage.
123

Accordingly, this study aimed to examine: (1) the extent to which wearing compression
garments modulate the recovery of performance, perceptual and biochemical parameters in
elite athletes, consequent to two independent Australian Football training sessions; (2)
differences in the above parameters between sports and medical style compression garments;
and (3) if positive recovery effects for compression garments are consistent and reproducible
when two independent ‘typical’ Australian Football sessions are conducted by the same
group of athletes.
5.2 Methods
5.2.1 Participants
Twenty four elite AF athletes from the same club (Age 24.2±3.5 yrs; height 189±5.6 cm;
body mass 88.6±7.6 kg (Mean ± Standard Deviation)) provided written informed consent to
participate. The experimental protocol was approved by the Victoria University Human
Research Ethics Committee. The sample size was confined to the number of participants
permitted to participate by the club.
5.2.2 Experimental overview
In a quasi-experimental design, the same participants performed a typical AF training session
(TR1), followed seven days later by a similar session (TR2). Both TR1 and TR2 were
conducted on the same day of the week, at the same time. Five participants were not cleared
to participate in TR2 by the club. Training session one and two consisted of two individual
warm ups (warm up 1 and 2), a 12 min non-contact (TR1) or contact (TR2) small sided game,
20 minute running drills, 75 minutes of football specific skills and 70 minutes of lower body
resistance training. Compression garments were worn during the 24 hr recovery period after
TR1 and TR2, and were removed whilst sleeping, showering and if any discomfort occurred
124

(Figure 5.1). It was not possible to precisely control the work conducted by participants
during the running, skills and resistance training components due to the critical stage of the
pre-season, however a session RPE was obtained after the completion of each of the
components of training. Due to limited access to participants, it was only possible to assess
participants prior to training (Pre), and 24 hr after training (+24). The warm ups, training
stimulus and recovery strategies, which are part of the team’s weekly routine, were matched
to minimise differences between testing weeks.
Run
ning
Skill
s
Res
ista
nce
trai
ning
Wear compression
VAS
Blood sample
Warm up 1
CMJ
Warm up 2
RPE
+24 measures
(VAS, blood sample, CMJ)
Figure 5.1: Experimental overview. VAS = visual analogue scale for perceived muscle soreness
and fatigue; CMJ = countermovement jump; RPE = rating of perceived exertion.
5.2.3 Measurements
Measures included blood sampling to assess plasma [Mb] (Section 3.1), VAS for perceived
muscle soreness and fatigue (Section 3.2) and CMJ flight time (FT) (Section 3.3). Measures
were taken 2 hr before TR1 and TR2 at baseline (Pre). Recovery was assessed 24 hours after
training at +24. All measurements were taken when participants were not wearing
compression garments. Additionally, an RPE rating (Section 3.2) was collected after the SSG,
running, skills and resistance training component of TR1 and 2. These athletes were
125

accustomed to using the VAS, CMJ and RPE scale as part of the routine monitoring
conducted by the club.
5.2.4 Warm ups
Prior to the Pre CMJ measure, all participants completed a standardised six minute warm up
(warm up 1) which consisted of dynamic lower body (legs and back) activities and stretches.
This warm up was used weekly by the participants as part of their routine CMJ monitoring.
Prior to the commencement of TR1 and TR2, all participants completed a standardised warm
up incorporating general running drills, flexibility, and football activities conducted by
strength and conditioning staff (warm up 2).
5.2.5 Session RPE and calculation of internal load
The session RPE method (RPE x duration [minutes]) (Foster, Florhaug et al. 2001) was used
to quantify each player’s internal load for each of the components of the training session
(excluding the warm ups) in TR1 and 2. An RPE value was obtained after each of these
components. The ‘total’ internal load represents the combination of the internal load derived
from the SSG, running, skills and resistance training components to characterise the total load
of the training session.
5.2.6 Recovery intervention
After the cessation of TR1 and TR2, participants were randomised and matched according to
playing position into one of three groups: wearing a sports grade lower body compression
garment (Skins, Australia) (Spo; TR1 n=9; TR2 n=7; Figure 5.2); a medical grade thigh high
compression garment (JOBST forMen Medical Legware, USA, 30-40 mmHg at the ankle)
(Med; TR1 n=8; TR2 n =6; Figure 5.3); or normal clothing, with little compression (Con;
TR1 n=7; TR2 n=6), which were worn until +24. Due to a lack of a validated method
126

available, the level of pressure exerted by the garments was not measured. Participants were
allocated to the same treatment group after TR1 and TR2. Compression garments (Med and
Spo) were worn for the remainder of the day and temporarily removed overnight. The
garments were worn again upon waking the next day until the +24 measure. Garments were
removed temporarily if discomfort was experienced and whilst showering. Participants were
instructed that no other recovery interventions were permitted during the recovery period.
Food and fluid intake during the recovery period was not controlled. Participants were
expected to follow post training food and fluid guidelines as prescribed by the club’s
dietitian. Participants removed the garments immediately prior to completing +24 measures.
All participants were provided with instruction on when to wear the garments as well as a
diary to record when the garments were removed (Appendix 9.1). A custom spreadsheet
designed for the analysis of post-only crossover trial with adjustment for a predictor (Hopkins
2006b) was used to determine any differences in the duration that compression garments
were worn following TR1 and TR2.
Figure 5.2: Sports compression garment.
127

Figure 5.3: Medical compression garment.
5.3 Results
Training session one and two were conducted independently. The results for each training
session are presented individually below. The mean total internal load was 1162.2±175.6 for
TR1 and 1195.6±76.1 for TR2. There were no differences in the total internal load between
TR1 and TR2.
5.3.1 Training session 1 (TR1)
There were no differences between groups in the total internal load for TR1 (Table 5.1).
When summing the RPE from each of the four components of training (score out of 40) the
RPE for TRI was 23.8±1.6 au.
128

Table 5.1: Internal load units (au) for training session one (TR1).
Con Med Spo Total
internal load
1132.7 ± 189.9 1212.9 ± 71.1 1181.9 ± 174.1
The internal load units (au) derived from the session RPE method (RPE x duration of activity, [min]). The total internal load was determined by combining the internal load for each component of the training session for the control (Con, n=7), medical (Med, n=8) and sports (Spo, n=9) compression garment groups. Values are mean±standard deviation.
Compression garments (Med and Spo) were worn for 8.5±0.6 and 10.1±3.0 hr following
TR1. The duration of compression usage was not different between Med and Spo.
The SWC for CMJ FT was 6.8% in this group of participants. Compared to Pre values, 24 hr
after TR1, FT scores were not substantially depressed in any group. There were no
differences between groups in the change in flight time from Pre to +24 (Figure 5.2).
129

Pre
Cou
nter
mov
emen
t jum
p fli
ght t
ime
(mill
isec
onds
) no
rmal
ised
to P
re v
alue
s
0.000.90
0.95
1.00
1.05
+ 24 hr
Figure 5.4: Countermovement jump flight time. Countermovement jump flight time
(milliseconds) normalised to pre values 24 hr after training session one (TR1). Data are
mean±standard deviation. Solid line and closed circles represents the control (Con, n=7), dotted
line and open circles represent the medical compression garment group (Med, n=8), and solid
grey circles with the solid grey lines represent the sports compression garment group (Spo,
n=9).
Muscle soreness was elevated 24 hr after TR1 in all groups compared to Pre. The magnitude
of this elevation for Con, Med and Spo was 23.0, 10.8, and 21.8 times the SWC, respectively.
The probability of a true effect for Con, Med and Spo was 98% (very likely), 97% (very
likely) and 100% (almost certainly), respectively. There were no differences between groups
in the change in muscle soreness from Pre to +24. Muscle soreness responses varied
markedly between participants (Figure 5.3).
130

Table 5.2: The percentage change in perceived fatigue, muscle soreness and plasma Myoglobin concentration ([Mb]) following training session 1
(TR1).
SWC Group Data sets
Pre - +24
% chances for values to be
higher/trivial/lower at +24 than Pre
Qualitative rating of the
change
% chances for Spo or Med values to be
lower/trivial/higher than Con
Rating of the treatment effect (vs
Con)
% chances for Spo values to be
lower/trivial/higher than Med
Rating of the treatment
effect (Spo v Med)
Perceived Fatigue
(au) 13.7%
Con 6 205.5 a 98/1/1 very likely - - - -
Med 7 181.5 a 94/4/2 likely-probably 45/20/35 unclear - -
Spo 9 230.5 a 100/0/0 almost certainly 33/20/47 unclear 51/19/30 unclear
Muscle Soreness
(au) 17.4%
Con 6 400.7 a 98/1/1 very likely - - - -
Med 6 187.3 a 97/2/1 very likely 71/16/13 unclear - -
Spo 9 379.4 a 100/0/0 almost certainly 42/22/36 unclear 75/12/13 unclear
Plasma [Mb]
(ng.ml-1) 12.3%
Con 3 96.5 88/4/8 unclear - - - -
Med 8 61.3 a 98/2/0 very likely 53/9/38 unclear - -
Spo 9 153.4 a 98/2/0 very likely 31/12/57 unclear 60/30/10 unclear
The SWC was calculated as 0.2 x the between subject standard deviation as a CV% (Batterham and Hopkins 2006). The number of data sets represents the number of full data comparisons available for analysis. Percentage changes (%) are compared from Pre to 24 h post TR1 (+24) for the control (Con, n=7), medical compression group (Med, n=8), and sports compression garment group (Spo, n=9). The chances (%) for each parameter to be higher, trivial, or lower at +24 than Pre for each group are presented along with a qualitative rating of the within group change. The chances (%) for a treatment effect for Med and Spo versus the Con, and Spo versus Med are also presented, along with a qualitative rating of the respective effect. a denotes a substantial change for each specific group.
131

Pre
Perc
eive
d m
uscl
e so
rene
ss (a
u)
0
20
40
60
80
100
+24 hr Figure 5.5: Individual muscle soreness responses to training session 1 (TR1). Solid line and
closed circles represents the control (Con, n=7), the dotted line and open circles represent the
medical compression garment group (Med, n=8), and the solid grey circles with the solid grey
line represents the sports compression garment group (Spo, n=9). Values are expressed in
arbitrary units (au).
The SWC for perceived fatigue was 13.7%. This perceived fatigue persisted for 24 hr after
TR1 to the order of 15.0, 13.2, and 16.8 times the SWC for Con, Med and Spo, respectively
(Table 5.2). The likelihood of this perceived fatigue for Con, Med and Spo was 98% (very
likely), 94% (likely probably) and 100% (almost certainly) respectively. There were no
differences between groups in the recovery of perceived fatigue 24 hr after TR1.
Plasma [Mb] remained elevated 24 hr after TR1 compared to Pre in the Med and Spo groups
only, and not the Con (Table 5.2). The magnitude of this increased for Med and Spo were 5
and 12.5 times the SWC, with 98% (very likely) and 98% (very likely) probability of a true
132

effect. There were no differences between groups in the change in plasma [Mb]. See Table
9.2 in Chapter 9 (appendix) for raw values for plasma [Mb] (mean±SD).
5.3.2 Training Session 2 (TR2)
There were no differences between groups in the total internal load for TR2 (Table 5.3).
When summing the RPE from each of the four components of training (score out of 40) the
RPE for TRI was 29.9±1.9 au.
Table 5.3: Internal load units (au) training session two (TR2).
Con Med Spo Total
internal load
1210.4 ± 32.4 1180.8 ± 105.7 1230 ± 89.2
The internal load units (au) derived from the session RPE method (RPE x duration of activity, [min]). The total internal load was determined by combining the internal load for each component of the training session for the control (Con, n=6), medical (Med, n =6) and sports (Spo, n=7) compression garment groups. Values are mean±standard deviation.
Compression garments (Med and Spo) were worn for 8.4±1.3 and 7.3±2.0 hr respectively
following TR2. The duration that each garment type was worn after TR2 was not different.
The SWC for FT was 1.0% in this group of participants. Neuromuscular fatigue was evident
24 hr after TR2, with substantially reduced CMJ FT in the Spo (% change, ES±90%CI; -
1.2%, 0.25±0.16, small) compared to Pre values (Figure 5.4). The magnitude of this
neuromuscular fatigue was 1.2-fold the SWC, with a 94% probability of a true effect (likely-
probably). The Med were better than the Con at returning CMJ FT to pre training levels 24 hr
after TR2 when normalised to Pre values (5.6%, 0.96±0.83, moderate) (Figure 5.4). This
difference represented 1.4 times the SWC, with a 95% (very likely) probability of a true
effect.
133

Pre
Cou
nter
mov
emen
t jum
p fli
ght t
ime
(mill
isec
onds
) no
rmal
ised
to P
re v
alue
s
0.1
0.3
0.5
0.7
0.9
1.1
+ 24 hr
a,b
Figure 5.6: Countermovement jump flight time. Countermovement jump flight time
(milliseconds) normalised to pre values 24 hr after training session 2 (TR2). Data are
mean±standard deviation. Solid line and closed circles represents the control (Con, n=6), the
dotted line and open circles represent the medical compression garment group (Med, n=6), and
the solid grey circles with the solid grey line represents the sports compression garment group
(Spo, n=7). a Denotes a substantial change from Pre to +24 in Spo only. b Denotes a substantial
difference between Med and Con in the change in CMJ FT from Pre to +24.
Perceived muscle soreness had recovered to Pre levels 24 hr after TR2 (Table 5.4). Muscle
soreness responses varied markedly between participants in Spo (Figure 5.5). No treatment
effects were observed for the recovery of muscle soreness values.
134

Table 5.4: The percentage change in perceived fatigue, muscle soreness and plasma Myoglobin concentration ([Mb]) following training session two
(TR2).
SWC Group Data sets
Pre - +24
% chances for values to be higher/trivial/lower
at +24 than Pre
Rating of the change
% chances for Spo or Med values
to be lower/trivial/higher
than Con
Rating of the treatment effect
(vs Con)
% chances for Spo values to be
lower/trivial/higher than Med
Rating of the treatment effect
(Spo v Med)
Perceived Fatigue (au)
6.7% Con 6 114.2 a 100/0/0 almost certainly - - - -
Med 6 23.3 a,b 88/8/4 likely - probably 98/2/1 very likely - -
Spo 7 15.9 b 64/18/18 unclear 96/2/2 very likely 51/16/33 unclear
Muscle Soreness (au) 8.1%
Con 6 25.8 62/22/16 unclear - - - -
Med 6 26.8 83/10/7 likely -probably 42/18/40 unclear - -
Spo 7 -1.8 25/43/32 unclear 66/16/19 unclear 79/12/9 unclear
Plasma [Mb] (ng.ml-1) 9.2%
Con 5 24.7 73/21/6 unclear - - - -
Med 6 18.1 73/24/3 unclear 24/32/44 unclear - -
Spo 7 65.0 a,c 100/0/0 almost certainly 56/22/22 unclear 91/8/2 likely - probably
The SWC was calculated as 0.2 x the between subject standard deviation as a CV% (Batterham and Hopkins 2006). The number of data sets represents the number of full data sets available for analysis. Percentage change (%) are compared from Pre to 24 h post TR2 (+24) for the control (Con, n=6), medical compression group (Med, n=6) and sports compression garment group (Spo, n=7). The chances (%) for each parameter to be higher, trivial, or lower at +24 than Pre for each group are presented along with a qualitative rating of the within group change. The chances (%) for a treatment effect for Med and Spo versus the Con, and Spo versus Med are also presented, along with a qualitative rating of the respective effect. a denotes a substantial change for each specific group. b indicates a substantial difference compared to the Con in the change between Pre and +24. c indicates a substantial difference between Spo and Med in the change between Pre and +24.
135

Pre
Perc
eive
d m
uscl
e so
rene
ss (a
u)
0
10
20
30
40
50
60
70
80
+24 hr
Figure 5.7: Individual muscle soreness responses to training session two (TR2). Solid line
and closed circles represents the control (Con, n=6), the dotted line and open circles
represent the medical compression garment group (Med, n=6), and the solid grey circles
with the solid grey line represents the sports compression garment group (Spo, n=7).
Values are expressed in arbitrary units (au).
Perceived fatigue remained elevated 24 hr after TR2 compared to Pre in the Med and
Con. This elevation represented 17 and 3.5 times the SWC for Con and Med, with 100%
(very likely) and 88% (likely, probably) likelihood of a true effect. The elevation at +24
compared to Pre was substantially greater in the Con compared to Spo and Med (45.9%,
1.63±1.31, large; and 42.5%, 1.50±1.02, large, respectively) (Table 5.4). The magnitude
of this treatment effect was 6.9- and 6.3-fold the SWC, with 96% (very likely) and 98%
(very likely) probability of a true effect, respectively.
Plasma [Mb] remained elevated 24 hr after TR2 in the Spo compared to Pre, with even
greater levels in Spo versus Med (26.4%, 0.65±0.59, moderate). The magnitude of this
difference was 2.9 times the SWC, with 91% probability of a true effect (likely-
136

probably) (Table 5.4). See Table 9.3 in Chapter 9 (appendix) for raw values for plasma
[Mb] (mean±SD).
5.3.1 Training Session 1 versus Training Session 2
When all groups were combined for TR1 and TR2, plasma [Mb], muscle soreness and
perceived fatigue were all higher after TR1 versus TR2. There were no differences
between TR1 and TR2 for total internal player load and session RPE.
Table 5.5: Training session one versus training session two.
Myoglobin Soreness Fatigue CMJ FT
Difference (%) 32.93 % 72.08 % 53.31 % 0.61 %
ES±90%CI 0.80±0.51 2.14±0.76 3.02±1.70 0.02±0.08
Rating of the difference
very likely most likely most likely most likely trivial
The percentage difference in plasma Myoglobin concentration, muscle soreness, perceived fatigue and countermovement jump flight time (CMJ FT) after training session one versus training session two.
5.4 Discussion
This study demonstrates for the first time that Med compression garments can enhance
the recovery of CMJ performance following elite team sport training (TR2), although
this response is inconsistent. The rise in perceived fatigue was blunted when participants
wore both styles of compression (Med and Spo) after TR2 but not TR1. Yet muscle
soreness remained unchanged with compression garment use after both training
sessions. This study also reports an uncoupling between perceptual measures and
performance after both training sessions. For the first time the effectiveness of a Med
and Spo garment for recovery were compared in a team sport scenario, with higher [Mb]
present in those wearing Spo versus Med 24 hr after TR2. Positive recovery effects for
137

compression garment use were not consistent and reproducible across both training
sessions. Each of these training sessions were conducted in an independent manner, thus
key findings will be discussed exclusively, culminating with a discussion regarding the
inconsistencies between TR1 and 2.
5.4.1 Training session one
Participants did not display neuromuscular fatigue 24 hr after TR1, with CMJ FT
recovering to pre training levels at this time in all groups. As a consequence it is not
possible to ascertain the effect of wearing compression garments on CMJ FT after this
training session. It is not clear why full recovery occurred in all groups, but it is likely to
be associated with conducting post testing too long after the session and/or the training
session was not intense enough to observe performance fatigue after 24 hrs.
Even after twenty four hours of recovery, and the use of compression garments, these
elite participants still had elevated perceived muscle soreness after TR1. Indeed, the
garments were no more effective than the Con at reducing perceived muscle soreness.
This finding conflicts with other compression garment research which consistently
points to positive recovery effects on this perceptual parameter (Kraemer, Bush et al.
2001a; Duffield, Edge et al. 2008; French, Thompson et al. 2008; Montgomery, Pyne et
al. 2008b; Jakeman, Byrne et al. 2010b; Jakeman, Byrne et al. 2010a). It is unclear why
similar effects were not detected in this group of participants.
All groups of participants also reported heightened perceived fatigue 24 hr after training.
Yet the use of neither style of compression was able to abate this rise in perceived
fatigue. Conversely, the recreationally active participants in Chapter 4, and elite
basketball athletes (Montgomery, Pyne et al. 2008b), experienced less perceived fatigue
when they wore Spo for recovery after repeat sprint exercise and basketball game play.
It is unclear why compression garments did not influence this perceptual parameter. 138

Perceptual responses can vary markedly between participants, and it is possible that this
may have clouded the ability to detect recovery effects for Spo and Med following TR1
for perceived fatigue and muscle soreness. Such variation possibly stems from
differences in the interpretation of the word anchors at either end of the VAS, combined
with the ability to accurately mark the VAS, particularly as the athlete’s previous
markings on the VAS were not displayed. It is also possible that players responded
differently to the visual analogue scale as they viewed it as being part of a research
project, rather than part of their daily wellness monitoring. What’s more, there is a
highly variable level of fatigue in an elite athlete population, indeed Mooney et al 2012
noted that 46% of AF athletes commenced competition in a fatigue state, with depressed
CMJ FT:CT. Thus it is highly likely that this variability in fatigue represented through
depressed performance would also be expressed in a varied level of perceived fatigue.
Elite AF training elicited substantial increases in plasma [Mb], a biochemical indicator
of muscle damage, in those wearing compression garments (Med and Spo). A similarly
‘statistically substantial’ increase in plasma [Mb] was not observed in Con, despite the
magnitude of the increase in Con being 8 times the SWC. Only three full data sets were
available for statistical analysis in the Con, which probably hindered the detection of a
substantial increase, particularly as there was an 88% likelihood of a true effect. The
lack of more ‘complete’ data sets was the consequence of difficulty obtaining blood
samples from some participants at either Pre or +24. It is probable that this also limited
the detection of treatment effects for Med and Spo compared to Con. Similarly, serum
[Mb] in elite basketball athletes was not different to the control after wearing Spo
between games in a three day tournament (Montgomery, Pyne et al. 2008a), or after
resistance exercise (French, Thompson et al. 2008).
139

Chapter 4 discusses an uncoupling between perceptual measures and performance in
recreationally active participants in the Con. It also highlights a similar occurrence after
a simulated rugby circuit (Duffield, Edge et al. 2008). In this group of participants, an
uncoupling was observed for all groups 24 hr after TR1. Participants were able to
maintain their CMJ performance, despite reporting elevated scores for perceived fatigue
and muscle soreness.
5.4.2 Training session two
This study establishes for the first time that a Med compression garment can assist in the
recovery of neuromuscular fatigue measured through a CMJ after team sport training
(TR2). Twenty four hours after TR2, CMJ FT had recovered to pre training levels in
Med and Con participants, with Med proving more effective than the Con. In fact, the
magnitude of this effect was 1.2-fold the SWC. A corresponding effect was not observed
for Spo, with these participants displaying neuromuscular fatigue 24 hr after TR2. It was
expected that all participants would experience similar levels of neuromuscular fatigue
ensuing from TR2 consequent to similar internal loads and the randomisation of
treatment groups. As it was not possible to obtain data immediately after TR2, it is
difficult to determine if the depressed CMJ FT in Spo at +24 represents a greater volume
of neuromuscular fatigue resulting from TR2, or an inferior recovery. As the change in
CMJ FT was not substantially different between Spo and Con, an inferior recovery
appears less likely. This lack of perturbation does however highlight the small amount of
neuromuscular fatigue after a typical pre season training session, with 24 hr of recovery
being adequate to return CMJ to pre training levels. This could be in part explained by
the time of season that data was collected, and equally possible that later during the
season, more prominent neuromuscular fatigue would be observed due to training. For
example, CMJ1Flight time:Contraction time was substantially reduced on 60% of
140

measurement occasions throughout the competitive versus to pre season. These
magnitudes of change compared to pre season ranged from 1.0 ± 7.4% (ES 0.04 ± 0.29)
to -17.1 ± 21.8% (ES -0.77 ±0.81)(Cormack, Newton et al. 2008b). The literature points
to an enhanced recovery of jump performance after resistance exercise in resistance
trained individuals, and plyometric activity in untrained participants (French, Thompson
et al. 2008; Jakeman, Byrne et al. 2010b; Jakeman, Byrne et al. 2010a) when using Spo
for recovery. No other study has investigated the recovery effects of Med on CMJ
performance.
The exact mechanisms facilitating an improved recovery of CMJ performance with the
Med compression garment are yet to be elucidated. Although not investigated directly in
this study, there is evidence to suggest the contribution of a placebo effect to improved
performance outcomes with compression use (Chatard, Atlaoui et al. 2004).
Alternatively, it may be argued that a blunting of soreness may facilitate this
performance improvement, particularly as DOMS is associated with performance
impairments (Armstrong 1986; Clarkson, Nosaka et al. 1992; MacIntyre, Reid et al.
1995; Dierking and Bemben 1998; Clarkson and Sayers 1999; Rawson, Gunn et al.
2001; Braun and Dutto 2003). Yet, neither compression style aided the recovery of
muscle soreness following this training session, as this perceptual parameter had
recovered at +24, reducing the likelihood of this mechanism.
Twenty four hours after TR2, perceived muscle soreness had returned to pre training
levels. Accordingly, it is not possible to establish the effect of wearing compression
garments on perceived muscle soreness after this training session. It is not clear why full
recovery occurred in all groups, but it is likely to be associated with conducting post
testing too long after the session and/or the training session was not intense enough to
observe elevated perceived muscle soreness after 24 hrs. It is also feasible that the large
141

level of individual variation precluded the statistical detection of muscle soreness at +24,
and thus recovery effects. For example, the increase in muscle soreness in the Con was
3.2-fold the SWC, but displayed only a 62% chance of a true effect, highlighting the
degree of uncertainty. The Med also displayed an increase in muscle soreness 3.3 times
the SWC, but this time displayed a higher probability of a true effect (83%). However,
the effect was categorised as ‘unclear-get more data’, suggesting more participants were
required. When individual muscle soreness responses were plotted, Spo actually
displayed the largest level of individual variation. It is likely that this resulted in the
inability to detect an increase in perceived muscle soreness at +24. Thus it is possible
that elevations in muscle soreness at +24, and possibly treatment effects, would have
been seen if individual variation was reduced.
Conversely, these elite AF participants had lower perceived fatigue 24 hr after TR2 with
both Med and Spo compared to the Con. The magnitude of these treatment effects were
6.3- and 6.9-fold the SWC respectively. The recreationally active participants in Chapter
4, and elite basketball athletes (Montgomery, Pyne et al. 2008b) also experienced less
perceived fatigue when they wore Spo for recovery after repeat sprint exercise and
basketball game play. Differences in internal load values are unlikely to be responsible
for these treatment effects as all groups recorded similar values. The mechanisms
underpinning this recovery effect for compression garments are yet to be made clear,
and may in part be linked to placebo effects. See Section 4.3 for a discussion of the
placebo effect.
Elevated plasma [Mb], a biochemical marker of muscle damage, 24 hr after TR2
suggests the occurrence of a substantial volume of muscle damage in Spo participants.
Those wearing Spo had even higher plasma [Mb] than Med. It could be that the higher
level of compression afforded to Med allowed a more substantial increase in limb blood
142

flow (Mayberry, Moneta et al. 1991), and possibly clearance of Mb from the plasma
than Spo. However it cannot be ruled out that differences in the volume of muscle
damage occurring as a result of TR2 may instead have driven this difference. The
inability to collect data immediately after TR2 to quantify the immediate increase in
plasma [Mb] was a key limitation in interpreting these results.
Perceptual and performance parameters were uncoupled in Con, Med and Spo
participants after TR2. A similar occurrence was reported in Chapter 4, and also for
rugby players after a simulated rugby circuit (Duffield, Edge et al. 2008). As noted
above, perceptual parameters should be included in a battery of tests to assess athlete
readiness to train, rather than as standalone measures.
5.4.3 Inconsistent effects between TR1 and TR2
Consistent recovery effects with compression garment use were not seen after TR1 and
TR2. Indeed, Med participants had a superior recovery of CMJ FT and perceived fatigue
after TR2. What’s more, those wearing Spo also had an improved recovery of perceived
fatigue after TR2. These positive recovery effects were not observed after TR1. In fact
no positive recovery effects were detected after TR1.
It is possible that the lack of consistent recovery effects across TR1 and TR2 are linked
to inconsistencies in the performance, perceptual and biochemical responses after these
two training sessions. Perceived muscle soreness and fatigue were elevated after TR1 in
all groups. Yet 24 hr after TR2 muscle soreness had recovered to pre training levels,
with heightened perceived fatigue present only in the Med and Con. What’s more,
neuromuscular fatigue was evident only in Spo after TR2. The only similarities
identified between TR1 and 2 were the elevated plasma [Mb] in Spo, and an uncoupling
between perceptual and performance measures.
143

Although the duration and training activities of TR1 and TR2 were the same, it is
possible that participants experienced differences in parameters investigated as a
consequence of the training sessions. A key limitation of this study was the inability to
quantify perturbations in these parameters immediately after TR1 and 2 due to limited
player access. Although desirable, it was not possible to use GPS technology to quantify
the activity profile of participants during the SSG, running and skill components of the
training sessions. Interestingly, plasma [Mb], muscle soreness and perceived fatigue
were all higher after TR1 versus TR2, yet positive recovery effects were detected after
TR2 for CMJ FT and perceived fatigue. Thus differences between TR1 and TR2 appear
not to have influenced recovery responses here.
Although not compared statistically, it is important to note that the smallest worthwhile
change for each parameter differed between TR1 and TR2, with uniformly higher
thresholds identified for TR1. These higher thresholds may help explain the lack of
treatment effects after TR1. The SWC was calculated taking into consideration the
variability in the pre-training measures. This highlights that across an athlete population,
there is likely to be a large degree of variation in the ‘freshness’ of the athlete. It may be
that when using this type of analysis to monitor athletes, that individual, rather than
group thresholds, should be established for the SWC in the most ‘fatigue free state’ to
detect practically important magnitudes of change when assessing recovery.
5.5 Conclusion
Elite AF participants experience elevated plasma [Mb], perceived fatigue and muscle
soreness, coupled with depressed performance 24 hr after training sessions. Participants
wearing both Spo and Med experienced less perceived fatigue 24 hr after TR2. Those
wearing Med after the second training session also experienced a superior recovery of
144

CMJ performance compared to the control. The higher values for plasma [Mb] 24 hr
after both AF training sessions with Spo use versus Med is likely the result of training
activities, rather than a treatment effect. After elite AF training, perceptual measures are
uncoupled from measurement of performance. Positive recovery effects for compression
garments were not consistent and reproducible when two independent AF training
sessions are conducted. Thresholds for the detection of meaningful effects can vary
between training sessions. A key limitation of this study was the inability to obtain data
immediately after the training session.
145

CHAPTER 6. RECOVERY EFFECTS OF MEDICAL AND
SPORTS COMPRESSION GARMENTS AFTER ELITE
AUSTRALIAN FOOTBALL COMPETITION
6.1 Introduction
Australian football athletes are placed under a large physical strain during competition
games. During games, athletes will cover roughly 150 m per minute of game play
(Aughey 2011), and undertake a maximal acceleration on average each minute (Aughey
2010). This is exacerbated by repeated collisions with opposition players and the ground
(Dawson, Hopkinson et al. 2004b). Chapter 5 illustrated the high requirement for
recovery in this football code after training sessions. The longer duration and larger
playing field used during games are expected to elicit substantially more muscle
soreness, perceived fatigue, muscle damage and neuromuscular fatigue than AF training,
ultimately dictating an even greater need for recovery. Australian football athletes wear
sports compression garments (Spo) in the hours and days after competition for recovery,
despite a scarcity of evidence to support their use in this manner.
The higher level of compression in medical style garments (Med) is anticipated to
facilitate recovery to a greater extent versus sports style garments, through alterations to
vascular (Mayberry, Moneta et al. 1991) and lymphatic properties (Jonker, de Boer et al.
2001). This was not the case following AF training, where obvious differences in
recovery properties were not detected (Chapter 5). Both garment styles improved the
recovery of perceived fatigue, with medical compression also decrements in CMJ
performance, however neither garment proved superior.
146

There is a scarcity of scientific investigation into the effects of compression garments for
recovery from team sport competition. Elite rugby union athletes had lower transdermal
[CK] after competition when they wore Spo for recovery (Gill, Beaven et al. 2006). The
meaningfulness of these results is diluted by reliability and validity concerns associated
with this measure (Section 2.7.3). Conversely, serum [Mb] remained unchanged with
Spo at the end of a three day basketball tournament when elite athletes wore the
garments between games (Montgomery, Pyne et al. 2008a). However, perceived fatigue
and muscle soreness were lower at the end of the tournament with garment use
(Montgomery, Pyne et al. 2008b). In those same athletes, agility and line drill
performance benefited from wearing the garments, yet there were larger decrements in
vertical jump and 20 m acceleration versus control (Montgomery, Pyne et al. 2008b). A
host of factors make it difficult to extrapolate these positive recovery responses to the
AF post game period. For example, the basketball tournament was conducted during the
pre-season, weakening comparisons to in-season competition, especially considering
that the stress response (cortisol) and session RPE values are substantially lower
following simulated basketball games versus official competition (Moreira, McGuigan
et al. 2012). Further, there are vast differences in playing field area and game time with
AF competition, compared to basketball games. Finally, basketball game play lacks a
high level of physical contact, a key feature of AF competition. Thus a more
comprehensive investigation into recovery effects of compression garments after a
contact team sport is required.
This study therefore aimed to: (1) quantify the extent of muscle soreness, perceived
fatigue, muscle damage and performance test impairments following elite AF
competition (2) investigate the capacity of compression garment use to enhance recovery
147

following an elite AF game; and (3) investigate any differences in recovery responses
between a sports and medical grade garment following an AF match.
6.2 Methods
6.2.1 Participants
Twenty two elite AF athletes from the same team ((Mean ± Standard Deviation) Age
24.2±3.5 yrs; height 189±5.6 cm; body mass 88.6±7.6 kg) provided written informed
consent to participate. The experimental protocol was approved by the Victoria
University Human Research Ethics Committee. During AF competition games, only 22
athletes are allowed to participate per team, restricting participant numbers. It was not
possible to repeat the experimental protocol during additional games to increase the
participant numbers.
6.2.2 Experimental overview
All participants played in the same competition game, where pre game (Pre), post game
(Post) and 40 hr post game (+40) measures were taken (Figure 6.1: Experimental
overview). Measures included blood sampling to assess plasma [Mb] (Section 3.1), VAS
for perceived muscle soreness and fatigue (Section 3.2) and CMJ flight time (FT) and
flight time to contraction time ratio (FT:CT) (Section 3.3). Additionally, an RPE rating
(Section 3.2) was collected at Post. This investigation was conducted in an elite athlete
training environment, as such, participants completed their normal post game routines
which included assessment and treatment by the clubs physiotherapists and
myotherapists.
148

Figure 6.1: Experimental overview. Measurements were collected at baseline, immediately
after the game, and 40 hr after the game. Measurements taken were a countermovement
jump (CMJ), visual analogue scale (VAS) for perceptions of fatigue and muscle soreness,
and a venous blood sample for plasma Myoglobin concentrations. Compression garments
were worn between the end of the game until 40 hr later at the follow up recovery session.
6.2.3 Session RPE and internal load on participants
An RPE value was obtained after the game. The session RPE method (RPE x duration
[minutes]) (Foster, Florhaug et al. 2001) was used to quantify the internal load placed on
each player for the game, and expressed in arbitrary units (au).
6.2.4 Recovery intervention
Within one hour post game, participants were matched for playing position and
randomly assigned to one of three recovery conditions: a lower body sports compression
garment (Spo, Skins Australia; n=7), thigh high medical compression socks (Med,
JOBST forMen Medical Legware, USA, 30-40 mmHg at the ankle; n=8); or the control,
normal clothing that exerted minimal compression (Con; n=7). All garments were worn
within one hour post game until +40. Normal post game recovery regimes (3-4 min
walk, stretch-band assisted flexibility routine and 5-6 min cold water immersion to the
arm-pits (12-15°C)) were completed by all participants before compression garments
149

were applied. The post game recovery regime was overseen by the club’s strength and
conditioning staff. Compression garments were temporarily removed if discomfort was
experienced. The removal of the garments by participants was confirmed verbally by the
researchers at +40. Participants were advised to abstain from alcohol consumption
during the recovery period prior to data collection at +40.
6.3 Results
Mean total playing time, and internal load as determined by the session RPE method,
were 99±12.4 min and 1076.8±139.5 au respectively. No differences between groups
occurred for playing time or player load (Table 6.1).
Table 6.1: Internal load units (au) obtained from the game and total time spent on the field
(min) during the game.
Con Med Spo
Internal Load Units (au) 1122.3±124.0 1075.0±155.0 1033.5±141.9
Game Time (min) 104.03±12.67 99.49±12.93 93.41±10.65
Internal player load units (au) were determined by the session RPE method and total playing time (min) obtained during the game for the control (Con, n=7), medical compression garment (Med, n=8) and sports compression garment group (Spo, n=7). All values are mean±standard deviation.
The SWC for perceived muscle soreness was 11.9%. All groups had an immediate
increase in perceived muscle soreness. The magnitude of this increase was 13.9, 7.1 and
4.7 times the SWC for the Con, Med and Spo. Forty hours later perceived muscle
soreness had recovered to pre game levels (Table 6.2). There were no differences
between groups in muscle soreness responses. A large degree of individual variability
was observed in this measure in all groups (Figure 6.2).
150

Table 6.2: Perceptual responses to Australian football competition.
SWC
Pre - Post Pre - +40 Post - +40
Perceived Fatigue
11.1%
Con 178.3 % a
(0.99±0.70) moderate
140.0% (0.85±1.84)
unclear
-34.3 % a (-0.41±0.54)
small
Med 187.8% a
(1.01±0.81)
moderate
104.6% (-0.68±1.87)
unclear
-13.3% (-0.14±0.21)
unclear
Spo 8.8%
(0.64±1.12) unclear
-39.9% (-3.88±6.56)
unclear
-33.0% (-3.05±4.14)
unclear
Muscle Soreness 11.9%
Con 165.3 % a
(0.85±0.61) moderate
84.1 % (0.54±1.75)
unclear
-57.2 % a (-0.75±0.76)
unclear
Med 84.4 % a
(0.65±0.62) moderate
74.3 % (0.59±2.06)
unclear
-16.4 % (-0.19±0.74)
unclear
Spo 55.4 % a
(0.80±0.89)
moderate
-65.4 % (-1.92±2.88)
unclear
-51.7 % (-1.31±2.07)
unclear
The SWC was calculated as 0.2 x the between subject standard deviation as a CV% (Batterham and Hopkins 2006) and represented as a percentage (%). Change in perceived fatigue and muscle soreness from Pre to post game (Post), Pre to 40 h post game (+40), and Post to +40 for the control, (Con; n=7), medical compression (Med; n=8) and sports compression groups (Spo; n=7). All values are % change between the two time points, ES±90%CI and the effect size descriptor. a indicates a substantial change between time points. b indicates a substantial change between groups.
151

Pre
Perc
eive
d m
uscl
e so
rene
ss (a
u)
0
20
40
60
80
100
Post + 40 hr
Figure 6.2: Individual muscle soreness responses to an Australian Football game. Solid line
and closed circle represents the control (Con, n=7), the dotted line and open circles
represent the medical compression garment group (Med, n=8), and the closed grey circles
with the solid grey line represents the sports compression garment group (Spo, n=7).
The SWC identified for perceived fatigue was 11.1%. Perceived fatigue increased 16.1-
fold the SWC in Con and 16.9-fold the SWC in Med immediately after the game (Post).
This immediate elevation had decreased substantially in Con only 40 hr later (Table 6.2).
After 40 hr of recovery, perceived fatigue was not elevated above pre game levels in any
group. Perceived fatigue displayed a large level of individual variability; individual
responses are displayed in Figure 6.3.
152

Pre
Perc
eive
d fa
tigue
(au)
0
20
40
60
80
100
Post + 40 hr Figure 6.3: Individual perceived fatigue responses to an Australian Football game. Solid
line and closed circle represents the control (Con, n=7), the dotted line and open circles
represent the medical compression garment group (Med, n=8), and the closed grey circles
with the solid grey line represents the sports compression garment group (Spo, n=7).
The SWC for plasma [Mb] was 11.6%. Plasma [Mb] was elevated immediately after the
game in each group (Table 6.3). The magnitude of this increase was 127.1, 98.7 and
324.1 times larger than the SWC for the Con, Med and Spo. In the Spo, plasma [Mb]
was increased from Pre to Post more than in the Med (250.8%, 3.11±1.74, very large)
and Con (186.6%, 1.87±1.57, large) (Table 6.3). The magnitude of this difference was
21.6- and 16.1-fold the SWC for Med and Con respectively. Forty hours after the game,
the increase in plasma [Mb] compared to Pre concentrations was substantially greater
(61.7%, 2.38±2.04, very large) in athletes wearing Spo versus Med. This difference was
5.3 times the SWC, with 96% probability of a true effect (very likely). Refer to Table
153

9.4 in Chapter 9 (Appendix) for raw plasma Myoglobin values (mean±standard
deviation).
Table 6.3: Change in plasma Myoglobin ([Mb]) concentration (ng.ml-1) following elite
Australian football competition.
Pre - Post Post - +40 Pre - +40
Con
1473.9 % a
(3.34±0.76)
very large
-92.2 % a
(-3.08±1.00)
large
43.3 % (0.44±0.89)
unclear
Spo
3759.1 % a,b,c
(4.94±0.82)
extremely large
-96.8 % a
(-4.65±0.87)
extremely large
50.5 % c
(0.55±1.35)
unclear
Med
1145.0 % a
(4.90±0.88)
extremely large
-93.5 % a
(-5.32±1.22)
extremely large
14.7 %
(0.27±0.64)
unclear
Samples were collected at pre game (Pre), post game (Post) and 40 hr post game (+40) for the control (Con, n=7), sports compression (Spo, n=7) and medical compression garment (Med, n=8) groups. Values are percentage change, ES±90% CI, and the effect size descriptor. a denotes a substantial difference between the two time points. b denotes a substantial difference compared to the Con in the change between two time points. c denotes a substantial difference between Med and Spo in the change between two time points.
The game caused immediate reductions in CMJ FT only in the Spo (Table 6.4). This
reduction was 2.6-times the SWC. Compared to pre game scores, CMJ FT was
depressed 40 hr after the game in athletes wearing Spo and Med, but not the Con. The
magnitude of this neuromuscular fatigue was 2.6-fold the SWC for both Spo and Med.
Countermovement jump FT:CT was depressed immediately after the game only in
athletes in the Med and Spo (Table 6.4). This reduction in performance was 2.2 and 3.3
times the SWC for Med and Spo. Forty hours after the game, these scores remained
substantially depressed compared to Pre in both compression garment groups. This
154

represented 3.0 times the SWC for Med, and 2.8 times the SWC for Spo. A similar
effect was not seen in the Con. There were no differences between conditions in the
change in flight time, or flight time:contraction time scores.
Table 6.4: Countermovement jump variables following Australian football competition.
CMJ FT CMJ FT:CT
SWC 1.6% 6.9%
Pre - Post Pre – +40 Pre - Post Pre – +40
Con 0.1%
(0.02±0.83) unclear
-1.9% (-0.28±0.47)
unclear
7.4% (0.11±0.53)
unclear
-12.1% (-0.20±0.45)
unclear
Med -2.0%
(-0.41±0.70) unclear
-4.3% a (-0.86±0.59)
moderate
-15.3% a (-0.45±0.56)
moderate
-20.8% a (-0.61±0.41)
moderate
Spo -4.2% a
(-0.75±0.80) moderate
-4.2 % a (-0.76±0.24)
moderate
-22.9% a (-0.74±0.61)
moderate
-19.0% a (-0.60±0.43)
moderate
Change in countermovement jump (CMJ) flight time (FT, milliseconds) and flight time:contraction time ratio (FT:CT) from pre (Pre) to post game (Post) and Pre to 40 h post game (+40), in the control (Con, n=7), medical (Med, n=8) and sports (Spo, n=7) compression garment groups. The SWC was calculated as 0.2 x the between subject standard deviation as a CV% (Batterham and Hopkins 2006) and represented as a percentage (%). All values are % change between the two time points, ES±90%CI and the effect size descriptor. a indicates a substantial change between time points. b indicates a substantial change compared to the Con. C indicates a substantial change between Med and Spo.
155
6.4 Discussion
High levels of muscle soreness, perceived fatigue and muscle damage are elicited after
elite AF competition. Even forty hours later, neuromuscular fatigue as measured by a
CMJ test is still present in athletes (Spo and Med), despite the use of compression
garments. Wearing a Med or Spo garment did not accelerate the recovery of perceptual,
physiological or performance test (CMJ) parameters in these elite athletes when used as
a recovery tool. Indeed, the level of compression, or type of garment, made no
difference to recovery. In line with Chapter 4 and 5, perceived fatigue and muscle
soreness appear uncoupled from performance test results.
This study characterised muscle damage through a biochemical marker, perceived
muscle soreness and fatigue which manifests from elite AF competition. This work
supports the findings of Young et al (2012), where high levels of Creatine Kinase were
observed 24 hr after elite junior AF competition (Young, Hepner et al. 2012). The
neuromuscular fatigue present after competition, measured through CMJ analysis,
mirrors that of previous investigations (Cormack, Newton et al. 2008a). In athletes with
neuromuscular fatigue (Med and Spo), even after 40 hr of recovery, the use of
compression garments and the club’s traditional hydrotherapy protocol did not return
CMJ test performance to pre fatigued standards, confirming the high recovery
requirement of this code of football.
Unlike Chapter 5, where Med accelerated the recovery of CMJ FT after AF training,
wearing either style of compression garment made no difference to the recovery of CMJ
performance after this AF game. Upon initial inspection, the presence of neuromuscular
fatigue at +40 in both compression groups suggests negative influences of these
garments on the recovery of CMJ parameters. However, the absence of depressed CMJ
156

performance immediately post game in Con best explains the subsequent lack of
neuromuscular fatigue at +40, rather than an inferior recovery with Med or Spo. Athletes
were randomised across conditions, thus it remains ambiguous why discrepancies in post
game CMJ performance occurred. Inconsistencies in the effect of Spo on jump test
performance are reported in the literature. Indeed, Spo use either enhanced (Rusko 1996;
Jakeman, Byrne et al. 2010b; Jakeman, Byrne et al. 2010a), reduced (Rusko 1996), or
had no effect (Davies, Thompson et al. 2009) on CMJ performance recovery. What’s
more, the positive recovery effects of Med on CMJ recovery in Chapter 5 were not
consistent across both training sessions conducted, only proving effective after training
session number two.
These elite AF athletes experienced muscle soreness and perceived fatigue immediately
after the game. The magnitude of this soreness ranged from 4.7 to 13.9 times the SWC.
Sensations of soreness were not expected to manifest until 12-48 hr after the game
(Dawson, Gow et al. 2005), with this perceptual response more likely reflecting fatigue
sensations from the game and soreness from physical contact with opposition
participants and the ground. Yet this was not reflected through actual ratings of
perceived fatigue across all groups, with athletes wearing Spo lacking this immediate
change in perceived fatigue. There were ‘high’ pre game values for some athletes.
Mooney et al reported that elite 46% of AF athletes commenced competition in a fatigue
state, with depressed CMJ FT:CT (Mooney, Cormack et al. 2012). Similarly to Chapter
5, participants did not experience less muscle soreness when wearing either style of
garment after competition. Yet research consistently reports positive effects of
compression garments on perceived muscle soreness (French, Thompson et al. 2008;
Montgomery, Pyne et al. 2008b; Davies, Thompson et al. 2009; Jakeman, Byrne et al.
2010b; Jakeman, Byrne et al. 2010a). Perceived fatigue also remained unaltered with
157

compression use, despite positive effects occurring after basketball games (Montgomery,
Pyne et al. 2008b), repeat sprint activity with Spo use in Chapter 4, and AF training in
Chapter 5 with both Med and Spo. It is possible that the long term familiarity that the
participants have with match loads contributed to the lack of muscle soreness and fatigue
40 hr after the match. Indeed, in normal research settings participants are typically only
exposed to one or two familiarisation sessions prior to the completion of the study. Yet
in the present study, these athletes were highly accustomed to the stimulus.
A combination of factors most likely precluded the observation of positive recovery
effects for these perceptual measures. For instance, it is likely that the high level of
conditioning of these participants (Nosaka and Newton 2002) facilitated the recovery of
muscle soreness and perceived fatigue to pre game levels 40 hr after the game. In fact,
this game was played during the latter stages of the competitive season, emphasising this
‘pre-conditioning’. To compound this, perceptual responses were highly variable. The
increase in muscle soreness from pre game to +40 Con for example highlighted this
(12±61 arbitrary units; mean±standard deviation), which was replicated across groups
and also for perceived fatigue. What’s more, in the competition phase of the season,
access to participants when they are completely free of muscle soreness and fatigue is
rare, particularly late in the season as was the case in the current study. Although a valid
and reliable tool (Seymour 1982; Du Toit, Pritchard et al. 2002; Boonstra, Schiphorst
Preuper et al. 2008), the VAS may be limited in its application in competition scenarios.
Despite a large increase in plasma [Mb], indicating significant muscle damage present
after the game, 99 to 324 times the SWC, like Chapter 4 and 5, neither compression
garment type influenced the post game plasma [Mb]. Likewise, Spo did not facilitate a
faster recovery of serum [Mb] after basketball game play (Montgomery, Pyne et al.
2008a) or resistance exercise (French, Thompson et al. 2008). Although the magnitude
158

of the initial increase in plasma [Mb] after the game was substantial, sampling 40 hr
after the game appears to have been too late. Indeed, plasma [Mb] decreased by a similar
magnitude across all groups 40 hr later, returning to pre game concentrations. Hence, the
detection of recovery effects at +40 was not feasible. Conversely, 24 hr following AF
training, plasma [Mb] remained elevated (Chapter 5), and it was anticipated that due to
the greater demands of games, that games would cause more pronounced and prolonged
elevations. Young et al (2012) observed elevated concentrations of plasma creatine
kinase 24 hr after elite junior AF competition also. Other team sport research, such as
soccer and American football, have suggested a post exercise plasma [Mb] peak at ~24
hr (Ascensao, Rebelo et al. 2008; Kraemer, Spiering et al. 2009), however due to the
large difference in sports it is not known if the peak post AF competition would also
occur at +24. Data was collected in an elite athlete environment; as such follow up data
collection occurred at the clubs first training session after the game, which was
scheduled 40 hr after the game. Like Chapter 5, the plasma [Mb] results suggest that Spo
participated in more damage inducing game activities, having larger post game plasma
[Mb] increases compared to Med or Con. This is reflected in higher plasma [Mb] at +40
in Spo versus Med compared to Pre levels. It is unlikely that this reflects any
physiological action on plasma [Mb] as Spo not only experienced a larger initial increase
in plasma [Mb] than Med, but at +40, plasma [Mb] was not substantially elevated above
Pre levels in either group.
The notion of an uncoupling between perceptual and performance parameters was
discussed in Chapter 4 in recreationally active individuals. Similarly, this uncoupling
was observed for the Med after both TR1 and TR2 in Chapter 5, as well as for the Con
after TR1. This dissociation was also apparent after AF competition. Indeed, 40 hours
after the game, Med and Spo participants were unable to maintain CMJ performance, yet
159

did not display substantial elevations of perceived fatigue or muscle soreness. Rugby
participants also experienced this uncoupling after a simulated rugby circuit, where they
were able to maintain performance 24 hr after the circuit despite elevated perceived
soreness (Duffield, Edge et al. 2008). Rather than acting as standalone indicators of
readiness to train/compete, perceptual measures should be incorporated into a global
assessment of the athlete, as they do not appear coupled with performance.
It was expected that consistent recovery effects would be detected following competition
due to the substantial amount of damage induced by game play. Studies which have
observed high levels of muscle damage document the most consistent recovery effects
(Kraemer, Bush et al. 2001a; Kraemer, Bush et al. 2001b; Jakeman, Byrne et al. 2010b;
Jakeman, Byrne et al. 2010a). It is likely that the conditioning status of the participants
in this study (Nosaka and Newton 2002) precluded similar observations, with the
conditioning level likely to have overcome the taxing nature of the game, at least for
perceptual and biochemical measures. However, athlete conditioning level in the current
study, and previous research (Cormack, Newton et al. 2008a), was not sufficient to
overcome the neuromuscular fatigue evident in the days after competition. Although
desirable to use in covariate analysis, a more detailed investigation of player activity
profiles, particularly running, through GPS technology was not feasible due to indoor
competition. Further, it was not possible to control sleep, medication, alcohol and food
intake which may have impacted on recovery during the 40 hr post game period. As the
participants were elite athletes, with data collected at a critical stage of the competitive
year, professionalism and attention to detail was expected, and thus it is anticipated that
such factors may have played a minimal role.
A major and unavoidable limitation of the current study was the use of cold water
immersion by all athletes immediately after the match. It is possible that the positive
160
recovery effects of the immersion protocol swamped any positive recovery effects
associated with the compression garments. In athletic settings, cold water immersion can
assist in attenuating post-exercise power and strength reductions,4,6 alleviate symptoms
of exercise-induced muscle soreness (Bailey, Erith et al. 2007; Vaile, Gill et al. 2007;
Ingram, Dawson et al. 2009; Elias, Varley et al. 2012), and reduce fatigue between
exercise bouts (Vaile, Halson et al. 2008a; Elias, Varley et al. 2012). Reductions in
localised swelling, oedema and indices of exercise-induced muscle damage have also
been attributed to cold water immersion (Bailey, Erith et al. 2007; Ascensao, Leite et al.
2011). Indeed, after elite AF competition repeat-sprinting performance remained slower 24
and 48 hr after the game for athletes receiving a passive (3.9% and 2.0%) treatment which
was restored with cold water immersion (0.2% and 0.0%) use. Soreness after 48 hr was
attenuated by cold water immersion (ES 0.59±0.10) but remained elevated for athletes who
partook in passive recovery (ES 4.01±0.97). Similarly, cold water immersion more
successfully reduced fatigue after 48 hr (ES 1.02±0.72) compared to and passive recovery
(ES 1.91±0.67). Declines in static and countermovement jump were also ameliorated by
cold water immersion (Elias, Wyckelsma et al. 2012).
6.5 Conclusions
As expected, AF competition produced increases in a marker of muscle damage,
muscular soreness and perceived fatigue in the presence of impaired physical
performance. Even after 40 hr, AF participants did not achieve full recovery, displaying
signs of neuromuscular fatigue. Compression garments did not augment recovery
following AF competition beyond that achieved by the routine recovery regime
implemented. Further, neither garment type proved superior as a recovery intervention.
Finally, this study demonstrated that an uncoupling of perceptions of fatigue and tests of
performance are apparent following AF competition.
161

CHAPTER 7. GENERAL DISCUSSION AND
CONCLUSIONS
7.1 Introduction
The effect of wearing compression garments for recovery post-exercise was investigated
in this thesis. Specifically, this was evaluated under three distinct scenarios: 1)
consecutive days of repeated sprint activity in recreationally active individuals (Chapter
4); 2) elite AF training (Chapter 5); and 3) elite AF competition (Chapter 6). In the elite
training and competition setting, a comparison between a medical and sports style
garment was also conducted. Perceptual, performance and plasma markers of muscle
damage during recovery were assessed in each investigation. The outcomes of each
chapter have been discussed in detail; therefore this section will focus on an integrated
general discussion of the major results of the thesis.
7.2 Australian football training and competition are strenuous,
imposing large recovery demands.
As a consequence of the strenuous nature of AF, the recovery demands after both
training and competition are high. Table 7.1 provides the range of the mean percentage
change in perceptual, performance and muscle damage responses to AF training and
competition.
162

Table 7.1: Perceptual, performance and muscle damage responses compared to baseline
after Australian Football training and competition.
Training Competition + 24 hr Immediately
post + 40 hr
Muscle soreness ↑187 – ↑400% ↑ 55 – 165% ↓65 – ↑84*
Fatigue ↑ 23 – 230% ↑ 178 – 187% ↓39 – ↑140%*
Flight time ↓ 1% ↓ 4 % ↓ 4 %
Flight time: Contraction time ratio
NA
↓ 15-22%
↓ 19-21%
Plasma Myoglobin
↑ 61 – 153% ↑1145 – 3759% ↑ 14 – 50%*
The responses following AF training have been combined to include both training session one (TR1) and two (TR2). Changes in parameters were classified as a true effect where there was a ≥ 75% likelihood of the effect being equal to or greater than the SWC, with an effect size ≥0.2, which represents a small effect size. *these values were not substantially different, and only represent a trend in the data. NA= FT:CT was not measured in Chapter 5.
There were mixed recovery demands after elite AF training in Chapter 5. After TR1,
participants in all groups had elevated perceived fatigue and muscle soreness, with
elevated plasma [Mb] in the Med and Spo. However, CMJ performance had recovered to
pre training levels at this stage. Hence recovery interventions after this session should be
targeted towards enhancing perceptual recovery. The recovery demands are more varied
after TR2. Neuromuscular fatigue was evident, but only in those wearing Spo. Those
same participants had elevated plasma [Mb]. Participants in the Med and Con reported
heightened perceived fatigue 24 hr after TR2. Although variable between sessions and
participants, it is clear that the recovery demands of these participants are high within
the weekly training cycle, with no group displaying complete recovery across all
163

parameters at +24. Indeed, skill based training sessions are repeated up to three times per
week, in addition to two or more resistance training sessions as well as individual skill
sessions (Cormack, Newton et al. 2008a), leaving little time for between session
recovery. These inconsistencies within and between TR1 and 2 emphasises the need for
an individualised approach to recovery programming due to the heterogeneous recovery
status 24 hr after training.
Australian football athletes also have a high recovery demand after competition.
Participants were still experiencing neuromuscular fatigue 40 hr after competition,
despite the use of compression garments for recovery and the clubs traditional post game
hydrotherapy protocol. The prevalence of a similar magnitude of neuromuscular fatigue
(CMJ FT) 40 hr after competition compared to only 24 hr after training reflects the
greater volume of activity conducted in games, and a greater need for recovery (Table
7.1).
Plasma [Mb] data suggests that elite AF participants experience greater volumes of
muscle damage compared to other codes of football. In fact, the post game increase in
plasma [Mb] was almost three times more than after soccer (Ascensao, Rebelo et al.
2008) and rugby union competition (Takarada 2003), suggesting a greater recovery
demand after AF. Elite soccer and rugby union competition is conducted over a shorter
duration (~25 and 33%) (Mohr, Krustrup et al. 2003; Takarada 2003), players cover less
distance (37 and 49%), and in the case of rugby union, partake in fewer tackles
(Takarada 2003). As muscle damage is the consequence of both intermittent running
(Thompson, Nicholas et al. 1999) and physical contact (Zuliani, Bonetti et al. 1985;
Takarada 2003), it is likely that the longer duration of games, combined with the larger
distances covered and more frequent physical contact, contributes to this higher level of
muscle damage, and thus recovery requirement after AF. Despite the large increases in
164

plasma [Mb] immediately after the game, 40 hr of recovery was suffice for this marker
to return to pre-game levels.
Despite immediate elevations in perceived muscle soreness and fatigue after elite AF
competition, 40 hr of recovery was suffice for these parameters to return to pre game
levels. In comparison, 48 hr following sub elite AF competition, muscle soreness ratings
remained substantially elevated (Dawson, Gow et al. 2005). The lower conditioning
status in the sub elite participants tested (Ingebrigtsen, Bendiksen et al. 2012) may
explain the more pronounced muscle soreness response 48 hr after competition
compared to the response in Chapter 6. Although data is not available to compare the
internal load data between the two studies, it may be suggested that internal load would
not be greatly different between the two athlete cohorts as this measure is relative to the
individual. It is also possible that differences in training stress may contribute to these
differences. In Chapter 6 there was a high level of individual variation in perceptual
responses, which may have contributed to the lack of substantial effect. There are
multiple factors that could contribute to this individual variation. High pre-game values
for both perceptual parameters were observed in some participants. Indeed, a proportion
of elite AF athletes commence competition in a fatigued state (Mooney, Cormack et al.
2012). The observed variation may also be attributed to differences in the athlete’s
interpretation of the word anchors used in the VAS, and the ability to accurately mark
the VAS, particularly as their previous ‘markings’ were not displayed.
7.3 Sports and medical compression garments elicit similar recovery
effects
For the first time, differences in recovery effects between sports and medical
compression garments were investigated (Chapters 5 and 6). The recovery effects for
165

both garment types are presented below (Table 7.2). Despite the differences in the level
of compression, neither garment proved superior in facilitating these recovery effects.
166

Table 7.2: Overview of recovery effects for sports and medical compression garments after
repeat sprint exercise, Australian football training and competition.
Garment type Sports compression Medical compression
Repeat sprint
exercise
Muscle soreness
Perceived fatigue
Muscle damage ([Mb])
Running performance
NA
Australian
football
training
Training session 1
Muscle soreness
Perceived fatigue
Muscle damage ([Mb])
Performance (CMJ flight
time)
Training session 1
Muscle soreness
Perceived fatigue
Muscle damage ([Mb])
Performance (CMJ flight
time)
Training session 2
Muscle soreness
Perceived fatigue
Muscle damage ([Mb])
Performance (CMJ flight
time)
Training session 2
Muscle soreness
Perceived fatigue
Muscle damage ([Mb])
Performance (CMJ flight time)
Australian
football
competition
No recovery effects were detected#
Recovery effects were classified as a true effect where there was a ≥ 75% likelihood of the effect being equal to or greater than the SWC, with an effect size ≥0.2, which represents a small effect size. A tick () represents a positive recovery effect, a cross () indicates no recovery effect. # Following Australian Football competition recovery effects were not detected due to the late sampling point 40 hr after the game which likely precluded a comprehensive analysis. NA= Medical compression garments were not investigated in the repeat sprint study (Chapter 4).
167

The larger increases in plasma [Mb] with Spo versus Med observed during recovery in
Chapter 5 and 6 are unlikely to represent a true treatment effect. Participants who wore
Spo had a substantially larger increase in plasma [Mb] 24 hr after TR2 in Chapter 5
compared to those wearing Med. As discussed throughout this thesis, it is speculated
that the higher level of compression afforded to Med style garments may facilitate a
greater removal of plasma [Mb] from the circulation due to increases in limb blood flow
(Mayberry, Moneta et al. 1991). As limb blood flow was not assessed in this thesis, this
theory remains purely speculative. Rather than physiological mechanisms, it is possible
that differences in the amount of damaging activity conducted during the training
session influenced these results. Internal player load was calculated for each session,
with no differences identified between garment groups. However it is not yet apparent
how sensitive, if at all, this measure is to muscle damage.
Similarly, 40 hr after competition in Chapter 6, Spo had a substantially larger elevation
in plasma [Mb] from pre game levels than Med. This time, those participants wearing
Spo displayed an initially larger post game increase in plasma [Mb] than Med,
explaining this result at +40. Thus it seems unlikely that differences between the
garment groups regarding plasma [Mb] are linked to physiological mechanisms, and
rather are best explained by the level of damaging activity undertaken.
In Chapter 5 and 6, not all parameters were altered immediately after competition and at
+24 in Chapter 5, and +40 in Chapter 6. Thus it is unknown if differences in recovery
effects between Spo and Med would have been identified if all parameters tested were
altered substantially as a result of training and competition.
168

7.4 Compression garments do not consistently enhance the recovery of
performance.
Similar to previous research, this thesis highlights a lack of positive recovery effects on
performance when using compression garments for recovery. The ability to maintain
performance when conducting exercise, training sessions and competing on consecutive
days, such as tournament scenarios, is crucial, particularly as the training/competition
schedule of elite athletes is extremely hectic. Unfortunately the protocol used in Chapter
4 to investigate this was not sufficiently fatiguing, and thus the detection of recovery
effects on the maintenance of performance was not possible.
Table 7.2 highlights the mixed recovery effects for CMJ performance after two
independent AF training sessions in Chapter 5. It also highlights the lack of positive
recovery effects of compression on CMJ recovery after elite AF competition in Chapter
6. The inconsistencies in Chapter 5 may be linked to the inability to quantify, and thus
account for, the amount of immediate post training neuromuscular fatigue. It is more
likely however, that the compression garments simply did not enhance the recovery of
performance.
Inconsistencies in the effect of Spo on jump test performance are reported in the
literature, with the majority of studies failing to detect positive treatment effects. Indeed,
Spo use either enhanced (Rusko 1996; Jakeman, Byrne et al. 2010b; Jakeman, Byrne et
al. 2010a), reduced (Rusko 1996), or had no effect (Davies, Thompson et al. 2009) on
CMJ performance recovery. This thesis did not detect negative effects of compression
garments on the recovery of CMJ performance or the maintenance of treadmill running,
and thus does not discourage their use. As discussed below in Section 7.6, it may be that
these inconsistencies may partially be driven by the athlete’s belief in the garments.
169

7.5 Mixed recovery outcomes occur for perceptual parameters with
compression garment use.
7.5.1 Positive recovery effects for perceived fatigue and muscle soreness are
inconsistent.
To minimise perceived muscle soreness, compression garments are a useful addition to
the recovery program, but only for recreational exercisers after consecutive days of
repeat sprint activity, and not elite AF athletes following training or competition (Table
7.2). Conversely, the literature consistently points to positive recovery effects of
compression garments on perceived muscle soreness (Kraemer, Bush et al. 2001a;
Duffield, Edge et al. 2008; French, Thompson et al. 2008; Montgomery, Pyne et al.
2008b; Jakeman, Byrne et al. 2010b; Jakeman, Byrne et al. 2010a). Although not
investigated in this thesis, it is theorised that perceived muscle soreness is lessened
through alterations to swelling and oedema (Jonker, de Boer et al. 2001; Kraemer, Bush
et al. 2001a; Kraemer, Bush et al. 2001b). It is also highly plausible that a placebo effect
(Section 7.5.2) contributes to the blunting of muscle soreness. These positive recovery
effects for compression garments on perceived muscle soreness were not found after AF
competition. Forty hours after the game muscle soreness scores had returned to pre game
values.
Like perceived muscle soreness, perceived fatigue was blunted with compression
garment use between consecutive days of repeat sprint exercise, and this time elite AF
training, but only after one of the two training sessions (Table 7.2). The full recovery of
perceived fatigue 40 hr after competition in Chapter 6 precluded similar observations.
Following three days of basketball game play, Spo use between games facilitated 50%
less perceived fatigue compared to control participants (Montgomery, Pyne et al.
170

2008b). It is not entirely clear how perceived fatigue is lessened with compression use.
Section 7.5.2 discusses the possibility of a placebo effect driving this perceptual
recovery.
The inconsistencies in recovery effects are discussed below (Section 7.6).
7.5.2 A placebo effect may influence perceptual recovery with sports compression
garment use.
The placebo effect may be contributing to unexpected perceptual responses when
wearing Spo for recovery. The individual’s belief in, and expectations of Spo may have
influenced the response to the VAS. For example, those allocated to Spo in Chapter 4
had perceived muscle soreness that was actually lower than pre study levels 24 hr after
the first, second and third repeat sprint session. Similarly, perceived fatigue was lower
than pre study levels 24 hr after the second and third RSE compared to pre study levels.
These participants did not have substantial pre study soreness or fatigue, indeed, their
pre study scores did not differ from Con. This observation was not limited to
recreational exercisers. After AF competition in Chapter 6, elite AF participants wearing
Spo had less perceived soreness and fatigue 40 hr after the game compared to pre game
values, despite experiencing neuromuscular fatigue. Yet a similar observation was not
apparent in elite AF participants after partaking in training sessions in Chapter 5.
The contribution of the placebo effect in compression garment research has focused
primarily on the enhancement of the recovery of tests of performance, or the
maintenance of performance (Chatard, Atlaoui et al. 2004; Higgins, Naughton et al.
2009; De Glanville and Hamlin 2012), with little attention paid to perceptual recovery.
In one study, 50% of participants reported that the garments could have modified their
second performance either a bit, or a lot (Chatard, Atlaoui et al. 2004). However, when
171

compression garments were worn during a 40 min treadmill run (80% V.O2max) by
competitive runners, there were no differences between a placebo (12–15 mmHg at
ankle) and standard sports style lower body compression garment (23–32 mmHg at
ankle) for muscle soreness (Ali, Creasy et al. 2010). It is likely that the two levels of
compression were too similar to allow for the detection of possible placebo effects. With
this in mind, it is not possible to rule out potential placebo effects on perceptual
parameters, as it is unlikely that these garments exert such strong recovery effects to
allow participants to feel even better than before they commenced the repeat sprint
exercise or AF competition.
These placebo effects on perceptual measures may in fact be practically important, and
should not be dismissed. A positive mood state is linked to both basketball and
volleyball performance (Newby and Simpson 1994; Newby and Simpson 1996).
Basketball players exhibiting a positive mood score played more minutes during the
season and had more assists than those whose scores reflected a negative mood state
(Newby and Simpson 1994). Volleyball players also displayed positive associations
between scores of vigor and games played (r=0.6), games played (r=0.6), and
percentage of kills to attack attempts (r=0.5) (Newby and Simpson 1996). Placebo
effects on perceptual parameters should however be treated with caution, as they may
not necessarily always link to improved actual performance. Indeed, it is also possible
for perceptual and performance measures to be uncoupled. See Section 7.5.3 for a
discussion on this uncoupling. It is important to note that the above mentioned mood
states were established using a profile of mood states questionnaire (Newby and
Simpson 1994; Newby and Simpson 1996), which may be more tightly coupled with
actual performance than perceived muscle soreness and fatigue obtained through a VAS.
172

7.5.3 Perceptual responses may be uncoupled from performance in recreational
exercisers and elite athletes.
Perceptual ratings of fatigue and muscle soreness are used in conjunction with an array
of measures in predicting an athlete’s readiness to train/compete. Yet it appears that
these perceptions may not actually be accurate indicators of when to resume training in
both recreationally active participants (Chapter 4), and elite participants (Chapter 5 and
6) if used as a standalone measure. Rugby players also experienced this uncoupling after
a simulated rugby circuit (Duffield, Edge et al. 2008). Indeed, athletes are often able to
complete an exercise test of performance to their ‘non-fatigued’ level, however when
required to repeat such a test hours later, performance is often depressed, despite athletes
being accustomed to multiple training bouts per day (Meeusen, Piacentini et al. 2004).
This drop in performance can range between 3 and 11%, depending on whether the
athlete is in a trained, over-reached or over-trained state (Meeusen, Piacentini et al.
2004). Ultimately, although an athlete may enter training or competition in a state of
perceived fatigue or muscle soreness, they are likely to be able to perform at an optimal
level. However, the longer term accumulation of muscle soreness and perceived fatigue
should be avoided due to implications in the development of the overtraining syndrome
(Lehmann, Foster et al. 1993; Kentta and Hassmen 1998).
7.6 Recovery effects are inconsistent across exercise modalities
Table 7.2 highlights the inconsistencies in positive recovery effects with compression
garment use after the three exercise modalities investigated in this thesis. This was even
more pronounced in Chapter 5 where two independent AF training sessions were
conducted. In that study, recovery effects were not reproduced across both training
sessions, despite each session lasting the same duration and including the same
activities.
173

A central limitation of this thesis which influenced the detection recovery effects was the
inability of the exercise protocol to elicit consistent perturbations in the parameters
investigated across all groups. This was exacerbated in Chapters 5 and 6 where it was
not feasible to control the amount of work conducted by participants. It would be remiss
to ignore the implications that this had on the ability to detect differences between
groups when assessing recovery.
When considering the inconsistencies in recovery effects, coupled with the placebo
effects (Section 7.5.2), it is possible that individuals may be categorised as responders or
non responders to compression garments as a recovery modality. This implies that the
efficacy of the garments may be tied in part to the individuals belief in the garments to
enhance their recovery. If the treatment groups (Med and Spo) consisted of a
combination of responders and non responders, recovery effects may have been missed
due to heterogeneous groups. Practitioners should take this into consideration when
implementing these garments into the recovery program, as the garments may be more
effective for certain participants.
7.7 Final conclusions and practical recommendations
• There is a high recovery demand after AF training and competition.
o During pre-season training, neuromuscular fatigue, perceived fatigue and
muscle soreness, and elevated concentration of markers of muscle damage
are still present after 24 hr of recovery. Practitioners should consider this
when planning multiple ‘hard’ sessions in each microcycle, as well as the
inclusion of additional recovery techniques.
o Forty hours after competition neuromuscular fatigue was still evident in
participants. Practitioners should observe caution when resuming training
174

within this time frame as residual performance decrements may hinder future
performance.
• When recovering from bouts of high intensity exercise conducted across consecutive
days, sports compression are useful at minimising perceived muscle soreness and
fatigue in recreational exercisers. This enhanced perceptual recovery may be driven
by placebo effects and requires investigation.
• Sports compression garments may offer positive recovery effects on CMJ
performance and perceived fatigue when recovering from team sport training. The
level of efficacy might however be dictated by placebo effects and thus be more
effective in those who believe in the recovery properties of these garments.
• Medical compression garments do not offer any additional benefits to recovery
compared to sports compression.
• Positive recovery effects are not consistently reported within and between exercise
modalities.
o Although speculative, the individual’s level of belief in compression
garments for recovery may dictate positive, or a lack of, recovery effects.
Practitioners may need to be aware of the individual’s preconceptions
regarding this recovery modality to determine its likely effectiveness.
• Due to an uncoupling with performance parameters, perceptual measures of muscle
soreness and fatigue obtained by visual analogue scales should not be used as
standalone indicators of readiness to train/compete, and instead should be included
in a battery of tests, where the athlete is assessed in a holistic manner.
175

CHAPTER 8. LIMITATIONS AND
RECOMMENDATIONS FOR FUTURE RESEARCH
The general limitations within this thesis are presented below. These limitations are
accompanied by recommendations for future research in this area.
• Despite the previously established fatiguing nature of the exercise protocol used in
Chapter 4 (Serpiello, McKenna et al. 2011), the recreationally active participants in
this thesis were able to maintain their repeat sprint performance, regardless of the
use of a recovery intervention. Thus, it was not possible to investigate the influence
of compression garments on the maintenance of performance across multiple days.
Previous use of this protocol in a similar participant population demonstrated that
mean power decreased by 4.8% in set 3 versus set 1 (ES = -0.21 ± 0.07), peak power
was reduced by 9.2% (ES = -0.28 ± 0.11), and mean velocity declined by 2.2% (ES
= -0.18 ± 0.33) (Serpiello, McKenna et al. 2011). Even after ten sessions of repeated
sprint training decrements in performance were observed. For example, mean power
in set 3 was 4.1% lower than set 1 (ES = -0.19 ± 0.06), and mean velocity was
reduced by 2.1% (ES = -0.17 ± 0.06). Future investigations should adopt a more
demanding protocol to ensure that there is a substantial reduction in performance. It
may be that the inclusion of additional sets of sprints, and/or longer sprint duration
will achieve this. Ultimately, intensive pilot testing across multiple days is required
to ensure the fatigue inducing nature of the protocol and its application to team sport
scenarios.
• Sub-elite team sport athletes, or recreational team sport participants should have
been identified as the cohort to be recruited for this study to enhance the transference
of results to elite team sport athletes. This was a limitation of this study when
176

determining the practical applications of the findings. Future research should ensure
the appropriateness of the cohort selected to improve the validity of the results.
• The repeat sprint protocol in Chapter 4 failed to produce immediate muscle damage
as indicated through plasma [Mb]. Plasma [Mb] was only substantially elevated 24
hr after three RSE sessions in Spo only. This made it difficult to draw meaningful
conclusions regarding the usefulness of compression garments to influence post
exercise plasma [Mb]. It was expected that the deceleration phase of the 15 sprints in
each RSE would elicit substantial muscle damage (Williams 1985). Alternatively, a
protocol such as the Loughborough Intermittent Shuttle Test may be more
appropriate. This test is designed to replicate soccer specific running activity
(Nicholas, Nuttall et al. 2000) and elicits muscle damage even 48 hr after its
completion in recreational exercisers (Thompson, Nicholas et al. 1999). The
reproducibility of this running test has also been established, with no differences in
performance and physiological parameters when participants unfamiliar with the
protocol were tested 7 days apart (Nicholas, Nuttall et al. 2000). In addition, the
activity pattern and the physiological and metabolic responses closely simulate the
game demands of soccer (Nicholas, Nuttall et al. 2000), an intermittent running
based team sport. The disadvantage of the Loughborough Intermittent Shuttle Test is
its longer duration of approximately ~90 min, placing a far greater time requirement
on participants.
• Although the magnitude of treatment effects for perceptual measures were greater
than the SWC for muscle soreness and fatigue, a noticeable level of individual
variation in perceptual responses in this thesis was apparent. It is likely that
individual differences in the interpretation of the word anchors at either end of the
VAS, for example ‘no fatigue’ and ‘very severe fatigue’ varied between participants
177

(Wewers and Lowe 1990). Although shown to be a sensitive measure to assess
changes in pain scores (Seymour 1982; Du Toit, Pritchard et al. 2002), this limitation
was likely compounded by the ability to accurately mark the VAS in the same
position. To minimise this variation, participants should be thoroughly familiarised
with the VAS. The familiarisation should include a detailed description of muscle
soreness and general fatigue at both ends of the VAS to allow participants to more
accurately interpret and mark the VAS. Moreover, it may be beneficial to collect
multiple baseline scores to ensure a more accurate reflection of a relatively fatigue
and soreness free state. The latter may be troublesome within an elite athlete
environment, where athletes often experience fatigue and soreness to some extent
due to the hectic training and competition cycle.
• Data in Chapter 5 was collected during a critical phase of the AF pre-season, with
the actual testing days forming an important component of this phase. With this in
mind, combined with limited access to participants, it was not possible to conduct a
cross-over study.
Limited player access also prevented the quantification of neuromuscular fatigue
through a CMJ, perceived muscle soreness and fatigue, and plasma [Mb] levels
immediately after training. This may have hindered the ability to detect recovery
effects, as it remains unknown if all participants experienced the same recovery
requirement. What’s more, only collecting a recovery sample at +24 may have
missed recovery effects associated with compression garments that occurred at an
earlier time point.
It was also not feasible to control the amount of work conducted during each
session. Future research should quantify the amount of work conducted during each
178

component of the training session. For example, it would have been desirable to
conduct GPS analysis on the small sided game, running and skills component of
training to identify possible between group differences; however access to the GPS
units was not available at the time.
The use of sub elite participants in future studies may help overcome some of the
issues associated with access to participants, control of training activities and the
inclusion of a cross over design.
• The time point at which recovery was assessed following AF competition (Chapter
6) may have been inappropriate to detect recovery effects. Multiple variables
(perceptual and biochemical) had returned to pre competition levels, making
treatment effects difficult to detect. However, the time at which data was collected
represented the actual time that the club conducted their first session after the game
and is reflective of the clubs regular schedule. Future research should consider
multiple sampling points throughout the recovery period to establish a time course of
recovery for each parameter. Particularly, data should be acquired 24 hr after
competition, as substantial perturbations in performance, perceptual and biochemical
parameters were present following AF training at this time point. With the longer
duration of games it is anticipated that at +24 after a game that considerable
treatment effects may be detected.
• Although desirable, it was not viable to acquire data from multiple games in Chapter
6. This was attributed to data collection occurring during the competition season.
Initially, two games were selected for investigation, which were reduced to a single
game due to club imposed restrictions. This also precluded the use of a cross over
design. As mentioned above, the use of sub elite participants may help overcome the
issue of access to participants, which may allow for a cross over design across 179
multiple games. Combined with sampling at +24 rather than +40 (see above point),
this larger sample size should allow for a greater opportunity to detect recovery
effects. When selecting multiple games, consideration of the oppositions skill level
must be considered to ensure all games are played against opponents of equal
standing to prevent any bias in the data.
• An intrinsic limitation of compression garment research is the inability to blind
participants, and to include a placebo. The use of elite participants (Chapter 5 and
Chapter 6 compounded this, due to regular use of compression garments, and the
accompanying familiarity with the sensation of wearing such garments. As such, it
was not really a viable option to include elasticised (with very low levels of
compression) pants as a placebo group. Similarly, many of the recreationally active
participants involved in the repeat sprint study (Chapter 4) were accustomed to
wearing compression garments. To overcome this limitation, it may be useful to
record the participants’ level of belief in the intervention, possibly through a VAS,
prior to the study, which may later be used as a covariate during the analysis phase.
This may be broken down into specific parameters such as muscle soreness, fatigue,
performance, general recovery etc as the level of belief may vary across different
parameters. It may also be useful when completing the investigation into the
individuals level of belief to map brain activity. The use of functional MRI while
completing ‘belief’ VAS/questionnaires would allow the measurement of the activity
in the medial orbitofrontal cortex (Plassmann, O'Doherty et al. 2008), a region know
to encode for experienced pleasantness (McClure, Li et al. 2004; Rolls, Grabenhorst
et al. 2008). This information would help neurologically quantify the participants’
expectations regarding the positive recovery effects of the compression garments.
180

• Compression garments are anticipated to exert positive actions on post exercise
recovery namely through alterations to the vascular and lymphatic systems
(Swedborg 1984; Mayberry, Moneta et al. 1991; Yasuhara, Shigematsu et al. 1996;
Johansson, Lie et al. 1998; Jonker, de Boer et al. 2001; Beidler, Douillet et al. 2009).
Although perceptual and performance recovery was enhanced at times with
compression use in this thesis, the physiological mechanisms alluding to this
improved recovery were not investigated. The focus of this thesis did not extend to
such investigation, particularly in Chapters 5 and 6, as testing was conducted with
elite participants in training and competition scenarios were access to participants
was highly restricted. There are multiple non-invasive methods to measure limb
blood flow including Doppler ultrasound (Chleboun, Howell et al. 1995; Hsieh and
Lee 2005), tissue oxygenation measured using near infrared Spectroscopy (Bringard,
Denis et al. 2006; Dascombe, Hoare et al. 2011; Coza, Dunn et al. 2012) and venous
occlusion plethysmography (Bochmann, Seibel et al. 2005) that could be
incorporated into future investigations.
Compression garment mediated reductions in swelling and odema, through a
mechanical blocking of odema, and improvements in vessel wall hydrostatic
pressure, are suggested to minimise perceptions of muscle soreness (Kraemer, Volek
et al. 2000; Jonker, de Boer et al. 2001). A non-invasive method to indirectly
quantify swelling is the measurement of limb circumferences, which has been used
in previous studies (Chleboun, Howell et al. 1995; Eston and Peters 1999). It is
important that such investigations take into consideration exercise mediated changes
in blood flow and limb circumference that may not be directly related to muscle
damage or the use of compression garments.
181

It has been hypothesised that muscle soreness, secondary to damage inducing
exercise, may reduce neural drive to the muscles, contributing to perceived fatigue
(Racinais, Bringard et al. 2008). Indeed Duffield et al reported depressed evoked
twitch properties 2 hr after damaging exercise which were associated with elevated
markers of muscle damage 24hr later (Duffield, Cannon et al. 2010).
182
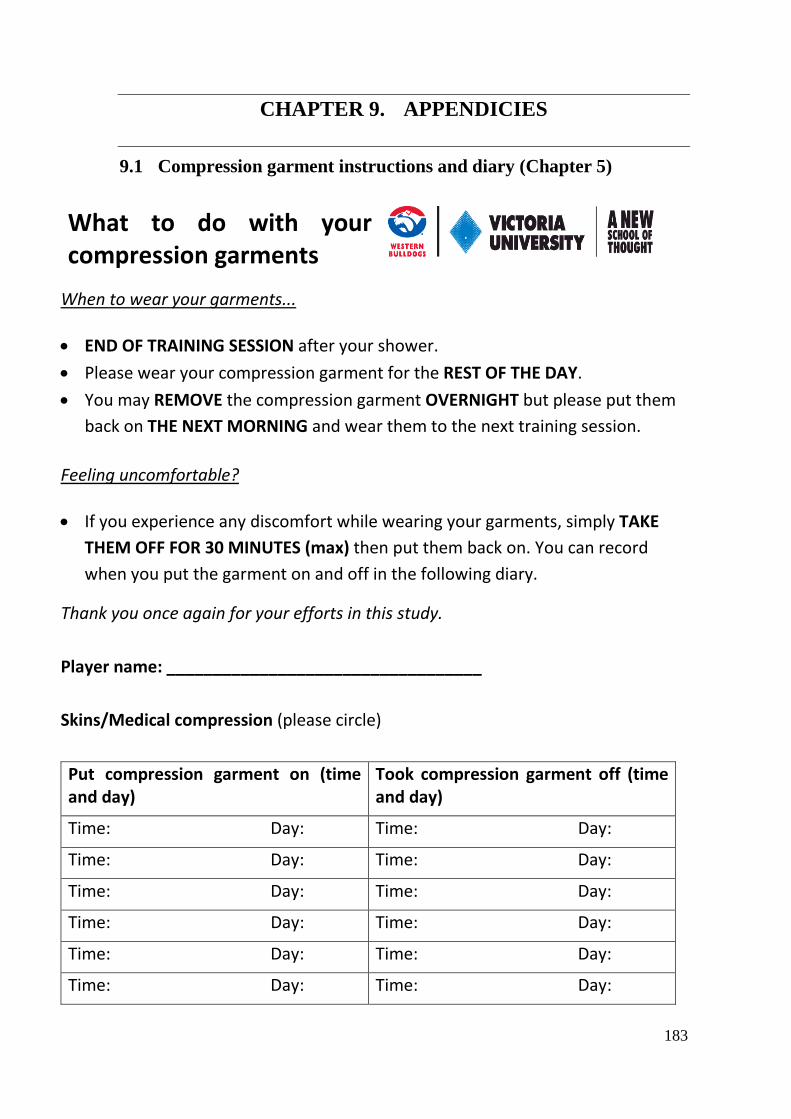
CHAPTER 9. APPENDICIES
9.1 Compression garment instructions and diary (Chapter 5)
What to do with your compression garments
When to wear your garments...
• END OF TRAINING SESSION after your shower. • Please wear your compression garment for the REST OF THE DAY. • You may REMOVE the compression garment OVERNIGHT but please put them
back on THE NEXT MORNING and wear them to the next training session.
Feeling uncomfortable?
• If you experience any discomfort while wearing your garments, simply TAKE THEM OFF FOR 30 MINUTES (max) then put them back on. You can record when you put the garment on and off in the following diary.
Thank you once again for your efforts in this study.
Player name: __________________________________
Skins/Medical compression (please circle)
Put compression garment on (time and day)
Took compression garment off (time and day)
Time: Day: Time: Day:
Time: Day: Time: Day:
Time: Day: Time: Day:
Time: Day: Time: Day:
Time: Day: Time: Day:
Time: Day: Time: Day:
183

9.2 Participant recruitment flyer
9.2.1 Chapter 4
VOLUNTEERS WANTED
ARE YOU:
ENTHUSIASTIC, HEALTHY, AGED BETWEEN 18 AND 35?
IF SO, YOU ARE INVITED TO PARTICIPATE IN A UNIQUE STUDY INVESTIGATING
The effects of Antioxidant Supplementation and Compression
Garment recovery on Repeated sprint training
THE FOLLOWING procedures WILL BE performed:
* Yo-Yo intermittent recovery test * repeated-sprint running * 4 weeks training
BLOOD SAMPLES WILL BE TAKEN DURING NINE of the TRIALS.
As a part of this study, participants will be requested to ingest either a placebo or supplement, or wear compression garments.
FOR FURTHER INFORMATION CONTACT: Dr. Rob Aughey Ph. 9919 5551 email: [email protected] Emma Gallaher email: [email protected] Emma Goff email: [email protected]
184

9.3 Information to participants
9.3.1 Chapter 4
INFORMATION
TO PARTICIPANTS
INVOLVED IN RESEARCH You are invited to participate
You are invited to participate in a research project entitled “The influence of pre-exercise anti-oxidant supplementation, and compression garment usage during recovery, on repeat sprint training.” This project is being conducted by student researchers, Miss Emma Goff, as part of an Honours study at Victoria University and Miss Emma Gallaher, as part of a PhD study at Victoria University under the supervision of Dr. Robert Aughey from the faculty of Arts, Education and Human Development.
Project explanation
This project aims to investigate the effects of using an antioxidant supplement to enhance performance during repeated sprint training. The antioxidant being used, N-acetylcysteine, has been shown to have the ability to minimize oxidative stress on cells. Oxidative stress is a commonly associated side effect of intense exercise and it is possible that a decrease in the onset and amount of oxidative stress in the body could increase health and performance. The second part of the project investigates the effects of using compression garments to aid recovery from repeated sprint training. Compression garments are tight fitting pants made from an elastic material designed to exert pressure against your body. Compression pants have been suggested to improve recovery between exercise sessions. Through an enhanced recovery it is proposed that you would be able to train/compete at a greater intensity at the next session. What will I be asked to do?
We will ask you to fill in several short questionnaires about your family medical history and your exercise habits. You will be asked to do two testing sessions before training, a 4-week period of training and one additional testing session after training. A venous blood sample will be also taken during 9 times throughout the study. When participating is this study you will be asked to act as a control subject by completing only the repeated sprint training, or to use one of two performance enhancing aids, being an N-acetylcysteine supplement or a compression garment for recovery. 1) Ingestion of N-acetylcysteine (NAC) – This will be completed prior to the sprint training sessions and will involve you drinking a solution in small amounts over a 60 min period as you would any normal drink. N-acetylcysteine (NAC) is an anti-oxidant compound that neutralises reactive oxygen compounds. It is used for a number of clinical situations, including treatment of paracetamol overdose. Should you decide to participate in this study, NAC will be dissolved in a sports drink and given to you to ingest in three small
185

doses of 250 ml over the course of an hour. 2) Wearing compression garments for recovery – This will consist of you wearing a medical grade compression garment for 15 hours following each sprint training session. You may remove the garments whenever any discomfort arises and then put them back on within 30 min of their removal. You are also requested to remove the compression garments whilst sleeping. The garments are a full lower body garment. When taking part in the study you will be asked to dress in appropriate clothing to perform physical activity. If you bring a change of clothes, a changing area is available very close to the Laboratory. What will I gain from participating?
No payment or reimbursement will be provided for participation in this project. From participating in this study you can expect to gain strong benefits to your aerobic fitness and increase your understanding of fitness and fitness tests. You will also gain the experience of having participated in an exercise science experiment designed to increase knowledge about antioxidant supplementation in repeated sprint training and the effects of using compression garments as a recovery tool. If you are a participant in the group wearing compression garments, upon completion any compression pants that have been provided to you for the project will remain yours to keep.
How will the information I give be used?
The information you provide to the researcher (through personal details and the results of your participation in the project) will be kept strictly confidential. Only group data will be reported and presented. This data may be presented through written publication, posters and conference presentations. Your personal information will not be passed onto any people or organisations other than the principle investigators. What are the potential risks of participating in this project?
Blood sampling –Risks of blood sampling include unintentional (i) use of out-of-date sterile saline solution (saline is used during the blood sampling procedure), (ii) injection of an unintended compound / solution, (iii) transmission of infection to the participant due to lack of use of aseptic (free of microbiological organisms) techniques, (iv) discomfort, bruising and infection (for example puss, tenderness and/or redness). More serious complications such as bleeding, arterial spasm, distal arterial thromboembolism, thrombosis, and infection are theoretically possible, but rare.
(Arterial spasm: temporary, sudden contraction in one location in the muscles in the wall of an artery; distal arterial thromboembolism: formation of a clot (thrombus) in a blood vessel that breaks loose and is carried by the blood stream to plug another vessel. This form of thromboembolism occurs in the distal section of the artery; thrombosis: a clot within a blood vessel which obstructs blood flow through the circulatory system) High intensity exercise- The performance of high intensity exercise involves a risk of sudden death due to myocardial infarct (heart attack) or a vasovagal episode (slow pulse, a fall in blood pressure, and sometimes convulsions). Signs and symptoms may include: sudden drop in heart rate during recovery (common) or exercise (rare); drop in blood pressure; pale complexion; fixed facial expression; pupils constricted; participant becomes uncommunicative or slurs words; restless and irritable; sweating; fatigue (if exercising). While vasovagal episodes are not uncommon, they are reversed quickly when employing a vasovagal management plan, and long-term risks are minimal. Exercise that includes running carries the risk of muscle soreness and stiffness.
186
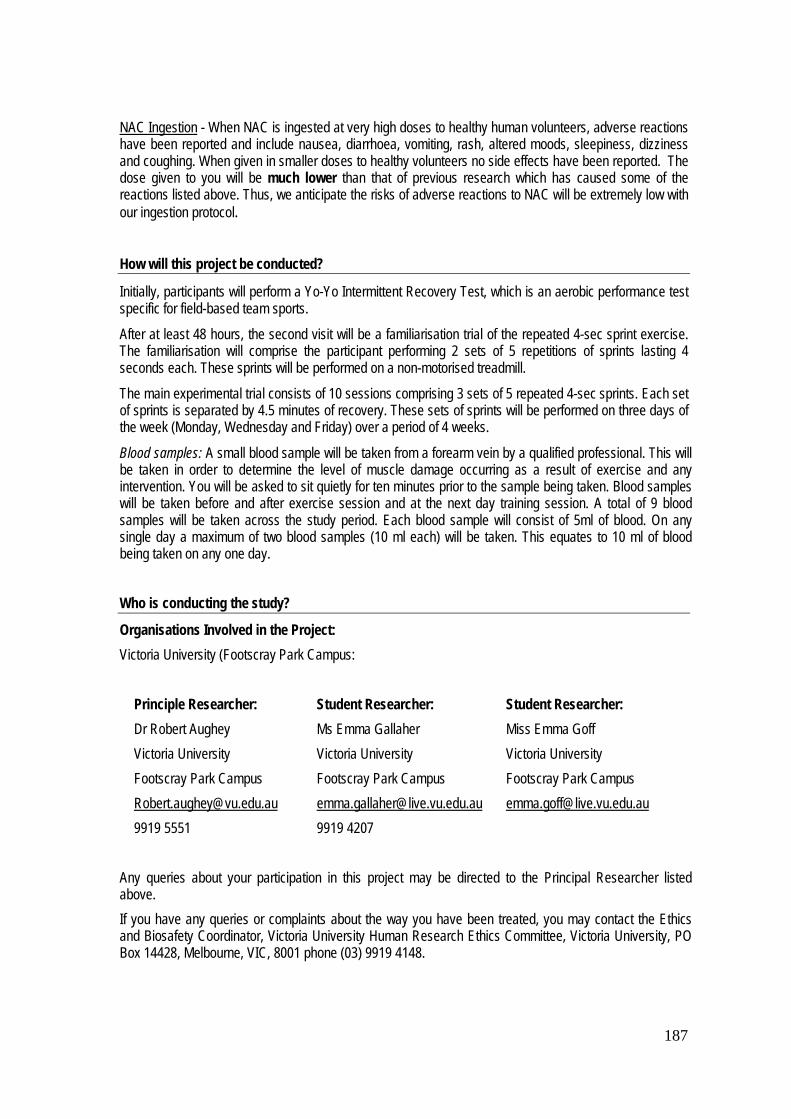
NAC Ingestion - When NAC is ingested at very high doses to healthy human volunteers, adverse reactions have been reported and include nausea, diarrhoea, vomiting, rash, altered moods, sleepiness, dizziness and coughing. When given in smaller doses to healthy volunteers no side effects have been reported. The dose given to you will be much lower than that of previous research which has caused some of the reactions listed above. Thus, we anticipate the risks of adverse reactions to NAC will be extremely low with our ingestion protocol. How will this project be conducted?
Initially, participants will perform a Yo-Yo Intermittent Recovery Test, which is an aerobic performance test specific for field-based team sports.
After at least 48 hours, the second visit will be a familiarisation trial of the repeated 4-sec sprint exercise. The familiarisation will comprise the participant performing 2 sets of 5 repetitions of sprints lasting 4 seconds each. These sprints will be performed on a non-motorised treadmill.
The main experimental trial consists of 10 sessions comprising 3 sets of 5 repeated 4-sec sprints. Each set of sprints is separated by 4.5 minutes of recovery. These sets of sprints will be performed on three days of the week (Monday, Wednesday and Friday) over a period of 4 weeks.
Blood samples: A small blood sample will be taken from a forearm vein by a qualified professional. This will be taken in order to determine the level of muscle damage occurring as a result of exercise and any intervention. You will be asked to sit quietly for ten minutes prior to the sample being taken. Blood samples will be taken before and after exercise session and at the next day training session. A total of 9 blood samples will be taken across the study period. Each blood sample will consist of 5ml of blood. On any single day a maximum of two blood samples (10 ml each) will be taken. This equates to 10 ml of blood being taken on any one day. Who is conducting the study?
Organisations Involved in the Project: Victoria University (Footscray Park Campus:
Principle Researcher: Dr Robert Aughey Victoria University Footscray Park Campus [email protected] 9919 5551
Student Researcher: Ms Emma Gallaher Victoria University Footscray Park Campus [email protected] 9919 4207
Student Researcher: Miss Emma Goff Victoria University Footscray Park Campus [email protected]
Any queries about your participation in this project may be directed to the Principal Researcher listed above. If you have any queries or complaints about the way you have been treated, you may contact the Ethics and Biosafety Coordinator, Victoria University Human Research Ethics Committee, Victoria University, PO Box 14428, Melbourne, VIC, 8001 phone (03) 9919 4148.
187

9.3.2 Chapter 5 & Chapter 6
INFORMATION TO PARTICIPANTS
INVOLVED IN RESEARCH You are invited to participate
You are invited to participate in a research project entitled “Compression Garments and Recovery in Elite Australian Rules Football Players: From the laboratory to the field”.
This project is being conducted by a student researcher, Ms Emma Gallaher, as part of a PhD study at Victoria University under the supervision of Dr Robert Aughey from the faculty of Arts, Education and Human Development and Dr Rod Snow from the faculty of Health, Medicine, Nursing and Behavioural Sciences (Deakin University).
Project explanation
This project has been designed to investigate the effectiveness of compression pants as a recovery tool in elite male Australian Football (AF) players in typical AF scenarios. Compression pants are tight fitting pants made from an elastic material designed to exert pressure against your body. Compression pants have been suggested to improve recovery between exercise sessions. Through an enhanced recovery it is proposed that you would be able to train/compete at a greater intensity at the next session. In this project, the effectiveness of compression pants as a recovery tool will be investigated following three different scenarios: 1) following an AF drill (small sided game); 2) during a normal AF training week; and 3) during air-flight travel following an interstate match. The value of the compression pants to enhance recovery will be assessed through simple performance measures as well as physical and psychometric markers (see below).
What will I be asked to do?
As a participant in this research project you will be required to participate in four key phases.
1) Baseline testing of your performance: it is important to measure your baseline performance to see if any changes occur as a result of wearing compression pants. Baseline testing will involve completing two simple performance tests: 1) a countermovement jump test and 2) a repeat sprint ability test, both of which are explained later in this document. Baseline testing of both of these measures will be performed on the same day. Two separate baseline testing sessions will be completed. Each baseline testing session will take approximately 15 minutes. This will be conducted during your normal training schedule.
2) Small sided games: This is the first testing phase of the project. You will be required to participate in two separate AF drills which are referred to as small sided games (to simulate an AF match). Each small sided game consists of four x five minute quarters. One game will be designed to represent a non-contact scenario of AF, while the other will be designed to represent a contact scenario of AF. Following each game, you will be asked to either wear a pair of compression pants or normal (non-compressive) shorts/pants until the next
188

training session. The total time required per visit (including pre and post game measures) is estimated to be approximately 1 hour. Each small sided game will be separated by one week. Each of the small sided games (including taking measurements) will be completed within your normal training schedule.
3) Normal training week: For this phase of the project you will be requested to participate in a normal seven day week of training. During the time between each training session you will be requested to either wear a pair of compression pants or your normal post training attire (i.e. non-compressive shorts or pants). Various measurements will be taken before and after each training session. As this will be conducted during your normal training regime, no additional time commitments will be required.
4) Air travel: This phase of the project will be completed following an interstate match. Following the match, during air-flight travel and until the next training session you will be requested to wear either non-compressive pants/shorts or compression pants. Various measurements will be taken prior to the match, following the match and at the next training session. As this phase of the project will be conducted within normal post match interstate travel, and at the next day training session, no additional time commitments will be required of you.
All tasks within this project will be completed within the normal training and competition completed as part of being a player at the Western Bulldogs Football Club and/or the Williamstown Football Club and thus should not disrupt your day to day schedule in any considerable manner.
What will I gain from participating?
No payment or reimbursement will be provided for participation in this project. Upon completion, any compression pants that have been provided to you for the project will remain yours to keep.
How will the information I give be used?
The information you provide to the researcher (through personal details and the results of your participation in the project) will be kept strictly confidential. Only group data will be reported and presented. This data may be presented through written publication, posters and conference presentations.
Your personal information will not be passed onto any people or organisations other than the principle investigators.
What are the potential risks of participating in this project?
Repeat sprint ability test and high intensity exercise during AF small-sided games and AF training
189
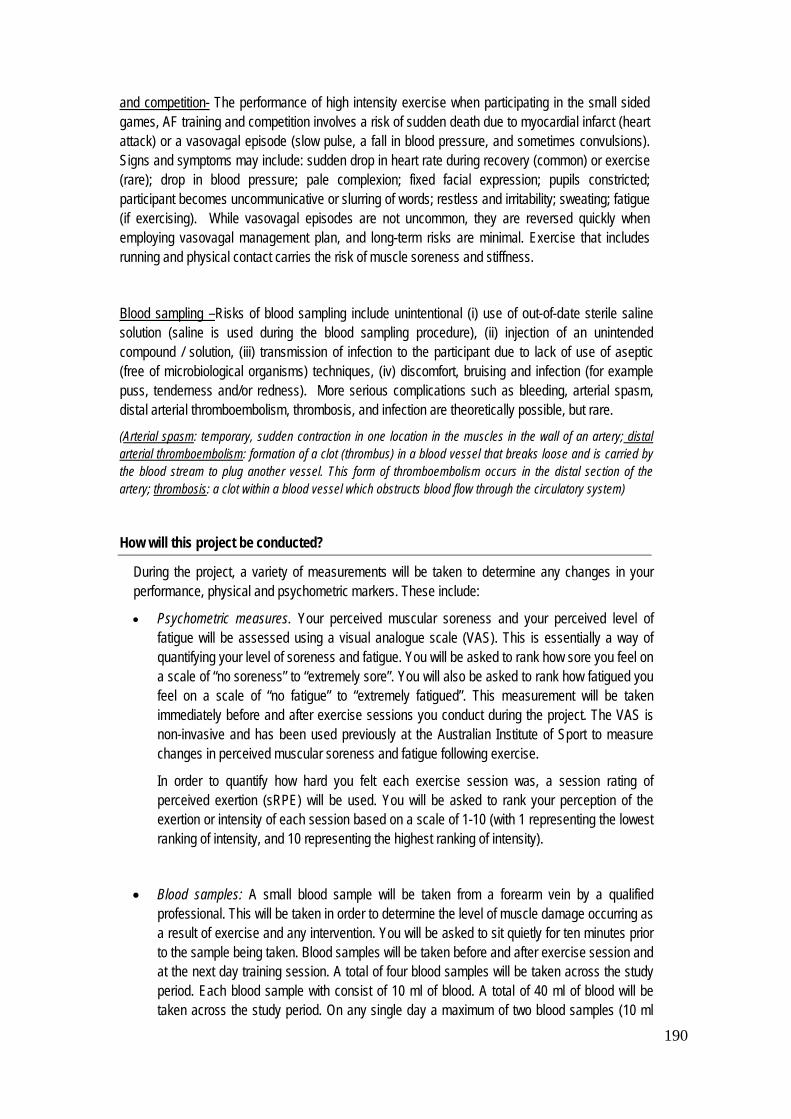
and competition- The performance of high intensity exercise when participating in the small sided games, AF training and competition involves a risk of sudden death due to myocardial infarct (heart attack) or a vasovagal episode (slow pulse, a fall in blood pressure, and sometimes convulsions). Signs and symptoms may include: sudden drop in heart rate during recovery (common) or exercise (rare); drop in blood pressure; pale complexion; fixed facial expression; pupils constricted; participant becomes uncommunicative or slurring of words; restless and irritability; sweating; fatigue (if exercising). While vasovagal episodes are not uncommon, they are reversed quickly when employing vasovagal management plan, and long-term risks are minimal. Exercise that includes running and physical contact carries the risk of muscle soreness and stiffness.
Blood sampling –Risks of blood sampling include unintentional (i) use of out-of-date sterile saline solution (saline is used during the blood sampling procedure), (ii) injection of an unintended compound / solution, (iii) transmission of infection to the participant due to lack of use of aseptic (free of microbiological organisms) techniques, (iv) discomfort, bruising and infection (for example puss, tenderness and/or redness). More serious complications such as bleeding, arterial spasm, distal arterial thromboembolism, thrombosis, and infection are theoretically possible, but rare.
(Arterial spasm: temporary, sudden contraction in one location in the muscles in the wall of an artery; distal arterial thromboembolism: formation of a clot (thrombus) in a blood vessel that breaks loose and is carried by the blood stream to plug another vessel. This form of thromboembolism occurs in the distal section of the artery; thrombosis: a clot within a blood vessel which obstructs blood flow through the circulatory system)
How will this project be conducted?
During the project, a variety of measurements will be taken to determine any changes in your performance, physical and psychometric markers. These include:
• Psychometric measures. Your perceived muscular soreness and your perceived level of fatigue will be assessed using a visual analogue scale (VAS). This is essentially a way of quantifying your level of soreness and fatigue. You will be asked to rank how sore you feel on a scale of “no soreness” to “extremely sore”. You will also be asked to rank how fatigued you feel on a scale of “no fatigue” to “extremely fatigued”. This measurement will be taken immediately before and after exercise sessions you conduct during the project. The VAS is non-invasive and has been used previously at the Australian Institute of Sport to measure changes in perceived muscular soreness and fatigue following exercise.
In order to quantify how hard you felt each exercise session was, a session rating of perceived exertion (sRPE) will be used. You will be asked to rank your perception of the exertion or intensity of each session based on a scale of 1-10 (with 1 representing the lowest ranking of intensity, and 10 representing the highest ranking of intensity).
• Blood samples: A small blood sample will be taken from a forearm vein by a qualified professional. This will be taken in order to determine the level of muscle damage occurring as a result of exercise and any intervention. You will be asked to sit quietly for ten minutes prior to the sample being taken. Blood samples will be taken before and after exercise session and at the next day training session. A total of four blood samples will be taken across the study period. Each blood sample with consist of 10 ml of blood. A total of 40 ml of blood will be taken across the study period. On any single day a maximum of two blood samples (10 ml
190

each) will be taken. This equates to 20 ml of blood being taken on any one day.
• Hydration Testing: In order to determine any changes in your hydration status the investigators will be using two measures: changes in your body weight; and changes in the properties of your urine, through a technique known as urine specific gravity (USG), from a small urine sample. No other analysis will be performed on your urine sample. In order to determine changes in your body mass, you will be asked to weigh yourself before and after each exercise session.
• Performance measures: You will be required to complete two simple performance tests. This is to assess weather or not an intervention has an effect on your performance. A repeat sprint ability test (RSA) will be used to assess your ability to perform six short repeated sprints. The RSA test is commonly used among team sports. You will also be required to complete a simple jump test, known as the countermovement jump test (CMJ) following exercise. This is a simple jump test performed on a mat that records a multitude of variables during the jump.
Who is conducting the study?
Organisations Involved in the Project:
- Victoria University (Footscray Park Campus) - Deakin University (Burwood Campus) - Western Bulldogs Football Club - Williamstown Football Club
Principle Researcher Dr Robert Aughey Victoria University Footscray Park Campus Ballarat Road, Footscray 3011 [email protected] 9919 5551
Co-Researcher Dr Rod Snow Deakin University Burwood Campus Burwood Hwy, Burwood 3125 [email protected]
Student Researcher Ms Emma Gallaher Victoria University Footscray Park Campus Ballarat Road, Footscray 30 [email protected] 9919 4207
Any queries about your participation in this project may be directed to the Principal Researcher listed above. If you have any queries or complaints about the way you have been treated, you may contact the Secretary, Victoria University Human Research Ethics Committee, Victoria University, PO Box 14428, Melbourne, VIC, 8001 phone (03) 9919 4781.
191
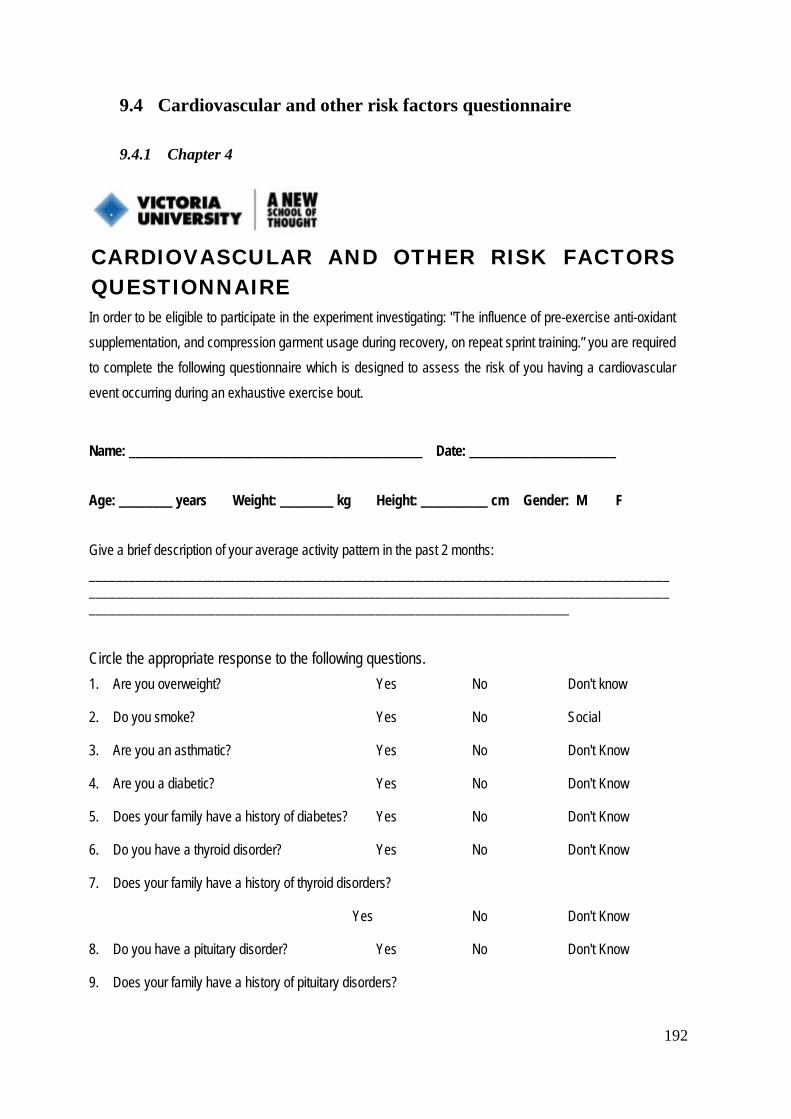
9.4 Cardiovascular and other risk factors questionnaire
9.4.1 Chapter 4
CARDIOVASCULAR AND OTHER RISK FACTORS QUESTIONNAIRE In order to be eligible to participate in the experiment investigating: "The influence of pre-exercise anti-oxidant supplementation, and compression garment usage during recovery, on repeat sprint training.” you are required to complete the following questionnaire which is designed to assess the risk of you having a cardiovascular event occurring during an exhaustive exercise bout.
Name: ____________________________________________ Date: ______________________ Age: ________ years Weight: ________ kg Height: __________ cm Gender: M F Give a brief description of your average activity pattern in the past 2 months: ______________________________________________________________________________________________________________________________________________________________________________________________________________________________________________________
Circle the appropriate response to the following questions. 1. Are you overweight? Yes No Don't know
2. Do you smoke? Yes No Social
3. Are you an asthmatic? Yes No Don't Know
4. Are you a diabetic? Yes No Don't Know
5. Does your family have a history of diabetes? Yes No Don't Know
6. Do you have a thyroid disorder? Yes No Don't Know
7. Does your family have a history of thyroid disorders?
Yes No Don't Know
8. Do you have a pituitary disorder? Yes No Don't Know
9. Does your family have a history of pituitary disorders?
192

Yes No Don't Know
10. Do you have a heart rhythm disturbance? Yes No Don't Know
11. Do you have a high blood cholesterol level? Yes No Don't Know
12. Do you have elevated blood pressure? Yes No Don't Know
13. Are you being treated with diuretics? Yes No
14. Are you on any other medications? Yes No
List all medications? (Including oral contraceptives) ______________________________________________________________________________________________________________________________________________________________________________
15. Do you think you have any medical complaint or any other reason which you know of which you think may prevent you from participating in strenuous exercise? Yes No
If Yes, please elaborate ______________________________________________________________________
16. Have you had any musculoskeletal problems that have required medical treatment (e.g., broken bones, joint reconstruction etc)? Yes No
If Yes, please provide details (including dates) ______________________________________________________________________
17. Are you currently pregnant or expect to become pregnant during the time in which this experiment is conducted? Yes No
18. Does your family have a history of premature cardiovascular problems
(e.g. heart attack, stroke)? Yes No Don't Know
I, _________________________________________, believe that the answers to these questions are true and correct.
Signed: ____________________________________ Date: ___________________
193

9.4.2 Chapter 5 & Chapter 6
COMPRESSION GARMENT RESEARCH MEDICAL QUESTIONNAIRE
Responses to this questionnaire will be kept strictly confidential. The responses from this questionnaire will provide the investigators with appropriate information to establish suitability of your participation in this study. Anyone who is currently carrying a musculo-skeletal injury or has a history of past, serious musculo-skeletal injuries may be excluded from the study for health and safety reasons.
Please complete the following preliminary questionnaire.
Name:________________________________ Age:________________(years)
Weight(kg):________________ Height (cm)_______________Sex:_______________
Are you currently undertaking any form of regular exercise? YES NO
(If yes, briefly describe the type and amount (i.e. Frequency, duration) of exercise you perform)
________________________________________________________________________________________________________________________________________________________________
Are you a smoker? YES NO
Has anyone ever told you that you:
• are overweight? YES NO DON’T KNOW
• have high blood pressure? YES NO DON’T KNOW
• have a heart murmur? YES NO DON’T KNOW
• are asthmatic? YES NO DON’T KNOW
• are Haemophiliac? YES NO DON’T KNOW
• have type 2 diabetes? YES NO DON’T KNOW
• heart palpitations (sensation of abnormally fast and/or irregular heart beat)?
YES NO DON’T KNOW
194

• episodes of fainting, collapse or loss of consciousness?
YES NO DON’T KNOW
• abnormal bleeding or bruising? YES NO DON’T KNOW
• gastrointestinal problems? YES NO DON’T KNOW
Have you, or anyone of your family a history of cardiovascular disease? YES NO
(e.g. Heart attack, chest pain, stroke, rheumatic vascular disease)
If YES, please elaborate:_______________________________________________________
Have you ever suffered any musculoskeletal injury? YES NO
If YES, please elaborate:_______________________________________________________
Have you suffered any musculoskeletal injury in the last 6 months? YES NO
If YES, please elaborate:_______________________________________________________
Do you have any allergies (including to medications)
YES NO DON’T KNOW
If YES, please elaborate:_______________________________________________________
Have you ever experienced difficulty swallowing or any other gastrointestinal problem?
YES NO DON’T KNOW
If YES, please elaborate:_______________________________________________________
Are you currently taking any medications including the following?
• Anti-coagulants YES NO DON’T KNOW
195

• Anti-inflammatory YES NO DON’T KNOW
• Aspirin YES NO DON’T KNOW
• Steroids (medically prescribed)
YES NO DON’T KNOW
• Others, please specify:
__________________________________________________
If YES, please elaborate:_______________________________________________________
___________________________________________________________________________
Are you currently taking steroids or any performance enhancing substances?
YES NO DON’T KNOW
If YES, please elaborate:
________________________________________________________________
Do you have any other reason which you know of which you think may prevent you from
undertaking exercise or any of the other proposed tests? YES NO
If YES, please elaborate:_______________________________________________________
I believe the information I have provided to be true and correct.
Signed:_________________________________ Date:_______________
COMMENTS ON MEDICAL EXAMINATION (where appropriate): ________________________________________________________________________________________________________________________________________________________________________________________________________________________________________________
196

9.5 Consent form
9.5.1 Chapter 4
CONSENT FORM FOR PARTICIPANTS INVOLVED IN RESEARCH INFORMATION TO PARTICIPANTS:
We would like to invite you to be a part of a study into investigating the influence of a pre-exercise anti-oxidant supplement and compression garment usage during recovery on repeat sprint training. This study aims to investigate the following four points: (1) Does acute NAC enhance acute sprint performance?; (2) Does NAC enhance acute recovery from sprint exercise?; (3) Does NAC enhance sprint training outcomes?; and (4) Does compression worn after sessions enhance acute recovery and therefore chronic training effect?
CERTIFICATION BY SUBJECT
I, ____________________________________________
of _________________________________________________________________________________
certify that I am at least 18 years old* and that I am voluntarily giving my consent to participate in the study: “The influence of pre-exercise anti-oxidant supplementation and compression garment usage during recovery on repeat sprint training” being conducted at Victoria University by Dr. Rob Aughey.
I certify that the objectives of the study, together with any risks and safeguards associated with the procedures listed hereunder to be carried out in the research, have been fully explained to me by:
Miss Emma Gallaher and/or Miss Emma Goff
and that I freely consent to participation involving the below mentioned procedures:
• Provision of personal, medical and family history information for the purposes of general medical screening
197

• Yo-Yo Intermittent Recovery Test
• Repeated Sprint Training Protocol performed on a non-motorised treadmill
• Blood sampling
• Recovery Intervention (use of compression garments)
• Performance intervention (use of antioxidant supplement)
I certify that I have had the opportunity to have any questions answered and that I understand that I can withdraw from this study at any time and that this withdrawal will not jeopardise me in any way. I have been informed that the information I provide will be kept confidential.
Signed: _____________________________
Date: _______________________________
Any queries about your participation in this project may be directed to the researcher Dr. Rob Aughey, ph. 03-9919 5551. If you have any queries or complaints about the way you have been treated, you may contact the Ethics & Biosafety Coordinator, Victoria University Human Research Ethics Committee, Victoria University, PO Box 14428, Melbourne, VIC, 8001 phone (03) 9919 4148.
198

9.5.2 Chapter 5 & Chapter 6
Consent Form for Subjects Involved in Research
INFORMATION TO PARTICIPANTS:
We would like to invite you to be a part of a study examining the physiological and performance responses to compression garment usage following exercise.
CERTIFICATION BY SUBJECT
I, ___________________________________________
of __________________________________________
certify that I am voluntarily giving my consent to participate in the following study titled:
“COMPRESSION GARMENTS AND RECOVERY IN ELITE AUSTRALIAN RULES FOOTBALL PLAYERS: FROM THE LABORATORY TO THE FIELD.”
being conducted at Victoria University by:
Dr Rob Aughey (Principal investigator)
Professor Rod Snow (Co investigator)
Miss Emma Gallaher (Student researchers)
I certify that the objectives of the study, together with any risks and safeguards associated with the procedures listed hereunder to be carried out in the research, have been fully explained to me by:
Dr Rob Aughey (Principal investigator)
Professor Rod Snow (Co investigator)
Miss Emma Gallaher (Student Researchers)
199

and that I freely consent to participation involving the use on me of these procedures.
Procedures:
• Small-sided games
• Recovery intervention (compression garment therapy).
• Performance test ( sprint ability and countermovement jump)
• Blood sampling
• Hydration status testing
I certify that I have had the opportunity to have any questions answered and that I understand that I can withdraw from this study at any time and that this withdrawal will not jeopardise me in any way.
I have been informed that the information I provide will be kept confidential.
Signed: .................................................................. Date: ................................................
Any queries about your participation in this project may be directed to the researcher (Name: Dr Rob Aughey ph. 03-9919 5551). If you have any queries or complaints about the way you have been treated, you may contact the Secretary, University Human Research Ethics Committee, Victoria University, PO Box 14428, Melbourne, 8001 (telephone no: 03-9919 4710).
200

9.6 Perceptual measurements
9.6.1 Chapter 4: Visual analogue scale and rating of perceived exertion.
General Fatigue and Muscle Soreness
Name: ___________________ Session:_________ Date: __________ PRE/POST (circle)
PART ONE: General Fatigue INSTRUCTIONS: How severe is your level of GENERAL FATIGUE today? Place a vertical mark on the line below to indicate how bad you feel your GENERAL FATIGUE is today.
No
Fatigue Very
severe fatigue
PART TWO: Muscle Soreness INSTRUCTIONS: How severe is your level of MUSCLE SORENESS today? Place a vertical mark on the line below to indicate how bad you feel your MUSCLE SORENESS is today.
No
Soreness
Very severe
soreness
PART THREE: Session RPE
Session RPE:
RPE SCALE RATING DESCRIPTOR
0 1 2 3 4 5 6 7 8 9
10
Rest
Very very easy
Easy
Moderate
Somewhat hard
Hard
Very Hard
Maximum
201

9.6.2 Chapter 5 & Chapter 6: Visual analogue scale
General Fatigue and Muscle Soreness
Name: ____________________ Date: ______________
PART ONE: General Fatigue
INSTRUCTIONS: How severe is your level of GENERAL FATIGUE today? Place a vertical mark on the line below to indicate how bad you feel your GENERAL FATIGUE is today.
No
Fatigue Very
severe fatigue
PART TWO: Muscle Soreness
INSTRUCTIONS: How severe is your level of MUSCLE SORENESS today? Place a vertical mark on the line below to indicate how bad you feel your MUSCLE SORENESS is today.
No
Soreness
Very severe
soreness
202

9.6.3 Chapter 5 & Chapter 6: Rating of Perceived Exertion Scale
RPE SCALE RATING DESCRIPTOR
0 1 2 3 4 5 6 7 8 9
10
Rest
Very very easy
Easy
Moderate
Somewhat hard
Hard
Very Hard
Maximum
203

9.7 Raw plasma Myoglobin values
9.7.1 Chapter 4: Raw plasma Myoglobin values
Table 9.1: Raw plasma Myoglobin concentration (ng/ml).
Pre RSE1 Post RSE1 Pre RSE2 Post RSE2 Pre RSE3 Post RSE3 +24 hr
Spo 25.5±12.3 23.8±14.7 27.5±13.2 24.6±14.7 27.5±13.2 28.1±14.8 31.8±20.1
Con 35.4±40.0 41.3±36.0 29.1±20.9 25.0±14.7 34.4±27.2 29.6±35.8 36.3±29.6
Plasma Myoglobin values expressed in ng/ml for the sports compression garment group (Spo; n=9) and control group (Con; n=9). Values are mean±standard deviation. Data was collected Pre and Post repeat sprint exercise session 1, 2 and 3, and 24 hr after RSE3 (+24 hr).
9.7.2 Chapter 5: Raw plasma Myoglobin values
Table 9.2: Raw plasma Myoglobin concentration (ng/ml).
Pre +24 hr
Con 22.7±5.6 44.5±24.2
Med 27.3±10.5 44.0±20.5
Spo 24.4±16.8 49.3±21.2
Samples were collected at Pre and 24 h post training session 1 (TR1) (+24 hr) for the control (Con, n=7), medical compression group (Med, n=8), and sports compression garment group (Spo, n=9). Values are mean±standard deviation
204

Table 9.3: Raw plasma Myoglobin concentration (ng/ml).
Pre +24 hr Con 29.7±11.9 38.0±17.7 Med 29.6±11.8 36.5±21.4 Spo 22.4±9.9 36.3±12.4
Samples were collected at Pre and 24 h post training session 1 (TR1) (+24 hr) for the control (Con, n=6), medical compression group (Med, n=6), and sports compression garment group (Spo, n=7). Values are mean±standard deviation.
9.7.3 Chapter 6: Raw plasma Myoglobin values
Table 9.4: Raw plasma Myoglobin concentration (ng/ml).
Pre Post +40 hr Con 31.7±20.6 422.5±239.2 40.4±29.5 Med 38.0±16.7 480.4±48.2 38.0±26.2 Spo 16.4±9.1 580.9±301.8 20.3±18.2
Samples were collected at pre game (Pre), post game (Post) and 40 hr post game (+40) for the control (Con, n=7), sports compression (Spo, n=7) and medical compression garment (Med, n=8) groups. Values are mean±standard deviation. Data was collected Pre, Post and 40 hr after the match (+40 hr).
205
REFERENCES
Ali, A., M. Caine, et al. (2007). "Graduated compression stockings: physiological and perceptual responses during and after exercise." Journal of Sports Sciences 25(4): 413-419.
Ali, A., R. H. Creasy, et al. (2010). "Physiological effects of wearing graduated compression stockings during running." Eur J Appl Physiol.
Ali, A., R. H. Creasy, et al. (2011). "The effect of graduated compression stockings on running performance." Journal of Strength and Conditioning Research 25(5): 1385-1392.
Allen, D. G., G. D. Lamb, et al. (2008). "Skeletal muscle fatigue: cellular mechanisms." Physiological Reviews 88(1): 287-332.
Applegate, E. A. and L. E. Grivetti (1997). "Search for the competitive edge: a history of dietary fads and supplements." Journal of Nutrition 127(5 Suppl): 869S-873S.
Armstrong, R. (1984). "Mechanisms of exercise-induced delayed onset musclar soreness: a brief review." Medicine and Science in Sports and Exercise 16(6): 529-538.
Armstrong, R. B. (1986). "Muscle Damage and Endurance Events." Sports Medicine (Auckland, N.Z.) 3: 370-381.
Armstrong, R. B., R. W. Oglivive, et al. (1983). "Eccentric exercise-induced injury to rat skeletal muscle." Journal of Applied Physiology 4: 170-176.
Armstrong, R. B., G. L. Warren, et al. (1991). "Mechanisms of exercise-induced muscle fibre injury." Sports Medicine (Auckland, N.Z.) 12(3): 184-207.
Ascensao, A., M. Leite, et al. (2011). "Effects of cold water immersion on the recovery of physical performance and muscle damage following a one-off soccer match." Journal of Sports Science 29(3): 217-225.
Ascensao, A., A. Rebelo, et al. (2008). "Biochemical impact of a soccer match - analysis of oxidative stress and muscle damage markers throughout recovery." Clinical Biochemistry 41: 841-851.
Asmussen, E. (1956). "Observations on experimental muscular soreness." Acta Rheumatologica Scandinavica 2(2): 109-116.
Aughey, R. J. (2010). "Australian Football player workrate: Evidence of fatigue and pacing?" International Journal of Sports Physiology & Performance 5(3): 394-405.
Aughey, R. J. (2011). "Increased high intensity activity in elite Australian football finals matches." International Journal of Sports Physiology and Performance 6(3): 367-379.
Aughey, R. J., S. A. Clark, et al. (2006). "Interspersed normoxia during live high, train low interventions reverses an early reduction in muscle Na+, K +ATPase activity in well-trained athletes." European Journal of Applied Physiology 98(3): 299-309.
Aughey, R. J., C. J. Gore, et al. (2005). "Chronic intermittent hypoxia and incremental cycling exercise independently depress muscle in vitro maximal Na+-K+-ATPase activity in well-trained athletes." Journal of Applied Physiology 98(1): 186-192.
206

Aughey, R. J., K. T. Murphy, et al. (2007). "Muscle Na+-K+-ATPase activity and isoform adaptations to intense interval exercise and training in well-trained athletes." Journal of Applied Physiology 103(1): 39-47.
Avela, J., H. Kyrolainen, et al. (1999). "Reduced reflex sensitivity persists several days after long-lasting stretch-shortening cycle exercise." Journal of Applied Physiology 86(4): 1292-1300.
Bahnert, A., K. Norton, et al. (2013). "Association between post-game recovery protocols, physical and perceived recovery, and performance in elite Australian Football League players." Journal of Science and Medicine in Sport 16(2): 151-156.
Bailey, D. M., S. J. Erith, et al. (2007). "Influence of cold-water immersion on indices of muscle damage following prolonged intermittent shuttle running." Journal Of Sports Sciences 25(11): 1163-1170.
Baker, A. J., K. G. Kostov, et al. (1993). "Slow force recovery after long-duration exercise: metabolic and activation factors in muscle fatigue." Journal of Applied Physiology 74(5): 2294-2300.
Balog, E. M. and R. H. Fitts (1996). "Effects of fatiguing stimulation on intracellular Na+ and K+ in frog skeletal muscle." Journal of Applied Physiology 81(2): 679-685.
Balog, E. M., L. V. Thompson, et al. (1994). "Role of sarcolemma action potentials and excitability in muscle fatigue." Journal of Applied Physiology 76(5): 2157-2162.
Balsom, P. D., K. Wood, et al. (1999). "Carbohydrate intake and multiple sprint sports: with special reference to football (soccer)." International Journal of Sports Medicine 20(1): 48-52.
Bangsbo, J., F. M. Iaia, et al. (2008). "The Yo-Yo intermittent recovery test : a useful tool for evaluation of physical performance in intermittent sports." Sports Medicine (Auckland, N.Z.) 38(1): 37-51.
Barrack, R. L., H. B. Skinner, et al. (1989). "Proprioception in the anterior cruciate deficient knee." The American Journal of Sports Medicine 17(1): 1-6.
Batterham, A. M. and W. G. Hopkins (2006). "Making Meaningful Inferences About Magnitudes." International Journal of Sports Physiology and Performance 1(1): 50-57.
Beedie, C. J. and A. J. Foad (2009). "The placebo effect in sports performance: a brief review." Sports Medicine (Auckland, N.Z.) 39(4): 313-329.
Beidler, S. K., C. D. Douillet, et al. (2009). "Inflammatory cytokine levels in chronic venous insufficiency ulcer tissue before and after compression therapy." Journal of Vascular Surgery 49(4): 1013-1020.
Bianchi, J. and M. Todd (2000). "The management of a patient with lymphoedema of the legs." Nursing Standards 14(40): 51-52, 55-56.
Billaut, F., D. J. Bishop, et al. (2011). "Influence of knowledge of sprint number on pacing during repeated-sprint exercise." Medicine and Science in Sports and Exercise 43(4): 665-672.
Blazev, R. and G. D. Lamb (1999a). "Adenosine inhibits depolarization-induced Ca(2+) release in mammalian skeletal muscle." Muscle Nerve 22(12): 1674-1683.
Blazev, R. and G. D. Lamb (1999b). "Low [ATP] and elevated [Mg2+] reduce depolarization-induced Ca2+ release in rat skinned skeletal muscle fibres." Journal of Physiology 520 Pt 1: 203-215.
Bochmann, R. P., W. Seibel, et al. (2005). "External compression increases forearm perfusion." Journal of Applied Physiology 99(6): 2337-2344.
207

Boonstra, A. M., H. R. Schiphorst Preuper, et al. (2008). "Reliability and validity of the visual analogue scale for disability in patients with chronic musculoskeletal pain." International Journal of Rehabilitation Research 31(2): 165-169.
Borg, G. A. (1982). "Psychophysical bases of perceived exertion." Medicine and Science in Sports and Exercise 14(5): 377-381.
Born, D. P., B. Sperlich, et al. (2013). "Bringing light into the dark: effects of compression clothing on performance and recovery." International Journal of Sports Physioogy and Performance 8(1): 4-18.
Bosco, C., G. Montanari, et al. (1987). "Relationship between the efficiency of muscular work during jumping and the energetics of running." European Journal of Applied Physiology and Occupational Physiology 56(2): 138-143.
Bowers, E. J., D. L. Morgan, et al. (2004). "Damage to the human quadriceps muscle from eccentric exercise and the training effect." Journal of Sports Science 22(11-12): 1005-1014.
Boyd, L. J., E. Gallaher, et al. (2010). Practical application of accelerometers in Australian football. Australian Conference of Science and Medicine in Sport, Queensland, Australia, Journal of Science and Medicine in Sport
Bradley, P. S., W. Sheldon, et al. (2009). "High-intensity running in English FA Premier League soccer matches." Journal of Sports Science 27(2): 159-168.
Brancaccio, P., F. M. Limongelli, et al. (2006). "Monitoring of serum enzymes in sport." British Journal Of Sports Medicine 40(2): 96-97.
Brancaccio, P., N. Maffulli, et al. (2007). "Creatine kinase monitoring in sport medicine." British Medical Bulletin 81-82(209-30).
Brandenburg, J., W. A. Pitney, et al. (2007). "Time course of changes in vertical-jumping ability after static stretching." International Journal of Sports Physiology and Performance 2(2): 170-181.
Brasil-Neto, J. P., A. Pascual-Leone, et al. (1993). "Postexercise depression of motor evoked potentials: a measure of central nervous system fatigue." Experimental Brain Research 93(1): 181-184.
Braun, W. A. and D. J. Dutto (2003). "The effects of a single bout of downhill running and ensuing delayed onset of muscle soreness on running economy performed 48 h later." European Journal Of Applied Physiology 90: 29-34.
Bringard, A., R. Denis, et al. (2006). "Effects of compression tights on calf muscle oxygenation and venous pooling during quiet resting in supine and standing positions." The Journal of Sports Medicine and Physical Fitness 46(4): 548-554.
Byrne, C. and R. Eston (2002). "The effect of exercise-induced muscle damage on isometric and dynamic knee extensor strength and vertical jump performance." Journal Of Sports Sciences 20(5): 417-425.
Byrne, C., C. Twist, et al. (2004). "Neuromuscular function after exercise-induced muscle damage: theoretical and applied implications." Sports Medicine (Auckland, N.Z.) 34(1): 49-69.
Cairns, S. P., J. A. Flatman, et al. (1995). "Relation between extracellular [K+], membrane potential and contraction in rat soleus muscle: modulation by the Na+-K+ pump." Pflugers Archives 430(6): 909-915.
Cairns, S. P., W. A. Hing, et al. (1997). "Different effects of raised [K+]o on membrane potential and contraction in mouse fast- and slow-twitch muscle." American Journal of Physiolgoy 273(2 Pt 1): C598-611.
Calder, A. (1990). "Recovery: restoration and regeneration as essential components within training programmes." EXCEL 6(3): 15-20.
208

Calder, A. (1991). "Recovery: The forgotten element in training prorams." Sports specific 3(1): 4-5.
Carlock, J. M., S. L. Smith, et al. (2004). "The relationship between vertical jump power estimates and weightlifting ability: a field-test approach." Journal of Strength and Conditioning Research 18(3): 534-539.
Chambers, C., T. D. Noakes, et al. (1998). "Time course of recovery of vertical jump height and heart rate versus running speed after a 90-km foot race." Journal of Sports Sciences 16(7): 645-651.
Chatard, J., D. Atlaoui, et al. (2004). "Elastic stockings, performance and leg pain recovery in 63-year-old sportsmen." European Journal Of Applied Physiology 93(3): 347-352.
Chen, T. C., H. L. Chen, et al. (2009). "Muscle damage responses of the elbow flexors to four maximal eccentric exercise bouts performed every 4 weeks." European Journal of Applied Physiology 106(2): 267-275.
Chen, T. C. and K. Nosaka (2006). "Responses of elbow flexors to two strenuous eccentric exercise bouts separated by three days." Journal of Strength and Conditioning Research 20(1): 108-116.
Chleboun, G. S., J. N. Howell, et al. (1995). "Intermittent pneumatic compression effect on eccentric exercise-induced swelling, stiffness, and strength loss." Archives of Physical Medicine and Rehabilitation 76(8): 744-749.
Clark, M. and G. Krimmel (2006). Lymphoedema and the construction and classification of compression hosiery. Lymphoedema Framework. Template for Practice: compression hosiery in lymphoedema. London, HealthComm UK Ltd.
Clark, V. R., W. G. Hopkins, et al. (2000). "Placebo effect of carbohydrate feedings during a 40-km cycling time trial." Medicine and Science in Sports and Exercise 32(9): 1642-1647.
Clarkson, P. M., K. Nosaka, et al. (1992). "Muscle function after exercise-induced muscle damage and rapid adaptation." Medicine and Science in Sports and Exercise 24(5): 512-520.
Clarkson, P. M. and S. P. Sayers (1999). "Etiology of exercise-induced muscle damage." Canadian Journal of Applied Physiology 24(3): 234-248.
Clarkson, P. M. and I. Tremblay (1988). "Exercise-induced muscle damage, repair, and adaptation in humans." Journal of Applied Physiology 65(1): 1-6.
Clausen, T. (2003). "Na+-K+ pump regulation and skeletal muscle contractility." Physiological Reviews 83(4): 1269-1324.
Clausen, T., S. L. Andersen, et al. (1993). "Na(+)-K+ pump stimulation elicits recovery of contractility in K(+)-paralysed rat muscle." Journal of Physiology 472: 521-536.
Cleak, M. J. and R. G. Eston (1992). "Muscle soreness, swelling, stiffness and strength loss after intense eccentric exercise." British Journal of Sports Medicine 26(4): 267-272.
Cleather, D. J. and S. R. Guthrie (2007). "Quantifying delayed-onset muscle soreness: a comparison of unidimensional and multidimensional instrumentation." Journal of Sports Science 25(8): 845-850.
Comtois, A., P. Light, et al. (1995). "Effect of tolbutamide on the rate of fatigue and recovery in frog sartorius muscle." The Journal of Pharmacology and Experimental Therapeutics 274(3): 1061-1066.
Cook, C. J. (2002). "Rapid noninvasive measurement of hormones in transdermal exudate and saliva." Physiology and Behaviour 75(1-2): 169-181.
209

Cormack, S. J., R. U. Newton, et al. (2008a). "Neuromuscular and Endocrine Responses of Elite Players to an Australian Rules Football Match." International Journal of Sports Physiology and Performance 3(3): 359-374.
Cormack, S. J., R. U. Newton, et al. (2008b). "Neuromuscular and endocrine responses of elite players during an Australian rules football season." International Journal of Sports Physiology and Performance 3(4): 439-453.
Cormack, S. J., R. U. Newton, et al. (2008c). "Reliability of Measures Obtained During Single and Repeated Countermovement Jumps." International Journal of Sports Physiology and Performance 3: 131-144.
Cormie, P., J. M. McBride, et al. (2009). "Power-time, force-time, and velocity-time curve analysis of the countermovement jump: impact of training." Journal of Strength and Conditioning Research 23(1): 177-186.
Costill, D. L., D. D. Pascoe, et al. (1990). "Impaired muscle glycogen resynthesis after eccentric exercise." Journal of Applied Physiology 69(1): 46-50.
Coutts, A. J., J. Quinn, et al. (2010). "Match running performance in elite Australian Rules Football." Journal of Science and Medicine in Sport 12(5): 543-548.
Coza, A., J. F. Dunn, et al. (2012). "Effects of Compression on Muscle Tissue Oxygenation at the Onset of Exercise." Journal of Strength and Conditioning Research (epub).
Crinnion, J. N., S. Homer-Vanniasinkam, et al. (1994). "Neutrophils and skeletal muscle reperfusion injury." Annals of the New York Academy of Sciences 723: 444-446.
Dahlstedt, A. J., A. Katz, et al. (2001). "Role of myoplasmic phosphate in contractile function of skeletal muscle: studies on creatine kinase-deficient mice." Journal of Physiology 533(Pt 2): 379-388.
Dascombe, B. J., T. K. Hoare, et al. (2011). "The effects of wearing undersized lower-body compression garments on endurance running performance." International Journal of Sports Physiology and Performance 6(2): 160-173.
Davies, C. T. and M. J. White (1981). "Muscle weakness following eccentric work in man." Pflugers Archives 392(2): 168-171.
Davies, V., K. G. Thompson, et al. (2009). "The effects of compression garments on recovery." Journal of Strength and Conditioning Research 23(6): 1786-1794.
Dawson, B., S. Gow, et al. (2005). "Effects of immediate post-game recovery procedures on muscle soreness, power and flexiblity levels over the next 48 hours." Journal of Science and Medicine in Sport 8(2): 210-221.
Dawson, B., R. Hopkinson, et al. (2004a). "Comparison of training activities and game demands in the Australian Football League." Journal of Science and Medicine in Sport 7(3): 292-301.
Dawson, B., R. Hopkinson, et al. (2004b). "Player movement patterns and game activities in the Australian Football League." Journal of Science and Medicine in Sport 7(3): 278-291.
Dawson, M. J., D. G. Gadian, et al. (1978). "Muscular fatigue investigated by phosphorus nuclear magnetic resonance." Nature 274(5674): 861-866.
De Glanville, K. M. and M. J. Hamlin (2012). "Positive Effect of Lower Body Compression Garments on Subsequent 40-kM Cycling Time Trial Performance." Journal of Strength and Conditioning Research.
Dierking, J. K. and M. G. Bemben (1998). "Delayed Onset Muscle Soreness." Strength and Conditioning 20(4): 44-48.
210

Dill, D. B. and D. L. Costill (1974). "Calculation of percentage changes in volumes of blood, plasma, and red cells in dehydration." Journal of Applied Physiology 37(2): 247-248.
Doan, B., Y. Kwon, et al. (2003). "Evaluation of a lower-body compression garment." Journal of Sports Sciences 21(8): 601-610.
Du Toit, R. N., N. Pritchard, et al. (2002). "A Comparison of Three Different Scales for Rating Contact Lens Handling." Optometry & Vision Science 79(5): 313-320.
Duffield, R., J. Cannon, et al. (2010). "The effects of compression garments on recovery of muscle performance following high-intensity sprint and plyometric exercise." Journal of Science and Medicine in Sport 13(1): 136-140.
Duffield, R., A. J. Coutts, et al. (2009). "Core temperature responses and match running performance during intermittent-sprint exercise competition in warm conditions." Journal of Strength and Conditioning Research 23(4): 1238-1244.
Duffield, R., J. Edge, et al. (2008). "The effects of compression garments on intermittent exercise performance and recovery on consecutive days." International Journal of Sports Physiology and Performance 3(4): 454-468.
Duffield, R. and M. Portus (2007). "Comparison of three types of full-body compression garments on throwing and repeat-sprint performance in cricket players." British Journal of Sports Medicine 41(7): 409-414.
Duke, A. M. and D. S. Steele (2000). "Characteristics of phosphate-induced Ca(2+) efflux from the SR in mechanically skinned rat skeletal muscle fibers." American Journal of Physiolgoy: Cell Physiology 278(1): C126-135.
Duke, A. M. and D. S. Steele (2001). "Mechanisms of reduced SR Ca(2+) release induced by inorganic phosphate in rat skeletal muscle fibers." American Journal of Physiolgoy: Cell Physiology 281(2): C418-429.
Dutka, T. L. and G. D. Lamb (2004). "Effect of low cytoplasmic [ATP] on excitation-contraction coupling in fast-twitch muscle fibres of the rat." Journal of Physiology 560(Pt 2): 451-468.
Dutka, T. L. and G. D. Lamb (2007). "Na+-K+ pumps in the transverse tubular system of skeletal muscle fibers preferentially use ATP from glycolysis." American Journal of Physiolgoy: Cell Physiology 293(3): C967-977.
Ebert, T. R. (2000). "Nutrition for the Australian Rules Football Player." Journal of Science and Medicine in Sport 3(4): 369-382.
Edwards, R. H., D. K. Hill, et al. (1977). "Fatigue of long duration in human skeletal muscle after exercise." Journal of Physiology 272(3): 769-778.
Elias, G. P., M. C. Varley, et al. (2012). "Effects of Water Immersion on Post-training Recovery in Australian Footballers." International Journal of Sports Physiology and Performance.
Elias, G. P., V. L. Wyckelsma, et al. (2012). "Effectiveness of Water Immersion on Post-Match Recovery in Elite Professional Footballers." International Journal of Sports Physiology and Performance.
Enoka, R. M. (1996). "Eccentric contractions require unique activation strategies by the nervous system." Journal of Applied Physiology 81(6): 2339-2346.
Entman, M. L., S. S. Keslensky, et al. (1980). "The sarcoplasmic reticulum-glycogenolytic complex in mammalian fast twitch skeletal muscle. Proposed in vitro counterpart of the contraction-activated glycogenolytic pool." Journal of Biological Chemistry 255(13): 6245-6252.
Eston, R. and D. Peters (1999). "Effects of cold water immersion on the symptoms of exercise-induced muscle damage." Journal of Sports Sciences 13(7): 231-238.
211

Evans, W. J. and J. Cannon (1991). "Metabolic effects of exercise-induced muscle damage." Exercise and Sport Science Reviews 18: 99-125.
Fawcett, J. K. and V. Wynn (1960). "Effects of posture on plasma volume and some blood constituents." Journal of Clinical Pathology 13: 304-310.
Fielding, R. A., M. A. Violan, et al. (2000). "Effects of prior exercise on eccentric exercise-induced neutrophilia and enzyme release." Medicine and Science in Sports and Exercise 32(2): 359-364.
Fisher, R. A. (1970). Statistical methods for research workers. New York Hafner Press. Fong, C. N., H. L. Atwood, et al. (1986). "Intracellular sodium-activity at rest and after
tetanic stimulation in muscles of normal and dystrophic (dy2J/dy2J) C57BL/6J mice." Experimental Neurology 93(2): 359-368.
Fowles, J. R., H. J. Green, et al. (2002). "Reduced activity of muscle Na(+)-K(+)-ATPase after prolonged running in rats." Journal of Applied Physiology 93(5): 1703-1708.
Fraser, S. F., J. L. Li, et al. (2002). "Fatigue depresses maximal in vitro skeletal muscle Na(+)-K(+)-ATPase activity in untrained and trained individuals." Journal of Applied Physiology 93(5): 1650-1659.
French, D. N., K. G. Thompson, et al. (2008). "The effects of contrast bathing and compression therapy on muscular performance." Medicine and Science in Sports and Exercise 40(7): 1297-1306.
Friden, J. and R. L. Lieber (1992). "Structural and mechanical basis of exercise-induced muscle injury." Medicine and Science in Sports and Exercise 24(5): 521-530.
Friden, J. and R. L. Lieber (2001). "Eccentric exercise-induced injuries to contractile and cytoskeletal muscle fibre components." Acta Physiologica Scandinavica 171(3): 321-326.
Fridén, J. and R. L. Lieber (1996). "Ultrastructural evidence for loss of calcium homeostasis in exercised skeletal muscle." Acta Physiologica Scandinavica 158(4): 381-382.
Friden, J., J. Seger, et al. (1988). "Sublethal muscle fibre injuries after high-tension anaerobic exercise." European Journal Of Applied Physiology and Occupational Physiology 57(3): 360-368.
Friden, J., J. Seger, et al. (1989). "Topographical localization of muscle glycogen: an ultrahistochemical study in the human vastus lateralis." Acta Physiologica Scandinavica 135(3): 381-391.
Friden, J., M. Sjostrom, et al. (1983). "Myofibrillar damage following intense eccentric exercise in man." International Journal of Sports Medicine 4(3): 170-176.
Fryer, M. W., V. J. Owen, et al. (1995). "Effects of creatine phosphate and P(i) on Ca2+ movements and tension development in rat skinned skeletal muscle fibres." Journal of Physiology 482 ( Pt 1): 123-140.
Gandevia, S. C. (2001). "Spinal and supraspinal factors in human muscle fatigue." Physiological Reviews 81(4): 1725-1789.
Garland, S. J. (1991). "Role of small diameter afferents in reflex inhibition during human muscle fatigue." Journal of Physiology 435: 547-558.
Garland, S. J. and M. P. Kaufman (1995). "Role of muscle afferents in the inhibition of motoneurons during fatigue." Advances in Experimental Medicine and Biology 384: 271-278.
Gibala, M. J., J. D. MacDougall, et al. (1995). "Changes in human skeletal muscle ultrastructure and force production after acute resistance exercise." Journal of Applied Physiology 78(2): 702-708.
212

Gill, N. D., C. M. Beaven, et al. (2006). "Effectiveness of post-match recovery strategies in rugby players." British Journal of Sports Medicine 40(3): 260-263.
Gladfelter, J. (2007). "Compression garments 101." Plastic Surgical Nursing 27(2): 73. Godt, R. E. and T. M. Nosek (1989). "Changes of intracellular milieu with fatigue or
hypoxia depress contraction of skinned rabbit skeletal and cardiac muscle." Journal of Physiology 412: 155-180.
Gonzalez-Serratos, H., A. V. Somlyo, et al. (1978). "Composition of vacuoles and sarcoplasmic reticulum in fatigued muscle: electron probe analysis." Proceedings of the National Academy of Sciences of the United States of America 75(3): 1329-1333.
Gordon, A. M., E. Homsher, et al. (2000). "Regulation of contraction in striated muscle." Physiological Reviews 80(2): 853-924.
Gould D, Kelly D, et al. (2001). "Examining the validity of pressure ulcer risk assessment scales: developing and using illustrated patient simulations to collect the data." Journal Of Clinical Nursing 10(5): 697-706.
Green, S., J. Bulow, et al. (1999). "Microdialysis and the measurement of muscle interstitial K+ during rest and exercise in humans." Journal of Applied Physiology 87(1): 460-464.
Green, S., H. Langberg, et al. (2000). "Interstitial and arterial-venous [K+] in human calf muscle during dynamic exercise: effect of ischaemia and relation to muscle pain." Journal of Physiology 529 Pt 3: 849-861.
Hargreaves, M., M. J. McKenna, et al. (1998). "Muscle metabolites and performance during high-intensity, intermittent exercise." Journal of Applied Physiology 84(5): 1687-1691.
Harris, R. C., R. H. Edwards, et al. (1976). "The time course of phosphorylcreatine resynthesis during recovery of the quadriceps muscle in man." Pflugers Archives 367(2): 137-142.
Helander, I., H. Westerblad, et al. (2002). "Effects of glucose on contractile function, [Ca2+]i, and glycogen in isolated mouse skeletal muscle." American Journal of Physiolgoy: Cell Physiology 282(6): C1306-1312.
Higgins, T., G. A. Naughton, et al. (2009). "Effects of wearing compression garments on physiological and performance measures in a simulated game-specific circuit for netball." Journal of Science and Medicine in Sport 12(1): 223-226.
Hikida, R. S., R. S. Staron, et al. (1983). "Muscle fiber necrosis associated with human marathon runners." Journal of the Neurological Sciences 59(2): 185-203.
Hill, C. A., M. W. Thompson, et al. (2001). "Sarcoplasmic reticulum function and muscle contractile character following fatiguing exercise in humans." Journal of Physiology 531(Pt 3): 871-878.
Hodgkin, A. L. and P. Horowicz (1959). "The influence of potassium and chloride ions on the membrane potential of single muscle fibres." Journal of Phsyiology 148: 127-160.
Hodgkin, A. L. and A. F. Huxley (1952). "A quantitative description of membrane current and its application to conduction and excitation in nerve." Journal of Physiology 117(4): 500-544.
Hoffman, J. R., J. Kang, et al. (2005). "Biochemical and hormonal responses during an intercollegiate football season." Medicine and Science in Sports and Exercise 37(7): 1237-1241.
Hoffman, J. R., C. M. Maresh, et al. (2002). "Performance, biochemical, and endocrine changes during a competitive football game." Medicine and Science in Sports and Exercise 34(11): 1845-1853.
213

Hoffman, J. R., V. Nusse, et al. (2003). "The effect of an intercollegiate soccer game on maximal power performance." Canadian Journal of Applied Physiology 28(6): 807-817.
Hopkins, W. G. (2000). "Measures of reliability in sports medicine and science." Sports Medicine (Auckland) 30(1): 1-15.
Hopkins, W. G. (2004). "How to Interpret Changes in an Athletic Performance Test." Sportscience (Sportsci.org) 8: 1-7.
Hopkins, W. G. (2006a). "Estimating Sample Size for Magnitude-Based Inferences." Sport Science 10: 63-70.
Hopkins, W. G. (2006b). "Spreadsheets for analysis of controlled trials with adjustment for a predictor." Sportscience 10(sportsci.org/2006/wghcontrial.htm): 46-50.
Hopkins, W. G. (2011). "A New View of Statistics." Retrieved 15/06/2012, 2012, from http://www.sportsci.org/resource/stats/index.html.
Hopkins, W. G. (2012, Personal Communication). Email correspondance - Magnitude of effects.
Hori, N., R. U. Newton, et al. (2009). "Reliability of Performance Measurements Derived From Ground Reaction Force Data During Countermovement Jump and the Influence of Sampling Frequency." Journal of Strength & Conditioning Research 23(3): 874-882.
Hortobagyi, T., J. Houmard, et al. (1998). "Normal forces and myofibrillar disruption after repeated eccentric exercise." Journal of Applied Physiology 84(2): 492-498.
Howatson, G. and A. Milak (2009). "Exercise-induced muscle damage following a bout of sport specific repeated sprints." Journal of Strength and Conditioning Research 23(8): 2419-2424.
Hsieh, H. F. and F. P. Lee (2005). "Graduated compression stockings as prophylaxis for flight-related venous thrombosis: systematic literature review." Journal Of Advanced Nursing 51(1): 83-98.
Hurme, T., H. Kalimo, et al. (1991). "Healing of skeletal muscle injury: an ultrastructural and immunohistochemical study." Medicine and Science in Sports and Exercise 23(7): 801-810.
Ildefonse, M. and G. Roy (1972). "Kinetic properties of the sodium current in striated muscle fibres on the basis of the Hodgkin-Huxley theory." Journal of Physiology 227(2): 419-431.
Impellizzeri, F. M. and N. A. Maffiuletti (2007). "Convergent evidence for construct validity of a 7-point likert scale of lower limb muscle soreness." Clinical Journal of Sport Medicine 17(6): 494-496.
Ingebrigtsen, J., M. Bendiksen, et al. (2012). "Yo-Yo IR2 testing of elite and sub-elite soccer players: Performance, heart rate response and correlations to other interval tests." Journal of Sports Sciences.
Ingram, J., B. Dawson, et al. (2009). "Effect of water immersion methods on post-exercise recovery from simulated team sport exercise." Journal of Science and Medicine in Sport 12(3): 417-421.
Ispirlidis, I., I. G. Fatouros, et al. (2008). "Time-course of changes in inflammatory and performance responses following a soccer game." Clinical Journal of Sports Medicine 18(5): 423-431.
Jacobs, I., N. Westlin, et al. (1982). "Muscle glycogen and diet in elite soccer players." European Journal of Applied Physiological Occupational Physiology 48(3): 297-302.
Jakeman, J. R., C. Byrne, et al. (2010a). "Efficacy of lower limb compression and combined treatment of manual massage and lower limb compression on
214

symptoms of exercise-induced muscle damage in women." Journal of Strength and Conditioning Research 24(11): 3157-3165.
Jakeman, J. R., C. Byrne, et al. (2010b). "Lower limb compression garment improves recovery from exercise-induced muscle damage in young, active females." European Journal of Applied Physiology 109(6): 1137-1144.
Jennings, D., S. J. Cormack, et al. (2011). "GPS analysis of international field hockey tournament." International Journal of Sports Physiology and Performance ACCEPTED.
Johansson, K., E. Lie, et al. (1998). "A randomized study comparing manual lymph drainage with sequential pneumatic compression for treatment of postoperative arm lymphedema." Lymphology 31(2): 56-64.
Jones, D. A., D. J. Newham, et al. (1987). "Skeletal muscle stiffness and pain following eccentric exercise of the elbow flexors." Pain 30(2): 233-242.
Jones, D. A., D. J. Newham, et al. (1986). "Experimental human muscle damage: morphological changes in relation to other indices of damage." Journal of Physiology 375: 435-448.
Jones, D. A., D. J. Newham, et al. (1989). "Mechanical influences on long-lasting human muscle fatigue and delayed-onset pain." Journal of Physiology 412: 415-427.
Jonker, M., E. de Boer, et al. (2001). "The oedema-protective effect of Lycra support stockings." Dermatology 203(4): 294-298.
Juel, C. (1986). "Potassium and sodium shifts during in vitro isometric muscle contraction, and the time course of the ion-gradient recovery." Pflugers Archives 406(5): 458-463.
Juel, C. (1988). "Muscle action potential propagation velocity changes during activity." Muscle Nerve 11(7): 714-719.
Juel, C., H. Pilegaard, et al. (2000). "Interstitial K(+) in human skeletal muscle during and after dynamic graded exercise determined by microdialysis." American Journal of Physiology: Regulatory, Integrative and Comparative Physiology 278(2): R400-406.
Kabbara, A. A. and D. G. Allen (1999). "The role of calcium stores in fatigue of isolated single muscle fibres from the cane toad." Journal of Physiology 519 Pt 1: 169-176.
Karelis, A. D., F. Peronnet, et al. (2005). "Resting membrane potential of rat plantaris muscle fibers after prolonged indirect stimulation in situ: effect of glucose infusion." Canadian Journal of Applied Physiology 30(1): 105-112.
Kentta, G. and P. Hassmen (1998). "Overtraining and recovery. A conceptual model." Sports Medicine (Auckland, N.Z.) 26(1): 1-16.
Kernell, D. (1969). "Synaptic conductance changes and the repetitive impulse discharge of spinal motoneurones." Brain Research 15(1): 291-294.
Kingsley, M. I., L. P. Kilduff, et al. (2006). "Phosphatidylserine supplementation and recovery following downhill running." Medicine and Science in Sports and Exercise 38(9): 1617-1625.
Kirsch, J. F., G. Eichele, et al. (1984). "Mechanism of action of aspartate aminotransferase proposed on the basis of its spatial structure." Journal of Molecular Biology 174(3): 497-525.
Kraemer, W., J. Bush, et al. (2001a). "Continuous compression as an effective therapeutic intervention in treating eccentric-exercise-induced muscle soreness." Journal of Sport Rehabilitation 10(1): 11-23.
215

Kraemer, W. J., J. A. Bush, et al. (1996). "Influence of Compression Garments on Vertical Jump Performance in NCAA Division I Volleyball Players." The Journal of Strength & Conditioning Research 10(3): 180-183.
Kraemer, W. J., J. A. Bush, et al. (1998a). "Influence of a compression garment on repetitive power output production before and after different types of muscle fatigue." Sports Medicine, Training & Rehabilitation 8(2): 163-184.
Kraemer, W. J., J. A. Bush, et al. (1998b). "Compression garments: influence on muscle fatigue." Journal of Strength and Conditioning Research 12(4): 211-215.
Kraemer, W. J., J. A. Bush, et al. (2001b). "Influence of Compression Therapy on Symptoms Following Soft Tissue Injury from Maximal Eccentric Exercise." Journal of Orthopaedic and Sports Physical Therapy 31(6): 282-290.
Kraemer, W. J., S. D. Flanagan, et al. (2010). "Effects of a whole body compression garment on markers of recovery after a heavy resistance workout in men and women." Journal of Strength and Conditioning Research 24(3): 804-814.
Kraemer, W. J., D. N. French, et al. (2004). "Compression in the treatment of acute muscle injuries in sport." International Sports Medicine Journal 5(3): 200-208.
Kraemer, W. J., B. A. Spiering, et al. (2009). "Recovery from a national collegiate athletic association division I football game: muscle damage and hormonal status." Journal of Strength and Conditioning Research 23(1): 2-10.
Kraemer, W. J., J. S. Volek, et al. (2000). "Influence of compression hosiery on physiological responses to standing fatigue in women." Medicine and Science in Sports and Exercise 32(11): 1849-1858.
Krause, S. M. (1991). "Effect of increased free [Mg2+]i with myocardial stunning on sarcoplasmic reticulum Ca(2+)-ATPase activity." American Journal of Physiolgoy 261(1 Pt 2): H229-235.
Krustrup, P., M. Mohr, et al. (2006). "Muscle and blood metabolites during a soccer game: implications for sprint performance." Medicine and Science in Sports and Exercise 38(6): 1165-1174.
Kuipers, H. (1994). "Exercise-induced muscle damage." International Journal of Sports Medicine 15(3): 132-135.
Kyriakides, C., W. Austen, Jr., et al. (1999). "Skeletal muscle reperfusion injury is mediated by neutrophils and the complement membrane attack complex." American Journal of Physiology 277(6 Pt 1): C1263-1268.
Kyrolainen, H., T. E. Takala, et al. (1998). "Muscle damage induced by stretch-shortening cycle exercise." Medicine and Science in Sports and Exercise 30(3): 415-420.
Lamb, G. D. and D. G. Stephenson (1991). "Effect of Mg2+ on the control of Ca2+ release in skeletal muscle fibres of the toad." Journal of Physiology 434: 507-528.
Lamb, G. D. and D. G. Stephenson (1994). "Effects of intracellular pH and [Mg2+] on excitation-contraction coupling in skeletal muscle fibres of the rat." Journal of Physiology 478 ( Pt 2): 331-339.
Lannergren, J. and H. Westerblad (1986). "Force and membrane potential during and after fatiguing, continuous high-frequency stimulation of single Xenopus muscle fibres." Acta Physiologica Scandinavica 128(3): 359-368.
Laver, D. R., E. R. O'Neill, et al. (2004). "Luminal Ca2+-regulated Mg2+ inhibition of skeletal RyRs reconstituted as isolated channels or coupled clusters." The Journal of General Physiology 124(6): 741-758.
216
Lawrence, D. and V. Kakkar (1980). "Graduated, static, external compression of the lower limb: a physiological assessment." The British Journal Of Surgery 67(2): 119-121.
Le Pera, D., T. Graven-Nielsen, et al. (2001). "Inhibition of motor system excitability at cortical and spinal level by tonic muscle pain." Clinical Neurophysiology 112(9): 1633-1641.
Leatt, P. B. and I. Jacobs (1989). "Effect of glucose polymer ingestion on glycogen depletion during a soccer match." Canadian Journal of Sport Sciences 14(2): 112-116.
Lee, J., A. H. Goldfarb, et al. (2002). "Eccentric exercise effect on blood oxidative-stress markers and delayed onset of muscle soreness." Medicine and Science in Sports and Exercise 34(3): 443-448.
Lehmann, M., C. Foster, et al. (1993). "Overtraining in endurance athletes: a brief review." Medicine and Science in Sports and Exercise 25(7): 854-862.
Lentz, M. and J. F. Nielsen (2002). "Post-exercise facilitation and depression of M wave and motor evoked potentials in healthy subjects." Clinical Neurophysiology 113(7): 1092-1098.
Leppik, J. A., R. J. Aughey, et al. (2004). "Prolonged exercise to fatigue in humans impairs skeletal muscle Na+-K+-ATPase activity, sarcoplasmic reticulum Ca2+ release, and Ca2+ uptake." Journal of Applied Physiology 97(4): 1414-1423.
Leyssens, A., A. V. Nowicky, et al. (1996). "The relationship between mitochondrial state, ATP hydrolysis, [Mg2+]i and [Ca2+]i studied in isolated rat cardiomyocytes." Journal of Physiology 496 ( Pt 1): 111-128.
Lieber, R. L. and J. Friden (1999). "Mechanisms of muscle injury after eccentric contraction." Journal of Science and Medicine in Sport 2(3): 253-265.
Lieber, R. L., L. E. Thornell, et al. (1996). "Muscle cytoskeletal disruption occurs within the first 15 min of cyclic eccentric contraction." Journal of Applied Physiology 80(1): 278-284.
Light, P. E., A. S. Comtois, et al. (1994). "The effect of glibenclamide on frog skeletal muscle: evidence for K+ATP channel activation during fatigue." Journal of Physiology 475(3): 495-507.
Linnitt, N. and R. Davies (2007a). "Fundamentals of compression in the management of lymphoedema." British Journal of Nursing 16(10): 588-592.
Linnitt, N. and R. Davies (2007b). "Fundamentals of compression in the management of lymphoedema." British Journal of Nursing (BJN) 16(10): 588-592.
Lippi, G., F. Schena, et al. (2008). "Acute variation of biochemical markers of muscle damage following a 21-km half-marathon run." The Scandinavian Journal of Clinical & Laboratory Investigation.
Loader, J., P. G. Montgomery, et al. (2012). "Classifying Training Drills Based on Movement Demands in Australian Football." International Journal of Sports Science & Coaching 7(1): 57-68.
Macefield, G., K. E. Hagbarth, et al. (1991). "Decline in spindle support to alpha-motoneurones during sustained voluntary contractions." Journal of Physiology 440: 497-512.
MacIntyre, D. L., W. D. Reid, et al. (1996). "Presence of WBC, decreased strength, and delayed soreness in muscle after eccentric exercise." Journal of Applied Physiology 80(3): 1006-1013.
MacIntyre, D. L., W. D. Reid, et al. (1995). "Delayed muscle soreness. The inflammatory response to muscle injury and its clinical implications." Sports Medicine (Auckland, N.Z.) 20(1): 24-40.
217

Markovic, G., D. Dizdar, et al. (2004). "Reliability and factorial validity of squat and countermovement jump tests." Journal of Strength and Conditioning Research 18(3): 551-555.
Martyn, D. A. and A. M. Gordon (1992). "Force and stiffness in glycerinated rabbit psoas fibers. Effects of calcium and elevated phosphate." The Journal of General Physiology 99(5): 795-816.
Mayberry, J. C., G. L. Moneta, et al. (1991). "The influence of elastic compression stockings on deep venous hemodynamics." Journal of Vascular Surgery 13: 91-100.
McClure, S. M., J. Li, et al. (2004). "Neural correlates of behavioral preference for culturally familiar drinks." Neuron 44(2): 379-387.
McComas, A. J. (1996). Skeletal Muscle: Form and Function. Champaign, IL, Human Kinetics Publishers.
McCully, K. K. and J. A. Faulkner (1985). "Injury to skeletal muscle fibers of mice following lengthening contractions." Journal of Applied Physiology 59(1): 119-126.
McKenna, M. J., J. Bangsbo, et al. (2008). "Muscle K+, Na+, and Cl disturbances and Na+-K+ pump inactivation: implications for fatigue." Journal of Applied Physiology 104(1): 288-295.
McLean, B. D., A. J. Coutts, et al. (2010). "Neuromuscular, endocrine, and perceptual fatigue responses during different length between-match microcycles in professional rugby league players." International Journal of Sports Physiology and Performance 5(3): 367-383.
McMillan, A. B., D. Shi, et al. (2011). "Diffusion tensor MRI to assess damage in healthy and dystrophic skeletal muscle after lengthening contractions." Journal of Biomedical Biotechnology 2011: 970726.
Meeusen, R., M. F. Piacentini, et al. (2004). "Hormonal responses in athletes: the use of a two bout exercise protocol to detect subtle differences in (over)training status." European Journal of Applied Physiology 91(2-3): 140-146.
Meissner, G., E. Darling, et al. (1986). "Kinetics of rapid Ca2+ release by sarcoplasmic reticulum. Effects of Ca2+, Mg2+, and adenine nucleotides." Biochemistry 25(1): 236-244.
Millar, N. C. and E. Homsher (1990). "The effect of phosphate and calcium on force generation in glycerinated rabbit skeletal muscle fibers. A steady-state and transient kinetic study." Journal of Biological Chemistry 265(33): 20234-20240.
Mohr, M., P. Krustrup, et al. (2003). "Match performance of high-standard soccer players with special reference to development of fatigue." Journal Of Sports Sciences 21(7): 519-528.
Moir, G., C. Button, et al. (2004). "Influence of familiarization on the reliability of vertical jump and acceleration sprinting performance in physically active men." Journal of Strength and Conditioning Research 18(2): 276-280.
Montgomery, P. G. and W. G. Hopkins (2012). "The Effects of Game and Training Loads on Perceptual Responses of Muscle Soreness in Australian Football." International Journal of Sports Physiology and Performance.
Montgomery, P. G., D. B. Pyne, et al. (2008a). "Muscle damage, inflammation, and recovery interventions during a 3-day basketball tournament." European Journal of Sport Science 8(5): 241 - 250.
Montgomery, P. G., D. B. Pyne, et al. (2008b). "The effect of recovery strategies on physical performance and cumulative fatigue in competitive basketball." Journal of Sports Science: 1-11.
218

Mooney, M., S. Cormack, et al. (2012). "Impact of Neuromuscular Fatigue on Match Exercise Intensity and Performance in Elite Australian Football." Journal of Strength and Conditioning Research
Moreira, A., M. R. McGuigan, et al. (2012). "Monitoring internal load parameters during simulated and official basketball matches." Journal of Strength and Conditioning Research 26(3): 861-866.
Morris, R. J. and J. P. Woodcock (2004). "Evidence-based compression: prevention of stasis and deep vein thrombosis." Annals of Surgery 239(2): 162-171.
Moss, R. L. and D. P. Fitzsimons (2002). "Frank-Starling relationship: long on importance, short on mechanism." Circulation Research 90(1): 11-13.
Nagaoka, R., S. Yamashita, et al. (1994). "Intracellular Na+ and K+ shifts induced by contractile activities of rat skeletal muscles." Comparative Biochemistry and Physiology 109(4): 957-965.
Neubauer, O., D. Konig, et al. (2008). "Recovery after an Ironman triathlon: sustained inflammatory responses and muscular stress." European Journal of Applied Physiology 104(3): 417-426.
Newby, R. W. and S. Simpson (1994). "Basketball Performance as a Function of Scores on Profile of Mood States." Perceptual and Motor Skills 78(3c): 1142-1142.
Newby, R. W. and S. Simpson (1996). "Correlations Between Mood Scores and Volleyball Performance." Perceptual and Motor Skills 83(3f): 1153-1154.
Newham, D. J. (1988). "The consequences of eccentric contractions and their relationship to delayed onset muscle pain." European Journal of Applied Physiology 57: 353-359.
Newham, D. J., D. A. Jones, et al. (1987). "Repeated high-force eccentric exercise: effects on muscle pain and damage." Journal of Applied Physiology 63(4): 1381-1386.
Newham, D. J., G. McPhail, et al. (1983). "Ultrastructural changes after concentric and eccentric contractions of human muscle." Journal of Neurological Science 61(1): 109-122.
Newham, D. J., K. R. Mills, et al. (1983). "Pain and fatigue after concentric and eccentric muscle contractions." Clinical Science 64(1): 55-62.
Nicholas, C. W., F. E. Nuttall, et al. (2000). "The Loughborough Intermittent Shuttle Test: a field test that simulates the activity pattern of soccer." Journal of Sports Sciences 18(2): 97-104.
Nicol, C., P. V. Komi, et al. (1996). "Reduced stretch-reflex sensitivity after exhausting stretch-shortening cycle exercise." European Journal of Applied Physiology and Occupational Physiology 72(5-6): 401-409.
Nielsen, J. J., M. Mohr, et al. (2004). "Effects of high-intensity intermittent training on potassium kinetics and performance in human skeletal muscle." Journal of Physiology 554(Pt 3): 857-870.
Nosaka, K. and P. M. Clarkson (1996). "Variability in serum creatine kinase response after eccentric exercise of the elbow flexors." International Journal of Sports Medicine 17(2): 120-127.
Nosaka, K., P. M. Clarkson, et al. (1991). "Time course of muscle adaptation after high force eccentric exercise." European Journal of Applied Physiology and Occupational Physiology 63(1): 70-76.
Nosaka, K. and M. Newton (2002). "Repeated eccentric exercise bouts do not exacerbate muscle damage and repair." Journal of Strength and Conditioning Research 16(1): 117-122.
219

Nosaka, K., M. Newton, et al. (2002). "Delayed-onset muscle soreness does not reflect the magnitude of eccentric exercise-induced muscle damage." Scandinavian Journal Of Medicine & Science In Sports 12(6): 337-346.
Nosaka, K., M. J. Newton, et al. (2005). "Attenuation of protective effect against eccentric exercise-induced muscle damage." Canadian Journal of Applied Physiology 30(5): 529-542.
Nuzzo, J. L., J. M. McBride, et al. (2008). "Relationship between countermovement jump performance and multijoint isometric and dynamic tests of strength." Journal of Strength & Conditioning Research 22(3): 699-707.
O'Connor, P. J. and D. B. Cook (1999). "Exercise and pain: the neurobiology, measurement, and laboratory study of pain in relation to exercise in humans." Exercise and Sport Science Reviews 27: 119-166.
O'Reilly, K. P., M. J. Warhol, et al. (1987). "Eccentric exercise-induced muscle damage impairs muscle glycogen repletion." Journal of Applied Physiology 63(1): 252-256.
Okamoto, K., W. Wang, et al. (2001). "ATP from glycolysis is required for normal sodium homeostasis in resting fast-twitch rodent skeletal muscle." American Journal of Physiology: Endocrinology and Metabolism. 281(3): E479-488.
Oliver, J., N. Armstrong, et al. (2008). "Changes in jump performance and muscle activity following soccer-specific exercise." Journal of Sports Science 26(2): 141-148.
Ortenblad, N., J. Nielsen, et al. (2011). "Role of glycogen availability in sarcoplasmic reticulum Ca2+ kinetics in human skeletal muscle." Journal of Physiology 589(Pt 3): 711-725.
Owen, A. L., P. Wong del, et al. (2011). "Heart rate responses and technical comparison between small- vs. large-sided games in elite professional soccer." Journal of Strength and Conditioning Research 25(8): 2104-2110.
Owen, V. J., G. D. Lamb, et al. (1996). "Effect of low [ATP] on depolarization-induced Ca2+ release in skeletal muscle fibres of the toad." Journal of Physiology 493 ( Pt 2): 309-315.
Paschalis, V., Y. Koutedakis, et al. (2005). "The Effects of Muscle Damage on Running Economy in Healthy Males." International Journal of Sports Medicine 26: 827-831.
Pate, E. and R. Cooke (1989). "Addition of phosphate to active muscle fibers probes actomyosin states within the powerstroke." Pflugers Archives 414(1): 73-81.
Peake, J., K. Nosaka, et al. (2005). "Characterization of inflammatory responses to eccentric exercise in humans." Exerc Immunol Rev 11: 64-85.
Peake, J. M., K. Nosaka, et al. (2006). "Systemic inflammatory responses to maximal versus submaximal lengthening contractions of the elbow flexors." Exercise Immunology Review 12: 72-85.
Peake, J. M., K. Suzuki, et al. (2005). "Plasma cytokine changes in relation to exercise intensity and muscle damage." European Journal of Applied Physiology 95(5-6): 514-521.
Pearce, A. J., D. J. Kidgell, et al. (2009). "Wearing a sports compression garment on the performance of visuomotor tracking following eccentric exercise: a pilot study." Journal of Science and Medicine in Sport 12(4): 500-502.
Perlau, R., C. Frank, et al. (1995). "The Effect of Elastic Bandages on Human Knee Proprioception in the Uninjured Population." The American Journal of Sports Medicine 23(2): 251-255.
220

Petersen, A. C., K. T. Murphy, et al. (2005). "Depressed Na+-K+-ATPase activity in skeletal muscle at fatigue is correlated with increased Na+-K+-ATPase mRNA expression following intense exercise." American Journal of Physiology: Regulatory, Integrative and Comparative Physiology 289(1): 266-274.
Phillips, S. K., R. W. Wiseman, et al. (1993). "The effect of metabolic fuel on force production and resting inorganic phosphate levels in mouse skeletal muscle." Journal of Physiology 462: 135-146.
Plassmann, H., J. O'Doherty, et al. (2008). "Marketing actions can modulate neural representations of experienced pleasantness." Proceedings of the National Academy of Sciences 105(3): 1050-1054.
Pointon, M. and R. Duffield (2012). "Cold water immersion recovery after simulated collision sport exercise." Medicine and Science in Sports and Exercise 44(2): 206-216.
Posterino, G. S. and M. W. Fryer (1998 ). "Mechanisms underlying phosphate-induced failure of Ca2+ release in single skinned skeletal muscle fibres of the rat." Journal of Physiology 512(Pt 1): 97-108.
Racinais, S., A. Bringard, et al. (2008). "Modulation in voluntary neural drive in relation to muscle soreness." European Journal of Applied Physiology 102(4): 439-446.
Rampinini, E., A. J. Coutts, et al. (2007). "Variation in top level soccer match performance." International Journal of Sports Medicine 28(12): 1018-1024.
Rampinini, E., F. M. Impellizzeri, et al. (2009). "Technical performance during soccer matches of the Italian Serie A league: effect of fatigue and competitive level." Journal of Science and Medicine in Sport 12(1): 227-233.
Rawson, E. S., B. Gunn, et al. (2001). "The effects of creatine supplementation on exercise-induced muscle damage." Journal of Strength and Conditioning Research 15(2): 178-184.
Renaud, J. M. (1989). "The effect of lactate on intracellular pH and force recovery of fatigued sartorius muscles of the frog, Rana pipiens." Journal of Physiology 416: 31-47.
Renaud, J. M. and A. Comtois (1994). "The effect of K+ on the recovery of the twitch and tetanic force following fatigue in the sartorius muscle of the frog, Rana pipiens." Journal of Muscle Research and Cell Motility 15(4): 420-431.
Renaud, J. M. and P. Light (1992). "Effects of K+ on the twitch and tetanic contraction in the sartorius muscle of the frog, Rana pipiens. Implication for fatigue in vivo." Canadian Journal of Physiology and Pharmacology 70(9): 1236-1246.
Renaud, J. M. and G. W. Mainwood (1985). "The effects of pH on the kinetics of fatigue and recovery in frog sartorius muscle." Canadian Journal of Physiology and Pharmacology 63(11): 1435-1443.
Robertson, S. P., J. D. Johnson, et al. (1981). "The time-course of Ca2+ exchange with calmodulin, troponin, parvalbumin, and myosin in response to transient increases in Ca2+." Biophysical Journal 34(3): 559-569.
Rodenburg, J. B., P. R. Bar, et al. (1993). "Relations between muscle soreness and biochemical and functional outcomes of eccentric exercise." Journal of Applied Physiology 74(6): 2976-2983.
Rolls, E. T., F. Grabenhorst, et al. (2008). "Selective attention to affective value alters how the brain processes olfactory stimuli." Journal of Cognitive Neuroscience 20(10): 1815-1826.
Ronglan, L. T., T. Raastad, et al. (2006a). "Neuromuscular fatigue and recovery in elite female handball players." Scandinavian Journal of Medicine and Science in Sports 16(4).
221

Ronglan, L. T., T. Raastad, et al. (2006b). "Neuromuscular fatigue and recovery in elite female handball players." Scandinavian Journal of Medicine & Science in Sports 16(4).
Rowsell, G. J., A. J. Coutts, et al. (2011). "Effect of post-match cold-water immersion on subsequent match running performance in junior soccer players during tournament play." Journal of Sports Sciences 29(1): 1-6.
Ruff, R. L. (1999). "Effects of temperature on slow and fast inactivation of rat skeletal muscle Na(+) channels." American Journal of Physiolgoy 277(5 Pt 1): C937-947.
Ruff, R. L., L. Simoncini, et al. (1988). "Slow sodium channel inactivation in mammalian muscle: a possible role in regulating excitability." Muscle Nerve 11(5): 502-510.
Rusko, H. K. (1996). "New aspects of altitude training." The American Journal of Sports Medicine 24: S48-S52.
Sahlin, K., A. Katz, et al. (1990). "Tricarboxylic acid cycle intermediates in human muscle during prolonged exercise." American Journal of Physiolgoy 259(5 Pt 1): C834-841.
Samii, A., E. M. Wassermann, et al. (1996). "Characterization of postexercise facilitation and depression of motor evoked potentials to transcranial magnetic stimulation." Neurology 46(5): 1376-1382.
Sandrini, G., M. Serrao, et al. (2005). "The lower limb flexion reflex in humans." Progress in Neurobiology 77(6): 353-395.
Saxton, J. M., A. E. Donnelly, et al. (1994). "Indices of free-radical-mediated damage following maximum voluntary eccentric and concentric muscular work." European Journal Of Applied Physiology and Occupational Physiology 68(3): 189-193.
Sayers, S. P. and P. M. Clarkson (2003). "Short-term immobilization after eccentric exercise. Part II: creatine kinase and myoglobin." Medicine and Science in Sports and Exercise 35(5): 762-768.
Sayers, S. P. and M. J. Hubal (2008). Histological, Chemical, and Functional Manifestations of Muscle Damage. Skeletal Muscle Damage and Repair. P. M. Tiidus. Champaign, IL, Human Kinetics.
Schwane, J. A., S. R. Johnson, et al. (1983). "Delayed-onset muscular soreness and plasma CPK and LDH activities after downhill running." Medicine and Science in Sports and Exercise 15(1): 51-56.
Serpiello, F. R., M. J. McKenna, et al. (2011). "Performance and physiological responses to repeated-sprint exercise: a novel multiple-set approach." European Journal of Applied Physiology 111(4): 669-678.
Seymour, R. A. (1982). "The use of pain scales in assessing the efficacy of analgesics in post-operative dental pain." European Journal of Clinical Pharmacology 23(5): 441-444.
Sheppard, J. M., S. Cormack, et al. (2008). "Assessing the force-velocity characteristics of the leg extensors in well-trained athletes: the incremental load power profile." Journal of Strength and Conditioning Research 22(4): 1320-1326.
Sherman, W. M., L. E. Armstrong, et al. (1984). "Effect of a 42.2-km footrace and subsequent rest or exercise on muscular strength and work capacity." Journal of Applied Physiology 57(6): 1668-1673.
Silver, T., D. Fortenbaugh, et al. (2009). "Effects of the bench shirt on sagittal bar path." Journal of Strength and Conditioning Research 23(4): 1125-1128.
222

Sjogaard, G., R. P. Adams, et al. (1985). "Water and ion shifts in skeletal muscle of humans with intense dynamic knee extension." American Journal of Physiolgoy 248(2 Pt 2): R190-196.
Slinde, F., C. Suber, et al. (2008). "Test-Retest Reliability of Three Different Countermovement Jumping Tests." Journal of Strength & Conditioning Research 22(2): 640-644.
Smith, C., M. J. Kruger, et al. (2008). "The inflammatory response to skeletal muscle injury: illuminating complexities." Sports Medicine (Auckland, N.Z.) 38(11): 947-969.
Smith, L. L. and M. P. Miles (2000). Chapter 27: Exercise-Induced Muscle Injury and Inflammation. Exercise and Sport Science. W. E. Garrett and D. T. Kirkendall. Philadelphia, Lippincott Williams & Wilkins: 401-412.
Sorichter, S., J. Mair, et al. (2001). "Release of muscle proteins after downhill running in male and female subjects." Scandanavian Journal of Medicine and Science of Sports 11(1): 28-32.
Sorichter, S., B. Puschendorf, et al. (1999). "Skeletal muscle injury induced by eccentric muscle action: muscle proteins as markers of muscle fiber injury." Exercise Immunology Reviews 5: 5-21.
Spencer, M., D. Bishop, et al. (2005). "Physiological and metabolic responses of repeated-sprint activities:specific to field-based team sports." Sports Medicine (Auckland, N.Z.) 35(12): 1025-1044.
Spencer, M., C. Rechichi, et al. (2005). "Time-motion analysis of elite field hockey during several games in succession: a tournament scenario." Journal of Science and Medicine in Sport 8(4): 382-391.
Stauber, W. T. (1989). "Eccentric action of muscles: physiology, injury, and adaptation." Exercise and Sport Science Reviews 17: 157-185.
Stauber, W. T., P. M. Clarkson, et al. (1990). "Extracellular matrix disruption and pain after eccentric muscle action." Journal of Applied Physiology 69(3): 868-874.
Street, D., J. J. Nielsen, et al. (2005). "Metabolic alkalosis reduces exercise-induced acidosis and potassium accumulation in human skeletal muscle interstitium." Journal of Physiology 566(Pt 2): 481-489.
Suzuki, K., J. Peake, et al. (2006). "Changes in markers of muscle damage, inflammation and HSP70 after an Ironman Triathlon race." European Journal of Applied Physiology 98(6): 525-534.
Swedborg, I. (1984). "Effects of treatment with an elastic sleeve and intermittent pneumatic compression in post-mastectomy patients with lymphoedema of the arm." Scandinavian Journal of Rehabilitation Medicine 16(1): 35-41.
Takarada, Y. (2003). "Evaluation of muscle damage after a rugby match with special reference to tackle plays." British Journal of Sports Medicine 37(5): 416-419.
Taylor, J. L., G. M. Allen, et al. (2000). "Supraspinal fatigue during intermittent maximal voluntary contractions of the human elbow flexors." Journal of Applied Physiology 89: 305-313.
Tee, J. C., A. N. Bosch, et al. (2007). "Metabolic consequences of exercise-induced muscle damage." Sports Medicine (Auckland, N.Z.) 37(10): 827-836.
Thompson, D., C. W. Nicholas, et al. (1999). "Muscular soreness following prolonged intermittent high-intensity shuttle running." Journal of Sports Sciences 17(5): 387-395.
Tidball, J. G. (1995). "Inflammatory cell response to acute muscle injury." Medicine and Science in Sports and Exercise 27(7): 1022-1032.
223

Vaile, J., S. Halson, et al. (2008a). "Effect of hydrotherapy on recovery from fatigue." International Journal of Sports Medicine 29(7): 539-544.
Vaile, J., S. Halson, et al. (2008b). "Effect of hydrotherapy on the signs and symptoms of delayed onset muscle soreness." European Journal Of Applied Physiology 102: 447–455.
Vaile, J. M., N. D. Gill, et al. (2007). "The effect of contrast water therapy on symptoms of delayed onset muscle soreness." Journal of Strength and Conditioning Research 21(3): 697-702.
Verin, E., E. Ross, et al. (2004). "Effects of exhaustive incremental treadmill exercise on diaphragm and quadriceps motor potentials evoked by transcranial magnetic stimulation." Journal of Applied Physiology 96: 253-259.
Viru, A. (1984). "The mechanism of training effects: a hypothesis." International Journal of Sports Medicine 5(5): 219-227.
Vizcaya, F. J., O. Viana, et al. (2009). "Could the deep squat jump predict weightlifting performance?" Journal of Strength and Conditioning Research 23(3): 729-734.
Warhol, M. J., A. J. Siegel, et al. (1985). "Skeletal muscle injury and repair in marathon runners after competition." The American Journal of Pathology 118(2): 331-339.
Warren, G. L., D. A. Lowe, et al. (1999). "Measurement tools used in the study of eccentric contraction-induced injury." Sports Medicine (Auckland, N.Z.) 27(1): 43-59.
Webb, N., N. Harris, et al. (2012). "The Relative Efficacy of Three Recovery Modalities Following Professional Rugby League Matches." Journal of Strength and Conditining Research.
Westerblad, H. and D. G. Allen (1992). "Myoplasmic free Mg2+ concentration during repetitive stimulation of single fibres from mouse skeletal muscle." Journal of Physiology 453: 413-434.
Westerblad, H. and D. G. Allen (1996). "The effects of intracellular injections of phosphate on intracellular calcium and force in single fibres of mouse skeletal muscle." Pflugers Archives 431(6): 964-970.
Westerblad, H. and J. Lannergren (1986). "Force and membrane potential during and after fatiguing, intermittent tetanic stimulation of single Xenopus muscle fibres." Acta Physiologica Scandinavica 128(3): 369-378.
Wewers, M. E. and N. K. Lowe (1990). "A critical review of visual analogue scales in the measurement of clinical phenomena." Research in Nursing and Health 13(4): 227-236.
Widrick, J. J., D. L. Costill, et al. (1992). "Time course of glycogen accumulation after eccentric exercise." Journal of Applied Physiology 72(5): 1999-2004.
Wilcock, I., J. Cronin, et al. (2006). "Physiological Response to Water Immersion: A Method for Sport Recovery?" Sports Medicine 36(9).
Willer, J. C. (1977). "Comparative study of perceived pain and nociceptive flexion reflex in man." Pain 3(1): 69-80.
Williams, K. R. (1985). "Biomechanics of running." Exercise and Sport Science Reviews 13(389-441).
Wisbey, B., P. G. Montgomery, et al. (2009). "Quantifying movement demands of AFL football using GPS tracking." Journal of Science and Medicine in Sport.
Yasuhara, H., H. Shigematsu, et al. (1996). "A study of the advantages of elastic stockings for leg lymphedema." International Angiology 15(3): 272-277.
Yensen, C., W. Matar, et al. (2002). "K+-induced twitch potentiation is not due to longer action potential." American Journal of Physiolgoy: Cell Physiology 283(1): C169-177.
224

Yonemura, K. (1967). "Resting and action potentials in red and white muscles of the rat." The Japanese Journal of Physiology 17(6): 708-719.
Yoshida, T. (2002). "The rate of phosphocreatine hydrolysis and resynthesis in exercising muscle in humans using 31P-MRS." Journal of Physiological Anthropology and Applied Human Science 21(5): 247-255.
Young, W. B., J. Hepner, et al. (2012). "Movement demands in Australian rules football as indicators of muscle damage." Journal of Strength and Conditioning Research 26(2): 492-496.
Zehnder, M., J. Rico-Sanz, et al. (2001). "Resynthesis of muscle glycogen after soccer specific performance examined by 13C-magnetic resonance spectroscopy in elite players." European Journal of Applied Physiology 84(5): 443-447.
Zuliani, U., A. Bonetti, et al. (1985). "Effect of boxing on some metabolic indices of muscular contraction." International Journal of Sports Medicine 6: 234-236.
225