reconstruction of the earth model and discovery of the
TRANSCRIPT

GEOPHYSICS:
Reconstruction of the Earth Model and Discovery of the Interior Dark Matter
HSIEN-JUNG HO
Newidea Research Center
Web site:http://newidea.org.tw
E-mail:[email protected]
10 Fl, No. 110-6, Jie-Shou N Road, Changhua, 50060 Taiwan.
Abstract Based on the recommendations of several geophysicists and a confirmed
topography of the core-mantle boundary in excess of 10 km height, are constructed new
earth model has been developed. According to this model, the chemical composition
between the lower mantle and the outer core, are similar to each other and the density
distributions of both are continuous at the core-mantle boundary. As a result of the
study, we can infer that the solid rock in the lower mantle and the liquid molten rock or
magma in the outer core change states interactively. In the F transition zone of the outer
core, some elements and the components undergo oxidation- reduction reactions with
each other and separate due to the effects of gravity. The abundant iron oxides in the
outer core are partially reduced to iron, which alloys with certain amounts of nickel and
also combines with a great amount of oxides to settle down in the inner core and solidify.
The great amount of the heat produced due to the chemical reaction in the F zone and
solidification at the inner core boundary becomes the geodynamic of a large convection
cell, a circulation of magma and solid or molten rock migrating up to the crust and down
to the F zone. Using a simplification method to calculate the data of the new earth model,
the earth's mass and moment of inertia are found only to be 5121.82×1024 g and
76126.841×1040 g.cm2. The physics conceptions of dark matter and sing theory are
introduced to solve the problems of the missing mass and the insufficiency of moment

of inertia. Finally a dark planet inside the earth has been figured out, which has a radius
of 3700.375 km and a mass of 852.38×1024 g about 1.33 times that of Mars.
Key Words: Earth model, Density jump, Convection cell, Chandler wobble, Dark
matter, Solar-neutrino, Ten-dimensional theory.
Ⅰ. Introduction
When stars at the outside edge of a galaxy are orbiting at high speed, the total mass
of the galaxy, whose gravity keeps stars from escaping, can be estimated from the mass
of the stars and its speed of rotation. The total mass of stars in a galaxy, which can be
estimated by observing the galaxy with an astronomical telescope, is less than 10% of
this total mass of the galaxy estimated from the orbiting stars. The phenomenon appears
throughout the universe. Unobservable matter, amounted to more than 90 % mass of
the entire universe, is called dark matter, which can only be detected by its gravitational
influence on visible matter. Almost all astronomers agree on the existence of dark
matter, however, after a twenty-year search, they have not found any evidence of it. So,
dark matter, the densest matter in the universe, is a major problem, which still has no
solution. The best approach to dark matter research is to begin with the planet on which
we live.
In the current earth model utilized in seismological investigations, such as body-
wave travel times, surface-wave dispersion and free oscillation periods for researching
the chemical composition and the density distribution of the earth, the portions of the
crust and the upper mantle have been analyzed with satisfactory accuracy. Regarding
the lower mantle and the core portion, however, there remain number questions to be
answered. The mantle and the core are not in chemical equilibrium and the fine structure
of the core-mantle boundary (CMB) is not well understood. Although some hypotheses
such as the existence of a D" transition zone in the lower mantle and iron combined
with oxygen as the primary alloying constituent are suggested and a lot of advances of
this research have come out, but there are also some discrepancies in the interior of the
earth [Creager & Jordan, 1986; Morelli & Dziewonski, 1987]. Furthermore, there is no
conclusive evidence that the inner core is in thermodynamic equilibrium with the outer
core. The main problem is a lack of phase equilibrium data for plausible core
compositions at the appropriate conditions, added to the fact that seismological
observations do not yet offer a decisive constraint on the difference in composition
between the inner and outer core [Jangles, 1990]. Based on the found conceptions in

the deep interior, some reconstructed new earth models should be figured out by
applying geophysics to reasonably analyze the interior constitution, composition,
temperature and pressure of the earth. According to the trial curves of density
distribution of the new earth models, the earth's mass and moment of inertia are
calculated from it by a simplification method in order to match the real earth's figure.
The differences in quantity between the actual observed values and the values
calculated from these trial curves are the missing values of the mass and the moment of
inertia of the earth. These missing values belong to dark matter in view of the
astrophysics.
Based on contemporary physics ─ Superstring Theory, which has the
characteristics of ten-dimensional space-time and the Super symmetry of E8×E8, the
radius and the density of dark matter should be calculated from a combination of
gravitational influences of the earth and the missing mass through geophysics. Finally
the combined data of the earth and dark matter are compared with that of the
Preliminary Reference Earth Model (PREM) [Dziewonski & Anderson, 1981] to
theoretically confirm whether a dark planet exists.
Ⅱ. The Interior Constitution of the Earth With regard to the earth's interior, the constitution of the deep interior is uncertain
with some difficulties. In order to conduct further investigation, the PREM is taken as
the current earth model in this paper (fig.1).
Fig. 1 The data of PREM:ρ:density;V:velocity.

At the CMB of this model, the solid portion of the lowermost mantle has a density
of 5.57 g/cm3, which jumps to 9.90 g/cm3 in the liquid portion of the top core, a jump
of 77.74 %. According to the physiochemical data, the average density of solid matter
decreases by about 10 % when it melts into liquid state in the atmosphere, however, in
the PREM the density jumps significantly at the CMB. All investigations cannot
confirm the data directly. So, research about the interior constitution of the earth is
needed, especially at the CMB. There are two chief factors relating to the large density
jump at the CMB:
A. The relative equations of seismic body wave velocity and density are guided by
elastic mechanics:
Vp = [(λ + 2μ)/ρ]1/2 (1)
Vs = (μ/ρ) 1/2 (2)
And the Adams-Williamson equation:
dρ/dR = – GMρ/R2 [Vp2- (4/3) Vs2] (3)
The outer part of the core is in a liquid state. Below the CMB, Vp suddenly drops
to a very low velocity and Vs and μ both drop to 0. So, from the first two equations
below the CMB the density will jump highly. Since the gravity of the earth places
considerable pressure on the core, the resultant pressure exceeds the elasticity range of
molten rock or magma; therefore, the first two equations are not suitable for evaluating
the core density. Bullen used equation (3) to investigate the moment of inertia of the
core alone, and found it (0.57Mr2) to exceed that of a uniform sphere (0.4Mr2)
[Bullen,1940]. So, equation (3) was rejected. Then Birch added a term (-αρτ) to the
right of the equation in order to revise it [Birch, 1952], however, the discontinuity in
density at the core boundary cannot be determined directly from the revised equation.
In addition, the two soft layers in the upper part of the mantle are generally consistent
with low wave velocity regions. Solomon proposed that the low wave velocity region,
partial melted region, is essentially due to small amounts of liquid between granules
[Solomon, 1972]. The density of the soft layer will not increase sharply by decreasing
the velocity of seismic waves. For the same reason, wave velocity decreasing below the
CMB is due to the liquid state of the outer core, a physical phenomenon of the liquid
state, and is not due to a large density jump.
B. Based on the known values of the earth's mass and moment of inertia, there are
the great amounts of rest values deducting the certain quantities of the portion in the
crust and in the mantle. In order to match it, the ordinary way is to set a high density

distribution in the core and also a high density jump at the CMB. It is unnecessary to
consider the first factor, but the second one is considered as a matter of course within
the domain of current science. If the second factor is not initially taken into
consideration, a different conclusion should be drawn from the four statements in the
topic of the CMB as follows.
1. Ramsey and Lyttleton have challenged the concept of an iron core, suggesting
that under high temperature and pressure at the CMB the mantle silicates undergo phase
changes, a solid phase changing into a liquid phase in the top core, to produce the
material of high density, low melting point and electrical conductivity. Ramsey's
hypothesis is still accepted by a few geophysicists for several reasons [Ramsey, 1948;
Lyttleton, 1973].
2. Knopoff showed that cross a phase transition near the surface, one can predict
that the bulk modulus K increases by the increasing of the density ρ; in such a way, the
ratio K / (ρ7/3)is kept constant. From the models, the bulk modulus remains essentially
unchanged across the CMB. It is difficult to account for a large density jump from about
5.57 g/cm3 to about 9.90 g/cm3. On this basis, it is difficult to argue in favor of the
density distribution to be smoothly continuous at the CMB and a core of silicate
composition [Knopoff, 1965].
3. Buchbinder studied the variation in amplitude, with distance △, of the reflected
phase PcP. He found that the amplitude-distance curve, which displays a minimum at
△ = 32°, was not consistent with the computed reflection amplitudes for a solid-liquid
interface if the previously accepted values of Vp and density were employed. A model
proposed by Buchbinder, which is consistent with the observed amplitudes, provides
no discontinuity in density between the low mantle and the core. Such a model may
arise if there is considerable mixing of the core material with the lowermost mantle,
and vice versa [Buchbinder, 1968].
4. A topography of the core-mantle boundary, determined from the arrival times
of reflected and transmitted waves shows the results of an inversion indicating more
than 10 km of relief with 3000~6000 km scale lengths [Morelli & Dziewonski, 1987].
The depressed regions of the topography are dynamically supported by down welling
of cool mantle material [Gudmundsson et al., 1986; Lay, 1989]. Approximately 80 %
of the hot spots at the earth's surface are manifestations of plumes rooted in the deepest
part of the mantle near the CMB. In three-dimensional maps of the earth's interior the
topography of the core, different from that predicted by the hydrostatic equilibrium
theory, contains information important to geodynamic processes and the geomagnetic
secular variation.
Topography on the CMB is likely to result from convection in the overlying mantle
[Young & Lay, 1987]. But some agreements of that are probably determined by
processes in the core [Bloxham & Jackson, 1990]. This relief is dynamically supported
and provides coupling between the mantle and the core. It has been well known that
there are two convections circulated individually below the crust to the lower mantle
and in the outer core. Ruff and Anderson argue for dynamo action in the core
maintained by differential heating of the core by the mantle [Ruff & Anderson, 1980].
Bloxham and Gubbins argue that flow near the core surface may be controlled by lateral
temperature variations in the lowermost mantle, which are amply sufficient for this to
be a significant effect [Bloxham & Gubbins, 1987]. But the lateral temperature
variations near the outer core surface are very small, amounting to only a few mill
Kelvin, based on α = 5×10⁻⁶K-1 [Stevenson, 1987]. The lateral temperature variations
in the lowermost mantle are so small that it should not affect the flow near the core
surface. Studying the dynamics of the liquid core, the lateral heterogeneities below the
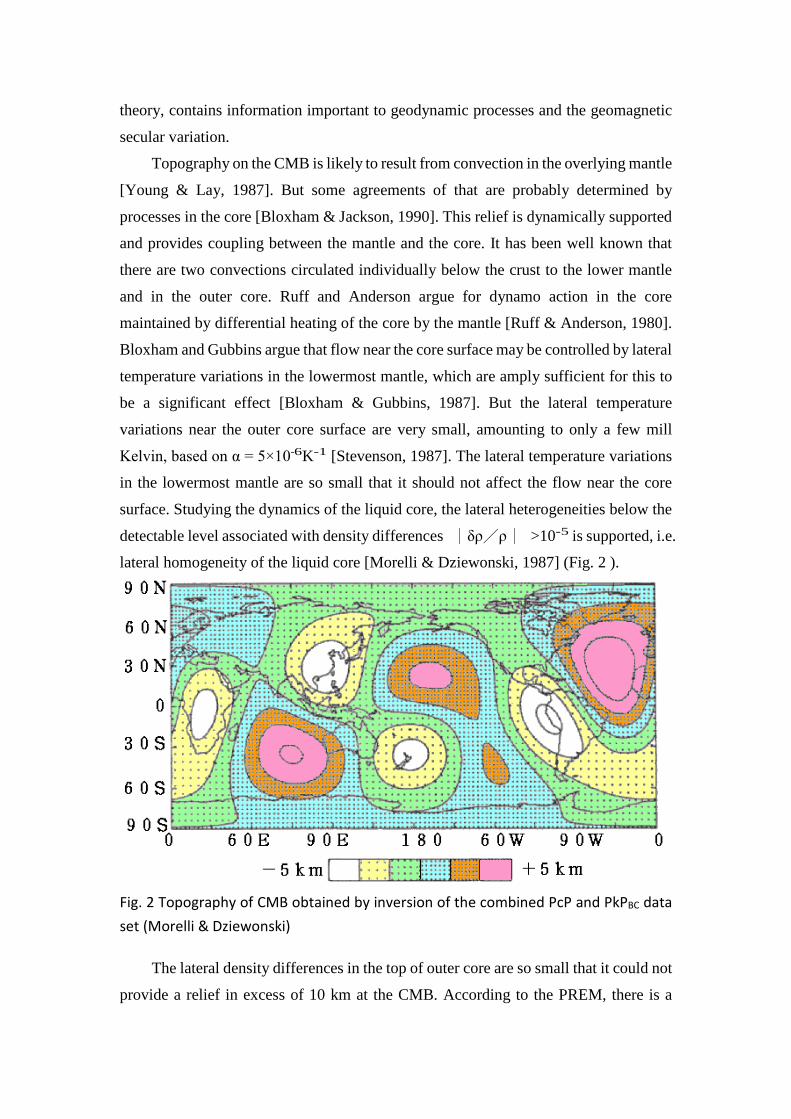
detectable level associated with density differences |δρ/ρ| >10-5 is supported, i.e.
lateral homogeneity of the liquid core [Morelli & Dziewonski, 1987] (Fig. 2 ).
Fig. 2 Topography of CMB obtained by inversion of the combined PcP and PkPBC data set (Morelli & Dziewonski)
The lateral density differences in the top of outer core are so small that it could not
provide a relief in excess of 10 km at the CMB. According to the PREM, there is a

density jump of 4.33 g/cm3 at the CMB. Neglecting the gravity anomaly, the lateral
difference in pressure at the lowermost level of the CMB is 4.246 kbar considering a
height of only 10 km. This pressure should reduce an increasing iron density of
6.323×10⁻³ g/cm3 under condition at the top of core, yielding a density difference of
δρ/ρ = 0.639×10⁻³, which is far beyond 10-5 supported by Morelli and Dziewonski
[Morelli & Dziewonski, 1987].
Since the D" transition zone, where sustains the chemical and the thermal
equilibriums between the mantle and the core, is rejected and the density differences
are smaller than 10-8, there is a significant suggestion that the density difference
between the liquid state and solid state at the CMB must be very small or nearly equal,
i.e. the hypothesis that the similar materials of a solid and a liquid change state each
other at the CMB to produce the core topography. Thus, based on the topography, the
idea of a spherical structure of the CMB has been challenged, so a new study is
necessary to determine the actual model.
Considering the previous statements that the slopes of the density curve are
continuous between the lower mantle and the outer core, and the states of solid and
liquid interactively change with each other at the CMB, topography may have a
mechanical rather than thermal effect on the flow [Gubbins & Richards, 1986]. On this
basis, it is obviously in terms of the geodynamic processes that only the vertical
interactions of material and the temperature between the lower mantle and the outer
core are the main cause. Based on this view to find the truth, we could figure out a
reasonable way that the migrating masses of rock or molten rock sink downward and
magma up well in plume rises upward in a great convection cell from the F transition
zone of the outer core to the crust. The flow of convection penetrates through the CMB
and that should affect the topography of the core. These inferences indicate that material
of the outer core mixes with that of the lower mantle, dominantly silicates. Therefore,
the PREM, in which the density curve jumps by 77.74 % at the CMB, should be an
unreasonable basis of inference.
At the inner-outer core boundary (ICB), a density jump of about1.8 g/cm3 was
calculated by Bolt and Qamar [Bolt & Qamar, 1970]. Bolt clearly observed both low
angle and steep incident reflections PKiKP of about one second period at the ICB. The
mean amplitude ratio PKiKP/PcP suggests a density jump of 1.4 g/cm3 there [Bolt,
1972]. Recently the density contrast at the ICB has been deduced from the amplitude
ratio PKiKP/PcP, and the density jump of 1.35-1.66 g/cm3 there has been obtained for

a quality factor in the outer core higher than 10,000 [Souriau & Souriau, 1989]. At the
ICB, a density jump of 0.59 g/cm3 in the PREM is too small to compare with the
previous data.
From this information, the density jump between the lighter liquid outer core and
the solid inner core seems to be too large to represent a simple volume change on
condensing as the same components change from a liquid state into a solid state. The
composition of the outer core is not likely to be the same as that of the inner core, since
a liquid in equilibrium with a solid phase in a multi-component system does not have
the same composition as the solid [Hall & Murthy, 1972]. In order to confirm a
reasonable constitution of the earth, the chemical composition of the core must be
further investigated.
Ⅲ. The chemical composition of the core The composition of the earth's core is one of the most important and elusive
problems in geophysics. From the necessity of the seismic wave velocities, cosmic
chemical abundances and the geomagnetic requirements, the current model of the core
is one almost filled with molten iron. Several geophysicists suggest that the main
component of the outer core is iron combined with a small amount of a light element
such as sulfur or oxygen. Ringwood proposed that oxygen, rather than sulfur, is the
major alloyed light element incorporating with FeO in the outer core [Ringwood,
1977]. However, there is no perfect explanation of any lighter element, which satisfies
the apparent chemical equilibrium between the core and the mantle.
In three-dimensional maps, tomographic models represent an instantaneous, low-
resolution image of a convecting system. Detailed interpretation knowledge of mineral
and rock properties that are, as yet, poorly known is required. A complex set of
constraints on the possible modes of convection in the earth’s interior has not yet been
worked out; this will require numerical modeling of convection in three dimensions.
Thus the interpretation of the geographical information from seismology in terms of
geodynamical processes is a matter of considerable complexity [Woodhouse &
Dziewonski, 1989]. The topography on the CMB can be sustained only by dynamic
processes, and these processes must be crucially understood.
According to the inference above, the main components of the lower mantle and
the outer core are similar. The main component of the outer core is not liquid iron
alloying with iron oxides, but silicates, similar to the main component of the lower

mantle. Based on mineralogy, the main mineral of the mantle is pyrolite, a compound
of silicates, and the main component of the outer core is also pyrolite but only in a liquid
state. Under the same conditions, the higher the temperature under which common
minerals are produced, the lower the polymerization is and vice versa. The closer the
crystal minerals of the mantle under the temperature and pressure are to the core, the
more the polymerization losses of crystalline mineral. Then the bonding force of
mineral compound is destroyed and the crystallization gradually diminishes.
Olivine, an important rock of the earth, for example, under room temperature and
pressure is a complex crystal tectosilicate. Quartz is a mineral of Olivine. After heating,
quartz, the four oxygen of the silicon oxygen tetrahedron and four different structures
of silicon oxygen tetrahedron are gradually reduced to phyllosilicates, inosilicates and
cyclosilicates, respectively. When the temperature raises considerably high, the four
oxygen of silicon oxygen tetrahedron become an elemental unit of silicates known as
sorosilicates. When the temperature reaches the melting point, the sorosilicates reduce
tonesorosilicates, which are the crystal tetrahedron of silica mineral, a basic structural
unit of minerals.
At the CMB, the temperature is 4500 ± 500°K that reaches the melting point of
rock under that pressure. In the F zone of the deeper core, 5500 ~ 6600° K ,
polymerization may cease completely and mostly bonding power of ions loses, only the
electronic bonding force exists. All the ions and molecules may become unbounded.
Therefore, the molten rock becomes magma, a mixture of oxides such as SiO2, Al2O3,
FeO, Fe2O3, Cr2O3, MgO, NiO, etc., and metals, such as Fe, Ni, Mn, etc..
In the higher resolution models, some of the heterogeneities extend upward from
the CMB into the mantle in a manner suggestive of rising plume structure [Young &
Lay, 1987]. On this basis, a great quantity of magma heated by the extreme
temperatures in the core condenses into solid rock and produces the heat of
solidification at the CMB. Some magma absorbing that heat does not condense but
mixes with masses of rock as honeycombed blobs of rock rising upward at
approximately an inch a year through the mantle to pour out at cracks in the mid-ocean
ridge to form new ocean floor or in the continent to form great rifts. The outflow of heat
is the dynamic source of continental drift. Conversely, due to convection, the downward
migrating masses of cold rock in the subduction zone of the crust sink all the way
through the warmer surrounding mantle to the CMB. The downward masses of rock in
the cold regions of the low mantle produce depressions of the CMB into the core, and

both the cold region in the mantle and a depression of the CMB produce down welling
flow in the core [Bloxham & Jackson, 1990].
The energy source and buoyancy sources in the core are still not well understood,
but we attempt to explain this phenomenon from the perspective of the great convection
cell as described above. The downward masses of rock absorb the heat of fusion,
diminishing the heat energy at the CMB, and melting in the core, where viscosity is so
high that the great quantities of molten rock cannot diffuse but still remain a whole. So,
the components of molten rock are seldom involved in the chemical reactions.
According to mechanics, although the velocity of downward migrating flow is low,
the mass of the rock column from the crust to the CMB is so large that its downward
momentum has a great quantity. In the liquid outer core, there is no rigid body having
enough mass to counteract the downward momentum, so the molten rock sinks all the
way to the inner core. The great downward momentum is counteracted by the solid
inner core, which Jeanloz and Wenk have obtained a possible evidence of low-degree
convention like that in the mantle in the inner core from an enigmatic observation
[Jeanloz & Wenk, 1988]. At the ICB, the momentum from the downward molten rock
is transmitted through the core, the earth's center and probably on to the opposite side
of the CMB.
From ray theory, an evidence of reduced velocity gradient in a zone above the
inner core boundary has been interpreted [Rial & Cormier, 1980; Cormier, 1981]. A
higher resolution solution for the core velocity and wave amplitudes by A. Qamar
confirms the F transition zone, 566 km in width, above the ICB [Bolt, 1972]. At the
boundary of the transition zone F, where the velocity of body wave jumps about 0.1
km/sec, the viscosity of molten rock has been reduced, and the molten rock is able to
flow more freely and became a heterogeneous mixture ─magma. Oxides and metals,
the component of magma, could diffuse freely and float or sink according to their
specific gravity. We suggest that the F zone should have some functions instead that of
the well-known D" zone, such as the thermal and chemical equilibrium.
There are a large amount of iron oxides (FeO, Fe2O3) in the mantle, and the deeper
the mantle is, the higher the proportion of iron oxides. Altshuler and Sharipdzhanov
proposed that an iron oxide which has metal-like density and electrical properties at
high pressures and temperatures exists in the earth's core would be a compromise
between extreme views of the metallic phase and in conformity with the high cosmic
abundance of oxygen [Altshuler & Sharipdzhanov, 1971]. From this information, we

propose that the outer core would be rich in iron oxides. Bloxham and Gubbins inferred
that topography and lateral temperature variations in the lowermost mantle maybe have
an indistinguishable effect on the magnetic field. In view of the topography, the
downward migrating magma rich in iron oxides is affected by diffusion, obstruction of
the inner core, tangentially geostrophic flow and toroidal flow, so the fluid flows
westward, which causes the geomagnetic secular variation [Bloxham & Gubbins, 1987].
So, under low viscosity, the oxides and metals can flow vertically and horizontally, thus
allowing mutual oxidation-reduction reactions to take place easily in the F region. The
active light metals take oxygen from heavy metal oxides and are further oxidized into
light metal oxides. The heavy metal oxides are reduced to heavy metals and sink. For
example:
Ca + FeO ─→ CaO + Fe↓
3Mg + Fe2O3─→ 3MgO + 2Fe↓
2Al + Fe2O3 ─→ Al2O3 + 2Fe↓
2Cr + 3FeO ─→ Cr2O3 + 3Fe↓
Mn + NiO ─→ MnO + Ni↓
CaO, MgO, Al2O3, Cr2O3 and
MnO float in the F zone, and FeO,
Fe2O3 and NiO become iron and
nickel, which sink down to be the
main component of the inner core.
These oxidation-reduction reactions
are exothermic processes that
produce a great amount of heat. The
reduced iron alloys with certain amounts of nickel and also combines with oxides to
settle down at the ICB and produces the heat of solidification while it solidifies. In the
F zone, magma diffuses and absorbs a great amount of heat to rise to the CMB and
condenses into solid rock as the beginning of the process of large convection cell starts
anew. The great amount of heat, produced from the chemical reaction and the
solidification at the ICB and the CMB and from the fusion heat lost at CMB while the
down welling rock melts, causes the power sources for the geodynamo of a large
convection cell. A schematic diagram of this scenario is shown in Figure 3.
Figure 3. This is a schematic diagram of the great convection cell. A circulation of magma and solid or molten rock migrates up to the crust and down to the F zone of the outer core and causes topography of the core.

According to the
description above, the
difference in density between
the outer core and the inner
core must be great. Jeanloz
and Ahrens completed
shock-wave experiments
[Jeanloz & Ahrens, 1980], in
which it was found that the
density of FeO is 10.14
g/cm3 when reduced to core
temperature and 250 GP a
pressure and under the same
conditions the density of Fe
is12.62 g/cm3 [McQueen et
al., 1970]. The difference
between both is 2.48g/cm3, a
figure higher than all of the
previous evaluated values.
Figure 4 plots the
PKiKP/PcP observations
which contain LASA array
data from Engdahl and Flinn [Engdahl et al., 1970; Engdahl et al., 1974], single-station
data from Buchbinder [Buchbinder et al., 1973], Warramunga array data from Souriau
and Souriau [Souriau & Souriau, 1989], and single-station GDSN data from Shearer
and Masters [Shearer & Masters, 1990]. The theoretical amplitude ratio from PREM
(∆ρ= 0.6 g/cm3) is shown, compared with that predicted for a higher ICB density
contrast (∆ρ = 1.8g/cm3). The data exhibit considerable scatter, but clearly favor
models with higher ICB density contrasts than PREM. From Figure 4, one would expect
that, on average, the observed PKiKP/PcP amplitude ratios will scatter about the “true”
amplitude ratio, so a dashed line(∆ρ ≧ 2.0 g/cm3) is a more reasonable curve of mean
value among all the scattered points that indicates a favorable density jump a slightly
larger than 2.0 g/cm3.
On the basis of the free oscillation periods, Derr has inferred an earth model DI-
Figure 4. Observed PKiKP/PcP amplitude ratios plotted as a function of range. Solid squares indicate LASA array data [Engdahl et al., 1970, 1974]; open triangles are single-station data [Buchbinder et al., 1973]; solid circles are Warramunga array data [Souriau & Souriau, 1989]; stars are single-station GDSN data [Shearer & Masters, 1990]. The lower curve shows the theoretical amplitude ratio for PREM ( ρ= 0.6 g/cm3). The middle curve shows the result for a higher density contrast ( ρ=1.8 g/cm3). The upper dashed curve shows a more reasonable curve of mean value among all the scattered points for a favorable density contrast ( ρ≧ 2.0 g/cm3).
11 by least-squares inversion with an average shear velocity of 2.18 km/sec in the inner
core and a jump in density of 2 g/cm3 at its boundary that satisfies the known mass and
moment of inertia [Derr, 1969]. We use the density jump of Derr's suggestion 2.0 g/cm3
at the ICB to research the new earth model in this paper.
Ⅳ. The evaluation of the structure of the new earth model In order to calculate the data of the earth, the density distribution follows the
divisions of the PREM divided into 94 levels, including 82 thin shells. The thickness
of each shell is not greater than 100 km and so small compared with the earth's radius
of 6371 km that the density is regarded as linear variation within it. Then, we use a
simplification method to calculate the information of the earth in order to simplify the
calculating work.
The formula for the mass M of a uniform sphere,
M = (4/3)πρR3 (4)
Where R is the radius and ρ is the density.
The mass ∆M of each shell in the earth's interior can be calculated through
∆M = (4/3)πρtRt3 - (4/3)πρbRb
3 (5)
Where: ρt and ρb are the densities of the top and the bottom, respectively, in a
shell. Rt and Rb are the radii of the top and the bottom in a shell. Because the
difference between ρt and ρb is so small and the density is regarded as linear variation
in the shell, the mean value of both ρt and ρb is substituted for ρt and ρb in order
to simplify the calculation. Then equation (5) becomes
∆M = (4/3)π (Rt3 - Rb
3) (6)
The formula for the moment I of inertia of a uniform sphere,
I = (2/5)MR2 (7)
The moment of inertia ∆I of each shell in the earth's interior can be calculated
through combining equations (4) and (7),
∆I = (8/15)π (Rt5 - Rb
5) (8)
From fluid mechanics, in a region of uniform composition, which is in a state of
hydrostatic stress, the gradient of hydrostatic pressure is expressed by
dP / dR = –ɡρ (9)
Where P, R are the pressure and the radius, respectively, at the region; ρ is the
density at that depth; ɡ is the acceleration due to gravity at the same depth.
If the effect of the earth's rotation is negligible, the potential theory shows that ɡ
is resulted only from the attraction of the mass M within the sphere of radius R through
ɡ = GM / R2 (10)
Where: G is the gravitational constant “6.6726×10⁻¹¹ m3/kg.s2”.
Equation (10) substitutes into equation (9) and we integrate it. In order to simplify
the calculation, we take the mass of a sphere as the mean value of Mt and Mb,
which are the masses of the sphere within the top radius Rt and the bottom radius Rb,
respectively, of a shell.
Mt = (4/3)π Rt3 (11)
Mb = (4/3)π Rb3 (12)
= (Mt + Mb)/2 (13)
So, in equations (9) and (10), we take ρ and M as and , which are
considered the constants in the thin shell and irrelative to the P and R. Then we get
∆P = ( 1/Rb - 1/Rt)G (14)
Where: ∆P is the difference in pressure between the top and the bottom in a layer
of the Earth.
Equation (10) cannot be applied to the center of the earth where is a discontinuous
point. Combining equations (4), (9) and (10), we integrate and then get
∆Pc = (2/3)πG 2Rc2 (15)
Where: ∆Pc is the difference in pressure between the radius Rc and the center of
the earth at the center portion.
The acceleration due to gravity ɡ of each layer can be derived from equation (10).
According to the observation data, the moment of inertia about the polar axis of the
earth is 0.3309MeRe2 [Garland, 1979] and about an equatorial axis is 0.3298MeRe2.
The earth is regarded as a sphere, of which the moment of inertia is determined to be
80286.4×1040 g.cm2 by taking the mean value of both figures, where Me is the earth's
mass of 5974.2×1024 g and Re is the equatorial radius of 6378.14 km. In order to
examine the accuracy of applied equations, we apply the density distribution of the
PREM to calculate the earth's mass, moment of inertia, pressure and acceleration due
to gravity. The calculated values of the earth's data from the density distribution of the
Preliminary Reference Earth Mode as compared with the values of the current data and
the PREM are listed in Table 1 and Table 2.

Table l. The calculated values of the earth's data from the density distribution of the Preliminary Reference Earth Mode and compared with it.
Le- vel
Radius
R
Density
ρ
Mass within Radius M
Moment within Radius I
Gravity
ɡ
Pressure
P
Pressure Deviation
∆P
No km
g/cm3
1024
g 1040 g.cm2
103
cm/s2
Kbar 10-3
94 93 92 91 90 89 88 87 86 85 84 83 82 81 80 79 78 77 76 75 74 73 72 71 70 69 68 67 66 65 64 63 62 61 60 59 58 57 56 55 54 53 52 51 50 49 48 47 46
6371.0 6368.0 6368.0 6356.0 6356,0 6346.6 6346.6 6331.0 6311.0 6291.0 6291.0 6256.0 6221.0 6186.0 6151.0 6151.0 6106.0 6061.0 6016.0 5971.0 5971.0 5921.0 5871.0 5821.0 5771.0 5771.0 5736.0 5701.0 5701.0 5650.0 5600.0 5600.0 5500.0 5400.0 5300.0 5200.0 5100.0 5000.0 4900.0 4800.0 4700.0 4600.0 4500.0 4400.0 4300.0 4200.0 4100.0 4000.0 3900.0
1.02000 1.02000 2.60000 2.60000 2.90000 2.90000 3.38076 3.37906 3.37688 3.3747l 3.37471 3.37091 3.36710 3.36330 3.35950 3.43578 3.46264 3.48951 3,51639 3.54325 3.72378 3.78678 3.84980 3.91282 3.97584 3.97584 3.98399 3.99214 4.38071 4.41241 4.44316 4.44317 4.50372 4.56307 4.62129 4.67844 4.73460 4.78983 4.84422 4.89783 4.95073 5.00299 5.05469 5.10590 5.15669 5.20713 5.25729 5.30724 5.35706
5973.289 5971.729 5971.729 5955.860 5955.860 5942.042 5942.042 5915.418 5881.498 5847,813 5847.813 5789.430 5731.761 5674.801 5618.547 5618.547 5545.290 5472.542 5400.312 5328.609 5328.609 5245.188 5161.788 5078.443 4995.188 4995.188 4937.243 4879.884 4879.884 4789.122 4701.095 4701.095 4527.934 4358,719 4193.543 4032.484 3875.615 3722.994 3574.669 3430.681 3291.058 3155.823 3024.990 2898.564 2776.543 2658.919 2545.676 2436.792 2332.241
80205.664 80163.472 80163,472 79735.267 79735.267 79363.655 79363.655 78650.501 77746.958 76855.371 76855.371 75323.498 73827.216 72365.862 70938.843 70938.843 69104.504 67309.578 65553.702 63836.530 63836.530 61870.242 59937.364 58038.407 56173.776 56173.776 54894.999 53644.500 53644.500 51695.390 49838.510 49838.510 46282.178 42930.977 39778,675 36818.780 34044.639 31449.399 29026.105 26767.722 24667.171 22717.392 20911.315 19241.931 17702.299 16285.574 14985,041 13794.099 12706.303
981.959 982.628 982.628 983.721 983,721 984.348 984.348 984.772 985.341 985.937 985.937 987.046 988.241 989.523 990.895 990.895 992.443 994.021 995.631 997.275 997.275 998.311 999.243 1000.070 1000.794 1000.794 1001.293 1001.849 1001.849 1001.046 1000.272 1000.272 998.780 997.393 996.149 995.087 994.249 993.682 993.433 993.557 994.111 995.158 996.768 999.016 1001.988 1005.777 1010.487 1016.234 1023.150
0.000 0.301 0.301 3.368 3.368 6.051 6.051 11.242 17.897 24.552 24.552 36.197 47.843 59.490 71.140 71.140 86.533 102.070 117.752 133.580 133.580 152.315 171.384 190.784 210.515 210.515 224.460 238.440 238.440 260.896 283.051 283.051 327.772 373.027 418.809 465.113 511.936 559.281 607.151 655.55Q 704.504 754.016 804.113 854.820 906.171 958.203
1010.963 1064.504 1118.888
0.000 5.211 8.053 1.215 0.568 1.744 1.247 0.255 0.328 0.510 0.225 0,387 0.395 0.410 0.453 0.354 0.413 0.417 0.421 0.447 0.394 0.422 0.426 0.427 0.430 0.425 0.427 0.445 0.412 0,434 0.437 0.434 0.454 0.470 0.485 0.497 0.509 0.518 0.528 0.537 0.547 0.555 0.564 0.572 0.579 0.587 0,594 0.602 0.609

45 44 43 42 41 40 39 38 37 36 35 34 33 32 31 30 29 28 27 26 25 24 23 22 21 20 19 18 17 16 15 14 13 12 11 10 9 8 7 6 5 4 3 2 1
3800.0 3700.0 3630.0 3630.0 3600,0 3500.0 3480.0 3480.0 3400.0 3300.0 3200.0 3100.0 3000.0 2900,0 2800.0 2700.0 2600.0 2500.0 2400.0 2300.0 2200.0 2100.0 2000.0 1900.0 1800.0 1700.0 1600.0 1500.0 1400.0 1300.0 1221.5 1221.5 1200.0 1100.0 1000.0 900.0 800.0 700.0 600.0 500.0 400.0 300.0 200.0 100.0
0.0
5.40681 5.45657 5.49145 5.49145 5.50642 5.55641 5.56645 9.90349
10.02940 10.18134 10.32726 10.46727 10.60152 10.73012 10.85321 10.97091 11.08335 11,19067 11.29298 11.39042 11,48311 11.57119 11.65478 11.73401 11.80900 11.87990 11.94682 12.00989 12.06924 12,12500 12,16634 12.16360 12.77493 12.82501 12.87073 12.91211 12.94912 12.98178 13.01009 13.03404 13.05364 13.06888 13.07977 13.08630 13.08848
2231.989 2135.997 2071.317 2071,317 2044.225 1956.620 1939.595 1939.595 1821.025 1678.502 1542.384 1412.729 1289.573 1172.922 1062.760 959.048 861.725 770.709 685.901 607.181 534.411 467.440 406.100 350.208 299.568 253.973 213.202 177.026 145.204 117.486 98.436 98.436 93.378 72.093 54.279 39.646 27.892 18.714 11.800 6.836 3.503 1.479 0,438 0.055 0.000
11715.364 10815.178 10235.887 10235.887 9999.856 9263.582 9125.339 9125.339 8189.719 7123.015 6164.138 5306.115 4541.998 3864.903 3268.068 2744.899 2288.994 1894.191 1554.580 1264.538 1018.739 812.171 640.145 498.303 382.619 289.403 215.291 151.249 112.556 78.802 58.583 58.583 53.640 34.814 21.671 12.826 7.132 3.665 1.698 0.684 0.224 0.054 0.007 0.001 0.000
1031.383 1041.100 1048.886 1048.886 1052.492 1065.775 1068.680 1068.680 1051.122 1028.464 l005.050 980.913 956.089 930.611 904.512 877.825 850.584 822.821 794.573 765.875 736.758 707.265 677.436 647.312 616.944 586.388 555.708 524.988 494.331 463.868 440.212 440.212 432.690 397.560 362.182 326.595 290.800 254.839 218.713 182.456 146.088 109.653 73.065 36,699 0.000
1174.188 1230.486 1270.533 1270.533 1287.866 1346.464 1358.335 1358.335 1442.882 1548.038 1652.385 1755.720 1857.844 1958.564 2057.694 2155.056 2250.478 2343.794 2434.847 2523.487 2609.572 2692.969 2773.552 2851.205 2925.821 2997.305 3065.572 3130.550 3192.185 3250.438 3293.691 3293.691 3305.677 3359,210 3408.454 3453.339 3493.806 3529.806 3561.307 3588.295 3610.792 3628.883 3642.820 3653.579 3655.973
0.616 0.624 0.624 0.623 0.621 0.628 0.609 0.608 0.652 0.682 0.712 0.742 0.773 0.804 0.835 0.867 0.901 0.936 0.971 1.010 1.049 1.091 1.135 1.182 1.232 1.285 1.343 1.405 1.472 1.545 1.578 1.571 1.575 1.674 1.784 1.908 2,048 2.210 2.399 2.627 2,910 3.282 3.820 4,799 4.796

Table 2. The calculated values from the density distribution of the PREM are compared with the current data and the PREM.
The calculated earth's mass, as indicated in Table 1, is 5973.289×1024 g, which is
0.0152 % less than the current value of 5974.2×1024 g. The calculated moment of inertia
is 80205.664×1040 g.cm2, which is 0.1006 % less than the average observation value
of 80286.4×1040 g.cm2. The deviations of interior gravity are almost about 0.042 %,
with the central portion exception. The interior pressure is 1358.335 kbar at the CMB,
which is 0.0608 % higher than the PREM value of 1357.509 kbar. These comparisons
indicate that the calculated data are very close to the current values. It proves that the
simplification method is acceptable and useful. However, the pressure of 3655.973 kbar
is higher than the PREM value of 3638.524 kbar by 0.4796 % at the earth's center about
8 times of the deviation at the CMB. We compare all the calculated pressures of the
simplification method with the pressures of the PREM. The deviation E of the
calculated pressure from the
pressure P of the PREM is
shown in Figure 5.
From the crust to the
CMB, the deviations are
drawn as a straight line E
which indicates the calculated
pressures of the
simplification method have a
system error in view of the
error theory compared with
those of the PREM. But from
the CMB to the earth's center,
the deviations of the
Data of the Earth Mass Moment of inertia
Pressure at CMB
Pressure At Earth center
Gravity at CMB
Gravity at Earth surface
Unit 1024 g 1040g.cm2 K bar K bar cm/sec2 cm/sec2 PREM & Current 5974.200 80286.400 1357.509 3638.524 1068.230 981.560
Calculated values 5973.289 80205.664 1358.335 3655.973 1068.680 981.959
Difference % -0.0152 -0.1006 +0.0608 +0.4796 +0.0421 +0.0406
Figure 5. The pressure P of the PREM and the deviation
E of the calculated pressure of simplified method from the value of P.

calculated pressure from those of the PREM sharply increase above the system
deviation ─ the dashed line. This indicates that there is considerable discrepancy
between the two methods only within the core related to the pressure. We could confirm
that the structure of the core in the PREM, which greatly affects its pressure, is
something incorrect.
In order to investigate the structure of the earth ─ particularly the core, the
density distribution of the PREM is adapted from the crust to the CMB. As described
above, the components of the outer core are similar to those in the lower mantle, and
the density distributions between both are continuous at the CMB. Then from the
CMB to the ICB, four differently plotted density curves are set to match the known
conditions. Due to a small jump of P-wave velocity at the boundary of F transition
zone in the outer core, the slope of density curve is nearly as steep as the PREM.
There is a discontinuity at the ICB, so that a density jump of 2.0 g/cm3 is used there.
In the inner core, the same slope of density curve of the PREM is used in this portion.
The four density curves of the assumed earth model compared with the PREM are
shown in Figure 6.
Figure 6. The density ρ of the new Earth models 1, 2, 3 and 4 compared with the PREM.
From equations (6) and (8), the mass and the moment of inertia of the four new
earth models can be determined. These are compared with the observed values of the

earth's mass 5974.2×1024 g and moment of inertia 80286.4×1040 g.cm2, and then the
differences will be found to be very large as Table 3 is shown. The differences are the
insufficiencies of the mass and the moment of inertia of the four new earth models.
The insufficiencies of the mass and the moment of inertia can only be obtained by
comparing the observation data of the earth but cannot be detected directly. The
insufficiency of mass, called the missing mass, belongs to dark matter in astrophysics.
The missing mass and moment of inertia of the earth, relative to the gravity, cannot be
answered clearly through the ordinary earth sciences. So, a new study of the earth is
being attempted by utilizing the contemporary physics.
Table 3. The insufficiencies of the mass and the moment of inertia in the four new earth models are showed.
Earth model Unit Observed value
New model 1
New mod. 2
New mod. 3
New mod. 4
Mass 1024g 5974.200 5409.024 5268.126 5204.761 5121.820
Insufficiency 1024g - 565.176 706.074 769.439 852.380 Moment of
inertia 1040g.cm2 80286.400 77007.472 76571.028 76378.768 76126.841
Insufficiency 1040g.cm2 - 3278.928 3715.372 3907.632 4159.559
There are two types of dark matter: hot dark matter (HDM) and cold dark matter
(CDM). Hot dark matter exists as such in a kind of photon or neutrino which has zero
mass and moves at or approaching the speed of light. Cold dark matter exists at a lower
energy and particle type. Due to the gravity of the particles, CDM moves at a low speed
and collects together like normal matter. According to the observation data of
background radiation in the universe, some physicists have recently proposed that
perhaps cold dark matter explains the cosmic-structure. Blumenthal argued that the
CDM model for the formation and distribution of galaxies in the universe is successful
and the expansion of the universe is dominated by the CDM [Blumenthal et al., 1984].
After reporting the South Pole experiment, Lubin showed that according to a recent
anisotropy experiment in which a Byesian analysis was used to constrain the amplitude
of the perturbation spectrum, they showed that adiabatic HDM models were
convincingly ruled out and CDM models had anisotropies near their derived limits
[Lubin et al., 1991]. Based on the result of their experiment, they announced the South
Pole experiment was particularly well suited to the CDM-type model, among others.
We proceed with the assumption that the missing mass and moment of inertia of
the earth are those of dark matter which may constitute a normal planet of the CDM. In
order to find some solution in this article, dark matter is compared to Mars. The average

radius of Mars is 3397 km and the mass is 642.40×1024 g. Its mass approaches the
insufficient mass of the new earth model (2) in the Table 3. So, dark matter is considered
as a planet, called a dark planet, of which the form is similar to Mars and its
characteristics are based on the inner planets of the solar system. The data of the dark
planet can be calculated as follows.
A dark planet is considered as a sphere, whose radius and density can be calculated
through the insufficiency of the mass and the moment of inertia of the earth. The
moment of inertia of a sphere can be derived through
I = CMR2 (16)
Where C is the coefficient of the moment of inertia, which is 0.4 in a uniform
sphere as equation (4) showed. From experience, the four dark planets are each
individually given the trial values of C such as 0.33 ~ 0.4 to determine the
approximate radii of the dark planets through equation (16). To consider the density of
rock on the surface of the earth and the moon, we assume that the surface density of the
dark planet is 2.70 g/cm3. Under the condition that the density of a layer is proportional
to its depth, we select a trial value of density at the center of dark planet and apply
equations (6) and (8) to calculate the mass and the moment of inertia of each shell and
the total mass and moment of inertia. Because the radius and the center density of the
dark planet are the hypothetical values, but the total mass and moment of inertia are
necessary to correspond to the insufficiency of the earth's mass and moment of inertia;
therefore, it is necessary to use a trial-and-error approach to determine the proper radius
and center density. Then, we calculate the average density of the dark planet through
equation (4).
In order to search for the location of the dark planet in the universe, we apply the
most advanced physical theory ─“Superstring theory”, to solve the problem.
Superstring theory attempts a broader exploration than Einstein's Relativity theory. This
theory is deduced from the characteristics of String theory and Supersymmetry and the
most promising hope for truly unifying the scale of the microcosm and the macrocosm,
which completes the descriptions of both in quantum field theory and General
Relativity. Crudely speaking, it can unify the four basic interacting forces of nature and
various elementary particles of the universe. This theory, a candidate for “theory of
everything”, is based on the universe constitution of nine-dimensional space and one-
dimensional time and has Supersymmetry of E8×E8. However, Superstring theory,
called ten-dimensional theory, is now not established as well as Relativity theory. The
problem rests with the former's failure, in so far as working out a theoretically solid
basic geometry is highly concerned. Because there is no the exact boundary condition
to fit the real universe, though many mathematicians and physicists have attempted to
break the constitution of ten-dimensional space-time model down to a four-dimensional
one as our known world, no proposed method meets perfection.
At Harvard University (Oct. 29 1987), the renowned cosmologist ─ Professor A.
Linde, lectured that since the universe was produced from the “Big Bang”, ten-
dimensional space-time of the universe is unnecessarily compactified (broken down)
into a four-dimensional space-time, and other number of dimensional space-time may
exist. Supersymmetry is one of the most elegant of all symmetries, although there is no
empirical data to support the notion of highly desirable theoretical mechanisms that
hold tremendous promise. But Hall reported that the physicists of CERN announced
the first experimental evidence for Supersymmetry [Hall, 1991]. According to
Supersymmetry, every dimension of nine- dimensional space must have the property of
global symmetry with equivalent mathematical weight, so every dimension is all
symmetric. The universe need not be compactified into the local symmetry when its
vacuum high-energy phase transits into a low-energy one.
Without breaking the nine-dimensional space of the universe down, the ten-
dimensional space-time is considered to universally exist. Time cannot be divided into
some different parts, so one-dimensional time is taken as a common standard in order
of event in the universe. According to the “anthropic principle”, three-dimensional
space and one-dimensional time are taken as one cosmos as our living world; therefore,
the nine-dimensional space can be divided into three portions, and each portion has a
common standard time, which are considered as there are three cosmoses in the
universe. In other word, the framework of the universe, containing nine-dimensional
space and one-dimensional time, will be established as a three-cosmic structure. The
dark planet can be situated in a cosmos other than our own. The structure of the three-
cosmic universe cannot be observed directly but can be recognized from the “missing
neutrinos of the sun”.
According to Superstring theory, the E8×E8 supersymmetric structure has
characteristics in which each E8 represents a single symmetrical group. One E8
describes a world of general matter and the other E8 describes a world of shadow matter.
There are no basic interactive forces between any two different cosmoses except for
gravity. Therefore, among the three cosmoses, only the force of gravity can affect the

entire universe. In other words, the theoretic graviton in the field of gravity can
penetrate all three cosmoses; however, photon cannot penetrate through other cosmoses.
The graviton has been observed by the researchers in a global network, but they have
not caught yet. The graviton has the physical characteristics: rest mass = 0, charge = 0,
spin = 2 and the speed of light. The lepton ─ neutrino, which has been captured, has the
physical characteristics: rest mass= 0, charge = 0, spin = 1/2 and the speed of light. The
neutrino and the graviton carry a very small amount of energy. The neutrino is fermions
and the lepton is boson. Supersymmetry is one of the most elegant of all symmetries,
which unites bosons and fermions into a single multiplet and describes both are the
same kind of particle. So, the physical characteristics of neutrino and the graviton are
similar to each other. Less than 2 % of the sun's energy is emitted in the form of
neutrinos. Only about one-third the amount of the neutrinos can be caught on the earth
as the astrophysical theory predicts, and about two-thirds of it disappears. This solar-
neutrino problem has been a big mystery in astro-particle physics for the past three
decades. Since the graviton can penetrate all the three cosmoses as the physical theory
describes, if we compare the neutrino to the graviton, the neutrinos of the sun should
uniformly emit into all the three cosmoses. They reach the cosmos of our world only
one-third of their original amount and the other two-thirds of it should emit into the
other two cosmoses. Therefore, not only the problem of the solar-neutrino problem
could be solved, but also the three cosmoses of the universe structure will be proved
indirectly.
According to the three-cosmic structure of the ten-dimensional space-time
universe model, all the normal matter of CDM should exist in the three cosmoses. So,
the South Pole experiment which predicted the CDM model of the cosmic-structure
also supports the three-cosmic structure.
Superstring theory argues that there are no interacting forces, including the
electromagnetic force, between any two cosmoses except gravity, so the dark planet
which is found through the gravity force should be in another invisible cosmos. The
earth orbits around the sun and the orbit may be affected by the gravity of the dark
planet, but no abnormal effect has been observed. Therefore, we assume that the gravity
centers of the earth and the dark planet coincide with each other at one point but in
different cosmos. Based on the effect in which the same side of the moon always faces
the earth while revolving around the earth, we infer that the dark planet and the earth
should rotate synchronously. It is hard to examine the existence of dark planet directly,

however, it can be observed from “Chandler wobbles”.
Referring to the orientation of the rotation axis of the earth in space in addition to
both precession and nutation, there is a wobble on the instantaneous axis of rotation of
the earth itself. The wobble alters the position of a point on the earth relative to the pole
of rotation. Chandler pointed out that there are two different kinds of the wobble periods.
One is a period of 12 months and the other is a period of 14 months [Chandler, 1891].
The former, called annual wobble, is obviously affected by the seasonal climate. The
latter, called Chandler wobble, has not been solved for a hundred years. We have
postulated that both the earth and the dark planet spin synchronously around the same
gravity center, but the rotation axes of both are impossible coinciding with each other.
In other words, an angle between the two rotation axes produces the Chandler wobble
as the precession and nutation due to the effects of the sun and the moon on non-parallel
axes. Therefore, the problem of Chandler wobble should be solved and indirectly
confirms the existence of dark planet inside the earth.
Assuming that the gravity centers of the earth planet and the dark planet coincide
at a single point and both rotate synchronously, the global mass and moment of inertia
is be obtained from the sum of them. Based on mechanics, the gravity at each shell
inside the earth is affected by the mass of the earth and the dark planet within its radius.
From equation (10), the pressure difference ∆P’ between the top and the bottom of a
shell within the earth is calculated through
∆P’ = ( 1/Rb – 1/Rt)G (17)
Where is the mean value of the total mass of the earth, and the dark planet is
within the radius Rt and Rb. is the mean density in this layer of the earth.
Equation (17) cannot be applied to the earth's center, because there is a
discontinuous point. From equation (4), the average density of the central portion
of the earth combined with the dark planet within its radius Rc can be calculated through
= ( Mc + Md )/[(4/3)πRc3] (18)
Where: Mc and Md are the masses of central portion in the earth and in the dark
planet, respectively.
From equations (18), (9) and (10), the differences of pressure between the top and
the center of the central portion in the earth can be obtained through
∆ c = (2/3)πG Rc2 (19)
In order to calculate the pressure of the earth, we use the density of the earth only,
in other words, the weight per unit volume at each depth within the earth; for example,
we use in equations (17) and (19). But to calculate the gravity force, we must use
the masses of both the earth and the dark planet; for example, we use in equation
(17) and in equation (19). The pressure in each layer can be obtained by adding the
pressure differences of each layer from the surface layer to this layer. The pressure of
the earth's center is the sum of all the pressure differences of every layer of the earth.
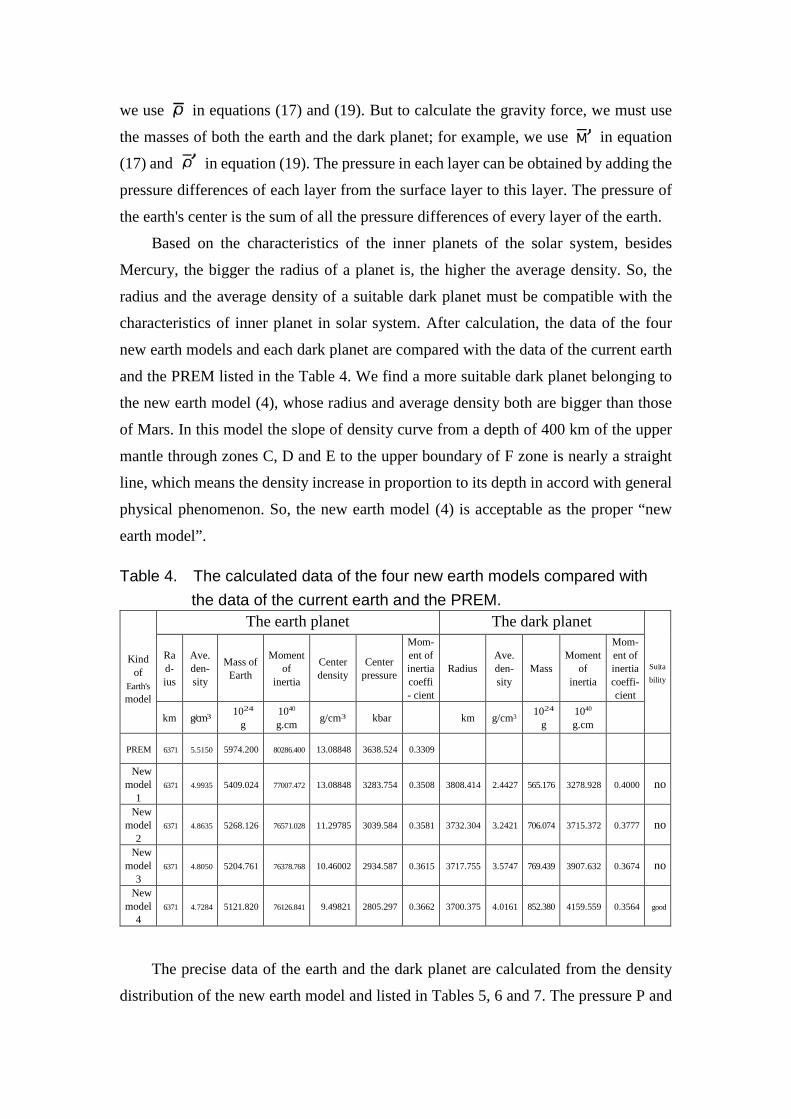
Based on the characteristics of the inner planets of the solar system, besides
Mercury, the bigger the radius of a planet is, the higher the average density. So, the
radius and the average density of a suitable dark planet must be compatible with the
characteristics of inner planet in solar system. After calculation, the data of the four
new earth models and each dark planet are compared with the data of the current earth
and the PREM listed in the Table 4. We find a more suitable dark planet belonging to
the new earth model (4), whose radius and average density both are bigger than those
of Mars. In this model the slope of density curve from a depth of 400 km of the upper
mantle through zones C, D and E to the upper boundary of F zone is nearly a straight
line, which means the density increase in proportion to its depth in accord with general
physical phenomenon. So, the new earth model (4) is acceptable as the proper “new
earth model”. Table 4. The calculated data of the four new earth models compared with
the data of the current earth and the PREM.
Kind
of Earth's model
The earth planet The dark planet
Suita
bility
Rad- ius
Ave. den- sity
Mass of Earth
Moment of
inertia
Center density
Center pressure
Mom-ent of inertia coeffi- cient
Radius Ave. den- sity
Mass Moment
of inertia
Mom-ent of inertia coeffi- cient
km g/cm3 1024
g 1040
g.cm g/cm3 kbar km g/cm3 1024 g
1040
g.cm
PREM 6371 5.5150 5974.200 80286.400 13.08848 3638.524 0.3309
New model
1 6371 4.9935 5409.024 77007.472 13.08848 3283.754 0.3508 3808.414 2.4427 565.176 3278.928 0.4000 no
New model
2 6371 4.8635 5268.126 76571.028 11.29785 3039.584 0.3581 3732.304 3.2421 706.074 3715.372 0.3777 no
New model
3 6371 4.8050 5204.761 76378.768 10.46002 2934.587 0.3615 3717.755 3.5747 769.439 3907.632 0.3674 no
New model
4 6371 4.7284 5121.820 76126.841 9.49821 2805.297 0.3662 3700.375 4.0161 852.380 4159.559 0.3564 good
The precise data of the earth and the dark planet are calculated from the density
distribution of the new earth model and listed in Tables 5, 6 and 7. The pressure P and

the acceleration due to gravity ɡ of the new earth model compared with the PREM are
shown in Figure 7. We can find the pressure curve of the new earth model is smoother
than that of the PREM below the CMB. In the gravity curve of the new earth model,
there are two deflection points in the curve which the one is at 2670.625 km in depth at
the radius of the dark planet, and the other is at the ICB.
Figure 7. The distribution of gravity ɡ and the pressurePof the PREM(p) and the new
earth model(n).

Table 5. The data of the earth planet of the new earth model are showed.
Le-vel Radius Density Mass of
shell Moment of Inertia
Le- vel Radius Density Mass of
shell Moment of Inertia
No. km g/cm3 1024 g 1040
g.cm2 No. km g/cm3 1024 g 1040
g.cm2
94 93 92 91 90 89 88 87 86 85 84 83 82 81 80 79 78 77 76 75 74 73 72 71 70 69 68 67 66 65 64 63 62 61 60 59 58 57 56 55 54 53 52 51 50 49 48
6371.0 6368.0 6368.0 6356.0 6356.0 6346.6 6346.6 6331.0 6311.0 6291.0 6291.0 6256.0 6221.0 6186.0 6151.0 6151.0 6106.0 6061.0 6016.0 5971.0 5971.0 5921.0 5871.0 5821.0 5771.0 5771.0 5736.0 5701.0 5701.0 5650.0 5600.0 5600.0 5500.0 5400.0 5300.0 5200.0 5100.0 5000.0 4900.0 4800.0 4700.0 4600.0 4500.0 4400.0 4300.0 4200.0 4100.0
1.02000 1.02000 2.60000 2.60000 2.90000 2.90000 3.38076 3.37906 3.37688 3.37471 3.37471 3.37091 3.36710 3.36330 3.35950 3.43578 3.46264 3.48951 3.51639 3.54325 3.72378 3.78678 3.84980 3.91282 3.97584 3.97584 3.98399 3.99214 4.38071 4.41241 4.44316 4.44317 4.50372 4.56307 4.62129 4.67844 4.73460 4.78983 4.84422 4.89783 4.95073 5.00259 5.05469 5.10590 5.15669 5.20713 5.25729
1.560
0.000 15.869
0.000 13.818
0.000 26.623 33.921 33.885 0.000
58.383 57.669 56.960 56.254 0.000
73.258 72.748 72.230 71.702 0.000
83.421 83.400 83.344 83.256 0.000
57.945 57.359 0.000
90.762 88.027 0.000 173.161 169.215 165.176 161.058 156.869 152.621 148.325 143.989 139.623 135.234 130.833 126.426 122.021 117.625 113.243
42.192
0.000 428.205
0.000 371.612 0.000 713.154 903.543 891.587
0.000 1531.873 1496.283 1461.353 1427.019 0.000 1834.339 1794.926 1755.876 1717.172
0.000 1966.289 1932.878 1898.957 1864.631
0.000 1278.777 1250.499
0.000 1949.III
1856.879 0.000
3556.332 3351.201 3152.302 2959.895 2774.141 2595.240 2423.294 2258.383 2100.552 l949.779 1806.076 1669.385 1539.631 1416.725 1300.533
47 46 45 44 43 42 41 40 39 38 37 36 35 34 33 32 31 30 29 28 27 26 25 24 23 22 21 20 19 18 17 16 15 14 13 12 11 10 9 8 7 6 5 4 3 2
1
4000.0 3900.0 3800.0 3700.0 3630.0 3630.0 3600.0 3500.0 3480.0 3400.0 3300.0 3200.0 3100.0 3000.0 2900.0 2800.0 2700.0 2600.0 2500.0 2400.0 2300.0 2200.0 2100.0 2000.0 1900.0 1800.0 1787.5 1700.0 1600.0 1500.0 1400.0 1300.0 1221.5 1221.5 1200.0 1100.0 1000.0 900.0 800.0 700.0 600.0 500.0 400.0 300.0 200.0 100.0 0.0
5.30724 5.35706 5.40681 5.45657 5.49145 5.49145 5.50642 5.55641 6.56645 5.60987 5.66415 5.71843 5.77270 5.82698 5.88126 5.93553 5.98981 6.04409 6.09837 6.15264 6.20692 6.26120 6.31547 6.36975 6.42403 6.47831 6.48509 6.52703 6.88649 7.03784 7.09459 7.15135 7.17442 9.17442 9.18575 9.23583 9.28155 9.32293 9.35994 9.39260 9.42091 9.44486 9.46446 9.47970 9.49059 9.49712 9.49821
108.883 104.551 100.252 95.991 64.681 0.000 27.091 87.605 17.025 66.482 79.503 75.548 71.647 67.805 64.026 60.313 56.671 53.104 49.616 46.211 42.893 39.666 36.534 33.502 30.573 27.752 3.276 21.757 22.952 21.027 18.677 16.321 11.235 0.000 3.636 15.317 12.837
10.560 8.491 6.638 5.004 3.596 2.416 1.468 0.755 0.278 0.040
1190.942 1087.797 990.939 900.186 579.291 0.000 236.031 736.274 138.243 524.600 595.032 532.191 474.147 420.694 371.635 326.765 285.875 248.764 215.223 185.049 158.036 133.982 112.688 93.955 77.588 63.398 7.027 44.150 41.722 33.736 26.231 19.875 11.924 0.000 3.554 13.547 9.471 6.383 4.113 2.507 1.423 0.735 0.333 0.124 0.034 0.005 0.000
Total 5,121.820 76,126.841
Insufficiency 852.380 4,159.559

Table 6. The data of the dark planet of the new earth model are showed.
Le- -vel Radius Density Mass of
shell
Moment of
Inertia
Le- vel Radius Density Mass of
shell
Moment of
Inertia
No. km g/cm3 1024 g 1040 g.cm2 No. km g/cm3 1024 g 1040
g.cm2
45 44 43 42 41 40 39 38 37 36 35 34 33 32 31 30 29 28 27 26 25 24 23
3700.375 3700 3030 3030 3600 3500 3480 3400 3300 3200 3100 3000 2900 2800 2700 2600 2500 2400 2300 2200 2100 2000 1900
2.70000 2.70053 2.80006 2.80006 2.84271 2.98488 3.01332 3.12706 3.26923 3.41140 3.55358 3.69575 3.83792 3.98010 4.12227 4.26445 4.40662 4.54879 4.69097 4.83314 4.97532 5.11749 5.25966
0.174
32.497 0.000 13.900 46.148 9.181 36.526 45.106 44.340 43.427 42.376 41.198 39.904 38.504 37.010 35.431 33.780 32.066 30.300 28.493 26.655 24.798
1.590
291.052 0.000
121.102 387.849
74.550 288.220 337.590 312.352 287.389 262.917 239.129 216.189 194.231 173.370 153.693 135.269 118.145 102.346
87.885 74.754 62.933
22 21 20 19 18 17 16 15 14 13 12 11 10 09 08 07 06 05 04 03 02 01
1800
1787.5 1700 1600 1500 1400 1300
1221.5 1221.5
1200 1100 1000 900 800 700 600 500 400 300 200 100 0
5.40184 5.41961 6.64401 6.68619 6.82836 6.97063 6.11271 6.22431 6.22431 6.25488 6.39706 6.53923 6.68140 6.82358 6.96676 7.10793 7.26010 7.39227 7.63445 7.67662 7.81880 7.96097
22.932
2.7351 8.3321 9.2161 7.3881 6.6931 3.843
9.675 0.000 2.471 10.520 8.968 7.604 6.138 4.881 3.743 2.736 1.871 1.167 0.605 0.227 0.033
52.388 5.860
37.199 34.931 27.897 21.899 16.858 10.269 0.000 2.415 9.304 6.616 4.536 2.973 1.844 1.005 0.559 0.258 0.098 0.027 0.004 0.000
Total 852.380 4,159.559
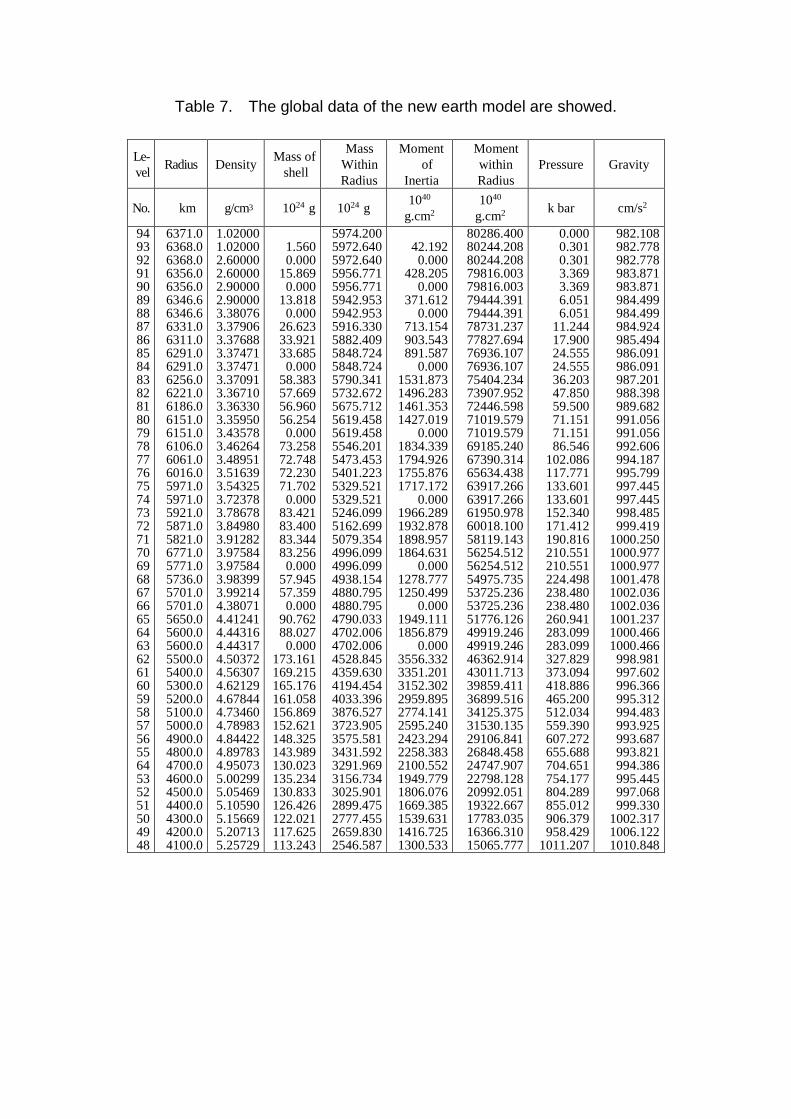
Table 7. The global data of the new earth model are showed.
Le-vel Radius Density Mass of
shell
Mass Within Radius
Moment of
Inertia
Moment within Radius
Pressure Gravity
No. km g/cm3 1024 g 1024 g 1040 g.cm2
1040 g.cm2 k bar cm/s2
94 93 92 91 90 89 88 87 86 85 84 83 82 81 80 79 78 77 76 75 74 73 72 71 70 69 68 67 66 65 64 63 62 61 60 59 58 57 56 55 64 53 52 51 50 49 48
6371.0 6368.0 6368.0 6356.0 6356.0 6346.6 6346.6 6331.0 6311.0 6291.0 6291.0 6256.0 6221.0 6186.0 6151.0 6151.0 6106.0 6061.0 6016.0 5971.0 5971.0 5921.0 5871.0 5821.0 6771.0 5771.0 5736.0 5701.0 5701.0 5650.0 5600.0 5600.0 5500.0 5400.0 5300.0 5200.0 5100.0 5000.0 4900.0 4800.0 4700.0 4600.0 4500.0 4400.0 4300.0 4200.0 4100.0
1.02000 1.02000 2.60000 2.60000 2.90000 2.90000 3.38076 3.37906 3.37688 3.37471 3.37471 3.37091 3.36710 3.36330 3.35950 3.43578 3.46264 3.48951 3.51639 3.54325 3.72378 3.78678 3.84980 3.91282 3.97584 3.97584 3.98399 3.99214 4.38071 4.41241 4.44316 4.44317 4.50372 4.56307 4.62129 4.67844 4.73460 4.78983 4.84422 4.89783 4.95073 5.00299 5.05469 5.10590 5.15669 5.20713 5.25729
1.560 0.000
15.869 0.000
13.818 0.000
26.623 33.921 33.685 0.000
58.383 57.669 56.960 56.254 0.000
73.258 72.748 72.230 71.702 0.000
83.421 83.400 83.344 83.256 0.000
57.945 57.359 0.000
90.762 88.027 0.000
173.161 169.215 165.176 161.058 156.869 152.621 148.325 143.989 130.023 135.234 130.833 126.426 122.021 117.625 113.243
5974.200 5972.640 5972.640 5956.771 5956.771 5942.953 5942.953 5916.330 5882.409 5848.724 5848.724 5790.341 5732.672 5675.712 5619.458 5619.458 5546.201 5473.453 5401.223 5329.521 5329.521 5246.099 5162.699 5079.354 4996.099 4996.099 4938.154 4880.795 4880.795 4790.033 4702.006 4702.006 4528.845 4359.630 4194.454 4033.396 3876.527 3723.905 3575.581 3431.592 3291.969 3156.734 3025.901 2899.475 2777.455 2659.830 2546.587
42.192 0.000
428.205 0.000
371.612 0.000
713.154 903.543 891.587
0.000 1531.873 1496.283 1461.353 1427.019
0.000 1834.339 1794.926 1755.876 1717.172
0.000 1966.289 1932.878 1898.957 1864.631
0.000 1278.777 1250.499
0.000 1949.111 1856.879
0.000 3556.332 3351.201 3152.302 2959.895 2774.141 2595.240 2423.294 2258.383 2100.552 1949.779 1806.076 1669.385 1539.631 1416.725 1300.533
80286.400 80244.208 80244.208 79816.003 79816.003 79444.391 79444.391 78731.237 77827.694 76936.107 76936.107 75404.234 73907.952 72446.598 71019.579 71019.579 69185.240 67390.314 65634.438 63917.266 63917.266 61950.978 60018.100 58119.143 56254.512 56254.512 54975.735 53725.236 53725.236 51776.126 49919.246 49919.246 46362.914 43011.713 39859.411 36899.516 34125.375 31530.135 29106.841 26848.458 24747.907 22798.128 20992.051 19322.667 17783.035
16366.310 15065.777
0.000 0.301 0.301 3.369 3.369 6.051 6.051
11.244 17.900 24.555 24.555 36.203 47.850 59.500 71.151 71.151 86.546
102.086 117.771 133.601 133.601 152.340 171.412 190.816 210.551 210.551 224.498 238.480 238.480 260.941 283.099 283.099 327.829 373.094 418.886 465.200 512.034 559.390 607.272 655.688 704.651 754.177 804.289 855.012 906.379 958.429
1011.207
982.108 982.778 982.778 983.871 983.871 984.499 984.499 984.924 985.494 986.091 986.091 987.201 988.398 989.682 991.056 991.056 992.606 994.187 995.799 997.445 997.445 998.485 999.419
1000.250 1000.977 1000.977 1001.478 1002.036 1002.036 1001.237 1000.466 1000.466 998.981 997.602 996.366 995.312
994.483 993.925 993.687 993.821 994.386 995.445 997.068 999.330
1002.317 1006.122 1010.848

Le-vel Radius Density Mass of
shell Mass
Within Radius
Moment of
Inertia
Moment within Radius
Pressure Gravity
No. km g/cm3 1024 g 1024 g 1040 g.cm2
1040 g.cm2 k bar cm/sec2
47 46 45 44 43 42 41 40 39 38 37 36 35 34 33 32 31 30 29 28 27 26 25 24 23 22 21 20 19 18 17 16 15 14 13 12 11 10 9 8 7 6 5 4 3 2 1
4000.0 3900.0 3800.0 3700.0 3630.0 3630.0 3600.0 3500.0 3480.0 3400.0 3300.0 3200.0 3100.0 3000.0 2900.0 2800.0 2700.0 2600.0 2500.0 2400.0 2300.0 2200.0 2100.0 2000.0 1900.0 1800.0 1787.5 1700.0 1600.0 1500.0 1400.0 1300.0 1221.5 1221.5 1200.0 1100.0 1000.0 900.0 800.0 700.0 600.0 500.0 400.0 300.0 200.0 100.0
0.0
5.30724 5.35706 5.40681 5.45657 5.49145 5.49145 5.50642 5.55641 5.56645 5.60987 5.66415 5.71843 5.77270 5.82698 5.88126 5.93553 5.98981 6.04409 6.09837 6.15264 6.20692 6.26120 6.31547 6.36975 6.42403 6.47831 6.48509 6.52703 6.88649 7.03784 7.09459 7.15135 7.17442 9.17442 9.18575 9.23583 9.28155 9.32293 9.35994 9.39260 9.42091 9.44486 9.46446 9.47970 9.49059 9.49712 9.49821
108.883 104.551 100.252
96.165 97.178 0.000
40.991 133.753
26.206 103.008 124.609 119.888 115.074 110.181 105.224 100.217
95.175 90.114 85.047 79.991 74.959 69.966 65.027 60.157 55.371 50.684 6.011
40.089 42.168 38.415 34.270 30.164 20.910 0.000 6.107
25.837 21.805 18.064 14.629 11.519 8.747 6.332 4.287 2.625 1.360 0.505 0.073
2437.704 2333.152 2232.900 2136.734 2039.557 2039.557 1998.565 1864.812 1838.606 1735.599 1610.990 1491.103 1376.028 1265.847 1160.623 1060.406 965.230 875.116 790.069 710.079 635.120 565.154 500.126 439.969 384.598 333.914 327.903 287.814 245.646 207.231 172.961 142.798 121.888 121.888 115.781 89.944 68.139 50.076 35.447 23.928 15.181 8.850
4.563 1.938 0.578 0.073 0.000
1190.942 1087.797 990.939 901.775 870.342 0.000 357.133 1124.123 212.793 812.820 932.622 844.543 761.536 683.611 610.764 542.954 480.106 422.134 368.916 320.318 276.181 236.328 200.573 168.709 140.521 115.786 12.893 81.349 76.653 61.633 48.130 36.733 22.193 0.000 5.969 22.851 16.087
0.919 7.086 4.351 2.488 1.294 0.591 0.222 0.061 0.009
0.000
13874.835 12787.039 11796.100 10894.325 10023.983 10023.983 9666.850 8542.727 8329.934 7517.114 6584.492 5739.949 4978.413 4294.802 3684.038 3141.084 2660.978 2238.844 1869.928 1549.610 1273.429 1037.100
836.527 667.819 527.298 411.511 398.618 317.269 240.617 178.984 130.854
94.121 71.928 71.928 65.959 43.108 27.021 16.102 9.016 4.665 2.176 0.882 0.291 0.069 0.009 0.000 0.000
1064.767 1119.172 1174.494 1230.814 1270.565 1270.565 1287.573 1344.157 1355.440 1400.496 1456.591 1512.369 1567.772 1622.740 1677.213 1731.131 1784.433 1837.060 1888.951 1940.047 1990.291 2039.628 2088.003 2135.368 2181.678 2226.896 2232.456 2270.939 2314.824 2358.655 2401.336 2442.566 2473.835 2473.835 2484.512 2532.405 2576.798 2617.562 2654.582 2687.749 2716.972 2742.182 2763.336 2780.457 2793.727 2804.037 2805.297
1016.614 1023.550 1031.804 1041.459 1032.803 1032.803 1028.983 1015.767 1013.037 1001.813 987.097 971.634 955.430 938.499 920.853 902.508 883.483 863.802 843.490 822.582 801.116 779.142 756.721 733.934 710.878 687.677 684.776 664.522 640.272 614.564 588.826 563.807 545.091 545.091 536.500 496.000 454.664 412.515 369.568 325.841 281.380 236.210 190.294 143.683 96.419 48.710 0.000

The earth has a mass of 5121.820×1024 g, a moment of inertia of 76126.841×1040
g.cm2, an average density of 4.7284 g/cm3, a density of 9.49821 g/cm3 and the
pressure of 2805.297 kbar at earth's center. Each reduced values of the earth's data from
that of the current earth are due to the existence of the dark planet within the interior of
the earth. The dark planet has a radius of 3700.375 km, a moment of inertia of
4159.559×1040 g.cm2, an average density of 4.0161 g/cm3, and a mass of 852.380×1024
g about 1.33 times of Mars. The data of the new earth model compares with that of the
current earth and the PREM as listed in Table 8.
Table 8. The data of the new earth model compared with the data of the current earth and the PREM.
Data of planet Radius Mass Inertia of
moment Average density
Center density
Center pressure
Coeffi- cient
Unit km 1024 g 1040 g.cm2 g/cm3 g/cm3 k bar
PREM and current earth 6371.000 5974.200 80286.400 5.515 13.08848 3638.524 0.3309
Earth planet 6371.000 5121.820 76126.841 4.7284 9.49821 2805.297 0.3662
Dark planet 3700.375 852.380 4159.559 4.0161 7.96097 1115.272 0.3564
The density of the earth's center is 9.49821 g/cm3, which is much lower than
13.08848 g/cm3 of the PREM. Its pressure is 2805.297 kbar, which is also much lower
than 3638.524 kbar of the PREM. The composition of the inner core is generally
believed to be dominantly iron with a small amount of alloyed nickel. From the
pressure-density Hugoniot data for Fe, the density of iron under 2805.297 kbar of
pressure is about 12.7g/cm3 [Ahrens, 1980], which is much greater than that of the new
earth model by about 25 %. The inner core is not pure iron but contains a significant
fraction of light components [Ringwood, 1984; Jephcoat & Olson, 1987], and that
explains why the density of the inner core is so much smaller than the current value. So,
we may agree the composition of the inner core is dominantly iron, alloyed with a small
amount of nickel and also combined with a significant amount of oxides.
Ⅴ. Acknowledgements
I am grateful to Dr. Lin-Gun Liu of Research School of Earth Science in
Australian and Dr. Hsueh-Wen Yeh of Hawaii Institute of Geophysics for constructive
criticisms and helpful comments.

Ⅵ. Discussion Based on the results of this study, we infer that the solid rock in the lower mantle
and the liquid molten rock or magma in the outer core change states interactively, and
the density distribution are continuous at the CMB. A great amount of the produced
heat due to chemical reaction in the F zone and solidification at the ICB and the CMB
become the geodynamo of a great convection cell, a circulation of magma and solid or
molten rock migrating up to the crust and down to the F zone of the outer core and
causes the topography of the core. The study introduces a new earth model which
should solve many inexplicable problems of the earth, such as the density jump at the
CMB, the core-mantle chemical equilibrium, the thermodynamic equilibrium of the
inner and outer core, the geomagnetic secular variation and the Chandler wobble. Some
improvements and refinements of the new earth model can be accomplished with the
existing data. The anomalous properties of the CMB and the ICB are new sources of
information that should impose important constraints on the short-term and long-term
dynamic behavior of the core.
The fine structure of the CMB is not well known, but it contains information
important to the geodynamic processes in the mantle or in the magnetic field generated
in the outer core [Dziewonski & Woodhouse, 1987]. Approaching the Problem of the
CMB, Creager and Jordan studied travel-time anomalies of PKiKP and PKPAB and
corrected for the mantle structure onto a region in the vicinity of the CMB [Creager &
Jordan 1986]. They considered three hypotheses with regard to the source of anomalies:
(1) the thin, heterogeneous D" region above the CMB, (2) perturbations in the CMB
topography, and (3) a thin, highly heterogeneous layer below the CMB. Researchers
agree that is inconsistent with the data. Their data cannot distinguish between (2) and
(3), and a reason for rejection of (2) is that core topography in excess of 10 km is
considered unlikely. Morelli and Dziewonski reported that (3) should be rejected as the
cause of the travel-time anomalies entering the core [Morelli and Dziewonski 1987].
But based on the great convection cell, which is the flowing matter migrating up to the
crust and down to the F zone, a relief of the core in excess of 10 km in (2) provided by
the three-dimensional maps should be accepted, and the secular variation of magnetic
fields are from the flowing fluid due to the tangentially geostrophic and toroidal flows
in the F zone.
From the simplification method, the new earth model, and the mass, density and
radius of the dark planet, can be mathematically determined, with the results serving as
an indirect proof of the existence of dark matter which locates in another cosmos of the

universe. The dark planet inside the earth cannot be detected directly. If the Chandler
wobble is analyzed in detail, it may be figured out. A more precise method of
calculation can be used to figure out the data of the new earth model, but the differences
of data between the precise and the approximate would be ≦ |10-3|, adopted from
the data of Table 2.
Superstring theory has the positive figures of its fabulously largest of symmetries
and miraculous cancellations of all the potential anomalies and divergences in quantum
field theory. It provides a unifying description of elementary particles and forces of
nature. But it has been pointed out by critics that the model has shortcomings and
potential theoretical problems [Kaku, 1988] as follows:
1. It is impossible experimentally to reach the tremendous energies found at the scale
of this theory.
2. The theory predicts that the energy scale is from 100 GeV over the next 17 orders of
magnitude, which is unheard of in the history of science.
3. The theory does not explain why the cosmological constant is zero.
4. It is hard to select the correct way from apparently thousands of ways to break down
the theory to low vacuum energies.
5. No one really knows how to break a ten-dimensional theory down to four dimensions.
Of these five objections to the model, the most fundamental is the last ─ the
inability to calculate dimensional breaking. This is why the search for the geometry
underlying the theory is so important. The geometric formulation of the model may
give us the key insight into the model that will allow us to make definite predictions
with the theory. After studying the existence of the dark planet in the earth's interior,
we should be able to confirm the three-cosmic structure in the universe. If the
mathematicians and physicists take the geometric framework of ten-dimensional space-
time in three cosmoses of the universe as a new way to explore Superstring theory, they
should complete it successfully in a short period of time.
From the application of the ten-dimensional space-time and the Supersymmetry of
Superstring theory, we infer that the structure of the universe has three cosmoses, but
that still needs to be proved by the outcomes of physicists' research. To demonstrate the
three-cosmic structure of the universe from the existence of the missing neutrinos, we
can plan a project of investigating anti-neutrino to observe another kind of neutrino
which is emitted from nuclear plants.

References Altshuler, L. V. and Sharipdzhanov, L. V., 1971; On the distribution of iron in the
Earth and the chemical distribution of the latter. Bull. Acad. Sci. USSR,
Geophys. Ser., 4: 3-16.
Ahrens, T. J., 1980; Dynamic Compression of Earth Materials. Science 207: 1035.
Birch, F., 1952; Elasticity and constitution of the earth's interior. J. Geophys. Res.,
57: 227.
Bloxham, J. and Gubbins, D. 1987; Thermal core-mantle interactions. Nature, 325:
511-513.
Bloxham, J. and Jackson, A., 1990; Lateral temperature variations at the core-
mantle boundary deduced from the magnetic field. Phys.Rev. Lett., Vol. 17,
No. 11, 1997-2000.
Blumenthal, G. R., Faber, S. M., Primack, J. R. and Rees, M. J., 1984; Formation of
galaxies and large-scale structure with cold dark matter. Nature, 311: 517-525.
Bolt, B. A., 1972; The Chemistry of the Earth's Core from Seismological Evidence.
EOS., Vol. 53, No. 5, 599.
Bolt, B. A. and Qamar, A., 1970; Upper bound to the density jump at the boundary
of the earth's inner core. Nature, 228: 148-150.
Buchbinder, G. G., 1968; Properties of the Core-Mantle Boundary and
Observations of PcP. J. Geophys. Res., 73: 5901.
Buchbinder, G. G., Wright, C. and Poupinet, G., 1973; Observations ofPKiKP at
distances less than 110. Bull. Seismol. Soc. Am., 63: 1699-1707.
Bullen, K. E., 1940; The problem of the earth's density variation. Bull. Seismol. Soc.
Am., 30: 235-250.
Chandler, S., 1891; On the variation of latitude. Astronomical Journal, 11: 83.
Cormier, V. F., 1981 ; Short-period PKP phases and the an elastic mechanism of
thinner core. Phys. Earth Planet. Inter., 24: 291-301.
Creager, K. C. and Jorden, T. H., 1986; A spherical structure of the core-mantle
boundary from PKP travel time. Geophys. Res. Lett., 13: 1497-1500.
Derr, J. S., 1969; Internal Structure of the Earth Inferred from Free Oscillations.
J. Geophys. Res., 74: 5202.
Dziewonski, A. M. and Anderson, D. L., 1981; Preliminary Reference Earth Model.
Phys. Earth Planet. Inter., 25: 297.
Dziewonski, A. M. and Woodhouse, J. H., 1987; Global Images of the Earth's

Interior. Science, 236: 37-48.
Engdahl, E. R., Flinn, E. A. and Romney, C. F., 1970; Seismic waves reflected from
the Earth's inner core. Nature, 228: 852-853.
Engdahl, E. R., Flinn, E. A. and Masse, P., 1974; Differential PKiKPtravel times and
the radius of the inner core. Geophys. J. R. astr. Soc., 39: 457-463.
Garland, G. D., 1979; Introduction to Geophysics. 2nd ED., W. B. Saunders Company,
Toronto, Canada. 4-8, 28-30, 44-46, 130, 387-389.
Gubbins, D. and Richards, M. A., 1986; Coupling of the core dynamoand mantle:
Thermal or Topography? Physical Review Letters, 13: 1521-1524.
Gundmundsson, O., Clayton, R. W. and Anderson, D. L., 1986; CMB topography
inferred from ISC PcP travel times. Eos, Trans. AGU, 67: 1100.
Hall, N., 1991; May the forces be unified with Supersymmetry. New Scientist, 6
April 11.
Hall, T. H. and Murthy, V. R., 1972; Comments on the Chemical Structure of an Fe-
Ni-S Core of the Earth. EOS., Vol. 53, No. 5, 602.
Jeanloz, R., 1990; The nature of the earth's core. Annu. Rev. Earth Planet. Sci., 18:
357-386.
Jeanloz, R. and Ahrens, T. J., 1980; Equations of FeO and CaO. Geophys. J. R. Astr.
Soc, 62: 505-528.
Jeanloz, R. and Wenk, H. R., 1988; Convection and anisotropy of the inner core.
Geophys. res. lett., 15: 72-75.
Jephcoat, A. and Olson, P., 1987; Is the Inner Core of the Earth Pure Iron? Nuture,
325: 332-335.
Kaku, M., 1988; Introduction to Superstrings. Springer Verlag New York Inc., New
York, USA. 16-18 .
Knopoff, Leon, 1965; a preeminent seismology, Phys. Rev., 138: A 1445.
Lay, T., 1989; Structure of the Core-Mantle Transition Zone: A Chemical and
Thermal Boundary Layer. Eos, Vol. 70, No. 4, Jan. 24, 49, 54-55, 58-59.
Lial, J. A. and Cormier, V. F., 1980; Seismic waves at the Epicenter's antipodes. J.
geophys. Res., 91: 10203-10228.
Lyttleton, R. A., 1973; The end of the iron-core age. Moon, 7: 422-439.
Lubin, P. M., Bond, J. R., Efstathiou, G. and Meinhold, P. R., 1991; Cosmic-Structure
Constraints from a One-Degree Microwave-Back-ground Anisotropy
Experiment. Physical Review Letters, 66: 2179- 2182.

McQueen, R. G., Marsh, S. P., Taylor, J. W., Fritz, J. N. and Carter, W. J., 1970; The
equation of state of solids from shock wave studies, in high velocity impact
phenomena. Kinslow, R., Academic Press, New York, 294-419.
Morelli, A. and Dziewonski, M., 1987; Topography of the core-mantle boundary
and lateral homogeneity of the liquid core. Nature, 325: 678-683.
Ramsey, W. H., 1948; On the constitution of the terrestrial planets. Mon. Not. Roy.
Astron. Soc., 108: 406-413.
Ringwood, A. E., 1977; Composition of the Core and Implications for Origin of the
Earth. EOS., Vol. 58, No. 6, 519.
Ringwood, A. E., 1984; The Earth's Core: its composition, formation and bearing
upon the origin of the Earth. Proc. R. Soc. A, 395: 1-46.
Ruff, L. and Anderson, D. L., 1980; Core formation, evolution, and convection: A
geophysical model. Phys. Earth Planet. Inter., 21: 181-201.
Shearer, P. and Masters, G., 1990; The density and shear velocity contrast at the
inner core boundary. Geophys. J. Int., 102: 491-498.
Solomon, S. C., 1972; Seismic-wave attenuation and partial melting in the upper
mantle of North America. J. Geophys. Res. 77: 1483-1502.
Souriau, A. and Souriau, M., 1989; Ellipticity and density at the inner core boundary
from subcritical PKiKP and PcP data. Geophys. J. Int., 98: 39-54.
Stevenson, D. J., 1987; Limits on lateral densiy and velocity variations in the
Earth's outer core. Geophys. J. R. astr. Soc., 88: 311-319.
Woodhouse, J. H. and Dziewonski, A. M., 1989; Seismic modelling of theearth's
large-scale three-dimensional structure. Phil. Trans. R. Soc. Lond. A 328: 291-
308.
Young, C. J. and Lay, T., 1987; The core-mantle boundary. Ann. Rev. Earh Planet.
Sci., 15: 25-46.

地球新模式的重建和內部黑暗物質的發現 何顯榮 著
摘 要 根據幾位地球科學家與一般理論不同意見和外核面呈高於十公里的起伏,以
重新修訂地球模式。依據本文分析所得結論,外核化學組成和深部地函相似,且
密度分布呈連續性,下部地函和外核之間的成分,僅是固態岩石和液態熔岩的物
態變化而已。在外核黏滯性低的過渡區,其組成熔岩的各種氧化物和較活潑的金
屬元素,產生氧化還原化學反應,重力分離和熔岩西流等作用,使富有氧化鐵成
分的熔岩部分被還原為金屬鐵,與少量鎳鎔成合金,挾帶許多金屬氧化物一起沉
入內核凝結為固態。其氧化還原時所產生的化學反應熱和在內、外核面凝結或熔
解時所釋放的凝固熱或熔解熱,成為從外核過渡區到地殼之間一貫性大型對流囊
的動力源。根據這種地球新模式,計算地球質量和轉動慣量,得到地球質量僅為
5121.82×1024 g,與其實際地球觀測值比較,約為現行地球質量的 85.73 %。 引用超越相對論的現代最新物理學理論──弦論,其立論基礎在宇宙含有十
維時空特性和超對稱性,和近代天文物理學者對宇宙含有 90 %以上失蹤質量,稱為黑暗物質的詮釋,根據太陽僅發射約三分之一微中子到達地球,其餘失蹤的
現象,和地軸有錢德勒擺動疑團的事實,假設將超弦理論的宇宙九維空間分為三
重三維空間,和共有的一維時間,形成大宇宙有三重宇宙的結構,而我們所賴以
生存的宇宙僅是大宇宙的三分之一而已。依據此種宇宙構造,將其餘地球 14.27%的失蹤質量和不足的轉動慣量,看作是黑暗物質的質量和轉動慣量,推算黑暗物
質的半徑,結果得到地球內部有一黑暗物質的行星,其半徑為 3700.375 km,質量為 852.38×1024 g,約為火星的 1.33倍,存在另一重宇宙中。
優秀論文證書