reconstructing and counting genomic fragments through
TRANSCRIPT

1
Vol.:(0123456789)
Scientific Reports | (2021) 11:18907 | https://doi.org/10.1038/s41598-021-97852-w
www.nature.com/scientificreports
Reconstructing and counting genomic fragments through tagmentation‑based haploid phasingPatrick P. T. Leong1*, Aleksandar Mihajlović1,2*, Nadežda Bogdanović3, Luka Breberina4 & Larry Xi1*
Single‑cell sequencing provides a new level of granularity in studying the heterogeneous nature of cancer cells. For some cancers, this heterogeneity is the result of copy number changes of genes within the cellular genomes. The ability to accurately determine such copy number changes is critical in tracing and understanding tumorigenesis. Current single‑cell genome sequencing methodologies infer copy numbers based on statistical approaches followed by rounding decimal numbers to integer values. Such methodologies are sample dependent, have varying calling sensitivities which heavily depend on the sample’s ploidy and are sensitive to noise in sequencing data. In this paper we have demonstrated the concept of integer‑counting by using a novel bioinformatic algorithm built on our library construction chemistry in order to detect the discrete nature of the genome.
In recent years, attention has been extended from exonic single nucleotide variations to underlying copy number variations of genes1. It has been postulated that gene copy number variation is a result of a cellular response intended to increase survivability under stress inducing conditions. Such copy number changes can either pro-mote survival of the cell under adverse conditions, or can induce abnormal behavior resulting in carcinogenesis, metastasis, or drug resistance2–6. The dynamics and heterogeneity of genomic copy number changes in response to adverse stresses has been the focus of many investigations to elucidate the forces that shape genomes in eukaryotic cells and likely influence karyotypic evolution in cancer cells4–7.
Traditionally, molecular cytogenetic techniques such as fluorescence in situ hybridization (FISH) and spec-tral karyotyping (SKY) are the chosen methods to determine discrete gene copy numbers8,9. However, these techniques suffer from low throughput, low resolution, high labor cost, and often higher error rates10. More recently, several NGS and NGS-based single-cell DNA sequencing technologies with improved throughput have been reported11. The copy number of the genes are calculated in secondary analyses by binning the number of mapped reads across the genome, grouping the bins into segments of similar quantities, then using these non-integer values and statistical methods to infer a discrete copy number for each segment. The performance of these algorithms are reported to be impacted to their tuning parameters, sequencing noise, and the ploidy of genomes. As a result, the precision can range from 0 to 90% in the worst cases using simulated data12. Previ-ously, we published a novel single-cell DNA sequencing scheme13,14, dubbed Barcodes_in_Genome_sequencing (BIGseq), which has the potential to detect the integer copy numbers at single base resolution. In order to reach that potential, the coverage of every haploid molecule in the single cell library needs to be high enough and a secondary analysis algorithm can process the library data properly. In this work, we have improved the median coverage to 79% for every haploid DNA molecule at less than 8 × sequencing depth. We have also developed a novel secondary analysis algorithm to reconstruct every haploid DNA molecule by piecing together fragments based on the unique deterministic nature of library construction. In this paper, we demonstrate that the number of DNA molecules in a vessel can be reliably counted in integers, demonstrating the feasibility to count discrete gene copy numbers within single cells.
OPEN
1Digenomix Corp, Hayward, CA, USA. 2Department of Informatics, Technische Universität München, Munich, Germany. 3Faculty of Mathematics, University of Belgrade, Belgrade, Serbia. 4Faculty of Chemistry, University of Belgrade, Belgrade, Serbia. *email: [email protected]; [email protected]; [email protected]

2
Vol:.(1234567890)
Scientific Reports | (2021) 11:18907 | https://doi.org/10.1038/s41598-021-97852-w
www.nature.com/scientificreports/
MethodsConstruction of Tn5 transpososome. In order to overcome the limitation that Nextera transpososome can only recover 50% of tagmented fragments at maximum15,16, we constructed a Tn5 transpososome with iden-tical transposomes ends by loading transposase (Cat. No. EMQZ1422) from Creative Biogene, Shirley, NY, with a single duplex formed by NEX8a (5′-CAG AGA TGT GTA TAA GAG ACAG-3′) and Tn5Up (5′-Phos-CTG TCT CTT ATA CAC ATC T-3′) according to the protocol provided by the manufacturer. This transpososome was let to sit at 4 °C overnight before it was used for library construction.
Construction of primary library, library amplification, and sequencing. The constructed trans-pososome was used to tagment about 3 femtograms of yeast genomic DNA (ATCC Cat. No. 9763), which was serially diluted from a stock of 6 ng/μL, to generate a primary library13. The transposase was removed from DNA by Protease K (New England Biolabs, Cat. No. P8107S) treatment and then Protease K was denatured by heat. The primary library was sequentially amplified by Phusion Hot Start II High-Fidelity PCR Master Mix (Thermo Fisher Scientific Cat. No. F565L) with NEX8a for three cycles, and then together with Illumina Read1 (5′-TCG TCG GCA GCG TCA GAT GTG TAT AAG AGA CAG-3′) and Read2 (5′GTC TCG TGG GCT CGG AGA TGT GTA TAA GAG ACAG-3′) primer pair for 20 cycles, both with 30-min extension time at 65 °C. The amplified library was cleaned with AMPure (Beckman Coulter Cat. No. A63882) beads twice and eluted in 20 μL 10 Tris buffer, 8 μL of the eluents was taken to be barcoded in a 20 μL reaction in 6 cycles. The barcoded libraries were cleaned with AMPure beads twice and loaded onto MiSeq (Illumina, Cat. No. MS-102-3001) for sequencing 80 bases for Read1 and 70 bases for Read2, after quantitation following the manufacturer’s protocol14.
Adapter trimming. The MiSeq output files were first passed through the Illumina primary analysis pipeline to remove the majority of the primer and adapter sequences. The resulting paired-end FASTQ files were evalu-ated for the percentage of reads from yeast genome relative to other known genomes using FastQ Screen (https:// www. bioin forma tics. babra ham. ac. uk/ proje cts/ fastq_ screen/). This served as a check for yield and contamina-tion. The same FASTQ files were sent through Trim Galore (http:// www. bioin forma tics. babra ham. ac. uk/ proje cts/ trim_ galore/), which used Cutadapt (https:// cutad apt. readt hedocs. io/ en/ stable/ index. html)17 and FastQC (https:// www. bioin forma tics. babra ham. ac. uk/ proje cts/ fastqc/) as software engines, for removal of any remain-ing Illumina Read 1 and Read 2 primer adapters. The Trim Galore stringency for adapter matching was set at 15 bp (default 1); minimum Phred score was set at 20 (default); and any read shorter than 25 bp after quality or adapter trimming was discarded. All other Trim Galore parameters were at their default values.
Mapping. The Trim Galore processed read sequences in FASTQ format were mapped to the reference yeast genome (GenBank assembly accession: GCA_000146045.2) using the BOWTIE2 aligner18 with default param-eters except the maximum fragment length for valid paired-end alignment (-X option) was set at 1000. The aligner generated a raw BAM file. Our in-house Python scripts would reconstructed fragments in BAM format to represent an amplified library (Column 2 of Table 1, the number of reads is shown in Column 4). During this process, two reads would merge if the fragment length was shorter than or equal to 150 bases, while a gap between the two reads was filled in with the reference genome sequences when the fragment length was greater
Table 1. Sample names, file names, and sequencing statistics of BIGseq on fractions of yeast genome DNA.
Sample name Raw BAM fileLibrary-representing BAM file
Total fragments mappable to yeast before dedupe
Fragment number with unique UFI after dedupe
Average duplication rate of fragments
Average length of fragments
Percentage genome covered by fragments
6Y5j 6Y5j_S37_Ckite.bam6Y5j_S37_Ckite_pemerged_deduped.bam
79,567 12,436 6.4 233.8 8.8
6Y5l 6Y5l_S38_Ckite.bam6Y5l_S38_Ckite_pemerged_deduped.bam
103,722 13,930 7.4 233.1 9.2
6Y5n 6Y5n_S39_Ckite.bam6Y5n_S39_Ckite_pemerged_deduped.bam
57,997 12,488 4.6 237.3 8.6
6Y5p 6Y5p_S40_Ckite.bam6Y5p_S40_Ckite_pemerged_deduped.bam
88,350 13,618 6.5 225.0 8.7
6Y6p 6Y6b_S41_Ckite.bam6Y6b_S41_Ckite_pemerged_deduped.bam
28,875 9232 3.1 225.4 6.6
6Y6d 6Y6d_S42_Ckite.bam6Y6d_S42_Ckite_pemerged_deduped.bam
40,055 9984 4.0 220.8 7.1
6Y6f 6Y6f_S43_Ckite.bam6Y6f_S43_Ckite_pemerged_deduped.bam
50,127 9760 5.1 220.7 7.0
6Y6h 6Y6h_S44_Ckite.bam6Y6h_S44_Ckite_pemerged_deduped.bam
48,896 9440 5.2 222.3 6.6

3
Vol.:(0123456789)
Scientific Reports | (2021) 11:18907 | https://doi.org/10.1038/s41598-021-97852-w
www.nature.com/scientificreports/
than the combined read lengths of 150 bases. The file was then deduplicated to remove PCR duplications to rep-resent the primary library (Column 3 of Table 1, the number of reads is shown in Column 5).
Reconstruction DNA molecules. We modified a web browser-based Integrative Genomics Viewer (IGV)19,20 to display how various mapped fragments created during the tagmentation process can be re-assem-bled into their originating DNA molecules by concatenating them at their 9-base overlapping ends, or “junc-tions” as we refer to them. Specifically, the BIGseq algorithm used an exclusivity and greediness approach to re-assemble unique DNA molecules over a given region of the genome: the algorithm started from a fragment mapped to the very 5′ end of the reference genome and scanned towards the 3′ direction looking for an adja-cent fragment that shares a 9-base junction with the first fragment. Once the second fragment was identified, the algorithm semantically joins two fragments to form a contiguous structure referred to as an “island”. The greediness approach would attempt to extend the length of the island as long as there are adjacent fragments that share 9 base junctions with it. In case a third mapped fragment that overlapped with the first island but cannot be joined with the island through 9-base junction, the exclusivity rule would assign the third fragment to a new molecule. Then, the algorithm would continue to the next fragment downstream and apply greediness rule to the existing DNA molecules by packing fragments and islands wherever they were logically possible (more detailed examples in “Results” section).
In‑silico simulation. Additionally, to provide a calibration background on whether certain regions of the genome were more prone to alternative alignments by the sequence aligner, from the yeast reference genome, we simulated a haploid with fixed-size read-pairs of read length 50 bp and insert sizes varied over the range 35–150 bp. Each read had a 9-base overlap with its adjacent neighbors. We then used the same BOWTIE2 aligner to map back these simulated reads. The read length and insert size range was intentionally kept small to test the ability of the aligner to correctly map the reads. If there was no simulated read being mis-mapped over a specific region of the genome, this gave us confidence that the real sample reads being mapped there were correctly mapped.
Base preferences at junctions. Overlapping sequences with 8-, 9-, and 10-bases and their surrounding sequences were extracted and analyzed at the sequence logo site for the relative frequencies of every base at every position (https:// weblo go. berke ley. edu/ logo. cgi).
ResultsHigh coverage and specific mapping lead to the identification of archipelagos reflecting input DNA. Integer counting of haploids in BIGseq is based on the deterministic property of tagmentation: a long stretch of double-stranded DNA can generate only one unique pattern upon tagmentation. The pattern can be determined bioinformatically as long as each fragment is mapped accurately and the junctions, 9-base overlaps between fragments created by transpososomes21,22, is identified correctly.
When mapping in-silico generated reads, we discovered 3% of these reads were mismapped by the BOWTIE2 aligner. Such mismapped reads typically landed to some specific locations of the genome. For comparison, a significantly higher percentage of reads were found to be mismapped by BWA-MEM aligner23. Thus, BOWTIE 2 was selected for our work.
Table 1 summarizes the names, corresponding files, and key parameters of the actual yeast samples. The aver-age lengths of fragments are slightly over 220 bases. The duplication rate, which is defined as the ratio between the total fragment number and the fragment number with unique fragment index (UFI)13, is between 3.1 and 7.4. The percentage of the genome covered by the fragments of each library ranges from 6.6 to 9.2%.
The sequencing files were visualized on the modified web browser-based IGV19,20. We observed that most of the reads were in clusters, which we call archipelagos, while nearly 90% of genome regions were almost blank (Fig. 1a), with scattered lonely fragments that consisted of 10% of total deduplicated fragments and covered less than 1% of the blank regions of the entire genome. We manually inspected every one of the solo fragments. Most, if not all, were smaller than two hundred bases, and do not have a possible second mapping site. We hypothesize that they were from low-level cross-contamination. Because the frequency of these fragments was very low and their appearance in all the samples was randomly distributed, their existence did not significantly affect our data processing on archipelagos.
Figure 1a is a screenshot of a representative archipelagos, presented in blue bars, of sample 6Y5j of all chromo-somes excluding mitochondrial DNA. 9.3% of genome was covered by 129 archipelagos, ranging from 1 to 30 Kb, with a median size of 7.9 Kb and a median coverage of 79%. We found that the average GC% of all archipelagos was indistinguishable from that of blank regions outside the archipelagos, and the average GC% of the library-covered regions was indistinguishable from that of uncovered regions within archipelagos, suggesting low GC bias in the library construction process. The high coverage rates within archipelagos foretell that there is a low chance that we might missed any archipelagos. Figure 1b–e depict a representative result of a library-representing file. The whole Chr XII/NC_001144.5 in BED format is displayed in Panel B, with nine archipelagos shown in blue bars. Among these nine archipelagos, a 19-Kb archipelago located in the region Chr XII/NC_001144.5) of 755,960–775,121 is zoomed in Panel C using a BAM file. This archipelago was made of a total of 75 fragments, with 36 junctions. One of the junctions is zoomed in Panel D. An in-silico mapping simulation of random tag-mentation of a haploid covering the same region as Panel C is exhibited in Panel E. A perfect tiling pattern of this simulation is conspicuous, and it serves as an indicator of high specificity in mapping.

4
Vol:.(1234567890)
Scientific Reports | (2021) 11:18907 | https://doi.org/10.1038/s41598-021-97852-w
www.nature.com/scientificreports/
Figure 1. Archipelagos identified in sample 6Y5j. (a) Distribution of identified archipelagos (dark blue bar) is displayed for 16 chromosomes of 6Y5j. The size of each chromosome is labelled with a light blue line above the coordinate. (b) Archipelagos of Chr XII/NC_001144.5 are presented. (c) An archipelago in the region of Chr XII/NC_001144.5 755,960–775,121 is zoomed in to show fragments after deduplication. (d) The 9-base junction and its surrounding regions between Fragments 2 and 3 in (c) are further zoomed in. (e) Simulation of tagmentation of the same genome region as in (c) are presented to show the perfect tiling. The graphs were generated with Microsoft PowerPoint and IGV (https:// softw are. broad insti tute. org/ softw are/ igv/).
5
Vol.:(0123456789)
Scientific Reports | (2021) 11:18907 | https://doi.org/10.1038/s41598-021-97852-w
www.nature.com/scientificreports/
Improved junction identification by trimming remaining primer sequences. Trim Galore (https:// github. com/ Felix Krueg er/ TrimG alore) identified about 0.1% of the FASTQ reads output from the Illu-mina primary processing pipeline still having remnant primer sequences and hence trimmed them. It also rec-ognized that no more than 0.5% of the reads had Phred score less than 20 and they were discarded. Since we set the Trim Galore’s stringency for adapter matching to a minimum of 15 bases to avoid false positives, it is possible that some small pieces of the primer sequence still remain attached to the reads. Indeed we identified 12 cases of missed junctions resulting from incomplete removal of primer sequences. A case in point is the 12-base overlap presented at Chr XIV/NC_001146.8: 658,350–658,629. Of these 12 bases, only 9 bases truly overlap, while the three bases at the very 5′ end of the downstream fragment, CAG, are not shared with the upstream fragment, nor are they present in the reference genome (Fig. S1). This subsequence was identified to be the last three bases of primers used in PCR and it was removed to restore the real junction.
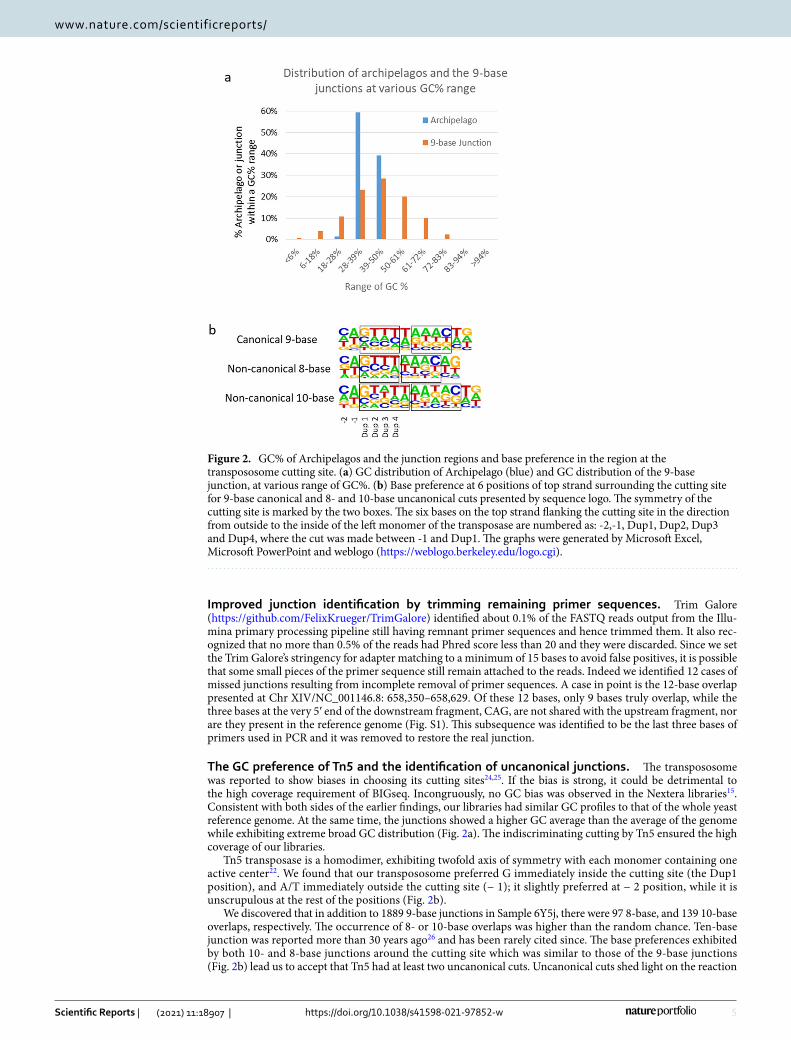
The GC preference of Tn5 and the identification of uncanonical junctions. The transpososome was reported to show biases in choosing its cutting sites24,25. If the bias is strong, it could be detrimental to the high coverage requirement of BIGseq. Incongruously, no GC bias was observed in the Nextera libraries15. Consistent with both sides of the earlier findings, our libraries had similar GC profiles to that of the whole yeast reference genome. At the same time, the junctions showed a higher GC average than the average of the genome while exhibiting extreme broad GC distribution (Fig. 2a). The indiscriminating cutting by Tn5 ensured the high coverage of our libraries.
Tn5 transposase is a homodimer, exhibiting twofold axis of symmetry with each monomer containing one active center22. We found that our transpososome preferred G immediately inside the cutting site (the Dup1 position), and A/T immediately outside the cutting site (− 1); it slightly preferred at − 2 position, while it is unscrupulous at the rest of the positions (Fig. 2b).
We discovered that in addition to 1889 9-base junctions in Sample 6Y5j, there were 97 8-base, and 139 10-base overlaps, respectively. The occurrence of 8- or 10-base overlaps was higher than the random chance. Ten-base junction was reported more than 30 years ago26 and has been rarely cited since. The base preferences exhibited by both 10- and 8-base junctions around the cutting site which was similar to those of the 9-base junctions (Fig. 2b) lead us to accept that Tn5 had at least two uncanonical cuts. Uncanonical cuts shed light on the reaction
Figure 2. GC% of Archipelagos and the junction regions and base preference in the region at the transpososome cutting site. (a) GC distribution of Archipelago (blue) and GC distribution of the 9-base junction, at various range of GC%. (b) Base preference at 6 positions of top strand surrounding the cutting site for 9-base canonical and 8- and 10-base uncanonical cuts presented by sequence logo. The symmetry of the cutting site is marked by the two boxes. The six bases on the top strand flanking the cutting site in the direction from outside to the inside of the left monomer of the transposase are numbered as: -2,-1, Dup1, Dup2, Dup3 and Dup4, where the cut was made between -1 and Dup1. The graphs were generated by Microsoft Excel, Microsoft PowerPoint and weblogo (https:// weblo go. berke ley. edu/ logo. cgi).

6
Vol:.(1234567890)
Scientific Reports | (2021) 11:18907 | https://doi.org/10.1038/s41598-021-97852-w
www.nature.com/scientificreports/
mechanisms of transpososome and the inclusion of uncanonical junctions helps credible reconstruction of the input molecules by BIGseq as shown in the following sections.
Reconstruction of mono‑ploidic molecule and identifications of artifacts caused by defective Tn5. The first step of the BIGseq pipeline to reconstruct DNA molecules is to chain neighboring fragments through junctions to form larger contigs, referred to as islands. Then islands and fragments are assigned to each molecule, a process referred as phasing, by following the rules of exclusivity and greediness. Exclusivity requires that any fragment is allowed to belong to only one molecule, and two overlapping fragments must belong to sep-arate molecules unless they share a junction of 8-, 9-, or 10-base. Greediness asks to assign as many islands and fragments as possible to the first molecule, then to the second, then the third, etc., until all islands are exhausted. As each library is derived from a pool of DNA fragments of about 10 kb long and of total quantity of 10% of the genome, the majority of the archipelagos must have been mono-ploid, i.e., most of the archipelagos were made of only one molecule, a case in the point was the 4.8 Kb archipelago located at Chr V/NC_001137.3: 22,504-27,231 (Fig. 3a), this molecule was 82% covered by 20 fragments. The reconstruction process started with chaining 18 fragments into six non-overlapping islands (a–f), then assigning them to Molecule 1. The fragments in islands were depicted in a darker color and arranged alternatively between two lanes in the modified IGV. Lastly, the unchained Fragment 1, shown in a lighter tone, joined islands a–f to complete the reconstruction of Molecule 1. By the rule of exclusivity, Fragment 4 was temporarily set to be the lone candidate for the second molecule.
We noticed that Fragment 4 had a 5′ end identical to Fragment 3, and both shared a 9-base junction with Fragment 2. Analyzing archipelagos of Sample 6Y5j revealed that quite a few fragments shared identical 5′ or 3′ ends. After examining the raw BAM files, we ruled out that Fragment 4 was a product of sequencing or alignment errors. Because the sequence within Fragment 3 shared no significant similarity to the sequences of the primers used in PCR or sequencing, it is unlikely that Fragment 4 was a PCR by-product resulting from mispriming on Fragment 3. Based on the sharing junction, we proposed a novel hypothesis that Fragment 4 resulted from an unreported defective Tn5 transpososome, of which one of the two reaction centers failed to make a nick to complete tagmentation. As Fragment 4 was identified as an artifact, this archipelago was reconstructed to be one molecule.
A detailed mechanism is proposed in Fig. 3b to account for our observation: Transpososome made a single tagmentation at the bottom strand, a scenario denoted as “0/1”, where “0” represents the defective center and “1” represents the productive center of dimeric Tn5 transposase. The digits above and below “/” represent the top and the bottom strands, respectively. During the extension step, the strands that ligated to transposon end molecules—TE1, TE2, and TE3—will extend from 3′ end to become functional templates for the next round, eventually generating two indistinguishable long pieces and a short piece sharing the 5′ end. In a similar fashion, a 1/0 scenario will generate a short fragment sharing the 3′ ends with two indistinguishable longer fragments (Fig. 3c).
If our hypothesis holds true, we can expect that there will be four more complex patterns emerging when two defective transposomes react side by side, as described below:
Complex scenarios 00/11 and 11/00. Where two defective reaction centers are adjacent to one another on the top strand (Fig. 3d) or on the bottom 5 strand (Fig. 3e) respectively, resulting in four fragments (three unique sequences of varying lengths) sharing identical 5′ end or 3′ ends respectively.
Complex scenario 01/10. Where the first defective reaction center is upstream on the top strand and the second defective reaction center is downstream on the bottom strand, resulting in four fragments, two shorter fragments with one sharing 5′ end and the other sharing 3′ end with the other two identical longer fragments (Fig. 3f).
Complex scenario 10/01. Where the first defective reaction center is upstream on the bottom strand, and the second defective reaction center is downstream on the top strand, leading to two overlapping fragments (Fig. 3g).
Just as we predicted, we identified a significant amount of instances of these complex artifacts. Some of the examples are shown in Fig. S2. These complex scenarios further reinforced our hypothesis. As we implemented an algorithm to eliminate these artifacts, the identified archipelago calls appeared to be cleaner and cohesive, as shown in the next section.
We should point out that Complex Scenario 10/01 generates two overlapping fragments, a pattern that is similar to the result if they came from two separate molecules (Fig. S2D). We are still in the process of develop-ing algorithms to call this complex scenario. Meanwhile, we are engineering Tn5 to minimize the chance of defective reactions.
It is worth pointing out that Fragment 8 and Fragment 9 (Fig. 3a) share an 8-base junction, a point we dis-cussed in previous section. If this junction was not recognized, then Fragments 9, 10, 11, 12, and 13 would have had to be in Molecule 2, leaving a big gap in Molecule 1, an unlikely scenario under our experimental condition.
Reconstruction and counting of two DNA molecules by BIGseq. With the identification of the artifacts mentioned in the previous sections, we are able to reconstruct molecules in more complex situations as shown in Fig. 4. Panel A shows an archipelago identified in the region of Chr XI/NC_001143.9:183025–192112, with 61 deduplicated fragments. Among these 61 fragments, eleven fragments (Fragment 51–61) are sorted into the redundant group (maroon bars in Panel B) because each of them shares a common 5ʹ or 3ʹ end with a longer fragment. In a similar process as we described in previous section, a total of eleven multi-fragment islands are then formed and marked in dashed boxes in Fig. 4b. Then, by following the rules of exclusivity and greediness, Islands a, b, d, e, g, h, j, and k are assigned to Molecule 1 (colored in orange), and Islands c, f, and j are assigned

7
Vol.:(0123456789)
Scientific Reports | (2021) 11:18907 | https://doi.org/10.1038/s41598-021-97852-w
www.nature.com/scientificreports/
Figure 3. Defective transpososomes leads to artifacts. (a) Nineteen fragments in the archipelago of Chr V/NC_001137.3 22,504 to 27,231 are reconstructed into one molecule. The seemingly lone Fragment 4 led to the discovery of defective transpososomes. (b–g) are Defective Scenarios 0/1, 1/0, and Complex Scenarios 00/11, 11/00, 01/1/0, and 10/01 respectively. The graphs were generated with Microsoft PowerPoint and IGV (https:// softw are. broad insti tute. org/ softw are/ igv/).

8
Vol:.(1234567890)
Scientific Reports | (2021) 11:18907 | https://doi.org/10.1038/s41598-021-97852-w
www.nature.com/scientificreports/
to Molecule 2 (colored in blue). Next, Fragments 3, 11, 12, and 13 are assigned to Molecule 1 and Fragment 50 joins Molecule 2.
The BIGseq algorithm further identified that Fragment 34 has three extra bases, CTG, at its 3′ end. These bases should be trimmed because they are the last three bases of the primer. Removing these three bases allows Frag-ment 34 to chain with Island b through a canonical junction. In the final step, Molecule 1 is set between 183,025 and 192,112 and Molecule 2 is set between 185,347 and 190,594, as shown in Panel C, to conclude the recon-struction of two homologous mono-ploid molecules. At the completion, Region 2 has two copies, Region 1 and Region 3 have one copy, and areas 3′ immediately adjacent to region 1 and 5′ to Region 3 have 0 copies (Fig. 4c).
Several points need to be stressed: (a) it is unambiguous that Fragments 19–26 originated from one molecule, referred to as “in phase,” as they are chained by junctions (Fig. 4b). 2) The same is not necessarily true for Frag-ments 1–34 because there are gaps between Fragments 3 and 4, 18 and 19, 28 and 29, 30 and 31, 45 and 46, and 49 and 50. (b) Although there are gaps between Fragments 8 and 9, 10 and 11, 11 and 12, 12 and 13, 13 and 14, 38 and 39, it is of high confidence that Fragment 34 and Fragments 4–18 originate from one haploid molecule while Fragments 35–45 originate from a different molecule. Although neither haploid molecule is contiguously covered, BIGseq is the first technology to enable physical connections to be established through the rule of exclusivity.
DiscussionSingle-cell DNA sequencing methods are often treated as bulk sequencing methods that are merely applied to single cell samples. The apparent similarity of the sample preparation and processing procedures shared by single cell and bulk sequencing protocols may reinforce this notion. For instance, similar to a standard Nextera bulk sequencing protocol15, BIGseq also utilizes the following sample prep and processing procedures:
(1) Tagmentation of genomic DNA to construct the primary library,(2) Amplification of the library,(3) Sequencing the library using NGS,(4) Mapping and deduplication and,(5) Haploid analyses.
However, due to the heterogeneity of gene copy numbers in cancer cells and the undefined number of genomes in the bulk sample, the copy number per genome determined by Nextera-prepared bulk genomes may be calculated to be a decimal, a number that does not exist in nature and creates a conundrum to make sense at the biological level. However, copy numbers can be determined discretely when each of the genomes is interrogated individually. Unfortunately, current single cell DNA sequencing technologies fail to capture the discreteness, as they adopt secondary analysis methodology developed for bulk sequencing12. These statistics-heavy methodologies are not robust; the inferred copy number varies when a different bin size is chosen, or a different segmentation option is selected, or ploidy of the genome deviates from diploid12. In contrast, we have taken a different bioinformatic approach which is built upon the deterministic array of fragments generated by tagmenting a stretch of DNA. It simply pieces those fragments back into a single molecule by mapping and concatenating through junctions. Along with its simplicity, this approach carries with it the ability to count DNA molecules and identify mutations at single base resolution to specific haploids.
Our new approach can be applied to the studies of normal single cells of human origin, whether they are haploid, diploid, tetraploid, etc., and cancer cells with altered ploidities as on microscopic level, the sequencing data set from single human genome is expected to be similarly structured as the yeast counterpart as we have
Figure 4. The BIGseq algorithm to identify two molecules. (a) Boundary of an archipelago is set. (b) Two molecules and redundant fragments are called. (c) Final presentation of two molecules. The graphs were generated with Microsoft PowerPoint and IGV (https:// softw are. broad insti tute. org/ softw are/ igv/).

9
Vol.:(0123456789)
Scientific Reports | (2021) 11:18907 | https://doi.org/10.1038/s41598-021-97852-w
www.nature.com/scientificreports/
shown in this manuscript. The complexity in human genome may introduce additional challenges and inspire new innovations. Subsequent calibration of the performance of the BIGSeq against human single cells of known ploidy will illustrate the power and resolution of this method.
Received: 29 October 2020; Accepted: 27 August 2021
References 1. Ramamoorthy, A. & Skaar, T. C. Gene copy number variations: It is important to determine which allele is affected. Pharmacog-
enomics 12, 299–301 (2011). 2. Sansregret, L., Vanhaesebroeck, B. & Swanton, C. Determinants and clinical implications of chromosomal instability in cancer.
Nat. Rev. Clin. Oncol. 15, 139–150 (2018). 3. Almeida, L. V. et al. Chromosomal copy number variation analysis by next generation sequencing confirms ploidy stability in
Trypanosoma brucei subspecies. Microb. Genom. 4, e000223 (2018). 4. Gilchrist, C. & Stelkens, R. Aneuploidy in yeast: Segregation error or adaptation mechanism?. Yeast 36, 525–539 (2019). 5. Ravichandran, M. C., Fink, S., Clarke, M. N., Hofer, F. C. & Campbell, C. S. Genetic interactions between specific chromosome
copy number alterations dictate complex aneuploidy patterns. Genes Dev. 32, 1485–1498 (2018). 6. Hirpara, A., Bloomfield, M. & Duesberg, P. Speciation theory of carcinogenesis explains karyotypic individuality and long latencies
of cancers. Genes 9, 402 (2018). 7. Akao, T. Progress in the genomics and genome-wide study of sake yeast. Biosci. Biotechnol. Biochem. 83, 1463–1472 (2019). 8. Levsky, J. M. & Singer, R. H. Fluorescence in situ hybridization: Past, present and future. J. Cell Sci. 116, 2833–2838 (2003). 9. Berisha, S. Z., Shetty, S., Prior, T. W. & Mitchell, A. L. Cytogenetic and molecular diagnostic testing associated with prenatal and
postnatal birth defects. Birth Defects Res. 112, 293–306 (2020). 10. Andriani, G. A. et al. A direct comparison of interphase FISH versus low-coverage single cell sequencing to detect aneuploidy
reveals respective strengths and weaknesses. Sci. Rep. 9, 10508 (2019). 11. Xi, L. Single cell DNA sequencing: From analog to digital. Cancer Res. Front. 3, 161–169 (2017). 12. Mallory, X. F., Edrisi, M. & Navin, N. Nakhleh L Assessing the performance of methods for copy number aberration detection
from single-cell DNA sequencing data. PLoS Comput. Biol. 16, e1008012 (2020). 13. Xi, L. et al. New library construction method for single-cell genomes. PLoS ONE 12, e0181163 (2017). 14. Xi, L., Leong, P. & Mihajlovic, A. Preparing single-cell DNA library using nextera for detection of CNV. Bio-Protoc. 9, e3175 (2019). 15. Adey, A. et al. Rapid, low-input, low-bias construction of shotgun fragment libraries by high-density in vitro transposition. Genome
Biol. 11, R119 (2010). 16. Amini, S. et al. Haplotype-resolved whole-genome sequencing by contiguity-preserving transposition and combinatorial indexing.
Nat. Genet. 46, 1343–1349 (2014). 17. Martin, M. Cutadapt removes adapter sequences from high-throughput sequencing reads. EMBnet J. 17, 10–12 (2011). 18. Langmead, B. & Salzberg, S. L. Fast gapped-read alignment with Bowtie 2. Nat. Methods 9, 357–359 (2012). 19. Robinson, J. T. et al. Integrative genomics viewer. Nat. Biotechnol. 29, 24–26 (2011). 20. Thorvaldsdottir, H., Robinson, J. T. & Mesirov, J. P. Integrative Genomics Viewer (IGV): High-performance genomics data visu-
alization and exploration. Brief Bioinform. 14, 178–192 (2013). 21. Berg, D. E., Schmandt, M. A. & Lowe, J. B. Specificity of transposon Tn5 insertion. Genetics 105, 813–828 (1983). 22. Davies, D. R., Goryshin, I. Y., Reznikoff, W. S. & Rayment, I. Three-dimensional structure of the Tn5 synaptic complex transposi-
tion intermediate. Science 289, 77–85 (2000). 23. Li, H. Aligning sequence reads, clone sequences and assembly contigs with BWA-MEM. arXiv 1303, 3997 (2013). 24. Lodge, J. K., Weston-Hafer, K. & Berg, D. E. Transposon Tn5 target specificity: Preference for insertion at G/C pairs. Genetics 120,
645–650 (1988). 25. Green, B., Bouchier, C., Fairhead, C., Craig, N. L. & Cormack, B. P. Insertion site preference of Mu, Tn5, and Tn7 transposons.
Mob. DNA 3, 3 (2012). 26. Chu, C. C. & Clark, A. J. A 10- rather than 9-bp duplication associated with insertion of Tn5 in Escherichia coli K-12. Plasmid 22,
260–264 (1989).
AcknowledgementsWe would like to express our sincere appreciations to Dr. Richard Fekete, Prof. Billy W.L. Ng and Ana Stancic for their careful readings our manuscripts, helpful discussions, and insightful comments.
Author contributionsP.P.T.L. performed simulation, generated scripts for modified IGV, extracted sequencing data and wrote manu-script; A.M. performed simulation and statistical analyses and drew graphs; N.B. and L.B. performed statistical analyses. L.X. performed the molecular biological experiments, data analyses and wrote the (https:// softw are. broad insti tute. org/ softw are/ igv/).
Competing interests PPTL, AM and LX are employees of Digenomix that supported the research work. The remaining authors declare that the research was conducted in the absence of any commercial or financial relationships that could be con-strued as a potential conflict of interest.
Additional informationSupplementary Information The online version contains supplementary material available at https:// doi. org/ 10. 1038/ s41598- 021- 97852-w.
Correspondence and requests for materials should be addressed to P.P.T.L., A.M. or L.X.
Reprints and permissions information is available at www.nature.com/reprints.
Publisher’s note Springer Nature remains neutral with regard to jurisdictional claims in published maps and institutional affiliations.

10
Vol:.(1234567890)
Scientific Reports | (2021) 11:18907 | https://doi.org/10.1038/s41598-021-97852-w
www.nature.com/scientificreports/
Open Access This article is licensed under a Creative Commons Attribution 4.0 International License, which permits use, sharing, adaptation, distribution and reproduction in any medium or
format, as long as you give appropriate credit to the original author(s) and the source, provide a link to the Creative Commons licence, and indicate if changes were made. The images or other third party material in this article are included in the article’s Creative Commons licence, unless indicated otherwise in a credit line to the material. If material is not included in the article’s Creative Commons licence and your intended use is not permitted by statutory regulation or exceeds the permitted use, you will need to obtain permission directly from the copyright holder. To view a copy of this licence, visit http:// creat iveco mmons. org/ licen ses/ by/4. 0/.
© The Author(s) 2021