reconaissance of the chemical quality of surface … · cultural features and economic development...
TRANSCRIPT
,
TEXAS WATER DEVELOPMENT BOARD
REPORT 93
RECONNAISSANCE OF THE CHEMICAL
QUALITY OF SURFACE WATERS OF
THE SAN ANTONIO RIVER BASIN, TEXAS
By
Jack RawsonUnited States Geological Survey
Prepared by the U.S. Geological Surveyin cooperation with the
Texas Water Development Board
April 1969

TABLE OF CONTENTS
ABSTRACT ........•....•.•....•.•......•......•.•.•....•.•........•......•....
INTRODUCTION .
THE SAN ANTONIO RIVER BASIN AND ITS ENVIRONMENT
Physical Features
Climate .
Cultural Features and Economic Development .
Surface-Water Resources Development , .•......•.................•..........•..
CHEMICAL QUALITY OF SURFACE WATER ...•.•......•......•...........
Chemical-Quality Records .
Factors Affecting Chemical Quality of Water .
Geology
Streamflow ..
Activities of Man
Daily Variations of Water Quality .
Areal Variations of Water Quality .
Dissolved Solids .
Hardness .
Chloride .............•....•.•......•.•......•.•......•.•.
Other Constituents .
Water Quality in Medina Lake .
Water Quality at Potential Reservoir Sites . .........................•................
Cibolo
Goliad
Confluence .................•...................•...........................
Relation of Water Quality to Use .........................•.......................
iii
Page
2
2
2
3
5
5
5
5
5
7
10
10
11
13
13
13
13
13
14
14
14
14
14
14

TABLE OF CONTENTS (Cont'd.)
Page
Municipal Supply .......•.•....•.•......•. , . . . . • . • . . . . . . . . • . . . . . . . . • . • . . . . . . • . 14
Industrial Use .........•......•.•.•....•.....•..•.•......•......•.
Irrigation
REFERENCES .............•....•..... _..•.•....•.•......•......•. _
TABLES
1. Source and Significance of Dissolved-Mineral Constituents and Properties of Water
2. Concentrations of Selected Constituents (In Milligrams Per Liter) That Were Equaled or Exceededfor Indicated Percentage of Days of Flow, San Antonio River at Goliad, Water Years 1959-66
3. Water·Quality Tolerances for Industrial Applications .
4. Suitability of Waters for Irrigation , .
5. Summary of Chemical Analyses at Daily Stations on Streams in the San Antonio River Basin
6. Chemical Analyses of Streams and Reservoirs in the San Antonio River Basinfor Locations other than Daily Stations ...............................•.•..........•..
FIGURES
1. Index Map Showing River Basins in Texas and Physiographic Sections of the San Antonio River Basin
2. Map and Graphs Showing Mean Annual Precipitation and Annual and Average Monthly Precipitation
3. Geologic Map and Chemical Composition of Surface Water , .
4. Curve Showing Relation of Concentration of Dissolved Solids to Water Discharge,San Antonio River at Goliad, Water Years 1959-66 .
15
17
19
6
11
16
18
21
22
3
4
8
9
5. Duration Curve of Dissolved Solids, San Antonio River at Goliad, Water Years 1959-66 . . . . • . . . . .• . . . 11
6. Curves Showing the Relation of Dissolved Solids to Chloride, Sulfate,and Hardness, San Antonio River at Goliad .....................•.•...............•.•...
7. Diagram for the Classification of Irrigation Waters .
8. Map Showing Location of Chemical-Quality Data-Collection Sites,Major Reservoirs, and Potential Damsites .....................•.•....•.•......
9. Maps Showing Chemical Quality of Surface Water ..........•......•. ......•.•....
iv
12
17
25
26
RECONNAISSANCE OF THE CHEMICAL QUALITY
OF SURFACE WATERS OF THE
SAN ANTONIO RIVER BASIN, TEXAS
ABSTRACT
The kinds and quantities of minerals dissolved insurface waters of the San Antonio A iver basin are relatedprincipally to the geology of the area and to rainfall andstreamflow characteristics. Municipal and industrialwastes have degraded the natural quality of water insome streams.
Rocks exposed in the basin range in age fromCretaceous to Quaternary. The upper part of the basin isunderlain by the Edwards and associated limestones andGlen Rose Limestone. Streams that traverse theseoutcrops usually contain less than 325 mgtl (milligramsper liter) dissolved solids but are very hard. Principalchemical constituents are calcium and bicarbonate.Dissolved-solids content of water in the lower reach ofMedina River averages more than 325 mg/l because ofmunicipal and industrial pollution.
The chemical composition of water in streams thattraverse younger formations in the central and lowerpart of the basin is variable. However, the dissolvedsolids content of most streams not appreciably affected
by pollution averages less than 200 mg/!. Water in thesestreams usually is moderately hard. Although thechemical quality of water in the mainstem San AntonioAiver and the lower reach of Cibolo Creek is beingdegraded by municipal, industrial, and irrigation wastes,the discharge·weighted concentration of dissolved solidsin both streams averages less than 500 mg/!. Water inboth streams usually is very hard.
The chloride content of surface waters in the basingenerally averages less than 20 mg/l, except in areaswhere the chemical Quality is being degraded considerably by pollution.
The concentration of chemical constituents insurface waters throughout much of the basin is withinlimits recommended by the U.S. Public Health Servicefor domestic use. The waters also are suitable for mostirrigation uses. However, the water throughout much ofthe basin is moderately hard or very hard and willrequire softening for most industrial uses.
RECONNAISSANCE OF THE CHEMICAL QUALITY
OF SURFACE WATERS OF THE
SAN ANTONIO RIVER BASIN, TEXAS
INTRODUCTION
The investigation of the chemical quality ofsurface waters of the San Antonio River basin, Texas, isa part of a statewide reconnaissance. The chemicalquality of surface waters in each of the major riverbasins is being studied, and a series of reports summarizing the results of the study is being prepared by theU.S. Geological Survey in cooperation with the TexasWater Development Board. (See list of references.)
The purpose of this report is to present availabledata and interpretations on the quality of surface watersthat will aid in the proper development, management,and use of the water resources of the San Antonio Riverbasin. In the study. the following factors were considered: the nature and concentrations of mineralconstituents in solution; the geologic, hydrologic, andcultural influences that determine the water quality; andthe suitability of the water for municipal supply,industrial use, and irrigation.
A network of daily chemical-quality stations onprincipal streams in Texas is operated by the U.S.Geological Survey in cooperation with the Texas WaterDevelopment Board and with federal and local agencies.However, this network has not been adequate toinventory completely the chemical quality of surfacewaters in the State. To supplement the informationbeing obtained by the network, a cooperative statewidereconnaissance by the U.S. Geological Survey and TexasWater Development Board was begun in September1961. Samples for chemical analysis are collected periodically at numerous sites throughout Texas so that somequality-of-water information will be available for locations where water-development projects are likely to bebuilt. These data aid in the delineation of areas havingwater-quality problems and in the identification ofprobable sources of pollution, thus indicating areas inwhich more detailed investigations are needed.
During the reconnaissance, water-quality data werecollected for the principal streams and several of theirtributaries, Medina Lake, and a number of potentialreservoir sites.
- 2 -
Agencies that have cooperated in the collection ofchemical quality and streamflow data include the U.S.Army Corps of Engineers, Guadalupe·Blanco RiverAuthority, Edwards Underground Water District, BexarMetropolitan Water District, city of San Antonio, andTexas State Department of Health.
THE SAN ANTONIO RIVER BASINAND ITS ENVIRONMENT
Physical Features
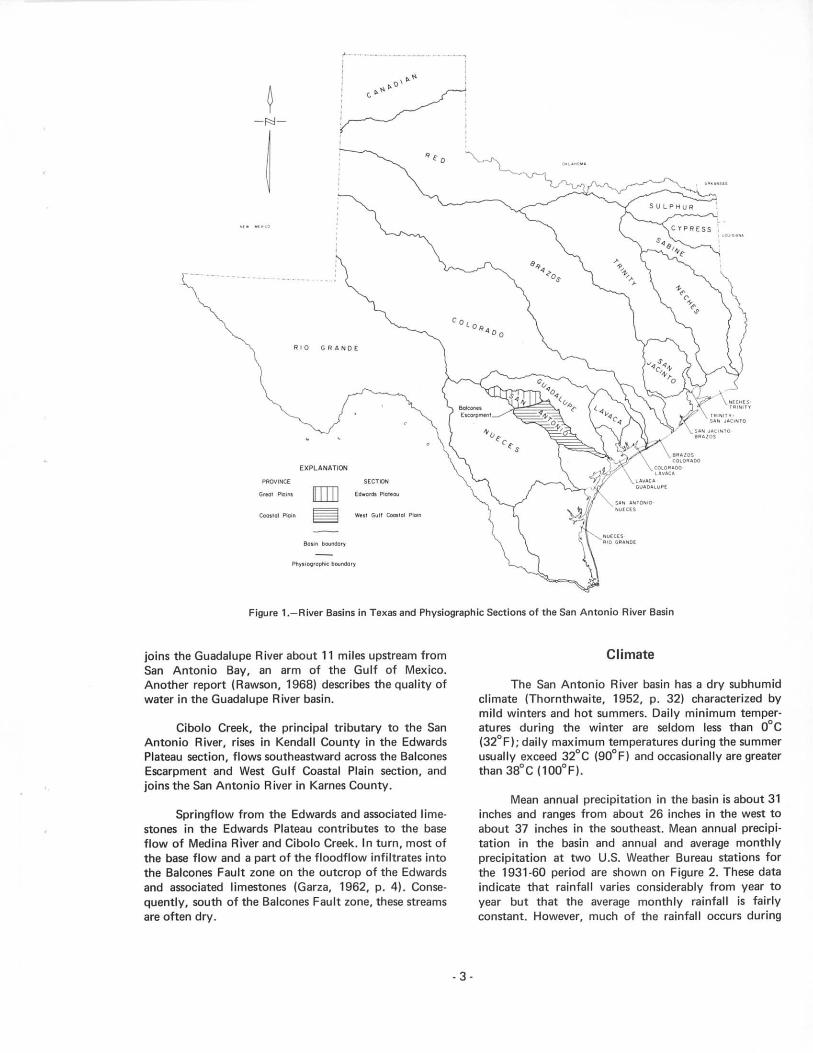
The San Antonio River basin comprises an area ofmore than 4,100 square miles in south,central Texas andincludes parts of two physiographic sections-theEdwards Plateau of the Great Plains province and theWest Gulf Coastal Plain of the Coastal Plain province(Figure 1). These physiographic sections within the basinare separated by the Balcones Escarpment. Althoughboth the Edwards Plateau and the top of the BalconesEscarpment are partly protected from erosion by a capof very resistant limestone, streams that rise in theplateau have cut broad valleys below the upland surface.Between these valleys, remnants of the resistant limestone form steep cliffs. The resulting terrain is rough andrugged and the soil mantle is very thin-except along themajor stream valleys.
The West Gulf Coastal Plain section within thebasin extends from the Balcones Escarpment to the Gulfof Mexico. In this section the rolling to moderately hillycountry merges with the level, nearly featureless prairieof the Gulf Coast.
The principal stream that drains the EdwardsPlateau section of the basin is the Medina River, whichrises in the northwestern part of Bandera County, flowssoutheastward across the Edwards Plateau, and joins theSan Antonio River about 15 miles south of the city ofSan Antonio (Figure 2).
The mainstem San Antonio River rises in the cityof San Antonio near the center of Bexar County, flowssoutheastward across the West Gulf Coastal Plain, and
!- ..
j,
~I _,0"-: c,f> :, ,
i ', ,, ',
SULPHUR
RIO GRANOE
EXPLANATION
SECTION
GIIOOI PIa... ~ [d_Ot<l!l PIclt,oo
eooolol ""'In § WoOl GIIII e-lol _
Figure 1.-River Basins in Texas and Physiographic Sections of the San Antonio River Basin
joins the Guadalupe River about 11 miles upstream fromSan Antonio Bay, an arm of the Gulf of Mexico.Another report (Rawson, 1968) describes the quality ofwater in the Guadalupe River basin.
Cibolo Creek, the principal tributary to the SanAntonio River, rises in Kendall County in the EdwardsPlateau section, flows southeastward across the BalconesEscarpment and West Gulf Coastal Plain section, andjoins the San Antonio River in Karnes County.
Springflow from the Edwards and associated limestones in the Edwards Plateau contributes to the baseflow of Medina River and Cibolo Creek. In turn, most ofthe base flow and a part of the floodflow infiltrates intothe Balcones Fault zone on the outcrop of the Edwardsand associated limestones (Garza, 1962, p. 4). Consequently, south of the Balcones Fault zone, these streamsare often dry.
- 3-
Climate
The San Antonio River basin has a dry subhumidclimate (Thornthwaite, 1952, p. 32) characterized bymild winters and hot summers. Daily minimum temper·atures during the winter are seldom less than O°C(32°F); daily maximum temperatures during the summerusually exceed 32°C (90°F) and occasionally are greaterthan 38°C (100°F).
Mean annual precipitation in the basin is about 31inches and ranges from about 26 inches in the west toabout 37 inches in the southeast. Mean annual precipitation in the basin and annual and average monthlyprecipitation at two U.S. Weather Bureau stations forthe 1931-60 period are shown on Figure 2. These dataindicate that rainfall varies considerably from year toyear but that the average monthly rainfall is fairlyconstant. However, much of the rainfall occurs during

thunderstorm activity; consequently, a few days of highintensity rainfall often account for much of the rainfallthat occurs in any given month.
Cultural Features andEconomic Development
The population of the San Antonio River basin in1960 was about 700,000, more than 85 percent ofwhich was urban. Three cities, all within the SanAntonio metropolitan area, had more than 5,000 inhabitants in 1960 (San Antonio-587,718, Alamo Heights7,552, and Terrell Hills-5,572).
Agriculture contributes substantially to theeconomy of the basin. Principal agricultural and livestock products include wool and mohair from theEdwards Plateau section, and poultry, beef cattle, dairyproducts, cotton, grain, grain sorghum, and vegetablesfrom the West Gulf Coastal Plain section.
Although most of the basin is agriculturallyoriented, the San Antonio area is a combined military,commercial, and light industrial center. Food processing,breweries, and tourism are also mainstays of the SanAntonio economy.
The production of cement is an important industry in the basin because large deposits of limestone areabundant.
Surface-Water Resources Development
Three reservoirs in the San Antonio River basinhave storage capacities of 5,000 acre·feet or more(Figure 81. (In the following discussion, total capacity isthat capacity below the lowest uncontrolled outlet orspillway and is based on the most recent reservoir surveyavailable.)
Medina Lake, owned and operated by the Bexar·Medina-Atascosa Counties Water Improvement DistrictNo.1, is the largest reservoir in the basin. This 254,000acre-foot reservoir on the Medina River supplies waterfor irrigation, mostly in the Nueces River basin.
Olmos Reservoir, which has a storage capacity of15,500 acre· feet, is owned and operated by the city ofSan Antonio for flood protection of the city's businessdistrict. The reservoir, located on Olmos Creek in SanAntonio, is maintained empty and the area is used forparks and playgrounds-except when needed for floodwater storage.
Victor Braunig Lake, constructed on Arroyo Secoby the City Public Service Board of San Antonio tosupply cooling water for a steam-electric generatingplant, has a storage capacity of 26,500 acre-feet. Inflowto the lake consists of runoff from the drainage area of
·5·
Arroyo Seca supplemented by water pumped from theSan Antonio River.
CHEMICAL QUALITY OFSURFACE WATER
Chemical-Quality Records
The systematic collection of chemical-quality dataon surface waters of the San Antonio River basin by theU.S. Geological Survey was begun in 1942 when a dailysampling station was established on the San AntonioRiver at Goliad. This station was discontinued in 1946but was reestablished in 1958. Data obtained from thestation until it was discontinued in 1946 consisted ofchemical analyses of filtrates from samples collected bythe U.S. Soil Conservation Service for the determinationof suspended matter. Usually only specific conductanceand chloride determinations were made on these filteredsamples. Since reestablishment of the station in 1958,chemical analyses have been more comprehensive, andthe discharge·weighted averages of analyses have beencomputed annually. The only other station in the basinfor which daily chemical-quality records are available isSan Antonio River near Elmendorf, which was established in October 1966. However, periodic or miscellaneous chemical-quality data are available for severaladditional sites in the basin. Locations of selecteddata-collection sites are shown on Figure 8. Chemical·quality data for the daily station San Antonio River atGoliad are summarized in Table 5, and the completerecords are published in an annual series of U.S.Geological Survey water-supply papers and in reports ofthe Texas Water Development Board and predecessoragencies. (See table in the list of references.) Results ofselected periodic and miscellaneous analyses are given inTable 6. Included in Table 6 are results of analyses ofsamples collected periodically from the station SanAntonio River near Elmendorf before its conversion to adaily station.
The Texas State Department of Health since 1957has maintained a statewide stream-sampling programwhich includes the periodic determination of pH,dissolved solids, chloride, and sulfate at eight sites in theSan Antonio River basin. Data from this program weremade available to the Geological Survey and werestudied during the preparation of this report.
Factors Affecting Chemical Quality of Water
All natural waters contain dissolved minerals, mostof which are dissociated into charged particles (ions).Principal cations (positively charged ions) are calcium(Ca), magnesium (Mgl, sodium (Nal. potassium IKI, andiron (Fe). Principal anions (negatively charged ions) arecarbonate ICO, I, bicarbonate (HCO,), sulfate (504 1,chloride ICII, fluoride IF), and nitrate (NO,). These and

Table 1.-Source and Significance of Dissolved-Mineral Constituents and Properties of Water
CONSTITUENTOR
PROPERTY
Iron (Fe)
Calcium {Cal andmagnesium (Mg)
Sodium (Na) andpotassium (K)
Bicarbonate (HC03)and carbonate (C03)
Sulfate (504)
Chloride (CI)
Fluoride (F)
Nitrate (N03'
SOURCE OR CAUSE
Dissolved from practically allrocks and soils, commonly lessthan 30 mg/1. High concentrations, as much as 100 mgll, generally occur in highlY alkalinewaters.
Dissolved from practically allrocks and soils. May also bederived from iron pipes, pumps,and other equipment. More than1 or 2 mgtl of iron In surfacewaters generally indicate acidwastes from mine drainage orother sources.
Dissolved from practically all sallsand rocks, but especially fromlimestone, dolomite, and gypsum,Calcium and magnesium arefound In large quantities In somebrines. Magnesium is present inlarge quantities in sea water.
Dissolved from practically allrocks and salls. Found also inancient brines, sea water, industrial brines, and sewage.
Action of carbon dioxide in wateron carbonate rocks such as lime·stone and dolomite.
Dissolved from rocks and soilscontaining gypsum. iron sulfides,and other sulfur compounds.Commonly present in mine watersand in some Industrial wastes.
Dissolved from rocks and salls.Present In sewage and found Inlarge amounts In ancient brines,sea water, and industrial brines.
Dissolved in small to minutequantities from most rocks andsoils. Added to many waters byfluoridation of municipal supplies.
Decaying organic matter, sewage,fertilizers, and nitrates in soil.
SIGNIFICANCE
Forms hard scale in pipes and boilers. Carried over in steam ofhigh pressure boilers to form deposits on blades of turbines.Inhibits deterioration of zeolite-type water softeners.
On exposure to air, iron in ground water oxidizes to reddlshbrown precipitate. More than about 0.3 mgll stain laundry andutensils reddish-brown. Objectionable for food processing, tex.tile processing, beverages, ice manufacture, brewing, and otherprocesses. U.S. PUblic Health Service (1962) drinking-waterstandards state that iron should not exceed 0.3 mgll. Largerquantities cause unpleasant taste and favor growth of ironbacteria.
Cause most of the hardness and scale-forming properties ofwater; soap consuming Isee hardness), Waters low in calcium andmagnesium desired in electroplating, tanning, dyeing, and inte)(tlle manufacturing.
Large amounts, in combination with chloride, give a salty taste.Moderate quantities have little effect on the usefulness of waterfor most purposes. Sodium salts may cause foaming in steamboilers and a high sodium content may limit the use of water forIrrigation.
Bicarbonate and carbonate produce alkalinity. Bicarbonates ofcalcium and magnesium decompose in steam boilers and hotwater facilities to form scale and release corrosive carbon dioxidegas. In combination with calcium and magnesium, cause carbonate hardness.
Sulfate in water containing calcium forms hard scale in steamboilers. In large amounts, sulfate in combination with other ionsgives bitter taste to water. Some calcium sulfate is consideredbeneficial In the brewing process. U.S. Public Health Service(1962) drinklng·water standards recommend that the sulfatecontent should not e)(ceed 250 mgll.
In large amounts in combination with sodium, gives salty taste todrinking water. In large quantities, Increases the corrosiveness ofwater. U.S. Public Health Service (1962) drinking-waterstandards recommend that the chloride content should note)(ceed 250 mg/I,
Fluoride in drinking water reduces the incidence of tooth decaywhen the water is consumed during the period of enamelcalcification. However, It may cause mottling of the teeth,depending on the concentration of fluoride. the age of the child,amount of drinking water consumed, and susceptibility of theIndividual. (Maler, 1950)
Concentration much greater than the tocal average may suggestpollution. U.S. Public Health Service (1962) drlnking·waterstandards suggest a limit of 45 mgll. Waters of high nitratecontent have been reported to be the cause of methemoglobinemia (an ohen fatal disease In Infants) and therefore shouldnot be used In Infant feeding. Nitrate has been shown to behelpful in reducing inter-crystalline cracking of baiter steel. Itencourages growth of algae and other organisms which produceundesirable tastes and odors.
Dissolved solids ChieflydissolvedIncludesllzetlon.
minerai constituentsfrom rocks and salts.
some water of crystal·
·6·
U.S. Public Health Service (1962) drinking-water standardsrecommend that waters containing more than SOD mgll dissolvedsolids not be used if other less mineralized supplies are available.Waters containing more than 1000 mgll dissolved solids areunsuitable for many purposes.

Table 1.-Source and Significance of Dissolved·Mineral Constituents and Properties of Water-Continued
CONSTITUENTOR
PROPERTY
Hardness as CaC03
Specific conductance(micromhos at 25°CI
Hydrogen ionconcentration (pH)
SOURCE OR CAUSE
In most waters nearly all thehardness is due to calcium andmagnesium. All the metalliccations other than the alkalimetals also cause hardness.
Mineral content of the water.
Acids, acid·generating salts, andfree carbon dlo)!.ide lower the pH.Carbonates, bicarbonates, hydro)!.·ides. phosphates, silicates, andborates raise the pH.
SIGNIFICANCE
Consumes soap before a lather will form, Deposits soap curd onbathtubs. Hard water forms scale in boilers, water heaters, andpipes. Hardness equivalent to the bicarbonate and carbonate iscalled carbonate hardness. Any hardness in excess of this iscalled non·carbonate hardness. Waters of hardness as much as 60mgtl are considered soft; 61·120 mg/l, moderately hard; 121-180mg/l, hard; more than 180 mgtl, very hard.
Indicates degree of mineralization. SpecifIc conductance is ameasure of the capacity of the water to conduct an electriccurrent. Varies with concentration and degree of ionization ofthe constituents.
A pH of 7.0 indicates neutrality of a solution. Values higher than7.0 denote increasing alkalinity; values lower than 7.0 indicateincreasing aciditY. pH Is a measure of the activity of thehydrogen ions. Corrosiveness of water generally increases withdecreasing pH. However, e)!.cessively alkaline weters may alsoattack metals.
other constituents and properties are determined toevaluate the chemical quality of water. Table 1 lists theconstituents and properties commonly determined bythe U.S. Geological Survey and includes a resume oftheir source and significance.
Waters are classified usually in various ways todemonstrate similarities and differences in chemicalcomposItIon. In the following discussion which relateschemical quality of water to environmental factors,waters are classified on the basis of chemical type anddegree of hardness. As to chemical type, water isclassified according to the predominant cations andanions in milliequivalents per liter. For example, a wateris referred to as a calcium bicarbonate type if thecalcium ion constitutes 50 percent or more of thecations and the bicarbonate ion constitutes 50 percentor more of the anions. Waters in which one cation andone anion are not clearly predominant are recognized asmixed types and are identified by names of all importantions.
On the basis of hardness, waters are classified assoh, moderately hard, hard, or very hard. (See tabulation on page 15.)
- 7 •
Geology
The kinds and amounts of dissolved constituentsin unpolluted surface waters are determined to a largeextent by the geologic environment. All rocks and soilscontain soluble minerals, but the amount of mineralsavailable for solution is decreased by leaching. Therefore, rocks and soils in areas of high rainfall usually arewell leached and yield water of low mineralization,whereas rocks and soils in arid regions are poorly leachedand ohen yield large quantities of minerals to circulatingwaters.
Mean annual precipitation in the San AntonioRiver basin is about 31 inches; consequently, many ofthe more soluble minerals have been leached from thesurface rocks and soils. The dissolved-mineral content ofunpolluted surface runoff in the basin usually averagesless than 325 mg/l (milligrams per liter).
Most streams in the basin traverse more than onegeologic formation; consequently, water in some ofthese streams is a composite of several different chemicaltypes. Moreover, the chemical composition of water insome streams is altered by municipal or industrial
pollutants. For these reasons, the following discussionwhich relates chemical composition of surface waters togeology is very general.
The geology of the San Antonio River basin hasbeen described by Alexander, Myers, and Dale (1964, p.29·50). Rocks exposed in the basin consist of sedimentsthat range in age from Cretaceous to Quaternary; theoutcrop areas of the various geologic units are shown inFi9ure 3.
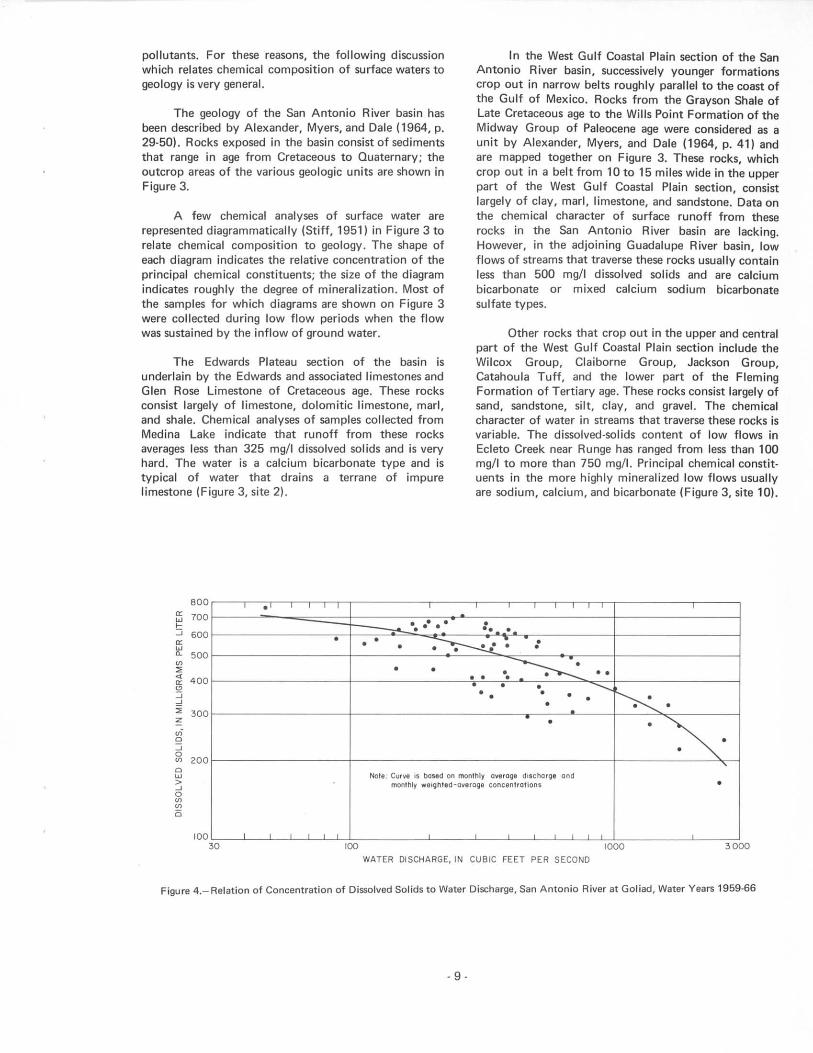
A few chemical analyses of surface water arerepresented diagrammatically (Stiff, 1951) in Figure 3 torelate chemical composition to geology. The shape ofeach diagram indicates the relative concentration of theprincipal chemical constituents; the size of the diagramindicates roughly the degree of mineralization. Most ofthe samples for which diagrams are shown on Figure 3were collected during low flow periods when the flowwas sustained by the inflow of ground water.
The Edwards Plateau section of the basin isunderlain by the Edwards and associated limestones andGlen Rose Limestone of Cretaceous age. These rocksconsist largely of limestone, dolomitic limestone, marl,and shale. Chemical analyses of samples collected fromMedina Lake indicate that runoff from these rocksaverages less than 325 mg/l dissolved solids and is veryhard. The water is a calcium bicarbonate type and istypical of water that drains a terrane of impurelimestone (Figure 3, site 2).
In the West Gulf Coastal Plain section of the SanAntonio River basin, successively younger formationscrop out in narrow belts roughly parallel to the coast ofthe Gulf of Mexico. Rocks from the Grayson Shale ofLate Cretaceous age to the Wills Point Formation of theMidway Group of Paleocene age were considered as aunit by Alexander, Myers, and Dale (1964, p. 41) andare mapped together on Figure 3. These rocks, whichcrop out in a belt from 10 to 15 miles wide in the upperpart of the West Gulf Coastal Plain section, consistlargely of clay, mart, limestone, and sandstone. Data onthe chemical character of surface runoff from theserocks in the San Antonio River basin are lacking.However, in the adjoining Guadalupe River basin, lowflows of streams that traverse these rocks usually containless than 500 mgtl dissolved solids and are calciumbicarbonate or mixed calcium sodium bicarbonatesulfate types.
Other rocks that crop out in the upper and centralpart of the West Gulf Coastal Plain section include theWilcox Group, Claiborne Group, Jackson Group,Catahoula Tuff, and the lower part of the FlemingFormation of Tertiary age. These rocks consist largely ofsand, sandstone, silt, clay, and gravel. The chemicalcharacter of water in streams that traverse these rocks isvariable. The dissolved-solids content of low flows inEcleto Creek near Runge has ranged from less than 100mgtl to more than 750 mgtl. Principal chemical constituents in the more highly mineralized low flows usuallyare sodium, calcium, and bicarbonate (Figure 3, site 10).
600
400
3000100 1000WATER DISCHARGE, IN CUSIC FEET PER SECOND
• I
• • • •••• •• •• • • .~. •• • •
• • .~. ••• • •• • • .......• • • ~• •• •• •
~.,
Note. Curve,s oo5ed on molllhly overoll' d"chofll' llndmonthly welghted-overolle concenlrotions •
,10030
300
500
800
~ 700>-::;orit!'"~"i3::;J
izuio::;~ 200ow>-'o'"'"5
Figure 4.-Aelation of Concentration of Dissolved Solids to Water Discharge, San Antonio River at Goliad, Water Years 1959·66
- 9-

During high flow periods, the water usually contains lessthan 200 mg/I dissolved solids and is the calciumbicarbonate type.
The dissolved-solids concentration of water inEscondido Creek, which traverses outcrops of CatahoulaTuff and the lower part of the Fleming Formation,usually is less than 250 mg/1. Principal chemical constit·uents are calcium and bicarbonate, and the water ismoderately hard or hard (Figure 3, site 121.
Formations that crop out in the lower part of theSan Antonio River basin, in downstream order, are theupper part of the Fleming Formation and Goliad Sandof Tertiary age and the Lissie Formation and BeaumontClay of Quaternary age. Chemical-quality data forstreams that traverse these rocks are lacking; consequently, no generalization about the chemical characterof runoff can be made. However, since rainfall in thisarea averages more than 32 inches annually, thedissolved-solids content of surface runoff probably islow.
Streamflow
The dissolved-solids concentration of streams notregulated by upstream reservoirs usually varies inverselywith the water discharge. The concentration usually isminimum during floods when most of the water issurface runoff that has been in contact with the rocksand soils for a short time. Conversely, the concentrationis maximum during low flow periods when the flow issustained by ground-water effluent that has been incontact with the rocks and soils for a sufficient time todissolve more of the soluble minerals. Figure 4 showsthis general relationship to be true for the San AntonioRiver at Goliad. However, the scatter of points in Figure4 shows that the inverse relationship between streamflow and concentration of dissolved solids is not precise.Obviously, the concentration of dissolved solids hasvaried somewhat at all rates of water discharge.Although part of the variation is related to the diversegeology and pattern of runoff from subbasins, theintermittent disposition of municipal and industrialwastes into the river is responsible for much of thevariation.
- 10-
Activities of Man
The activities of man often debase the chemicalquality of surface water. Depletion of flow by diversionand consumptive use, and the return flow of irrigation,municipal, and industrial wastes into a stream increasethe concentration of dissolved constituents.
According to an inventory by the Texas WaterCommission (Gillett and Janca, 1965, p. 39). about78,600 acre-feet of water was used for irrigation in theSan Antonio River basin in 1964. (This does not includewater diverted from Medina Lake for irrigation in theNueces River basin.) Surface·water sources suppliedabout 32,200 acre· feet, much of which was effluentfrom San Antonio waste-disposal facilities. The returnflow of water used for irrigation has degraded thequality of water in some streams. However, the use ofmunicipal waste water for irrigation has reduced thewaste-disposal burden of streams in the San Antonioarea.
Chemical-quality data indicate that the return flowof municipal, industrial, and irrigation wastes from theSan Antonio area has caused a considerable increase ofdissolved minerals in the San Antonio River and thelower reach of the Medina River. Available data formiscellaneous sites indicate that the concentration ofdissolved solids in tributary inflow, downstream fromthe mouth of Medina River, averages less than 300 mg/l,whereas the discharge-weighted concentration ofdissolved solids in the San Antonio River at Goliadduring the 1959-66 water years averaged 413 mgt!.
Similarly, the quality of water in Cibolo Creek isbeing degraded by municipal, industrial, and irrigationreturn flows, especially during periods when naturalstreamflow is low (Holland and Welborn, 1965, p. 7).During low flow periods, water in Cibolo Creek at FallsCity has contained as much as 796 mg/I dissolved solids.Elm Creek, a small tributary to Cibolo Creek, hascontained as much as 3,010 mg/I dissolved solids, ofwhich 1,120 mgtl was chloride. Elm Creek drains one ofthe largest oil fields in the area, and the high concentrations of dissolved solids and chloride indicate thatsome oil-field brine has reached the stream {Holland andWelborn, 1965, p. 61. Although the inflow of wastes hascaused some deterioration of the chemical quality ofwater in Cibolo Creek, available data indicate that thedischarge-weighted concentration of dissolved solidsaverages less than 300 mg/1.

Daily Variations of Water Quality
The amount of dissolved constituents in a streamis ever changing. Because one or more constituentssometimes may exceed the limit recommended for aspecific use, a knowledge of the daily variations ofchemical constituents at a particular site is desirable.Table 2 provides this information for selected chemicalconstituents in water that passed the daily chemical·quality station San Antonio River at Goliad during the1959-66 water years.
Table 2.-Concentrations of Selected Constituents(in Milligrams per Liter) That Were Equaled or
Exceeded for Indicated Percentage of Days of Flow.San Antonio River at Goliad. Water Yean 1959-66
Although daily samples were collected from theSan Antonio River at Goliad, a complete chemicalanalysis of each daily sample was not feasible. Therefore,two or more daily samples usually were composited forchemical analysis on the basis of specific conductance,supplemented by data on river stage. For this study, thedissolved·solids content of each daily sample was esti·mated from the relation of specific conductance todissolved solids. These data were used to prepare adissolved-solids duration curve (Figure 5) from whichthe dissolved-solids values in Table 2 were compiled.Next, curves of relation between dissolved solids andconcentrations of sulfate, chloride, and hardness wereprepared (Figure 6). Then, for each value of dissolvedsolids in Table 2, corresponding concentrations ofsulfate. chloride. and hardness were tabulated. Theresulting Table 2 shows that the concentrations ofsulfate, chloride. dissolved solids, and hardness are fairlyconstant in the mainstem San Antonio River.
PERCENT OF DAYSCONSITUENT
10 25 50 75 90
Sulfate (504) '20 110 100 80 50
Chloride (en 145 130 115 90 50
Dissolved solids 685 640 585 490 345
Hardness III CaC03 355 335 310 270 200
Although data in Table 2 and Figure 6 can be usedas a rough guide for estimating the percentage of daysthat a particular concentration will be exceeded in thefuture, excessively dry or wet years or radical changes inland use or industrial development may cause significantchanges in concentrations of some constituents.
:>;..)d -b" 12h,vt/ riMdu? t..~ ?J /tL"'l-l5 J!-"'4"'jS_
...:... I I I I I I I I I I I I I
~
~~
G'\
'\I\.
~""-~I I I I I I I I 1 I I I I
010 0.01 01 1 10 50 90 99 99.9 99.99
PERCENT OF TIME THAT DISSOLVED-SOliDS CONCENTRATION EaUALED OR EXCEEDED THAT SHOWN
900
200
'"UJ....:i~ 700l>
V>
"~ 600
'":i-':;;~ 500.,;o:i~400oUJ
"jg300'"B
800
Figure 5.-Duration GUive of Dissolved Solids, San Antonio River at Goliad, Water Years 1959-66
- 11 -

200,--,---,---,----,----,--,----,-----,
~ .. /5Isof-+--+--+--+--+--+-~_*'L-__l
i .. J/.~0·~ .".~ ..3 IOOf-+--+--+--+---+/'7"=+---+--__l~ .. /~ ..... /7····§ 501--+----+---./.-.. I-v~.;".L:.-+---+---+----+----l~ ~ ."
L->' .ol=:=__...L__l___L-_----I__---L__---L__-l
160~~--~--~---,----,------.---,-----,
~ 1201--+----+----+---+---+---+----;?1"V'-.-'-.----j
~ zV380f-+--+--+--+~_';__*~.:.:.-+---+--__l
LOf-+--+-...;.,.,......·j;:·/::.·:-··-··-~:J-/-··-'-"'-'J-"-'-'-+---+----1
~ ! .~V·.-"~:
olL:~__...L__l___L-_----I__---L__---L__
0V
~. '.:... .. ' .0
VV. ":./.
L;/V." .
./.V :
V0
50 lOa 200 300 400 500 600 700
DISSOLVED SOLIDS, IN MILLIGRAMS PER LITER
BOO
Figure 6
Relation of Dissolved Solids to Chloride,
Sulfate, and Hardness, San Antonio River at Goliad
- 12 -

Areal Variations of Water Quality
Some of the previous sections have shown that theconcentrations of dissolved constituents vary fromstream to stream and from site to site on the samestream. The areal variations of the discharge-weightedaverage concentrations of dissolved solids, chloride, andhardness are shown in Figure 9. The discharge-weightedaverage represents approximately the concentration thatwould be present if all water passing a point in thestream during a period were impounded in a reservoirand mixed, with no adjustment for evaporation, rainfall,or chemical change that might occur during storage.Chemical-quality data for some streams in the basin aremeager, especially for floodflows; therefore, the boundaries of the areas in Figure 9 are general. All of thestreams will at times have concentrations greater thanthose shown for their respective areas, but the averagesshown in Figure 9 are indicative of the water that wouldbe stored in reservoirs.
Dissolved Solids
The discharge-weighted concentration of dissolvedsolids in streams that traverse the Edwards Plateausection of the basin averages less than 325 mg/1.Tributary streams that traverse the West Gulf CoastalPlain section of the basin and join the mainstem SanAntonio River downstream from the mouth of MedinaRiver generally contain less than 200 mg/I dissolvedsolids.
Cibolo Creek rises in the Edwards Plateau sectionand traverses the West Gulf Coastal Plain section.Available data indicate that flow in Cibolo Creekoriginating in the Edwards Plateau contains about 300mg/I dissolved solids. However, as Cibolo Creek crossesthe Balcones Fault zone, part of this flow is lost asrecharge to the Edwards and associated limestones. Asthe flow remaining in Cibolo Creek moves downstream,its quality is degraded somewhat by the inflow ofmunicipal, industrial, and irrigation wastes. However,natural runoff from the West Gulf Coastal Plain sectionof the drainage area is low in dissolved solids. Thus, thedischarge-weighted concentration of dissolved solids inthe lower reach of Cibolo Creek averages about 280mg/I.
Flow in the mainstem San Antonio River and thelower reach of the Medina River is sustained partly bythe inflow of municipal and industrial wastes from theSan Antonio area. Nevertheless, the discharge-weightedconcentration of dissolved solids in water throughoutthe mainstem and in the lower reach of Medina Riveraverages less than 500 mg/I. During the 1959·66 wateryears, for example, the dissolved-solids content of theSan Antonio River at Goliad averaged 413 mg/I.
·13·
Hardness
Surface runoff from the limestone terrane of theEdwards Plateau section of the basin is very hard. Forexample, available data indicate that the dischargeweighted concentration of hardness in the upper reachesof Medina River averages more than 200 mg/1.
Surface runoff from the West Gulf Coastal Plainsection of the basin generally is moderately hard; thedischarge·weighted averages of hardness in most tributaries that join the San Antonio River downstream fromthe mouth of Medina River are less than 100 mg/1.However, available data indicate that the hardness ofwater in Cibolo Creek averages more than 180 mg/l.
Water throughout the mainstem San AntonioRiver is very hard. The discharge·weighted hardness inthe San Antonio River at Gol iad averaged 228 mg/Iduring the 1959·66 water years.
Chloride
The chloride content of surface waters in the SanAntonio River basin is low-the discharge-weightedconcentration in most streams averages less than 20mg/l. However, the chloride content of water in themainstem San Antonio River and the lower reaches ofMedina River and Cibolo Creek averages more than 20mg/I because of the inflow of municipal and industrialwastes. Available data indicate that the dischargeweighted chloride concentration averages about 50 mg/Iin the lower reach of the Medina River and about 25mg/l in the lower reach of Cibolo Creek. During the1959-66 water years, the discharge-weighted concentration of chloride in the San Antonio River at Goliadaveraged 68 mg/I.
Other Constituents
Other constituents of importance in the evaluationof the Quality of a water include silica, sodium,bicarbonate, sulfate, fluoride. and nitrate.
The silica content of surface water in the SanAntonio River basin generally averages less than 20 mg/l.During the 1959·66 water years, the discharge·weightedsilica concentration in the San Antonio River at Goliadaveraged 17 mg/I.
The sodium content of surface water throughoutthe basin generally averages less than 20 mg/l-except inareas where pollution is occurring. Available data indicate that the sodium content of water in the lower reachof Cibolo Creek averages about 35 mg/I. The discharge·we igh ted sod ium plus potassium concentration(calculated as sodium) in water of the San Antonio Riverat Goliad averaged 55 mg/I during the 1959·66 wateryears.

Bicarbonate is the principal anion in streams thattraverse the Edwards and associated limestones and GlenRose Limestone. Available data indicate that the bicar·bonate content of these streams averages more than 175mg/l. The bicarbonate content of most streams thattraverse younger formations is somewhat variable butgenerally averages less than 150 mg/l. However, thedischarge-weighted concentration of bicarbonate inwater of the San Antonio River at Goliad averaged 215mg/I during the 1959·66 water years.
The sulfate content of surface water in theEdwards Plateau section of the San Antonio River basingenerally averages less than 75 mgll. The sulfate contentof most streams in the West Gulf Coastal Plain sectionaverages less than 20 mg/I; however, the inflow ofpollutants has increased the average sulfate content insome streams. Available data indicate that the sulfatecontent of water in the lower reach of Cibolo Creekaverages about 50 mg/1. During the 1959·66 water years,the discharge-weighted concentration of sulfate in theSan Antonio River at Goliad averaged 67 mgt!.
Although the nitrate content of most streams inthe San Antonio River basin seldom exceeds 4.0 mg/l,the disposition of municipal wastes has caused a considerable increase in the nitrate content of the mainstemSan Antonio River. During the 1959·66 water years, forexample, the discharge-weighted concentration of nitratein the San Antonio River at Goliad averaged 8.2 mg/l.Similarly, the nitrate content of water in Cibolo Creek isfairly high during some periods-water collect~d fromCibolo Creek near Falls City has contained as much as7.6 mg/I nitrate.
The concentration of fl uoride in surface waters ofthe San Antonio River basin seldom exceeds 0.7 mg/l.The discharge-weighted concentration of fluoride in theSan Antonio River at Goliad averaged 0.4 mg/I duringthe 1959·66 water years.
Water Quality in Medina Lake
Medina Lake stores water of the calcium bicarbonate type that is hard or very hard. The dissolved·solids content of six samples collected from the reservoirduring the period from November 1950 to June 1965averaged 303 mg/I, of which 14 mg/I was chloride and75 mg/I was sulfate.
Water Quality at Potential Reservoir Sites
One of the principal objectives of this recon·naissance was to appraise the quality of water availablefor storage at potential reservoir sites. The locations ofthree potential reservoir sites are shown on Figure 8. Inthe following discussion, evaluations of the water qualityat these sites are based on present conditions. Municipaland industrial growth in some areas may increase the
. 14·
waste-disposal burdens of the streams and may causesignificant changes in water quality before some of thereservoirs can be built.
Cibolo. -Chemical analyses of samples collectedfrom Cibolo Creek near Falls City indicate that waterstored in Cibolo Reservoir would contain about 280mg/I dissolved solids, 25 mg/I chloride, and 50 mg/Isulfate. The water usually would be very hard.
Goliad. -Discharge·weighted average analyses ofwater collected from the daily station San Antonio Riverat Goliad indicate that water stored in Goliad Reservoirwould contain about 420 mg/I dissolved solids, 70 mg/Ichloride, 70 mg/I sulfate, and 230 mg/I hardness.
Confluence. -Confluence Reservoir would storewater from both the San Antonio and Guadalupe Rivers.Daily chemical-quality records for the San AntonioRiver at Goliad and Guadalupe River at Victoria(Rawson, 1968) indicate that the stored water wouldcontain less than 350 mg/I dissolved solids, 50 mg/Ichloride, and 50 mg/l sulfate and would be very hard.
Relation of Water Quality to Use
Although other water-quality criteria are important, the suitability of a water for most uses is oftendependent on its chemical quality. To present chemical·quality criteria for all purposes would be an endless task.Because surface water in the San Antonio River basin isbeing used or developments are being planned primarilyfor municipal supply, industrial use, and irrigation, onlythese uses will be considered.
Municipal Supply
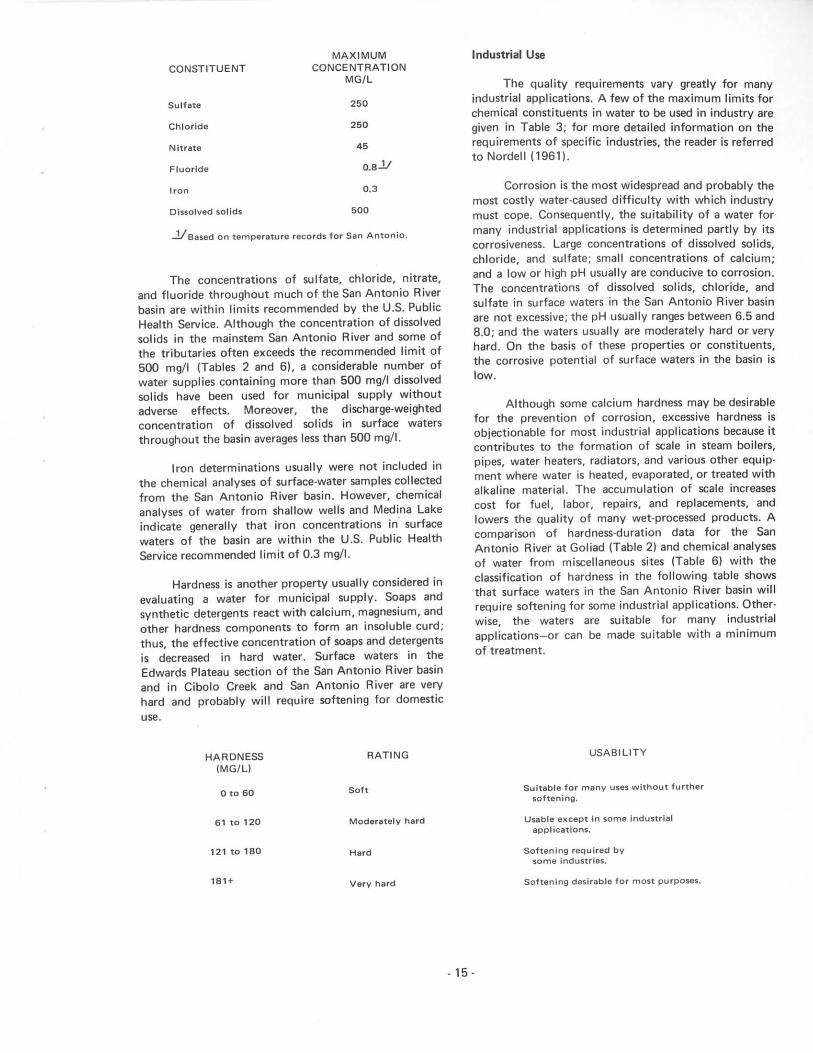
Because of differences in individuals, amounts ofwater used, and other factors, defining the safe limits formineral constituents in water to be used for municipalsupply is difficult. The criteria usually accepted in theUnited States are those recommended by the U_S. PublicHealth Service. These standards, originally established in1914 to control the quality of water used for drinkingand culinary purposes on interstate carriers, have beenrevised several times; the latest revision was in 1962(U.S. Public Health Service, 1962). The limits recom·mended by these standards for some of the morecommonly determined constituents are included in thefollowing table.
MAXIMUMCONSTITUENT CONCENTRATION
MG/L
Sulfate 250
Chloride 250
Nitrate 45
Fluoride 0.8.1J
Iron 0.3
Dissolved solids 500
..!leased on temperature records for San Antonio.
The concentrations of sulfate, chloride, nitrate,and fluoride throughout much of the San Antonio Riverbasin are within limits recommended by the U.S. PublicHealth Service. Although the concentration of dissolvedsolids in the mainstem San Antonio River and some ofthe tributaries often exceeds the recommended limit of500 mg/I (Tables 2 and 61. a considerable number ofwater supplies containing more than 500 mgtl dissolvedsolids have been used for municipal supply withoutadverse effects. Moreover, the discharge·weightedconcentration of dissolved solids in surface watersthroughout the basin averages less than 500 mg/l.
Iron determinations usually were not included inthe chemical analyses of surface·water samples collectedfrom the San Antonio River basin. However, chemicalanalyses of water from shallow wells and Medina Lakeindicate generally that iron concentrations in' surfacewaters of the basin are within the U.S. Public HealthService recommended limit of 0.3 mgt!.
Hardness is another property usually considered inevaluating a water for municipal supply. Soaps andsynthetic detergents react with calcium, magnesium, andother hardness components to form an insoluble curd;thus, the effective concentration of soaps and detergentsis decreased in hard water. Surface waters in theEdwards Plateau section of the San Antonio River basinand in Cibolo Creek and San Antonio River are veryhard and probably will require softening for domesticuse.
HARDNESS RATINGIMG/L)
o to 60 Soft
61 t0120 Moderately hard
121 to 180 Hard
181+ Very hard
. 15·
Industrial Use
The Quality requirements vary greatly for manyindustrial applications. A few of the maximum limits forchemical constituents in water to be used in industry aregiven in Table 3; for more detailed information on therequirements of specific industries, the reader is referredto Nordell (19611.
Corrosion is the most widespread and probably themost costly water-caused difficulty with which industrymust cope. Consequently, the suitability of a water formany industrial applications is determined partly by itscorrosiveness. Large concentrations of dissolved solidschloride, and sulfate; small concentrations of calcium:and a low or high pH usually are conducive to corrosion:The concentrations of dissolved solids, chloride, andsulfate in surface waters in the San Antonio River basinare not excessive; the pH usually ranges between 6.5 and8.0; and the waters usually are moderately hard or veryhard. On the basis of these properties or constituentsthe corrosive potential of surface waters in the basin i~low.
Although some calcium hardness may be desirablefor the prevention of corrosion, excessive hardness isobjectionable for most industrial applications because itcontributes to the formation of scale in steam boilerspipes, water heaters, radiators, and various other equip:ment where water is heated, evaporated, or treated withalkaline materiaL The accumulation of scale increasescost for fuel, labor, repairs, and replacements, andlowers the quality of many wet-processed products. Acomparison of hardness-duration data for the SanAntonio River at Goliad (Table 2) and chemical analysesof water from miscellaneous sites (Table 6) with theclassification of hardness in the following table showsthat surface waters in the San Antonio River basin willrequire softening for some industrial applications. Otherwise, the waters are suitable for many industrialapplications-or can be made suitable with a minimumof treatment.
USABILITY
Suitable for many uses wIthout furthersoftenIng.
Usable eJl:cept In some industrialapplications.
Softening required bVsome industries.
Softening desirable for most purposes.

".;
···" .·.~~• •" ,·.••
:~o
~
.-f~- ..
v-
g:
~:
<
.,
[~';"~i11'''''8 ....... 1!.:::~"i'~~~-g~2:-o,,","'..l
o..,g
_0
-~
- .u • -u u<
N"' ........
..... "' .......
0000.-
00
B
00
0000~O
~..,
00 ...-..- .",-.~~C')
•
o
•o<
3
o<
o<
o<
h~~~~.... - ..... -
o 0• <
:~
:~
:~
•-u<
~ N
.; .
o~
u
,u
·16·
Irrigation
The suitability of a water for irrigation dependsprimarily on its chemical composition. However, theextent to which chemical quality limits the suitability ofa water for irrigation depends on many factors, such as:the nature, composition, and drainage of the soil andsubsoil; the amounts of water used and the methods ofapplication; the kind of crops grown; and the climate ofthe region, including the amounts and distribution ofrainfall. Because these factors are highly variable, everymethod of classifying waters for irrigation is somewhatarbitrary.
embodying both research and field observations, shouldbe used only for general guidance because many additional factors (such as availability of water for leaching,ratio of applied water to precipitation, and crops grown)affect the suitability of water for irrigation. With respectto both salinity and sodium hazards, waters are dividedinto four classes-low, medium, high, and very high. Theclassification range encompasses those waters that can beused for irrigation of most crops on most soils as well asthose waters that are usually unsuitable for irrigation.Selection of class demarcation is discussed in detail inthe publication by the U.S. Salinity Laboratory Staff(1954).
SALINITY HAZARD
I AaOplta Irom US SClllnll~ lClOO'ClIO'~ SIoll, 1954, p.801
Figure 7.-Classification of Irrigation Waters
'0
20
COI'II..tnct A"tr.Cl" "It
Pt,ctnlCl\lt ClI Ilmt IptCII,C cana..CIClMt'ndlcQlta nCl' Ottn t.cttata
Gohoa A"...o" "It
C,Dolo Ant"01< "rt
~ Son Anlonlo ft ..t. 01 GohoaIwol.. vtOr, 1959-66.
CONDUCTANCE, IN MICROMHOS AT 25-C
3456781000 2345000
EXPLANATION 306 Mta,no lOkt ntCl' SCln Anlon;o
SPECIFIC
'00"~i ~ '0
2B
2.
i ~ 24"~
22~
0 Q20~• •• •N• z'8,:"
~ • N i: 16•J • ~ 0
:! ~
0"
> •,~
~12-~ 8
~'O
8
; - •~
4
Z
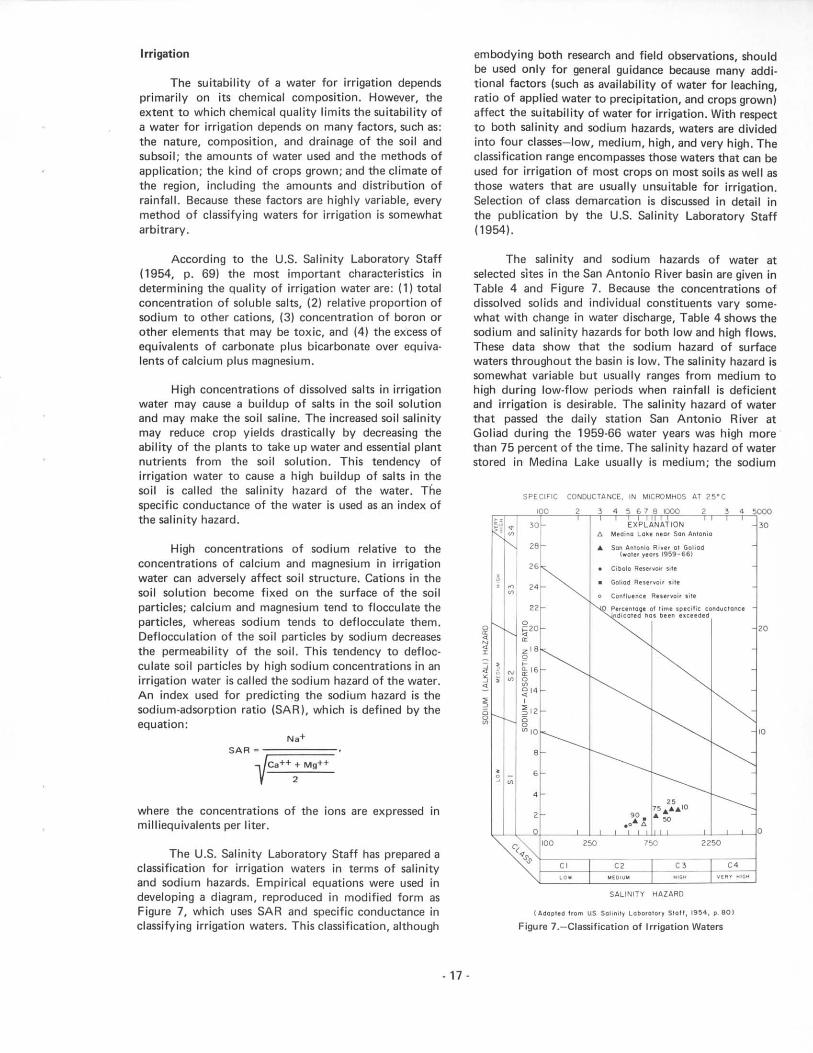
The salinity and sodium hazards of water atselected sites in the San Antonio River basin are given inTable 4 and Figure 7. Because the concentrations ofdissolved solids and individual constituents vary somewhat with change in water discharge, Table 4 shows thesodium and salinity hazards for both low and high flows.These data show that the sodium hazard of surfacewaters throughout the basin is low. The salinity hazard issomewhat variable but usually ranges from medium tohigh during low-flow periods when rainfall is deficientand irrigation is desirable. The salinity hazard of waterthat passed the daily station San Antonio River atGoliad during the 1959-66 water years was high morethan 75 percent of the time. The salinity hazard of waterstored in Medina Lake usually is medium; the sodium
High concentrations of dissolved salts in irrigationwater may cause a buildup of salts in the soil solutionand may make the soil saline. The increased soil salinitymay reduce crop yields drastically by decreasing theability of the plants to take up water and essential plantnutrients from the soil solution. This tendency ofirrigation water to cause a high buildup of salts in thesoil is called the salinity hazard of the water. Thespecific conductance of the water is used as an index ofthe salinity hazard.
where the concentrations of the ions are expressed inmilliequivalents per liter.
According to the U.S. Salinity Laboratory Staff(1 954. p. 69) the most important characteristics indetermining the quality of irrigation water are: (1) totalconcentration of soluble salts, (2) relative proportion ofsodium to other cations, (3) concentration of boron orother elements that may be toxic, and (4) the excess ofequivalents of carbonate plus bicarbonate over equivalents of calcium plus magnesium.
SAR ~ r=====~Ca++: Mg++
The U.S. Salinity Laboratory Staff has prepared aclassification for irrigation waters in terms of salinityand sodium hazards. Empirical equations were used indeveloping a diagram, reproduced in modified form asFigure 7, which uses SAR and specific conductance inclassifying irrigation waters. This classification, although
High concentrations of sodium relative to theconcentrations of calcium and magnesium in irrigationwater can adversely affect soil structure. Cations in thesoil solution become fixed on the surface of the soilparticles; calcium and magnesium tend to flocculate theparticles, whereas sodium tends to deflocculate them.Deflocculation of the soil particles by sodium decreasesthe permeability of the soil. This tendency to defloc·culate soil particles by high sodium concentrations in anirrigation water is called the sodium hazard of the water.An index used for predicting the sodium hazard is thesodium·adsorption ratio (SAR). which is defined by theequation:
. 17 -

hazard is low. Available data indicate that the salinityhazard of water that would be stored in Cibolo, Goliad,and Confluence Reservoirs would be medium.
Surface water for irrigation in the San AntonioRiver basin is being used principally for the supplemental irrigation of pastures and fields producing feed,forage, and vegetables. Water-quality requirements forwater used for supplemental irrigation of these crops arenot stringent. Thus, the medium and high salinityhazards of surface water in the basin do not preclude theuse of water for irrigation.
Other criteria for evaluating the suitability ofwater for irrigation include the boron content andresidual sodium carbonate (excess of equivalents ofcarbonate plus bicarbonate over equivalents of calciumplus magnesium). Although small quantities of boron areessential for normal plant growth, concentrations thatare required for the optimum growth of some plants aretoxic to others. Water with residual sodium carbonate
causes irrigated soils to become alkaline and thus reducesthe soil's permeability.
Boron determinations usually were not included inthe analyses of surface-water samples collected from theSan Antonio River basin. However, the boron content ofsurface waters in the adjoining Guadalupe River basin islow. During the 1951-56 water years, for example, thedischarge-weighted concentration of boron in theGuadalupe River at Victoria averaged 0.20 mg/l. Streamsin the Guadalupe and San Antonio River basins traversethe same geologic formations; thus, the boron content ofsurface waters in the San Antonio River basin probablyis low.
With regard to residual sodium carbonate, surfacewaters in the San Antonio River basin usually contain anexcess of equivalents of calcium plus magnesium overequ ivalents of bicarbonate plus carbonate. Consequently, the residual sodium carbonate is usually zero.
Table 4.-Suitability of Waters for Irrigation
STATION WATER SALINITY SODIUM
(FIGURE 81 STREAM AND LOCATION DATE DISCHARGE HAZARD HAZARDlets)
2 Medina Lake near San Antonio Nov. 28,1950 medium low
Oct. 9.1964 do Do.
4 San Antonio River near Elmendorf M.v 18,1964 15,200 do Do.
Apr. 30,1965 22. nlgn Do.
• Calaveras Creek near Elmendorf Feb. 23,1965 1.11 low Do.
M.V 18,1965 1,340 do Do.
1 San Antonio River near Falls City Apr. 10,1959 433 high Do.
M.V 19,1956 5.010 medium Do.
g Cibolo Creek near Falls Cit.,. Aug. 7,1962 4.81 nigh Do.
M·V 18,1965 8.190 medium Do.
'0 Ecleto Creek near Runge Jan. 30,1961 1.1 nigh Do.
Jan. 22,1965 2,650 low Do.
'2 Escondido Creek at Kened.,. Feb. 15,1965 .1 medium Do.
Feb. 16,1965 1,360 -;;- Do.
~ e~-t::J
·18·

REFERENCES
Alexander, W, H" Jr., Myers, B. N., and Dale, O. C.,1964, Reconnaissance investigation of the ground·water resources of the Guadalupe, San Antonio, andNueces River basins, Texas: Texas Water Comm. Bull.6409, 106 p., 14 pis., 19 fi9S.
American Water Works Association, 1950. Water qualityand treatment: Am. Water Works Assoc. Manual, 2ded., tables 3-4, p. 66·67.
Aultman, W. W., 1957, Softening of municipal watersupplies: Water and Sewage Works, v. 104, No.8, p.327·334.
Garza, Sergil, 1962, Recharge, discharge, and changes inground-water storage in the Edwards and associatedlimestones, San Antonio area, Texas, A progressreport on studies, 1955-59: Texas Board WaterEngineers Bull. 6201, 42 p., 3 pis., 16 figs.
Gillett, P. T., and Janca, I. G., 1965, Inventory of TexasIrrigation, 1958 and 1964: Texas Water Comm. Bull.6515,317 p., 6 pis.
Holland, P. H., and Welborn, C. T., 1965, Base·flowstudies, Cibolo Creek, Texas quantity and quality.March 5·7, 1963: Texas Water Comm. Bull. 6511,13p., 1 pI., 3 figs.
Hughes, L. S., and Leifeste, O. K., 1965, Reconnaissanceof the chemical quality of surface waters of theSabine River basin, Texas and Louisiana: U.S. Geo!.Survey Water-Supply Paper 1809·H, 71 p., 1 pI., 14figs.
Hughes, I. S., and Leifeste, O. K., 1967, Reconnaissanceof the chemical quality of surface waters of theNeches River basin, Texas: U.S. Geol. Survey Water·Supply Paper 1B39·A, 63 p.
Hughes, I. S., and Rawson, Jack, 1966, Reconnaissanceof the chemical quality of surface waters of the SanJacinto River basin, Texas: Texas Water Oevel. BoardRept. 13, 45 p., 2 pis.. 11 figs.
Kunze, H. L., and Lee, J. N., 1968, Reconnaissance ofthe chemical quality of surface waters of theCanadian River basin, Texas: Texas Water Oevel.Board Repl. 86, 27 p., 9 figs.
Kunze, H. L., 1969, Reconnaissance of the chemicalquality of surface waters of the Lavaca River basin,Texas: Texas Water Devel. Board Rept. 92, 25 p., 9fi9S.
·19·
Leifeste, D. K., and Hughes, L. S., 1967, Reconnaissanceof the chemical quality of surface waters of theTrinity River basin, Texas: Texas Water Oevel. BoardRept. 67,65 p., 12 figs.
Leifeste, D. K., and Lansford, M. W., 1968, Reconnais.sance of the chemical quality of surface waters of theColorado River basin, Texas: Texas Water Oevel.Board Repl. 71, 78 p., 13 figs.
Leifeste, O. K., 1968, Reconnaissance of the chemicalquality of surface waters of the Sulphur River andCypress Creek basins, Texas: Texas Water Oevel.Board Repl. 87, 28 p., 13 fi9S.
Maier, F. J., 1950, Fluoridation of public water supplies:Am. Water Works Assoc. Jour., v. 42, part 1, p.1120·1132.
Nordell, Eskel, 1961, Water treatment for industrial andother uses, 2d ed: New York, Reinhold PublishingCorp., 598 p.
Rawson, Jack, 1967, Study and interpretation ofchemical quality of surface waters in the Brazos Riverbasin, Texas: Texas Water Devel. Board Rept. 55, 113p., 10 figs.
Rawson, Jack, 1968, Reconnaissance of the chemicalquality of surface waters of the Guadalupe Riverbasin, Texas: Texas Water Devel. Board Rept. 88, 38p., 11 figs.
Stiff, H. A., Jr., 1951, The interpretation of chemicalwater analysis by means of patterns: Jour. of Petro.Tech., Oct., p. 15.
Thornthwaite, C. W., 1952, Evapotranspiration in thehydrologic cycle, in The physical and economicfoundation of natural resources, v. II, The physicalbasis of water supply and its principal uses: U.S.Cong., House of Representatives, Committee onInterior and Insular AHairs, p. 25-35.
U.S. Geological Survey, 1964, Water Quality records inTexas, 1964: U.S. Geol. Survey open·file repl.
__1965, Water resources data for Texas, 1965, Part2, Water Quality records: U.S. Geol. Survey open-filerept.
U.S. Public Health Service, 1962, Public Health Servicedrinking water standards: U.S. Public Health ServicePub. Water 956, 61 p.
U.S. Salinity Laboratory Staff, 1954, Diagnosis andimprovement of saline and alkali soils: U.S. Dept.Agriculture Handb. 60,160 p.

Quality-of-water records for the San AntonioRiver basin are published in the following U.S. Geological Survey Water-Supply Papers and Texas Water
Development Board reports (including reports formerlypublished by the Texas Water Commission and TexasBoard of Water Engineers):
WATERYEAR
1943·45
1946
1959
1960
1961
1962
1963
U.S.G.S.WATER-5UPPLY
PAPER NO.
1050
1644
1944
1950
T.W.D.S.REPORT NO.
·1938-45
·1946
Bull. 6205
Bull. 6215
Bull. 6304
Bull. 6501
Rept. 7
• "Chemical Composition of Teltas Surface Waters" wasdesignated only by water year from 1938 through 1955.
- 20-

Table 5. --Summary of Chemical Analyses at Daily Stations on Streams In the Slln Antonio lliver Basin
(Analyses listed ap ~aximum and mlnl~um were classified on the bllsls or the values for dissolved solids only;luefl of other conatituents may lIot be extl·emes. (Resut . -.. "" u, ....... A ............"' •.•••.,. ""c,, L .'" InOlL:llleo.)
Diaaol.ed eoHds Hardneaa SpeciflBI- (cniculllt{'d) as CaCO. So- con-
Dale Mean Cal- M..- Po- car- Car- Fluo HI- 80- dlum duct-al D1.charp 8U1c~ Iron etum ne- Sodium w- bon- bon- Sulfate Chloride ride "... Mtil i- Ton.Cal-
Hon- ad- ance pH(Fe) ,on Tona dum, ~cp-collecUon (cr.) (81a.) (c.) .'um (H.) slum ... a" (SO.,) (CI) (PI (HOJ (B) /tralllS pe' cu- (micro.(Mil (K)(HCOJ (COJ pel' acre-
pe, M..- bon- lion~~.atI iter day ne- ratio1001 • Ium ... WC)
14. SAN ANTONIO RIVER AT GOLIAD
~
Water }ear 1942 LilaxllllulII, AUIl 25, 1942 .... 281 - -- -- -- -- 192 -- -- -- -- -- -- -- -- 1210 --Minilllum. July 6 ........... 6910 - -- -- -- -- 9.0 -- -- -- -- -- -- -- -- 174 --Wa tel' year 1944 IYaxl~ulII, feb. 25. 1944 .... 263 - -- -- -- -- -- -- -- -- -- -- -- -- -- 1270 --MlnimuIII. May 4 .. , ......... 6070 - -- -- -- -- 12 -- -- -- -- -- -- -- -- 250 --
Water yeal' 1945 Iilaxl~um, June 30. 1945 .. 344 - -- -- -- -- -- '32 -- -- -- -- -- -- -- -- 959 --Minimum, Apr. 22 .......... 2350 - -- -- -- -- 20 -- -- -- -- -- -- -- -- 328 --
Water year 1946 IMaxilllulII. Sept. 11_12. 28.1946 .. .............. 1724 - 91 17 57 280 75 77 -- 6.2 .560 0.76 2610 297 68 -- 801 --Minimum, May 17-18 ........ 5220 - 36 4.0 13 122 IS II -- 3.0 al75 .24 2470 106 6 -- 248 --
Water year 1959 I!Illlxll11um, Sept. 18, 1959 ... 199 - -- -- 269 -- 216 -- -- 808 l. 10 434 290 70 -- 1300 8.1.... inhlum, Oct. 30-31, I
Nov. I. 1958. ..... 4403 IS 31 4.5 17 102 21 16 0.2 4.2 1S9 .22 1890 96 " 0.7 271 7.8WelHhtcd avera"c. ........ 597 18 77 16 57 242 73 70 .4 10 457 .62 737 258 60 1.5 732 --
Watel' year 1960 IMaxlmulII, June 11-24, 1960. 124 23 105 23 106 314 122 139 .5 5.2 a726 .99 2'13 356 99 2.4 1100 8.0~lini.mum, July 21.." ...... 3070 9. 25 6.6 21 109 20 IS .4 4.0 1S6 .21 1290 90 I 1.0 265 7.:1Weighted aVel'a"e .......•.. 429 18 73 " 65 232 74 78 .5 9.8 460 .63 533 244 54 1.8 745 --
""'atel' yeal' 1961 IMaximum. JUIIC 1-10, 1961 .. 226 23 10. 23 109 310 127 141 .6 6.9 a725 .99 442 354 100 2.5 1140 7.9Minimum, Oct. 27, 1960 .. 9230 - -- -- -- 75 -- 3.0 -- -- 85 .12 2120 57 0 -- 138 7.4Weighted avcl'age .......... 994 16 60 II 43 188 55 52 .4 6 I 347 47 931 194 40 1.3 564 --
Water yeal' 1962 I)(axi~um. ApI" 1-10. 1962 .. 252 20 10' 23 102 308 125 133 .5 8.9 a718 98 489 356 104 2.3 1100 7.8Minimum, June 3. ..... .. 5190 - -- -- -- 89 8.6 16 -- -- 137 19 1920 74 I -- 218 7.'\Io'ei~hted avel·age .... 374 20 75 16 69 237 79 84 -- 9 3 488 66 493 253 59 1.9 761 7.7
Water year 1963 IilnxImulII, Aug 1_31. 1963 .. H.9 24 106 26 132 316 132 182 .6 3.5 761 I 03 98.4 372 112 3.0 1290 7.6MinilllulII, Dec. 22, 1962 .... 1060 - -- -- -- 99 12 22 -- -- 1S8 .21 452 86 5 -- 262 7.4Weighted average ... .. 196 18 81 17 79 239 91 102 -- II 524 .71 277 271 " 2.1 863 7.5
Water year 1964 IiI:uIlIum. Aut.:. 1-8. 1964 .. 14' 19 86 24 117 268 114 m .6 7 0 657 .89 255 313 9. 2.9 1100 8.2Winilllum, Aug 9-10 .. ... 3885 16 38 3.2 136 10 13 -- -- .2 162 .22 1700 108 0 .6 276 8.0Weighted average ......... 289 16 71 IS 62 219 73 78 -- 8.4 431 .59 336 236 57 1.7 732 7.5
Water year 1965163ilax[llIum. July 1_31, 1965 •• 231 20 110 23 97 320 118 135 .6 6.8 674 .92 420 369 107 2.2 1140 7.5
Minimum, Feb. 17-19 .. 5537 10 29 2.3 14 98 13 II -- 2.8 130 .18 19'10 82 2 .8 225 7.8Weighted average .......... 676 14 64 II 43 198 54 53 -- 6.7 343 .47 626 20. 42 1.2 582 7.3
Water year 1966159kaxi~uJD, feb. 1-10, 1966 .. 287 14 107 21 9" 304 112 120 .3 21 648 ,88 502 "4 10' -- 1090 7.8
Minimum, Oct. 20-22, 1965. 3097 Ii 41 5.3 13 102 28 26 -- 3 0 177 ,24 1'180 124 40 -- 328 7.5Weighted avel·agt! ........•. 390 IS 75 14 ~4 222 74 81 .4 S.6 445 .61 '169 246 64 1.8 769 7.6
a Residue at 1130·C.

T ...blc 6. _·ChCllllc31/\nalyses of 5U'enms tlnd Ih:8CrYOlrS In Ihe 5t1n AnlOnio Ihvcr [],ISln for Loc"hons other I.han l);uly 51.'ltlOllS
Indicatl:'d. )III1111"(R, •• _-_ .• - •••••• --.~._-- p.- . - . -- ..._-,. ...-Dlssolved solids Hardneaa SpecUI
B'·«('olcul:ltl'(I) as CaCOJ So· con-
Da', Cal· M..• Po· Car· Fluo NI· 80- dlum duct·~U1"
car- Cal·01 Discharge Iron dum n.· Sodium ....
bon· bon· SulIate Chloride ride lrate Toni Non- ....pH
(F.) (N.) (SO,) ICI),on IIi 111- Tons dum, ance
collection (ers) (Slo'l IC.) .Ium Ilum .t. .t. (PI INOJ IB) (;:r:lmS pO' car· 0"'·~;o-(Mgl IK) IHCOJ ICOJ pel" acre-
pO' Mag-bon· tion ••t
1 i leI" day n.- <sUo 2S·C)foot .Ium .t.
I. SAN ANTONIO RIVER AT SAN ANTOSIO
June 7. 1965. .2 38 0.3 6.'
2. MEDINA LAKE NEAR SAN ANTONIO
,"OY. 2ij, 1950 .... ••• 1. 16 41 234 13. 20 .- 3.5 a~55 1).62 260 6. 1.2 6" 7 .•Ot·1. • 19. 1951 ..... II 0.00 58 21 8.5 I 3.6 188 .3 13 0.1 2.2 0.61 a350 .'8 235 0 .2 -18-1 8.1Api'. tl. 195~ .. 1.0 66 15 10 20' 51 12 -- 2.0 3303 .41 226 " .3 461 8.'Sl'pt. 15. 196-\. ... ••• 62 22
Ii 2.61" 8' t8 .. .5 303 .-11 245 88 .3 500 7.:1
Oll 9 ... 8 • .. 8.1 3.1 132 3l 5.' .3 6.2 173 .2' 143 '0 .1 2.6 7.0Ju I) 16. 1965..... 1.8 52 15 6.' 2.0 110 52 12 .2 1.2 233 .32 l.t 52 .2 '0' 7. I
3. MEDINA RIVER NEAR SAN ANTONIO
~
~
Ju", 7. 1'65.. .1 306 1'2 I I 76 I 16 I 2. I 250 I I 52 I 3. 1 0.31 ,.01 I 352 10 . 48 ' 1256 I 50 I 0.81 6251 7.2
4. SAN ANTONIO RIVER NEAR ELMENDORF
S{'pl. 2lL 1964 .... 333 " 73 10 32 2-10 45 34 0.' 0.8 324 0.44 223 26 0.' 554 1.0SOY. &. ...... 5,630 13 63 1.0 12 238 3.8 8.8 .2 .5 225 .31 186 0 .. 3'7 8.8No\ 5. ......... . 3.730 11 6. 6.8 21 23-1 25 I' .3 1.2 268 .36 200 8 .6 468 6.'I\pr. 30. 1965. 226 '6 68 16 14 281 86 .., .6 17 522 .71 2'4 63 1.9 870 7. ,\hl) 17 ........... . <1.660 '2 56 5.7 15 1.1 22 11 .3 .5 216 .20 163 1 ., 377 7.6\1(1) 17 ...... ..... 5,3tlO 13 60 ••• ,.. 20' 18 '.6 .'1 .5 220 .30 110 3 .5 380 7.1May 1l:J. ...... .. 15.200 7.4 47 4.3 11 153 22 6.3 .3 2 2 116 .2' 135 10 .4 :J09 7.0\Ia)- I;) ..•.. ..... .10.400 ••• 6. 6.4 18 206 28 11 .1 2.5 247 .34 "6 11 .6 436 6.'.Junl:' I ........... 106 11 •• 20 54 218 82 6' .4 12 .15 .65 :102 74 1.4 800 7.6
5. CALAVERAS CREEK SUBWATERSHED NO. 6 NEAR ELMENDORF
Sl'pt. 6. 1962.Apr. 29. 1963.Mal. I. 1965.
6.'6.'6.7
6. CALAVERAS CREEK NEAR ELMESDORF
Api' 5. 1963 ...... 2:!.S 6.2 2·. 2 .• 3.' .1. 6.7 16 13 6.0 O. I 1 2 '01 0.11 1. 1 •. 2 112 6. ,S('pt 13. 13.9 •. 5 3. 3 6 11 126 23 '.1 .5 1.5 154 21 112 • ., '81 6.5f('b. 23. 1965..... 1.11 6.7 30 3 7 11 100 15 5.6 .3 .8 127 17 '0 1 ., 221 1.5Mil>' 18 ....... 13-10 '.2 32 2 1 2.' I ',2 116 1.8 2.6 .1 .2 ", .16 01 0 .1 '03 6.6
7. SAN ANTONIO RIVER NEAR FALLS CITY
Api'. 10. 1959. 8.5Mil)" 19. 1965..... 7.0Jun~ 3...... 7.2
8. ELM CREEK SEAR LAVERNIA
~la I'. 6 1963. (J.t -- -- -- -- ". 31'1 750 -- '.0 -- -- "0 7Hj -- :n If) Ij,f.l~1:11' . 11. 19611. c.OS '0 110 101 517 29. 708 1120 -- 1.5 3010 I. '19 III'} ]](10 ."i.q "70'1 7.0Mar 2' .. 1.17 12 6' 11 " 12<J 86 91 O. , 1.0 :189 . aJ :'11 •• 1.8 6" 6.'Feb. I., 1965. '2 1 " 21 2.' 3.6 5.5 62
"3.' . 3 3.2 100 II 6 • 13 .2 '60 7.2
SCI.' IOOlnOl.eS at end 01 t;1bl{·.

~
'"
Table 6. ·-Chemical :\natyses of Streams and Reservoirs in the San Antonio River Basin for Locations other Ulall Daily Slations··Continued
(Result.s in milligrams pel' lit.e,· except. as indicated.)
Dlaeolved solids Hardness SpecifIcBI- (calculated) as CaCO~ So- eon-
Dale CaI- Mag- Po- cu- Cu- Fluo NI- Bo- dhu. duet-of D18eharge SUlca Iron clum ne- Sodium taB- bon· bon· SulIate Chloride Tone CaI~.1 ad· pH(F.) ride Ir.te con Milli_ Tons dum Non- "."cp. ....
collection (eta) (SIOo) (Ca) .'um (N.) slum ate .te (SO.) (CII (P) (NO,) (B) grams pee Mag:1 cu·micro-
(Mg) (K) (HCO,) (CO,) pc. acre-pee
bon· lion~.? atliter loot day ne· ratlD 'S·C)slum ate
9. CIBOLO CREEK NEAR FALLS CITY
Oct. 25. 1961- 28.7 16 83 15 77 '11 147 76 0.5 1.8 a545 0.74 288 96 2.0 831 7.5Jan. 5. 1962 ..... 34.6 II 101 2l III 258 196 112 .3 7.1 3727 .99 338 127 2.6 1130 7.1Jail. 30 ......... 34 13 107 19 112 275 190 112 .3 7.6 a714 .97 345 120 2.6 1130 7.1ApI". 18 .......... 26.4 12 86 24 135 187 203 170 .3 2.2 a738 1.00 313 160 3.3 1200 7.'June 4 .......... 32 11 44 7.6 54 139 73 47 .3 .8 a326 ." 142 28 2.0 532 6.7
IAug. I. ..... 8.15 17 70 21 133 168 216 132 ., .0 672 .91 261 12' 3.6 1090 7.3Sept. 5 .......... 8.22 18 83 19 125 218 1.2 126 -. .2 670 .91 285 106 3.2 1100 7.5Oct.. 18 ........ 10.2 15 82 18 118 218 190 112 .3 .2 6'8 .94 278 100 3.1 1030 7.6Nov. 26 .... 14.0 16 87 2l 123 236 205 115 .3 .2 68' .'3 30' 110 3.1 1090 7.6Jan. J, 1963 ..... 19.2 I' 98 19 103 226 198 110 .<1 .0 a661 .90 322 138 2.5 1030 7.5Mar. 7 .......... 17.2 8.8 9S 18 100 212 197 10' .5 2.2 a637 .87 311 138 2.5 1020 7.2Aug. 7 ......... 4.81 19 82 2l 169 216 226 173 .5 .0 7.6 1.08 291 "' '.3 1270 7.3Nov. 10...... 312 6.8 38 3 7 II II' 23 8.8 .3 '.2 152 .2l 110 17 .5 271 6.6Jan. 28, 1964 .. 12.9 17 108 21 124 250 220 135 .2 .0 748 1.02 356 151 2.9 1200 7.8June 19 .......... 688 9.' '6 , 2 7.0 I 5. 150 15 6.5 .3 '.8 173 .24 132 9 .3 295 7.0July 21 ......... 5.36 13 82 16 103 213 158 110 ., .0 587 .80 270 .6 2.7 96' 7.1Aug. 25. .... 28.9 6.1 42 7.3 27 99 73 25 ., .8 231 .31 135 54 1.0 399 6.7Sept. 29 ......... 2700 II 68 5.' 2 6 I 3. 226 9 6 3.2 .3 .0 215 .29 192 7 .1 367 7.1Sept. 29 ......... 2400 7.9 58 ,., 2 9 ,. 187 10 3.6 ., '.8 188 .28 183 10 . 1 327 7.2Oct. I ..... .... 126 8. , 59 5.1 II 18' 24 8.8 ., 3.5 210 .29 188 17 ., 381 7.1Nov. 2. 17 7 9.6 52 7.' 39 180 57 38 .6 1.5 282 .38 180 29 1.3 479 7.1Feb. 17. 1965 .... 2790 11 83 5.1 8.1 I 4. 205 18 6. I .3 2.5 219 .30 178 10 .3 382 7.1Apr. 29 .......... 753 15 87 15 85 254 134 80 .3 1.0 542 .74 278 70 2.2 891 7.2
"" 18. ... 8190 6.3 47 3.6 2.9 I,. 159 8.8 3.0 .1 1.2 ISS .2l 132 2 .1 276 7.0
May 20 .......... 5540 3.8 60 4.0 5.4 4.' 201 14 5. I .2 .2 198 .27 186 I .2 351 7.3May 21 ........... IJ20 II 57 5 8 12 18' 21 9.3 .1 3.2 211 .29 166 12 .4 367 7.0June 4 ........... 110 12 97 16 52 298 87 59 .3 4.8 474 .84 308 66 1.3 802 6.8
10. ECLETO CREEK NEAR RUNGE
Oct. 24, 1961. 1- 03 12 32 3.4 43 144 17 35 0.5 0.5 214 0,29 '4 0 1.9 371 7.0Jan. 2, 1962 ..... 1.36 20 72 ••• "' 314 64 108 .5 .5 a570 .78 220 0 3.5 928 7.6Jan. 30 .......... 1.1 17 76 12 148 342 79 139 .5 .0 a647 .88 23. 0 , .2 1080 7.5June 2 ........... 971 12 SO 1.6 6.1 I 5. 188 4.4 6.0 .2 .0 169 .23 131 0 .2 292 6.'June 4 ........... 750 12 23 2.' 28 .6 14 23 .3 1.5 lSI .21 67 0 1.5 262 6.5June 5 .... 159 II 22 3.5 33 92 26 26 .4 2.0 169 .23 6. 0 1.7 304 6.3Sept. 27 ........ .01 19 36 3.1 13 134 6 8 8.5 .2 1.2 154 .2l 103 0 .6 246 6.6Dec. 18. 1963. 1.0J 10 20 2.2 15 74 13 12 .2 1.0 109 . 15 59 0 ., 197 6.5ApI". 3, 1964. c 21 18 56 5.5 91 264 23 84 .4 .5 406 .SS 182 0 3. I 719 7.3Aug. 8. 194 18 40 2.5 10 147 5.6 2 8 .2 2 0 153 .21 110 0 .4 254 6.7Jan. 22. 1965. 2650 12 26 2.2 10 102 5 2 3.0 .3 2 2 III .IS 74 0 .5 178 7.4Jan. 23 .. 459 9 8 14 2.4 13 60 11 7.2 .2 3.5 91 .12 4S 0 .8 1S7 6.6Feb. 16 .. 67.8 13 44 3.5 15 1<11 15 17 .1 2 2 179 .24 124 9 .6 324 7. IApr. 29 .......... .10 20 125 16 131 296 119 20. .4 .2 767 1.04 378 136 2.9 1360 7.2Yay 21 ........... 82 II 16 \.7 13 65 9 0 7.3 .2 1.0 91 .12 47 0 ., 153 6.1Yay 22. ......... 299 12 20 2 2 12 76 9 '1 8.3 .1 2.5 104 .14 59 0 .7 177 6.5May 25 .......... , 41 19 36 , 9 26 138 l7 24 .3 .8 196 .27 110 0 1.1 331 7.6
See footnotes at end of table.

~
Table 6. --Chemical Analyses of Streams and Heservoirs Ln the San Antonio lliver Basin for Locations other than Daily Stalion8--Continued
(ResulU In milligrams per 11tel' except nit lndicated.)
Dlaaclnd acHcIa Hardness SpeeUle(calculatC'd) as CaCO~ So- con-BI-
dlum duct-Mac- Po- car- Car- Fluo N'- Bo- Cal-Non- ad- ...e pH
Cal-bon- SulIate Chloride Milll- Tons 100",-
DateU'e Iron ne- Sodium tu- bon- ride Irate ,on Tons clum,
mlcro-Diacbarge e'um .te (SO.) (C1) (Pl (NOJ (B) grams pe, Mac- ear-
llon !"moa at
or(Slo,) (Fe) alum (Na) sturn ate per
bon-
collection (ets) (Cal(K) (COJ .e, acre·
,_(Mol (HCOJ
11 ter day ne-ate 2S·C)loot alum
11 ESCONDIDO CREEK SUBWATERSHED NO, 1 NEAR KENEDY
Jan. 11, 1955.... -- -- -- -- 110 -- 3.' -- -- -- -- 14 0 -- 2-11 7.5June I ........... -- -- -- 7.' 120 2.0 3.' -- -- -- -- 8. 0 -- 22. 7.2July 13 .......... 10 32 1.5 .. , I ••• 114 2.' 2.0 0.' 3.8 a123 0.17 86 0 0.2 230 7 .•Jan. '1, 1956. .. 3.0 2. 2.7 12 10. 1.5 3.8 ., I., a1l5 .16 72 0 .6 18' 7.3July 10 ....... · .. -- -- -- -- '.0 -- 3.' -- -- . - -- 138 0 -- 295 7.2
Oec. 17 ....... -- -- -- -- 1'6 -- '.0 -- -- a160 .22 117 0 -- ". 7.5Feb. 25, 1957. '.0 21 1.7 12 83 7.2 .. , .5 3.5 .6 .13 5. 0 .7 1.3 7.'Milr. 12 .......... II 22 1.3 10 87 3.' 3.2 ., 3.0 .7 .13 61 0 .6 16. 7.8Apr. 17 ...... 12 30 1.6 ••• I 6.2 III 2.8 2.' .5 3.2 I" .18 81 0 .2 166 6.'Apr. 22 ....... 18 42 2.3 I' 1.3 5.' 10 .8 5.0 a183 .25 113 0 .8 28' 7.5
Apr. 27 . ...... 7.8 I' .. ••• 7J .6 .0 .5 2.0 7J .10 51 0 .3 127 7.'Sept. 30 .. 6.0 23 1.6 6.8 8.0 .6 3.8 .. , . 2 1.0 102 · I' 6. 0 .. 114 7 .•Nov. 18. 1957 .... -- -- -- -- -- 118 -- 2.' -- -- -- -- 88 0 -- 205 7.2Jan. 6, 1958 ..... -- -- -- -- -- 10. -- 2.2 -- -- -- -- 77 0 -- 170 7.6Jan. 27 .......... -- -- -- -- -- 106 -- 3.0 -- -- -- -- 75 0 -- IS' •. 2
lilly 28 ........... -- -- -- -- -- 10' -- 3.0 -- -- -- -- 77 0 -- 180 7.'Fcb. 10. 1959.... I., 33 2.8 6 .• 6.' 120 7.2 '.8 .. 3.2 126 .17 •• 0 .3 236 7.5Oc t. 26 ........ 12 36 2.0 3.8 7 .• 131 .6 3.0 .. .8 11143 .1' •• 0 .2 233 7.0Milr. 10. 1960. ..7 36 2.0 5.0 6.3 126 3.6 3.0 .2 '.0 131 .18 .8 0 .2 228 7.0Au". 2 ........... 8.0 .3 2.2 12 163 .6 '.8 .3 .2 151 .21 116 0 ., 271 7.0
Mar. 9, 1961. 1.0 42 3.0 IS 13' 6.8 22 .2 .8 157 .21 117 7 .6 303 7.0Sept. 4. 1962. II 57 3.0 26 224 10 '.0 -- 5.6 232 .32 ISS 0 .. 37. 7.0Mal'. 7, 1963. 6.6 .3 2.' '.3 I 5.6 153 .2 2.8 .3 .2 140 .1' 117 0 .2 256 6.'Fcb. IS. 1965 .... 10 30 1.3 3.5 '.0 108 .8 1.2 .3 .2 10' · I' 80 0 .2 180 7.0May 20 .......... 10 33 I., II 124 '.2 I., .3 2.2 125 .17 88 0 .5 211 7 .•
May 21 ........... 12 33 2.3 5.6 I '.5 122 5.2 2.0 .2 2.8 12. .17 '2 0 .3 211 7.5May 24 ......... II 33 2. I 6.0 '.6 124 '.6 2.3 .3 2.2 127 .17 .1 0 .3 21' 7.8
12. ESCONDIDO CREEK AT KENEDY
May 3, 1959 ...... 0 10 54 ••• 38 168 17 56 O.·j 1.0 26. 0.36 IS. 17 1.3 '87 7 .•Apr. 30, 1963 ... 82.7 23 28 2.1 16 100 II II .6 2.2 143 .1' 78 0 .8 221 6.'May I ....•....... 11.2 16 36 2.' 27 145 20 12 1.0 1.0 187 .25 102 0 1.2 30' 6.8Feb. 15. 1965. c. I 16 '0 2.7 32 14' 18 2. .6 .2 210 . 2' III 0 1.3 351 7 .•.·cb. 16 ........ 1360 I' 52 2.7 6.1 I '.5 182 7.2 3.0 .. .2 17. .24 1.1 0 .2 2" 7 .•Feb. 17 ....... 200 II 50 3.2 23 173 12 23 .6 .0 208 .2. 138 0 .. 363 7.3
13. ESCONDIDO CREEK SUBWATERSHED NO. 11 (DRY ESCONDrDO CREEK) NEAR KENEDY
Sept. I' . 1962. 1.7 23 3.2 28 118 '.8 21 0.3 0.0 1.0 0.19 71 0 I., 263 6.5Oct. 30. 1964. 3.3 2. '.1 10' 273 8.' 72 .5 .5 361
• •• llO 0 '.3 8.7 6.8Feb. 15. 1965 .... .. , 26 3.' 2. I" 7.8 24 .. 1.2 160 .22 7. 0 I.. 285 7.3Feb. 19 .......... ••• 25 l.4 21 106 6.' 14 .3 .5 130 .18 68 0 1.1 22. 7.0
• ReSidue at 1S0·C.b Includes the equivalent of n mUhgrtl1ll8 per ILter carbonate (CO;l),c Field estimate.