recommendation on base station antenna standards · steven yuyanmim (huawei) approved by / date :...
TRANSCRIPT

Commercial Address: Registered Office: ngmn Ltd., ngmn Ltd., Friedrich-Ebert-Anlage 58 • 60325 Frankfurt • Germany Reading Bridge House • George Street • Reading •
Berkshire RG1 8LS • UK Phone +49 69/9 07 49 98-04 • Fax +49 69/9 07 49 98-41 Company registered in England and Wales n. 5932387,
VAT Number: GB 918713901
Recommendation on Base Station Antenna Standards
by NGMN Alliance
For all Confidential documents (CN, CL, CR): This document contains information that is confidential and proprietary to NGMN Ltd. The information may not be used, disclosed or reproduced without the prior written authorisation of NGMN Ltd., and those so authorised may only use this information for the purpose consistent with the authorisation. For Public documents (P): © 2011 Next Generation Mobile Networks Ltd. All rights reserved. No part of this document may be reproduced or transmitted in any form or by any means without prior written permission from NGMN Ltd.
The information contained in this document represents the current view held by NGMN Ltd. on the issues discussed as of the date of publication. This document is provided “as is” with no warranties whatsoever including any warranty of merchantability, non-infringement, or fitness for any particular purpose. All liability (including liability for infringement of any property rights) relating to the use of information in this document is disclaimed. No license, express or implied, to any intellectual property rights are granted herein. This document is distributed for informational purposes only and is subject to change without notice. Readers should not design products based on this document.

t
Page 2 (119) N-P-BASTA White Paper Version 9.6 <15 -January -2013 >
Version: 9.6
Date: 15-January-2013
Document Type: Final Approval Submission
Confidentiality Class: P - Public
Project: N-P-BASTA Editor / Submitter: Kevin Linehan (CommScope)
Paolo Gianola (Telecom Italia) Additional Contributors:
Rudolf Sobotka (Deutsche Telekom) Roland Gabriel (Kathrein) Arne Dominik (RFS) Jesper Uddin (Powerwave) Steven Yuyanmim (Huawei)
Approved by / Date: NGMN Board 6th February 2013

t
Page 3 (119) N-P-BASTA White Paper Version 9.6 <15 -January -2013 >
Abstract This white paper addresses the performance criteria of base station antennas (BSAs), by making recommendations on standards for electrical and mechanical parameters, and by providing guidance on measurement practices in performance validation and production. It also addresses recommendations on applying existing environmental and reliability standards to BSAs.

t
Page 4 (119) N-P-BASTA White Paper Version 9.6 <15 -January -2013 >
Document History Date Version Author Changes 29-Sep-2011 V1.0 D. McLean/Commscope New Document 3-Oct-2011 V2.0 D. McLean/Commscope Added caption to figures; added an
additional figure to the Elevation Beampeak
14-Nov-2011 V3.0 D. McLean/Commscope Sections 2.9, 2.10, 2.11, 2.12, 2.13 and 2.14
29-Nov-2011 V4.0 D. McLean/Commscope 2.1.13, 2.1.15, 2.1.20, 2.1.27, 2.1.29, and 3.0
9-Jan-2012 V5.0 D. McLean/Commscope Revised Table of Contents 23-Jan-2012 V5.1 P. Bisiules/Commscope Updated format for all parameters
sections, updating parameter content where applicable, re-numbered figures
25-Jan-2012 V5.2 Kevin Linehan/Commscope Various edits 6-Feb-2012 V5.3 Dottie McLean/Commscope Sections 2.2.3, 2.2.15, 3.2, 3.3,
3.3.1 – 3.3.17, 5.4.2 21-Feb-2012 V5.4 Dottie McLean/Commscope Sections 2, 3, 5 29-Feb-2012 V5.5 Paolo Gianola Insert new section 2
Modified sections: 3.2.2, 3.2.3, 3.2.5, 3.2.9, 3.2.10
29-Feb-2012 V6.0 Kevin Linehan Added an abstract. Edited section 1, 3.1, 3.2.1, 3.2.2, 3.2.3, 3.2.4, 3.2.5, 3.4,3.5 Added sections 6.1, 6.2, 6.3
07-March-2012 V6.1 BASTA Team Various edits all major sections 13-March-2012 V6.2 Arne Dominik Section 4 26-March-2012 V6.3 Arne Dominik Section 4 4-April-2012 V6.4 Arne Dominik Section 4 10-April-2012 V6.5 Dottie McLean Section 6.4 12-April-2012 V6.6 Dottie McLean Sections 2.8, 3.2.9, 3.2 17-April-2012 V6.7 Dottie McLean Numerous sections 21-April-2012 V6.8 Dottie McLean Numerous sections 24-April-2012 V6.9 Dottie McLean Various sections 24-April-2012 V6.10 Kevin Linehan Various sections. Edited frequency
table. 3-May-2012 V6.10d Dottie McLean Section 8 4-May-2012 V6.10e Dottie McLean Section 4.4 7– May-2012 V6.10g Kevin Linehan Section 4.0 8- May 2012 V6.11 Dottie Mclean Issued to BASTA 28– May-2012 V7.0 Kevin Linehan Accepted all changes as of V6.11
Various contributions and edits – all sections
29– May-2012 V7.1 Kevin Linehan Update section on data file format and updated the table of contents
1–June 2012 V7.2 Kevin Linehan Minor edits 14-June-2012 V7.5 Dottie McLean Whole document edited for typos,
grammar, etc.

t
Page 5 (119) N-P-BASTA White Paper Version 9.6 <15 -January -2013 >
19-June-2012 V8.0 Dottie McLean Minor edits entire paper 29-June-2012 V9.0 Dottie McLean Minor edits entire paper 3-July-2012 V9.2 Dottie McLean Minor edits entire paper 12-October-2012 V9.3 Kevin Linehan Edits based on conditional
approvals and corrections 15-October-2012 V9.4 Dottie McLean Minor Spelling errors 11-December-2012 V9.5 Kevin Linehan Added an over all tilts gain
specification with tolerance 15-January-2013 V9.6 Kevin Linehan/Dottie McLean Minor edits entire paper

t
Page 6 (119) N-P-BASTA White Paper Version 9.6 <15 -January -2013 >
Table of Contents 1 Introduction and Purpose of Document .................................................................................................................. 12 2 Antenna Terms Definition ........................................................................................................................................ 12
2.1 Radiation Intensity .......................................................................................................................................... 12 2.2 Radiation Sphere ........................................................................................................................................... 12 2.3 Far Field Radiation Pattern ............................................................................................................................ 12 2.4 Far Field Radiation Pattern Cut ..................................................................................................................... 12 2.5 Total Power Radiation Pattern Cut ............................................................................................................... 13 2.6 Beam and Reference Antenna Axis ............................................................................................................. 13 2.7 Half-Power Beamwidth (HPBW) ................................................................................................................... 13 2.8 Electrical Down-Tilt Angle .............................................................................................................................. 13
3 Parameter and Specifications .................................................................................................................................. 14 3.1 Format ............................................................................................................................................................. 14 3.2 RF Specifications Required ........................................................................................................................... 15
3.2.1 Frequency Range ...................................................................................................................................... 15 3.2.2 Polarization ................................................................................................................................................ 15 3.2.3 Gain ............................................................................................................................................................ 16 3.2.4 Azimuth Beamwidth................................................................................................................................... 17 3.2.5 Elevation Beamwidth ................................................................................................................................. 18 3.2.6 Electrical Downtilt ...................................................................................................................................... 20 3.2.7 Elevation Downtilt Deviation ..................................................................................................................... 20 3.2.8 Impedance ................................................................................................................................................. 21 3.2.9 VSWR......................................................................................................................................................... 21 3.2.10 Return Loss ........................................................................................................................................... 23 3.2.11 Cross Polar Isolation ............................................................................................................................. 24 3.2.12 Passive Intermodulation ....................................................................................................................... 26 3.2.13 Front-to-Back (F/B) Ratio, Total Power, +/- 30° .................................................................................. 27 3.2.14 First Upper Side Lobe Suppression ..................................................................................................... 28 3.2.15 Upper Side Lobe Suppression, Peak to 20° ....................................................................................... 29 3.2.16 Cross Polar Discrimination over Sector ............................................................................................... 30 3.2.17 Maximum Effective Power per Port ..................................................................................................... 31 3.2.18 Interband Isolation ................................................................................................................................ 32
3.3 RF Specifications Optional ............................................................................................................................ 33 3.3.1 Port- to-Port Isolation ................................................................................................................................. 33 3.3.2 Front-to-Back Ratio over 30º Angular Region—Total Power AZ & EL .................................................. 34 3.3.3 Azimuth Beam Squint ................................................................................................................................ 36 3.3.4 Null Fill ........................................................................................................................................................ 37 3.3.5 Cross Polar Discrimination at Boresight .................................................................................................. 38 3.3.6 Cross Polar Discrimination over 3 dB Azimuth Beamwidth .................................................................... 40 3.3.7 Cross Polar Discrimination over 10 dB Beamwidth ................................................................................ 41 3.3.8 Cross Polar Discrimination over the 3 dB Elevation Beamwidth ............................................................ 42 3.3.9 Cross Polar Discrimination over the 10 dB Elevation Beamwidth .......................................................... 43 3.3.10 Azimuth Beam Port-to-Port Tracking ................................................................................................... 43 3.3.11 Azimuth Beam H/V Tracking ................................................................................................................ 44 3.3.12 Azimuth Beam Roll-Off ......................................................................................................................... 45 3.3.13 Elevation Beam Squint ......................................................................................................................... 46 3.3.14 Upper Sidelobe Suppression Horizon to + 20 degrees ...................................................................... 48 3.3.15 Maximum Upper Sidelobe Level .......................................................................................................... 49 3.3.16 Azimuth Interference Ratio ................................................................................................................... 50

t
Page 7 (119) N-P-BASTA White Paper Version 9.6 <15 -January -2013 >
3.3.17 Azimuth Beam Pan Angle .................................................................................................................... 51 3.3.18 Azimuth Beam Pan Range ................................................................................................................... 51 3.3.19 Azimuth Beamwidth Fan Range .......................................................................................................... 52
4 Validation and Specification of RF Parameters ...................................................................................................... 54 4.1 Industry Practice for Base Station Antennas ................................................................................................ 54 4.2 General Guidance .......................................................................................................................................... 54 4.3 Absolute RF Parameters ............................................................................................................................... 55 4.4 Statistical RF Parameters .............................................................................................................................. 55
4.4.1 General methodology ................................................................................................................................ 55 4.4.2 Double-Sided Specifications ..................................................................................................................... 56 4.4.3 Double-Sided Specification Example–Azimuth Beamwidth Validation .................................................. 57 4.4.4 Double-Sided Specification Example–Azimuth Beam Squint Validation ............................................... 60 4.4.5 Single-sided Specifications ....................................................................................................................... 62 4.4.6 Single-sided Specification Example–F/B Total Power +/- 30° Validation .............................................. 63 4.4.7 Single-sided Specification Example–Upper Side Lobe Suppression 20° Validation ............................ 66
4.5 Gain Validation ............................................................................................................................................... 69 4.5.1 Gain Validation for a Single Tilt Value .......................................................................................................... 70 4.5.2 Gain Validation for the “Over All Tilts” Value ................................................................................................ 73 4.6 Validation of Elevation Downtilt Deviation .................................................................................................... 76 4.7 Guidance on Gain Specifications Provided in Radio Planning Files .......................................................... 79
5 Mechanical Parameters and Specifications ............................................................................................................ 79 5.1 Antenna Dimensions: Length, Width, Depth ................................................................................................ 79 5.2 Mechanically Tilted Antennas: Impact on Antenna Loads .......................................................................... 80 5.3 Packing Size ................................................................................................................................................... 81 5.4 Net Weight ...................................................................................................................................................... 82 5.5 Shipping Weight ............................................................................................................................................. 82 5.6 Connector Type .............................................................................................................................................. 83 5.7 Connector Quantity ........................................................................................................................................ 83 5.8 Connector Position ......................................................................................................................................... 84 5.9 Antenna Connector Specification: Marking .................................................................................................. 84 5.10 Windload, Calculation .................................................................................................................................... 85 5.11 Windload, Maximum ...................................................................................................................................... 85 5.12 Windload, Frontal ........................................................................................................................................... 86 5.13 Windload, Lateral ........................................................................................................................................... 86 5.14 Survival Wind Speed ..................................................................................................................................... 87 5.15 Radome Material ............................................................................................................................................ 87 5.16 Radome Color ................................................................................................................................................ 88 5.17 Product Environmental Compliance ............................................................................................................. 88 5.18 Mechanical Distance between Mounting Points—Antenna ........................................................................ 89 5.19 Mechanical Distance between Mounting Points – Pole .............................................................................. 89 5.20 Lightning Protection ....................................................................................................................................... 90
6 Environmental Standards......................................................................................................................................... 90 6.1 23458293Base Station Antenna Environmental Criteria ............................................................................. 90 6.2 Environmental Test Approach ....................................................................................................................... 91 6.3 Environmental Test Methods ........................................................................................................................ 92
6.3.1 Packaged Storage ..................................................................................................................................... 92 6.3.2 Cold Temperature Survival ....................................................................................................................... 92 6.3.3 Hot Temperature Survival ......................................................................................................................... 92 6.3.4 Temperature Cycling ................................................................................................................................. 93 6.3.5 Vibration – Sinusoidal ................................................................................................................................ 93 6.3.6 Humidity Exposure .................................................................................................................................... 93 6.3.7 Rain ............................................................................................................................................................ 93

t
Page 8 (119) N-P-BASTA White Paper Version 9.6 <15 -January -2013 >
6.3.8 Water Ingress............................................................................................................................................. 93 6.3.9 Dust and Sand Ingress .............................................................................................................................. 94 6.3.10 Survival Wind Speed ............................................................................................................................ 94 6.3.11 UV/Weather Exposure .......................................................................................................................... 94 6.3.12 Corrosion Resistance ........................................................................................................................... 95 6.3.13 Shock & Bump ...................................................................................................................................... 95 6.3.14 Free Fall (Packaged Product) .............................................................................................................. 96 6.3.15 Broad Band Random Vibration ............................................................................................................ 96 6.3.16 Steady State Humidity .......................................................................................................................... 96
7 Reliability Standards ................................................................................................................................................. 96 8 Additional Topics ...................................................................................................................................................... 97
8.1 Recommended Subbands and Associated Frequency List ........................................................................ 97 8.2 Guidance on Pattern and Gain Measurements ......................................................................................... 100
8.2.1 Mechanical Alignment of Test System ................................................................................................... 100 8.2.2 Phase Center Check ............................................................................................................................... 100 8.2.3 Antenna Pattern Testing ......................................................................................................................... 100 8.2.4 Pattern Accuracy Estimation ................................................................................................................... 101 8.2.5 Gain Measurement .................................................................................................................................. 101
8.3 Guidance on Production Electrical Testing ................................................................................................ 103 8.4 Recommend Vendor’s Reference Polarization Labelling Convention ..................................................... 104 8.5 Discussion of the Accuracy of Gain Measurements .................................................................................. 105 8.5.1 Gain by Comparison .................................................................................................................................... 105 8.5.2 Antenna Mismatch between Reference Antenna and AUT ...................................................................... 106 8.5.3 Size Difference between Reference Antenna and AUT ............................................................................ 106 8.5.4 Temperature/Humidity Draft in Instruments ............................................................................................... 106 8.5.5 Polarization ................................................................................................................................................... 106 8.5.6 Direct Gain Comparison Between Two Antennas ..................................................................................... 107 8.5.7 Reference Antenna ...................................................................................................................................... 107
9 Format for the Electronic Transfer of Specification Data ..................................................................................... 107 9.1 XML Generic ................................................................................................................................................ 107 9.2 XML use for BSA specifications .................................................................................................................. 108
APPENDIX A – EXAMPLE SPECIFICATIONS SHEET ............................................................................................. 113 APPENDIX B – EXAMPLE SPECIFICATION XML DATA FILE ................................................................................ 115

t
Page 9 (119) N-P-BASTA White Paper Version 9.6 <15 -January -2013 >
List of Figures Figure 1—Conical and great circles cuts over the radiation sphere. ............................................................................ 13 Figure 2—Electrical down tilt angle. ................................................................................................................................ 14 Figure 3—Calculation of azimuth beamwidth value for a single frequency, port, and tilt. ........................................... 18 Figure 4—Example of VSWR measurement of an antenna port. ................................................................................. 22 Figure 5—Example of a return loss measurement on a single antenna port. .............................................................. 23 Figure 6—Cross polar isolation example—single column antenna. ............................................................................. 24 Figure 7—Cross polar isolation dual column antenna. .................................................................................................. 25 Figure 8—Example of a cross polar isolation measurement between two antenna ports. ......................................... 26 Figure 9—Angular region for front-to-back, +/- 30°. ....................................................................................................... 27 Figure 10—First upper side lobe suppression................................................................................................................ 28 Figure 11—Upper side lobe suppression, peak to 20º. ................................................................................................. 29 Figure 12—Cross pol discrimination over the sector. .................................................................................................... 30 Figure 13—Interband isolation examples. ...................................................................................................................... 33 Figure 14—Interband isolation vs. frequency on a single pair of ports. ........................................................................ 33 Figure 15—F/B angular regions, azimuth and elevation. .............................................................................................. 34 Figure 16—Illustration of a 3 dB bisected beam squint calculation for a given frequency, tilt and port. ..................... 36 Figure 17—Identification of the lower first null. ............................................................................................................... 37 Figure 18—Cross pol discrimination at boresight. ......................................................................................................... 39 Figure 19—Cross pol discrimination at 3 dB azimuth beamwidth. ............................................................................... 40 Figure 20—Cross pol discrimination at 10 dB azimuth beamwidth. ............................................................................. 41 Figure 21—Azimuth beam port-to-port tracking. ............................................................................................................ 44 Figure 22—Azimuth beam H/V tracking. ........................................................................................................................ 45 Figure 23—Azimuth beam roll-off. .................................................................................................................................. 46 Figure 24—Elevation beam squint. ................................................................................................................................. 47 Figure 25—Upper side lobe suppression horizon to +20º. ............................................................................................ 48 Figure 26—Maximum Upper Side Lobe Level. .............................................................................................................. 49 Figure 27—Pattern of an azimuth beam steering antenna panned to +30°. ................................................................ 51 Figure 28—Variable azimuth beamwidth BSA, (35°/65°/105° pattern overlays). ........................................................ 52 Figure 29—Double-sided specification. ......................................................................................................................... 57 Figure 30—Azimuth beam peak patterns plots - 1710 - 1880 MHz, all ports, and all tilts. .......................................... 57 Figure 31—Plot of azimuth beamwidth values. .............................................................................................................. 59 Figure 32—Histogram of azimuth beamwidth values. ................................................................................................... 59 Figure 33—Plot of azimuth beam squint value. ............................................................................................................. 61 Figure 34—Histogram of azimuth beam squint value. ................................................................................................... 62 Figure 35—Single-sided specification (maximum)......................................................................................................... 63 Figure 36—Single-sided specification (minimum). ......................................................................................................... 63 Figure 37—Azimuth pattern plots – 1710 to 1880 MHz, all ports, and all tilts. ............................................................. 64 Figure 38—Plot of F/B, total power, +/- 30 degrees. ...................................................................................................... 66 Figure 39—Histogram F/B, total power, +/- 30 degrees. ............................................................................................... 66 Figure 40—Upper side lobe suppression, peak to 20º. ................................................................................................. 67 Figure 41—Elevation pattern plots – 1710 to 1880 MHz, all ports, and all tilts. ........................................................... 68 Figure 42—Gain plot for 0º tilt, both ports. ...................................................................................................................... 72 Figure 43—Gain histogram. ............................................................................................................................................ 72 Figure 44—Gain plot with repeatability margin. specification. ....................................................................................... 73 Figure 45—Gain plot for all tilts, both ports. .................................................................................................................... 75 Figure 46—Gain histogram. ............................................................................................................................................ 75 Figure 47—Gain plot with repeatability margin. ............................................................................................................. 76

t
Page 10 (119) N-P-BASTA White Paper Version 9.6 <15 -January -2013 >
Figure 48—Elevation pattern plots – 1710 to 1880 MHz, all ports, and all tilts. ........................................................... 77 Figure 49—Histogram of down tilt deviation—3 subbands. .......................................................................................... 78 Figure 50—Antenna dimensions example. .................................................................................................................... 79 Figure 51—Spherical coordinate system for the installed BSA..................................................................................... 80 Figure 52—Mechanically tilted antenna example. ......................................................................................................... 81 Figure 53—Bottom end cap example with marking. ...................................................................................................... 85 Figure 54—Example highlighting the potential differences of the mechanical distance between mounting points for antenna and pole. ............................................................................................................................................................. 90 Figure 55—Common cellular frequency bands—Low band (approximately 1 GHz) .................................................. 97 Figure 56—Common cellular frequency bands—high band (approximately 2 GHz). ................................................. 99 Figure 57—Spherical nearfield system. ........................................................................................................................ 102 Figure 58—Block diagram of loss measurement. ........................................................................................................ 103 Figure 59—Example polarization conventional label. .................................................................................................. 104 Figure 60—Polarization conventional label of the antenna back. ............................................................................... 105 Figure 61—Ports identified by polarization. .................................................................................................................. 105 Figure 62—Example probed data of a quite zone, amplitude ripple. .......................................................................... 106

t
Page 11 (119) N-P-BASTA White Paper Version 9.6 <15 -January -2013 >
List of Tables Table 1—Full parameter value data set – one subband. .............................................................................................. 56 Table 2—Complete data set azimuth beamwidths. ....................................................................................................... 58 Table 3—Summary of azimuth beamwidth statistics (1710 – 1880 MHz). .................................................................. 58 Table 4—Complete data set azimuth beam squint values. ........................................................................................... 60 Table 5—Summary of azimuth beam squint statistics (1710 – 1880 MHz). ................................................................ 60 Table 6—Complete data set total power F/B. ................................................................................................................ 64 Table 7—Summary of total power F/B statistics (1710 – 1880 MHz). .......................................................................... 65 Table 8—Complete data set upper side lobe suppression, peak to 20°. ..................................................................... 68 Table 9—Summary of upper side lobe suppression statistics (1710-1880 MHz). ....................................................... 68 Table 10—Complete data set gain (1710 – 1880 MHz, 0° tilt) . .................................................................................... 70 Table 11—Summary of gain statistics (1710 – 1880 MHz, 0° tilt)................................................................................. 71 Table 12—Complete data set gain, over all tilts, 1850 – 1990 MHz. ............................................................................ 74 Table 13—Summary of gain statistics, over all tilts, 1850 – 1990 MHz. ....................................................................... 74 Table 14—Complete data set elevation downtilt deviation. ........................................................................................... 77 Table 15—ETSI 300 019-1-4 stationary, non-weather protected environmental classes. .......................................... 91 Table 16—Free fall test heights....................................................................................................................................... 96 Table 17—NGMN recommended low band BSA subband frequency ranges. ........................................................... 97 Table 18—Common cellular bands in the low band NGMN BSA subbands. .............................................................. 97 Table 19—NGMN BSA subband frequency table for low band. ................................................................................... 97 Table 20—NGMN recommended high band BSA subband frequency ranges. .......................................................... 99 Table 21—Common cellular bands in the high band NGMN BSA subbands. ............................................................. 99 Table 22—NGMN BSA subband frequency table for high band. ................................................................................. 99

t
Page 12 (119) N-P-BASTA White Paper Version 9.6 <15 -January -2013 >
1 INTRODUCTION AND PURPOSE OF DOCUMENT
The performance of a Base Station Antenna, or a BSA, is a key factor in the overall performance and quality of the cellular communication link between a handset and the radio, and by extension, the performance of a cell, or of an entire cellular network. The BSA’s influence on coverage, capacity, and QoS is extensive, and yet there exists no comprehensive, global, standards focusing on the base station antenna. The purpose of this white paper is to begin to address this gap. In particular, the following topics will be covered in various degrees of detail:
• Definitions of common BSA electrical and mechanical parameters and specifications • Relevance of individual BSA parameters to network performance • Issues surrounding various parameters • Guidance on antenna measurement practices in design and production • Recommendations on
o applying statistical methods to the calculation and validation of specifications o applying existing environmental and reliability standards to BSA systems o a format for the electronic transfer of BSA specifications from vendor to operator
The scope of this paper is limited to passive base station antennas. No performance classes of antennas will be defined.
2 ANTENNA TERMS DEFINITION
This section reports the definition of commonly used antenna terms. Most definitions are from the IEEE Standard (IEEE Standard definitions of Terms for Antennas, IEEE Std 145-1993, 18 march1993), tailored to the class of antennas under test by means of notes.
2.1 Radiation Intensity Radiation intensity is the power radiated from an antenna per unit solid angle in a given direction.
2.2 Radiation Sphere Radiation sphere is a large sphere surrounding the antenna, over which quantities characterizing the radiation are determined. The sphere center is located in the antenna volume and the surface is in the antenna far-field.
2.3 Far Field Radiation Pattern Far field radiation pattern (or antenna pattern) is the spatial distribution of the electric field generated by an antenna on the radiation sphere.
2.4 Far Field Radiation Pattern Cut Far field radiation pattern cut is any path on the radiation sphere over which a radiation pattern is obtained. Notes: the path formed by the locus of points for which ϑ is a specified constant and φ is a variable () is called a “conical cut,” in the following also called an “azimuth cut”. Horizontal cut is the azimuth cut with ϑ equal to 90°. Down-tilt cut is the azimuth cut containing the beam axis. The path formed by the locus of points for which φ is a specified constant and ϑ is a variable () is called a “great circle cut”. The great circle cut containing the beam peak is called vertical or elevation cut.

t
Page 13 (119) N-P-BASTA White Paper Version 9.6 <15 -January -2013 >
2.5 Total Power Radiation Pattern Cut
Beam and reference antenna axis total power radiation pattern cut are obtained by measuring two orthogonal components of the electric field, e.g., the co-polar and cross-polar components or the elevation and azimuth components. Let LV and LH the vertical and horizontal components respectively, in dB. The total power pattern cut, in dB, is computed by adding the two orthogonal components
)1010(log10 10/10/10
HV LL +⋅ and normalizing it with respect to the maximum.
2.6 Beam and Reference Antenna Axis The main beam is the major lobe of the radiation pattern of an antenna. The main beam peak axis is the direction, within the major lobe, for which the radiation intensity is maximum. The mechanical boresight or antenna reference axis is the axis orthogonal to the antenna aperture.
2.7 Half-Power Beamwidth (HPBW) Half-power beamwidth (HPBW) is, in a radiation pattern cut containing the beam axis, the angle between the two directions in which the radiation intensity is one-half the maximum value. Principal half-power beamwidths (of the antenna beam) are, for a pattern whose beam has a half-power contour that is essentially elliptical, the half-power beamwidths in the two pattern cuts that contain the major and minor axes of the ellipse. Note: in this paper the principal half-power beamwidths are the half-power beamwidth in the azimuth cut and elevation cut.
2.8 Electrical Down-Tilt Angle Down-tilt angle is, in the elevation cut, the angle between the antenna reference axis and the half-power beam axis (Figure 2).
Antenna RF connectors
elevation cut
azimuth cut
Figure 1—Conical and great circles cuts over the radiation sphere.
elevation cut

t
Page 14 (119) N-P-BASTA White Paper Version 9.6 <15 -January -2013 >
Down-tilt angle
Reference axis
Half-power beam axis
Z
Figure 2—Electrical down tilt angle.
3 PARAMETER AND SPECIFICATIONS
3.1 Format
Specifications will be classified as recommend to be required or optional. The following format will be used to for specifications: Parameter Name Parameter Definition • A description of the parameter in terms of the antenna properties using standard antenna and cellular
communications terminology. Specification Definition • A definition for each element of the specification and associated unit of measure. • An example of each element of the specification. • The specification, if not absolute, will be identified as a nominal, maximum, minimum, or mean value. • When appropriate a description of the tolerance associated with each specification. • When a specifications validation is statistical in nature it will be identified as such. Example Specification • An example of the full specification including its name and unit of measure. XML - Tag Example • Provides an example for the XML Tag Example, for making the XML tag unique • If a certain value is only valid in a certain range of the antenna (e.g. , frequency range) this is specified
in the ambid – section in the XML file, before the tag, shown here, and is not part of the example. • May provides additional information for the application of the tag

t
Page 15 (119) N-P-BASTA White Paper Version 9.6 <15 -January -2013 >
• See also Section 9.2 “XML use for BSA specifications.” Relevance
• A short description of the impact of the parameter to the antenna performance and/or communication
network performance. Supplementary information may be provided in the additional topics section of the white paper.
• If needed, an elaboration on issues surrounding the parameter and specification will be addressed here or in the additional topics section of the white paper.
A figure illustrating the parameter and specification will be provided where applicable.
3.2 RF Specifications Required
3.2.1 Frequency Range Parameter Definition • The operating bandwidth of the antenna is defined by a continuous range of frequencies designated
by two limiting frequencies fstart and fstop
Specification Definition • The range is specified in MHz Example Specification • Frequency Range 1710-2170 MHz XML - Tag Example
<frequency_ranges> <range start="1710" stop="2170" /> </frequency_ranges>
Relevance • On a data sheet all specifications are valid for the stated frequency range • Most BSAs are broadband in that they cover one or more cellular bands • See Section 8.1 for common cellular frequency bands
3.2.2 Polarization
Parameter Definition • The polarization or polarizations of the electric field radiated by the antenna
Specification Definition • The nominal value as a type and direction for the reference polarization of the antenna • Linear polarization is typically defined as H, V

t
Page 16 (119) N-P-BASTA White Paper Version 9.6 <15 -January -2013 >
• Slant linear polarization is typically defined as +45 / -45 • Circular polarization is typically defined as right-handed, left-handed Example Specification • Polarization +45 / -45 Slant Linear
XML - Tag Example
<port name="p1" polarization="+45" />
The polarization is provided as a value of the port. Relevance • Multiple polarizations are often radiated from an antenna to provide diversity. Polarization diversity is
typically used for receive diversity and MIMO. • When antennas radiate more than one polarization, typically they are orthogonal polarizations • Antennas that radiate two orthogonal polarizations are typically called “dual-pol” • The reference system of polarization used by the vendor should be labeled on the back of the
antenna and the individual antenna ports should be labeled specifically, for example, “ + 45” • A recommended vendor’s reference polarization labeling convention is described in Section 8.4
3.2.3 Gain Parameter Definition • The antenna gain is a measure of input power concentration in the main beam direction as a ratio
relative to an isotropic antenna source. It is determined as the ratio of the maximum power density in the main beam peak direction, at a defined input power, compared to the power density of a loss less isotropic radiator with the same input power. It is defined in the farfield of the antenna.
Specification Definition • The gain is a mean value • The gain is specified in dBi • Gain is specified as a mean value for the specific low, mid, and high down tilt angles of the specified
tilt range for each subband. • In addition, the “over all tilts” gain is specified as a mean value plus a tolerance of +/- 1.5 standard
deviations for each subband. All tilt angles are included in the calculation (in measurement intervals of 1°).
• Gain validation is statistically determined and the recommended methodology is described in Section 4.5
• The gain specification is based on the mean value as measured on all relevant ports, over the specified frequency ranges, and at the specified tilt settings. Subbands of the full frequency range of a broadband antenna must be specified.
• The standard frequencies of gain data points averaged, will include all the low, mid, and high common frequencies in the Tx/Rx bands within the band, or subband, over which the gain is specified
• The repeatability margin associated with a specified mean gain is that the value measured on all samples, at all times, on all calibrated test ranges shall not be more than 0.8 dB lower than the specified value

t
Page 17 (119) N-P-BASTA White Paper Version 9.6 <15 -January -2013 >
• A discussion of the measurement accuracy that can be expected when measuring gain on a farfield range is discussed in Section 8.5
• A discussion of measurement guidelines when measuring gain is discussed in Section 8.2 Example Specification • Gain
All ports 1710-1880 MHz 1850-1990 MHz 1920-2170 MHz
0 Tilt 17.1 17.4 17.7 5 Tilt 17.3 17.5 17.7 10 Tilt 17.0 17.0 17.2
Over all tilts 17.2 +/- 0.2 17.4 +/- 0.3 17.5 +/- 0.3 XML - Tag Example
<gain value_at_min_tilt="17.1" value_at_mid_tilt="17.3" value_at_max_tilt="17.0"/> <gain_over_all_ tilts value="17.2" tolerance_prefix="pm" tolerance_value="0.2"/>
Relevance • Primary specification used in the calculation of a link budget • Gain is used with radiation pattern data by radio planning software to predict coverage and capacity
performance of a cell
3.2.4 Azimuth Beamwidth
Parameter Definition
The 3 dB, or half power, azimuth beamwidth of the antenna is defined as the angular width of the azimuth radiation pattern, including beam peak maximum, between points 3 dB down from maximum beam level (beam peak).

t
Page 18 (119) N-P-BASTA White Paper Version 9.6 <15 -January -2013 >
Degrees
Figure 3—Calculation of azimuth beamwidth value for a single frequency, port, and tilt.
Specification Definition
• Typical (mean) value in degrees • Tolerance in degrees • This is a double-sided statistical parameter • The beamwidth is calculated from the co-polar pattern • This parameter is to be defined for the nominal subbands in a broadband antenna. Unless otherwise
noted it will be assumed the specification is for the full electrical downtilt range, and for all the ports associated with each frequency subband of the antenna
Example Specification
1710-1880 MHz 1850-1990 MHz 1920-2170 MHz Azimuth Beamwidth 67.9° +/- 1.9° 65.0° +/- 1.6° 63.4° +/- 2.3°
XML - Tag Example
<azimuth_beamwidth value="67.9" tolerance_prefix="pm" tolerance_value="1.9" />
Relevance
• This beam parameter indicates the sector coverage provided by a BSA. • BSAs are typically referred to by their nominal azimuth beamwidth, for example, a 65° BSA • Nominal requirements are 90° or 65° for 3 sector cell sites, and 45° or 33° for 6 sector sites
3.2.5 Elevation Beamwidth
63.53° dB

t
Page 19 (119) N-P-BASTA White Paper Version 9.6 <15 -January -2013 >
Parameter Definition
• The 3 dB, or half power, elevation beamwidth of the antenna is defined as the angular width of the elevation radiation pattern, including beam peak maximum, between points 3 dB down from maximum beam level (beam peak)
Specification Definition
• Typical (mean) value in degrees • Tolerance in degrees • This is a double-sided statistical parameter • The beamwidth is calculated from the co-polar pattern • This parameter is to be defined for the nominal subbands in a broadband antenna. Unless otherwise
noted it will be assumed the specification is for the full electrical downtilt range, and for all the ports associated with each frequency subband of the antenna
Example Specification
1710-1880 MHz 1850-1990 MHz 1920-2170 MHz Elevation Beamwidth 7.6° +/- 0.4° 7.0° +/- 0.3° 6.6° +/- 0.5°

t
Page 20 (119) N-P-BASTA White Paper Version 9.6 <15 -January -2013 >
XML - Tag Example
<elevation_beamwidth value="7.6" tolerance_prefix="pm" tolerance_value="0.4" />
Relevance • One of the parameters contributing to the characteristics and extent of the cell sector coverage
3.2.6 Electrical Downtilt Parameter Definition • For a fixed electrical tilt antenna, the main beam pointing angles of the elevation pattern • For a variable electrical tilt antenna, the range of specified main beam pointing angles of the elevation
pattern
Specification Definition
• For a fixed electrical tilt antenna, the nominal value in degrees • For a variable electrical tilt antenna, the nominal range of values in degrees Example Specification
• Electrical Downtilt 0° to 10° • Electrical Downtilt 4° (fixed electrical tilt)
XML - Tag Example
<electrical_downtilt start="0" stop="10" /> Or <electrical_downtilt start="4" stop="4" />
Relevance • One of the parameters contributing to the characteristics and extent of the cell sector coverage • A parameter that is commonly adjusted for RF coverage and interference optimization • A parameter that can be adjusted for cell load balancing
3.2.7 Elevation Downtilt Deviation Parameter Definition
• Maximum absolute deviation from the nominal tilt value in the elevation beam pointing angle
Specification Definition
• Maximum deviation in degrees referenced to nominal tilt value • This is a single sided statistical parameter – its validation is a special case • Deviation is measured from the co-polar pattern • The reference for the elevation beam peak is the mechanical boresight • The reference for the nominal tilt setting the elevation downtilt indicator

t
Page 21 (119) N-P-BASTA White Paper Version 9.6 <15 -January -2013 >
• Section 4.6 addresses the statistical validation of electrical downtilt deviation • This parameter is to be defined for the nominal subbands in a broadband antenna. Unless otherwise
noted it will be assumed the specification is for the full electrical downtilt range, and for all the ports associated with each frequency subband of the antenna
Example Specification
1710-1880 MHz 1850-1990 MHz 1920-2170 MHz Elevation Downtilt Deviation < 0.5 < 0.4 < 0.4 XML - Tag Example
<elevation_downtilt_deviation value="0.5" />
Relevance • A measure of the accuracy of electrical tilt settings
3.2.8 Impedance
Parameter Definition • The characteristic impedance is the ratio between voltage and current flowing into an infinite length
guide. Validity of this definition is limited to Transverse Electric and Magnetic (TEM) mode (i.e., fundamental mode of coaxial cable), Symbol Z0.
Specification Definition
• The characteristic impedance value in Ohms
Example Specification
• Impedance 50 Ohms XML - Tag Example
<impedance value="50" />
Relevance • Base station antennas are typically specified to have a characteristic impedance of Z0=50 Ohm • The VSWR specification parameter measures the antenna mismatch with respect to characteristic
impedance
3.2.9 VSWR
Parameter Definition
• The Voltage Standing Wave Ratio (VSWR) is defined as the ratio of the maximum amplitude to the minimum magnitude of the voltage standing wave at an input port of an antenna

t
Page 22 (119) N-P-BASTA White Paper Version 9.6 <15 -January -2013 >
Specification Definition • An absolute parameter • Positive value without unit. The range is between 1 (no reflection) and infinite (total reflection). The
normalized wave impedance is 50 Ohms. • Specification shall reference the full frequency range, full electrical downtilt range, and associated
ports of the antenna unless specifically detailed otherwise (example: 1710-2180 MHz; 0°-10°;+45 and -45 ports)
Example Specification • VSWR < 1.5:1 XML - Tag Example
<vswr value="1.5" />
Relevance • The VSWR is a measure of the matching of the antenna to the source and feeder cables. A low
VSWR will minimize reflections from the antenna.
Figure 4—Example of VSWR measurement of an antenna port.
t
Page 23 (119) N-P-BASTA White Paper Version 9.6 <15 -January -2013 >
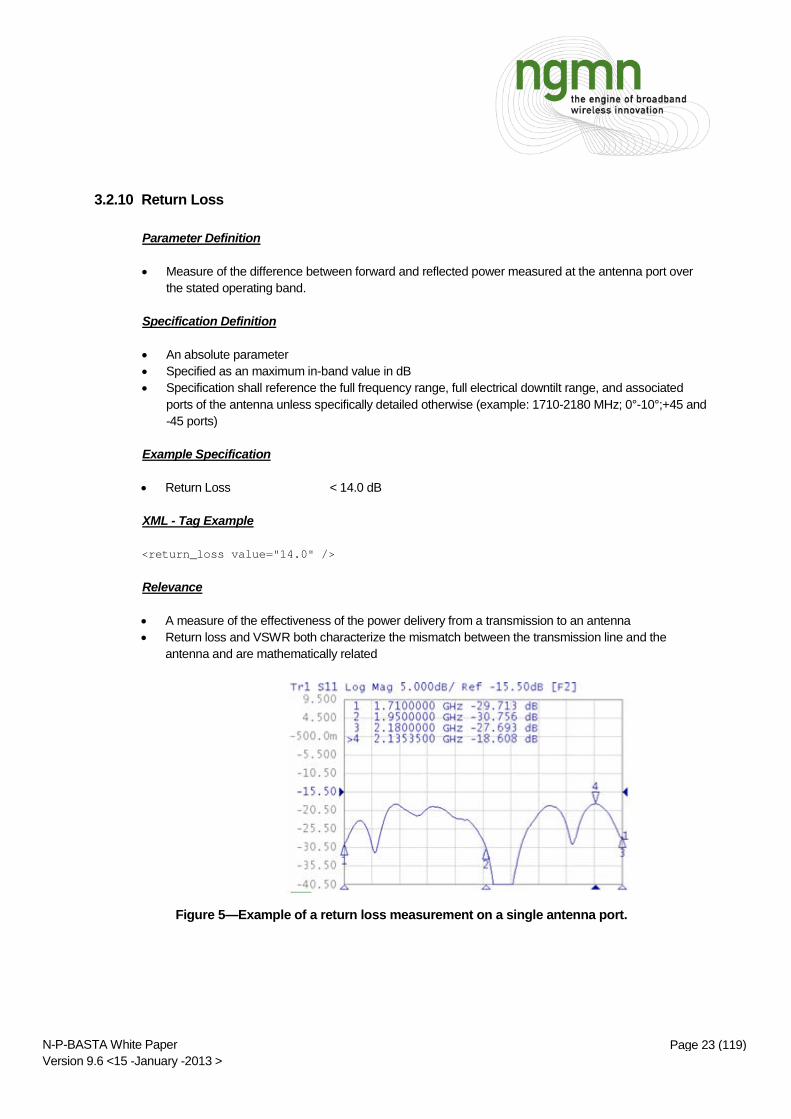
3.2.10 Return Loss
Parameter Definition
• Measure of the difference between forward and reflected power measured at the antenna port over the stated operating band.
Specification Definition
• An absolute parameter • Specified as an maximum in-band value in dB • Specification shall reference the full frequency range, full electrical downtilt range, and associated
ports of the antenna unless specifically detailed otherwise (example: 1710-2180 MHz; 0°-10°;+45 and -45 ports)
Example Specification
• Return Loss < 14.0 dB XML - Tag Example <return_loss value="14.0" />
Relevance • A measure of the effectiveness of the power delivery from a transmission to an antenna • Return loss and VSWR both characterize the mismatch between the transmission line and the
antenna and are mathematically related
Figure 5—Example of a return loss measurement on a single antenna port.

t
Page 24 (119) N-P-BASTA White Paper Version 9.6 <15 -January -2013 >
3.2.11 Cross Polar Isolation
Parameter Definition
• The ratio of the power coupled between the two orthogonally polarized ports of a dual pol antenna
Figure 6—Cross polar isolation example—single column antenna.

t
Page 25 (119) N-P-BASTA White Paper Version 9.6 <15 -January -2013 >
Figure 7—Cross polar isolation dual column antenna.
Specification Definition
• An absolute parameter • Specified as a minimum value in dB • Tolerance not applicable since defined as an absolute value • This parameter is to be defined for the nominal subbands in a broadband antenna. Unless otherwise
noted it will be assumed the specification is for the full electrical downtilt range, and for all the ports associated with each frequency subband of the antenna.
• For antennas with multiple dual pol columns, the specification applies to each column individually and does not address coupling between columns. It is the minimum value for all the dual pole columns in the BSA.
• Coupling between individual ports is best described in terms of “S parameters.” For example, the magnitude in dB of the coupling from port 1 to port 2 is signified by S12.
• For passive devices, such as antennas, coupling is reciprocal, i.e., S12 = S21
Example Specification
1710-1880 MHz 1850-1990 MHz 1920-2170 MHz Cross Polar Isolation > 30 > 28 > 26
XML - Tag Example <cross_polar_isolation value="30" />
Relevance
• Coupling between antenna ports can influence the level of filtering required for a given site
configuration
In this dual column example, the cross-polar isolation is the minimum of S12 and S34

t
Page 26 (119) N-P-BASTA White Paper Version 9.6 <15 -January -2013 >
Figure 8—Example of a cross polar isolation measurement between two antenna ports.
3.2.12 Passive Intermodulation
Parameter Definition • Passive intermodulation is the low level signal created as the result of multiple high power transmit
signals in an antenna. This relatively low power signal is generated at a new distinct frequency and has the potential to inject interference in the receive band thereby degrading the uplink reception.
Specification Definition
• An absolute parameter • Specified as a maximum in-band value in dBc • 3rd order passive intermodulation products measured using 2 x 20W (2 x 43 dBm) carriers (F1 and
F2) • 3rd order products are defined at frequencies of (F1 +/- 2*F2) and (F2 +/- 2*F1) falling within the
receive band when transmit frequencies F1 and F2 are used as the input carriers • Specification shall reference the full frequency range, full electrical downtilt range, and associated
ports of the antenna unless specifically detailed otherwise (example: 1710-2180 MHz; 0°-10°;+45 and -45 ports)
• PIM measurement practices are discussed in Section 8.3
Example Specification
• Passive Intermodulation < -150 dBc XML - Tag Example <passive_intermodulation value="-150"/>
Relevance • The specification defining a limit to the PIM generated in the antenna, which under the right
conditions, causes receive band interference that degrades uplink system sensitivity.

t
Page 27 (119) N-P-BASTA White Paper Version 9.6 <15 -January -2013 >
3.2.13 Front-to-Back (F/B) Ratio, Total Power, +/- 30°
Parameter Definition
• The front-to-back ratio , total power, +/- 30°, is defined as the ratio of power gain between the beam peak and rear ±30º angular region of the azimuth cut, using the backward (180º) direction as the reference.
Figure 9—Angular region for front-to-back, +/- 30°.
Specification Definition
• F/B is a minimum value in dB • It is subject to a statistical validation for a single-sided parameter • This parameter is to be defined for the nominal subbands in a broadband antenna. Unless otherwise
noted it will be assumed the specification is for the full electrical downtilt range, and for all the ports associated with each frequency subband of the antenna.
• Section 2.5 addresses the total power radiation pattern
Example Specification
1710-1880 MHz 1850-1990 MHz 1920-2170 MHz Front-to-Back Ratio, Total Power, +/- 30° > 25.0 > 26.4 > 25.8
Angular region boundary, +30º
Angular region boundary, -30º
Degrees
dB
Azimuth Pattern

t
Page 28 (119) N-P-BASTA White Paper Version 9.6 <15 -January -2013 >
XML - Tag Example <front_to_back_ratio_total_power_pm30 value="25.0" /> Relevance • A measure of the interference radiated backwards by the antenna into neighboring cells • Total power is the sum of the co-polarized and cross-polarized radiation from an antenna port • An abbreviation for front-to-back is commonly used, F/B
3.2.14 First Upper Side Lobe Suppression
Parameter Definition • The minimum suppression level of the side lobe above the horizon that is closest to the main beam
Figure 10—First upper side lobe suppression.
Specification Definition
• First upper side lobe suppression is a minimum, positive value in dB • It is subject to a statistical validation for a single-sided parameter • This parameter is to be defined for the nominal subbands in a broadband antenna. Unless otherwise
noted it will be assumed the specification is for the full electrical downtilt range, and for all the ports associated with each frequency subband of the antenna.
First Upper Sidelobe
dB
Degrees
10º Electrical Tilt
Elevation Pattern

t
Page 29 (119) N-P-BASTA White Paper Version 9.6 <15 -January -2013 >
Example Specification
1710-1880 MHz 1850-1990 MHz 1920-2170 MHz First Upper Sidelobe Suppression > 18.6 > 17.8 > 16.2
XML - Tag Example
<first_upper_side_lobe_suppression value="18.6"/> Relevance • Parameter indicating the amount of neighboring cell interference generated by the first side lobe • Positioning of the suppressed upper lobe using variable electrical tilt can minimize adjacent cell
interference
3.2.15 Upper Side Lobe Suppression, Peak to 20°
Parameter Definition • The minimum suppression level of the side lobes above the main beam peak to a 20° angle
referenced to the main beam peak
Figure 11—Upper side lobe suppression, peak to 20º.
Specification Definition
• Upper side lobe suppression, 0º to 20º is a minimum, positive value in dB • It is subject to a statistical validation for a single-sided parameter
Angular region of specification - 20° above the main beam peak
Main beam peak example 10º electrical tilt
Degrees
dB
Elevation Pattern

t
Page 30 (119) N-P-BASTA White Paper Version 9.6 <15 -January -2013 >
• This parameter is to be defined for the nominal subbands in a broadband antenna. Unless otherwise noted it will be assumed the specification is for the full electrical downtilt range, and for all the ports associated with each frequency subband of the antenna.
Example Specification
1710-1880 MHz 1850-1990 MHz 1920-2170 MHz
Upper Sidelobe Suppression, 0° to 20° > 18.6 > 17.8 > 16.2
XML - Tag Example
<upper_side_lobe_suppression_peak_to_20 value="18.6"/> Relevance • Parameter indicating the amount of neighboring cell interference generated by the upper side lobes • Positioning of the suppressed upper lobes using variable electrical tilt can minimize adjacent-cell
interference
3.2.16 Cross Polar Discrimination over Sector
Parameter Definition • The cross-pol discrimination is defined as a ratio of the copolar component of the specified
polarization compared to the orthogonal cross-polar component over the sector
Figure 12—Cross pol discrimination over the sector.
Sector boundary
CPD at a given angle
Co-polar pattern
dB
Degrees
Cross-polar pattern

t
Page 31 (119) N-P-BASTA White Paper Version 9.6 <15 -January -2013 >
Specification Definition
• Cross-pol discrimination is the magnitude of the relative power of the cross-polarized pattern with respect to the co-polarized pattern at a given angle
• Cross-pol discrimination over the sector is the minimum value measured in a defined +/- angular deviation from the main beam direction. The specified sector can be noted (i.e., +/- 60°).
• It is subject to a statistical validation for a single-sided parameter • An abbreviation for cross-pol discrimination can be used, CPD • For a three sector application the sector is defined as +/- 60° • For a six sector application the sector is defined +/- 30° • This parameter is to be defined for the nominal subbands in a broadband antenna. Unless otherwise
noted it will be assumed the specification is for the full electrical downtilt range, and for all the ports associated with each frequency subband of the antenna.
1710-1880 MHz 1850-1990 MHz 1920-2170 MHz
Cross Polar Discrimination Over Sector > 10.8 > 9.4 > 8.56 XML - Tag Example
<cross-pol_discrimination_over_sector value="10.8" /> Relevance • Cross-polar discrimination is important for a low level of correlation between the orthogonally
polarized propagation channels. Correlation generated by the antenna can negatively affect receive diversity and MIMO downlink performance of the system. A minimum level of 8 to 10 dB within the relevant sector is recommended for minimum degradation to receive diversity and MIMO performance.
3.2.17 Maximum Effective Power per Port
Parameter Definition • The maximum power which can be transmitted into one antenna port
Specification Definition
• Power is defined as effective CW power • This is an absolute, maximum parameter specified in Watts • It is specified at sea level over the temperature range specified for the antenna • This parameter can be defined for individual subbands and ports. Unless otherwise noted, it will be
assumed the specification is for the full frequency range, full electrical downtilt range, and associated ports of the antenna (example: 1710-2170 MHz; 0°-10°;+45 and -45 ports).
Example Specification
• Maximum Effective Power per Port 250 Watts

t
Page 32 (119) N-P-BASTA White Paper Version 9.6 <15 -January -2013 >
XML - Tag Example
<maximum_effective_power_per_port value="250"/>
Relevance • Exceeding the specified power rating can damage the antenna.
3.2.18 Interband Isolation
Parameter Definition • The worst case coupling between any and all pair of ports in a multiple band, or broad band, antenna.
Specification Definition
• An absolute parameter • Specified as a minimum value in dB measure between any and all pair of ports • Coupling between both co-polarized and cross-polarized pairs of ports is included • Coupling between individual ports is best described in terms of “S parameters”. For example, the
magnitude in dB of the coupling from port 1 to port 2 is signified by S12. • For passive devices, such as antennas, coupling is reciprocal, that is, S12 = S21 • Specification shall reference the full frequency range, full electrical downtilt range, and associated
ports of the antenna unless specifically detailed otherwise (example: 1710-2180 MHz; 0°-10°;+45 and -45 ports)
Example Specification
• Interband Isolation > 20 dB XML - Tag Example
<interband_isolation value="20"/>
Relevance • Coupling between antenna ports can influence the level of filtering required for a given site
configuration

t
Page 33 (119) N-P-BASTA White Paper Version 9.6 <15 -January -2013 >
Figure 13—Interband isolation examples. In this example, the interband isolation is the minimum of S41, S31, S42, S32.
Figure 14—Interband isolation vs. frequency on a single pair of ports.
3.3 RF Specifications Optional
3.3.1 Port- to-Port Isolation
Parameter Definition • The worst case coupling measured in a specific pair of antenna ports.
Specification Definition
• An absolute parameter • Specified as a minimum value in dB measure between a pair of ports • Coupling between individual ports is best described in terms of “S parameters”. For example, the
magnitude in dB of the coupling from port 1 to port 2 is signified by S12. • For passive devices, such as antennas, coupling is reciprocal, that is, S12 = S21

t
Page 34 (119) N-P-BASTA White Paper Version 9.6 <15 -January -2013 >
• Specification shall reference the full frequency range, full electrical downtilt range, and associated ports of the antenna unless specifically detailed otherwise (example: 1710-2180 MHz; 0°-10°;+45 and -45 ports)
• Since this specification is for a specific pair of ports, they must be identified on the antenna and referenced in the same way in the specification.
Example Specification
Port- to-Port Isolation 1710-1880 MHz 1850-1990 MHz 1920-2170 MHz
Beam +30° , +45 to Beam -30°, -45 > 30 > 30 > 30 Beam +30° , +45 to Beam -30°, +45 > 20 > 20 > 18 Beam +30° , -45 to Beam -30°, +45 > 30 > 30 > 30 Beam +30° , -45 to Beam -30°, -45 > 20 > 20 > 18 XML - Tag Example
<port-to-port_isolation value="30"/>
Relevance • Coupling between antenna ports can influence the level of filtering required for a given site
configuration
3.3.2 Front-to-Back Ratio over 30º Angular Region—Total Power AZ & EL
Parameter Definition
• Front-to-back ratio over 30º angular region—total power AZ & EL is defined as the ratio of power gain between the beam peak and rear ±30º angular regions of the azimuth cut and elevation cuts, using the backward (180º) direction as the reference. The parameter is the minimum value over the angular region.
Figure 15—F/B angular regions, azimuth and elevation.

t
Page 35 (119) N-P-BASTA White Paper Version 9.6 <15 -January -2013 >
Specification Definition
• F/B is a minimum value in dB • It is subject to a statistical validation for a single-sided parameter • This parameter is to be defined for the nominal subbands in a broadband antenna. Unless otherwise
noted it will be assumed the specification is for the full electrical downtilt range, and for all the ports associated with each frequency subband of the antenna.
Example Specification
1710-1880 MHz 1850-1990 MHz 1920-2170 MHz
Front-to-Back Ratio over 30º Angular Region—Total Power AZ & EL > 25.0 > 26.4 > 25.8
XML - Tag Example
<front-to-back_ratio_over_30_angular_region-total_power_az_and_el value="25.0"/>
Relevance • A measure of the interference radiated backwards by the antenna into neighboring cells • Total power is the sum of the co-polarized and cross-polarized radiation from an antenna port • An abbreviation for front to back is commonly used, F/B • The main back lobe of the antenna is generally broad in the azimuth plane and narrow in the elevation
plane as it is the main beam, and in general has the same electrical tilt angle as the main beam

t
Page 36 (119) N-P-BASTA White Paper Version 9.6 <15 -January -2013 >
3.3.3 Azimuth Beam Squint
Parameter Definition
• Beam pointing angle in the azimuth cut defined using center of 3 dB points; referenced to the antenna’s mechanical boresight
Figure 16—Illustration of a 3 dB bisected beam squint calculation for a given frequency, tilt and port.
Specification Definition
• Typical (mean) value in degrees • Tolerance in degrees • This is a double-sided statistical parameter • Squint is measured from the co-polar pattern • In the case of multi-beam antennas, squint is referenced to the nominal beam axis • This parameter is to be defined for the nominal subbands in a broadband antenna. Unless otherwise
noted it will be assumed the specification is for the full electrical downtilt range, and for all the ports associated with each frequency subband of the antenna.
Example Specification
1710-1880 MHz 1850-1990 MHz 1920-2170 MHz Azimuth Beam Squint 1.1° +/- 2.4° 2.7° +/- 2.7° 2.6° +/- 2.6°
dB
Degrees
-28.6° +37.8°
+4.60° Beam Squint
33.2° 33.2°
Left port, 0°, 1.85 GHz
Center of the 3 dB Beamwidth
0° is the mechanical boresight of the antenna

t
Page 37 (119) N-P-BASTA White Paper Version 9.6 <15 -January -2013 >
XML - Tag Example <azimuth_beam_squit value="1.1" tolerance_prefix="pm" tolerance_value="2.4"/>
Relevance • The bisect 3 dB beamwidth approach to defining squint is, for many cases, a better metric than using
the beam peak as it reflects the centering of the half power of the antenna beam. This is especially relevant for asymmetrical beams. Also, the beam peak can be difficult to identify for a beam that has ripple across the center of the beam. Beam ripple and asymmetry can occur on multi-column antennas.
• Excessive azimuth beam squint can impact performance near cell section boundaries • Beams may squint as a function of electrical downtilt • Beams may squint due to asymmetries in the antenna architecture, for example, asymmetries in
multi-column antennas.
3.3.4 Null Fill
Parameter Definition
• The ratio of power gain between the beam peak and lowest power gain level between main beam and first lower side lobe in the elevation cut (i.e., first lower null)
Figure 17—Identification of the lower first null.
Specification Definition
• Null fill is a minimum, negative value in dB
First Lower Null (Unfilled)
dB
Degrees
Main beam peak 10º Electrical Tilt
Elevation Pattern

t
Page 38 (119) N-P-BASTA White Paper Version 9.6 <15 -January -2013 >
• It is subject to a statistical validation for a single-sided parameter • This parameter is to be defined for the nominal subbands in a broadband antenna. Unless otherwise
noted it will be assumed the specification is for the full electrical downtilt range, and for all the ports associated with each frequency subband of the antenna.
Example Specification
1710-1880 MHz 1850-1990 MHz 1920-2170 MHz
Null Fill > -18.2 > -19.3 > -18.3 XML - Tag Example
<null_fill value>”-18.2"/>
Relevance • Null Fill in most base station antenna site scenarios is a non-critical parameter due the multipath in the
environment and power levels near the cell site. • Pattern shaping design methods are applied to fill the lower null, reducing its magnitude • It may affect coverage close to cell sites, in rural areas, using high efficiency, high gain antennas
3.3.5 Cross Polar Discrimination at Boresight
Parameter Definition • The cross polar discrimination at boresight is defined as a ratio of the copolar component of the
specified polarization (i.e., +45º) compared to the orthogonal cross polar component in the main beam direction.
• The specified value in the main beam direction means the minimum value measured in the frequency range and for both systems of a dual polarized antenna. For antennas with electrical downtilt the value is defined in the relevant downtilt direction.

t
Page 39 (119) N-P-BASTA White Paper Version 9.6 <15 -January -2013 >
• Abbreviations for cross-pol discrimination can be used CPD (Cross-Pol Discrimination)
Figure 18—Cross pol discrimination at boresight.
Specification Definition • Cross polar discrimination at boresight is a positive value in dB • It is subject to a statistical validation for a single-sided parameter • This parameter is to be defined for the nominal subbands in a broadband antenna. Unless otherwise
noted it will be assumed the specification is for the full electrical downtilt range, and for all the ports associated with each frequency subband of the antenna.
Example Specification
1710-1880 MHz 1850-1990 MHz 1920-2170 MHz Cross Polar Discrimination at Boresight > 25.4 > 22.1 > 26.3
XML - Tag Example
<cross_polar_discrimination_at_boresight value="25.4"/> Relevance • Cross-polar discrimination is important for a low level of correlation between the orthogonally
polarized propagation channels. Correlation generated by the antenna can negatively affect receive diversity and MIMO downlink performance of the system.
CPD at boresight
Co polar pattern
dB
Degrees
Cross polar pattern

t
Page 40 (119) N-P-BASTA White Paper Version 9.6 <15 -January -2013 >
3.3.6 Cross Polar Discrimination over 3 dB Azimuth Beamwidth Parameter Definition
• The cross polar discrimination over 3 dB azimuth beamwidth is defined as a ratio of the copolar
component of the specified polarization (i.e., +45º) compared to the orthogonal cross polar component in between the -3 dB level of the antenna pattern.
• The specified value over 3 dB azimuth beamwidth means the minimum value measured in the frequency range and for both systems of a dual polarized antenna. For antennas with electrical downtilt the value is defined in the relevant downtilt direction.
• An abbreviation for cross-pol discrimination can be used CPD (Cross-Pol Discrimination).
Figure 19—Cross pol discrimination at 3 dB azimuth beamwidth.
Specification Definition • Cross polar discrimination at boresight is a positive value in dB • It is subject to a statistical validation for a single-sided parameter • This parameter is to be defined for the nominal subbands in a broadband antenna. Unless otherwise
noted it will be assumed the specification is for the full electrical downtilt range, and for all the ports associated with each frequency subband of the antenna.
Example Specification
1710-1880 MHz 1850-1990 MHz 1920-2170 MHz Cross Polar Discrimination over 3 dB
Azimuth Beamwidth > 11.8 > 16.3 > 14.6
CPD angular region: Over 3dB beamwidth
Co polar pattern
dB
Degrees
Cross polar pattern

t
Page 41 (119) N-P-BASTA White Paper Version 9.6 <15 -January -2013 >
XML - Tag Example
<cross_polar_discrimination_over_3_db_azimuth_beamwidth value="11.8"/> Relevance • Cross-polar discrimination is important for a low level of correlation between the orthogonally
polarized propagation channels. Correlation generated by the antenna can negatively affect receive diversity and MIMO downlink performance of the system.
3.3.7 Cross Polar Discrimination over 10 dB Beamwidth
Parameter Definition • The cross polar discrimination over 10 dB azimuth beamwidth is defined as a ratio of the copolar
component of the specified polarization (i.e., +45º) compared to the orthogonal cross polar component in between the -10 dB level of the antenna pattern
• The specified value over 10 dB azimuth beamwidth means the minimum mean value measured in the frequency range and for both systems of a dual polarized antenna. For antennas with electrical downtilt the value is defined in the relevant downtilt direction.
• An abbreviation for cross-pol discrimination shall be used CPD (Cross-Pol Discrimination).
Figure 20—Cross pol discrimination at 10 dB azimuth beamwidth.
Specification Definition • Cross polar discrimination at boresight is a positive value in dB • It is subject to a statistical validation for a single-sided parameter
CPD angular region: Over 10 dB beamwidth
Co polar pattern
dB
Degrees
Cross polar pattern

t
Page 42 (119) N-P-BASTA White Paper Version 9.6 <15 -January -2013 >
• This parameter is to be defined for the nominal subbands in a broadband antenna. Unless otherwise noted it will be assumed the specification is for the full electrical downtilt range, and for all the ports associated with each frequency subband of the antenna.
Example Specification
1710-1880 MHz 1850-1990 MHz 1920-2170 MHz Cross Polar Discrimination over 10 dB
Beamwidth > 11.8 > 13.4 > 12.2 XML - Tag Example
<cross_polar_discrimination_over_10_db_beamwidth value="11.8"/>
Relevance • Cross-polar discrimination is important for a low level of correlation between the orthogonally
polarized propagation channels. Correlation generated by the antenna can negatively affect receive diversity and MIMO downlink performance of the system.
3.3.8 Cross Polar Discrimination over the 3 dB Elevation Beamwidth
Parameter Definition • The cross-pol discrimination over the 3 dB elevation beamwidth is defined as a ratio of the copolar
component of the specified polarization (i.e., +45º) compared to the orthogonal cross-polar component.
• The specified value means the minimum value measured in a defined angular sector between the 3 dB points of the elevation pattern in the azimuth beam peak direction .
• An abbreviation for cross-pol discrimination shall be used CPD (Cross-Pol Discrimination).
Specification Definition • The cross-pol discrimination over the 3 dB elevation beamwidth is a positive value in dB • It is subject to a statistical validation for a single-sided parameter • This parameter is to be defined for the nominal subbands in a broadband antenna. Unless otherwise
noted it will be assumed the specification is for the full electrical downtilt range, and for all the ports associated with each frequency subband of the antenna.
Example Specification
1710-1880 MHz 1850-1990 MHz 1920-2170 MHz Cross Polar Discrimination over the 3
dB Elevation Beamwidth > 11.3 > 10.7 > 9.8 XML - Tag Example
<cross_polar_discrimination_over_the_3_db_elevation_beamwidth value="11.3"/>

t
Page 43 (119) N-P-BASTA White Paper Version 9.6 <15 -January -2013 >
Relevance • Cross-polar discrimination is important for a low level of correlation between the orthogonally
polarized propagation channels. Correlation generated by the antenna can negatively affect receive diversity and MIMO downlink performance of the system.
3.3.9 Cross Polar Discrimination over the 10 dB Elevation Beamwidth
Parameter Definition • The cross-pol discrimination over the 10 dB elevation beamwidth is defined as a ratio of the copolar
component of the specified polarization (i.e., +45º) compared to the orthogonal cross-polar component.
• The specified value means the minimum value measured in a defined angular sector between the 10 dB points of the elevation pattern in the azimuth beam peak direction.
• An abbreviation for cross-pol discrimination shall be used CPD (Cross-Pol Discrimination) or CPR (Cross-Pol Ratio).
Specification Definition • The cross-pol discrimination over the 10 dB elevation beamwidth is a positive value in dB • It is subject to a statistical validation for a single-sided parameter • This parameter is to be defined for the nominal subbands in a broadband antenna. Unless otherwise
noted it will be assumed the specification is for the full electrical downtilt range, and for all the ports associated with each frequency subband of the antenna.
Example Specification
1710-1880 MHz 1850-1990 MHz 1920-2170 MHz Cross Polar Discrimination over the 10
dB Elevation Beamwidth > 11.0 > 10.2 > 9.8 XML - Tag Example
<cross_polar_discrimination_over_the_10_db_elevation_beamwidth value="11.0"/>
Relevance • Cross-polar discrimination is important for a low level of correlation between the orthogonally
polarized propagation channels. Correlation generated by the antenna can negatively affect receive diversity and MIMO downlink performance of the system.
3.3.10 Azimuth Beam Port-to-Port Tracking
Parameter Definition • A measure of the maximum difference in signal level between the two antenna polarization branches
(normally ±45° linear polarization)

t
Page 44 (119) N-P-BASTA White Paper Version 9.6 <15 -January -2013 >
Figure 21—Azimuth beam port-to-port tracking.
Specification Definition
• Measured at each frequency and for each angle within a ±60° sector with antennas mechanical
boresight as the 0° direction. It is a co-polar pattern measurement. • Port-to-port tracking is a maximum value in dB • It is subject to a statistical validation for a single-sided parameter • This parameter is to be defined for the nominal subbands in a broadband antenna. Unless otherwise
noted it will be assumed the specification is for the full electrical downtilt range, and for all the ports associated with each frequency subband of the antenna.
Example Specification
1710-1880 MHz 1850-1990 MHz 1920-2170 MHz
Azimuth Port-to-Port Tracking < 1.1 < 1.5 < 1.6 XML - Tag Example
<azimuth_beam_port-to-port_tracking value="1.1"/>
Relevance • The parameter characterizes the difference in illumination of the cell between two ports of a dual
polarized antenna. The difference should be minimized in order to maximize potential diversity gain.
3.3.11 Azimuth Beam H/V Tracking
Parameter Definition • The maximum difference in signal level between the horizontal and vertical polarization for each port

t
Page 45 (119) N-P-BASTA White Paper Version 9.6 <15 -January -2013 >
Figure 22—Azimuth beam H/V tracking.
Specification Definition
• Measured at each frequency and for each angle within a ±60° sector with antennas mechanical
boresight as 0° direction • Azimuth Beam H/V Tracking is a maximum value in dB • It is subject to a statistical validation for a single-sided parameter • This parameter is to be defined for the nominal subbands in a broadband antenna. Unless otherwise
noted it will be assumed the specification is for the full electrical downtilt range, and for all the ports associated with each frequency subband of the antenna.
Example Specification
1710-1880 MHz 1850-1990 MHz 1920-2170 MHz
Azimuth H/V Tracking < 1.8 < 2.2 < 1.6
XML - Tag Example
<azimuth_beam_hv_tracking value="1.8"/>
Relevance • Specification parameter that measures the difference in signal level in the horizontal and the vertical
polarization for a dual polarized antenna. The parameter shows the polarization behavior of the antenna over the sector (signal level is equal when polarization is exactly ±45°). The difference should be minimized in order to maximize potential diversity gain.
3.3.12 Azimuth Beam Roll-Off
Parameter Definition
• Defined as the azimuth pattern level at the sector edge angles relative to mechanical boresight

t
Page 46 (119) N-P-BASTA White Paper Version 9.6 <15 -January -2013 >
Figure 23—Azimuth beam roll-off.
Specification Definition
• Typical (mean) value in dB • Tolerance in dB • This is a double-sided statistical parameter • The beam roll-off is calculated from the co-polar pattern • This parameter is to be defined for the nominal subbands in a broadband antenna. Unless otherwise
noted it will be assumed the specification is for the full electrical downtilt range, and for all the ports associated with each frequency subband of the antenna.
Example Specification
1710-1880 MHz 1850-1990 MHz 1920-2170 MHz Azimuth Beam Roll-Off 8.1 +/- 1.6 9.8 +/- 2.3 11.3 +/- 2.1
XML - Tag Example
<azimuth_beam_roll-off value="8.1" tolerance_prefix="pm" tolerance_value="1.6"/>
Relevance • A measure of the power radiated at the sector edges of a cell • For a BSA with a given azimuth beamwidth, the larger the sector roll-off, the less interference that is
radiated into the adjacent sectors
3.3.13 Elevation Beam Squint
Parameter Definition • Maximum shift in elevation main beam direction referenced from the mean elevation beam direction
Sector edges
8.4 dB 7.6 dB

t
Page 47 (119) N-P-BASTA White Paper Version 9.6 <15 -January -2013 >
Figure 24—Elevation beam squint.
Specification Definition • Maximum deviation in degrees referenced to the mean beam direction • This is a single-sided statistical parameter – its validation is a special case similar to electrical downtilt
deviation • Elevation beam squint is measured from the co-polar pattern • Section 4.6 addresses the statistical validation of electrical downtilt deviation, and for this parameter
the calculation is the same except it is the absolute deviation from the mean as oppose to the nominal elevation tilt setting
• This parameter is to be defined for the nominal subbands in a broadband antenna. Unless otherwise noted it will be assumed the specification is for the full electrical downtilt range, and for all the ports associated with each frequency subband of the antenna.
Example Specification
1710-1880 MHz 1850-1990 MHz 1920-2170 MHz Elevation Beam Squint < 0.4 < 0.3 < 0.3
XML - Tag Example
<elevation_beam_squint value="0.4"/>
Relevance • This parameter measures the directional stability of the main lobe in the elevation plane

t
Page 48 (119) N-P-BASTA White Paper Version 9.6 <15 -January -2013 >
3.3.14 Upper Sidelobe Suppression Horizon to + 20 degrees
Parameter Definition • The minimum suppression level of the side lobes above the main beam to a 20° angle above the
horizon
Figure 25—Upper side lobe suppression horizon to +20º.
Specification Definition
• Upper side lobe suppression, horizon to 20º is a minimum, positive value in dB • It is subject to a statistical validation for a single-sided parameter • This parameter is to be defined for the nominal subbands in a broadband antenna. Unless otherwise
noted it will be assumed the specification is for the full electrical downtilt range, and for all the ports associated with each frequency subband of the antenna.
Example Specification
1710-1880 MHz 1850-1990 MHz 1920-2170 MHz Upper Sidelobe Suppression, Horizon to 20° > 17.6 > 16.6 > 18.4
XML - Tag Example
< upper_sidelobe_suppression_horizon_to_plus_20_degrees value="17.6"/>
Horizon
20° above Horizon

t
Page 49 (119) N-P-BASTA White Paper Version 9.6 <15 -January -2013 >
Relevance • Parameter indicating the amount of interference radiate above the horizon by the upper side lobes
3.3.15 Maximum Upper Sidelobe Level
Parameter Definition • The maximum level of the side lobes above the main beam peak to zenith
Figure 26—Maximum Upper Side Lobe Level.
Specification Definition
• Maximum upper side lobe level is a maximum, negative value in dB • The angular range is from the main beam peak to zenith • It is subject to a statistical validation for a single-sided parameter • This parameter is to be defined for the nominal subbands in a broadband antenna. Unless otherwise
noted it will be assumed the specification is for the full electrical downtilt range, and for all the ports associated with each frequency subband of the antenna.
Example Specification
1710-1880 MHz 1850-1990 MHz 1920-2170 MHz
Maximum Upper Sidelobe Level < - 14.3 < -15.1 < - 15.6
Angular region of specification - main beam peak to zenith
Main beam peak example 10º electrical tilt
Degrees
dB
Elevation Pattern
Zenith

t
Page 50 (119) N-P-BASTA White Paper Version 9.6 <15 -January -2013 >
XML - Tag Example
<maximum_upper_sidelobe_level value="-14.3"/>
Relevance • Upper side lobes are generally unwanted as even if they do not create interference they represent
energy radiated in unwanted directions and therefore lost to the system. Consequently low values for the maximum upper side lobe level are beneficial.
3.3.16 Azimuth Interference Ratio
Parameter Definition • Defined as the ratio of the desired power to undesired, interfering, power of an antenna’s radiation
pattern referenced to a given sector
Specification Definition • Typical (mean) value in dB • Tolerance in dB • This is a double sided statistical parameter • The Azimuth Interference Ratio is calculated from both the co-polar pattern and the cross-polar
pattern in the form of:
o xPucPu
cPdAIR__
_+
=
o )log(*10 AIR when converted to dB o where the desired power term in the numerator is defined as Pd_c which is the total in-sector co-
polar power sum o and where the undesired power terms in the denominator are defined as follows: Pu_c is the
total out-of-sector co-polar power sum and Pu_x is the total cross-polar power sum • This parameter is to be defined for the nominal subbands in a broadband antenna. Unless otherwise
noted it will be assumed the specification is for the full electrical downtilt range, and for all the ports associated with each frequency sub band of the antenna
Example Specification
1710-1880 MHz 1850-1990 MHz 1920-2170 MHz Azimuth Interference Ratio 11.0 +/- 0.5 11.5 +/- 0.6 11.8 +/- 0.7
XML - Tag Example
<azimuth_interference_ratio value=”11.0” tolerance_prefix="pm" tolerance_value="0.5"/>
Relevance • It is a parameter that allows comparison of various antenna’s interference rejection. The larger the
AIR, the better the interference rejection performance of an antenna.

t
Page 51 (119) N-P-BASTA White Paper Version 9.6 <15 -January -2013 >
3.3.17 Azimuth Beam Pan Angle
Parameter Definition
• For an antenna with fixed beams pointed in the azimuth plane, the nominal angle of specific beams
Specification Definition
• For an antenna with panned azimuth beams, the nominal values in degrees with respect to the mechanical boresight
• The beams are to be identified in the specification
Example Specification
Beam A Beam B Azimuth Beam Pan Angle -30° + 30
XML - Tag Example
<azimuth_beam_pan_angle value=”30.0”/> Relevance
• A specification defining the geometry of the site and sectors • One of the parameters contributing to the characteristics and extent of the cell sector coverage
3.3.18 Azimuth Beam Pan Range
Parameter Definition
• For an azimuth plane beam steering antenna, the nominal range of azimuth pointing angles
Figure 27—Pattern of an azimuth beam steering antenna panned to +30°.

t
Page 52 (119) N-P-BASTA White Paper Version 9.6 <15 -January -2013 >
Specification Definition
• For an azimuth beam steering antenna, the nominal azimuth pan range relative to the mechanical boresight of the antenna in degrees
Example Specification
• Azimuth Pan Range -30° to + 30° XML - Tag Example
<azimuth_beam_pan_range start=”-30.0” stop=”30.0”/>
Relevance • One of the parameters contributing to the characteristics and extent of the cell sector coverage • A parameter that can be adjusted for sector alignment and hand-off optimization • A parameter that can be adjusted for RF coverage and interference optimization • A parameter that can be adjusted for sector load balancing
3.3.19 Azimuth Beamwidth Fan Range
Parameter Definition
• For a variable azimuth beamwidth antenna, the nominal range of beamwidths
Figure 28—Variable azimuth beamwidth BSA, (35°/65°/105° pattern overlays).
Specification Definition
• For a variable azimuth beamwidth antenna, the nominal azimuth beamwidth range of the antenna in
degrees

t
Page 53 (119) N-P-BASTA White Paper Version 9.6 <15 -January -2013 >
Example Specification
• Azimuth Beamwidth Fan Range 35° to 105°
XML - Tag Example
<azimuth_beamwidth_fan_range start=”35.0” stop=”105.0”/> Relevance • One of the parameters contributing to the characteristics and extent of the cell sector coverage • A parameter that can be adjusted for sector alignment and hand-off optimization • A parameter that can be adjusted for RF coverage and interference optimization • A parameter that can be adjusted for sector load balancing

t
Page 54 (119) N-P-BASTA White Paper Version 9.6 <15 -January -2013 >
4 VALIDATION AND SPECIFICATION OF RF PARAMETERS
4.1 Industry Practice for Base Station Antennas
In a commercial RFQ process, cellular operators specify the expected performance of the antennas that will be purchased for deployment in their networks. Detailed specifications are provided to antenna vendor who will respond with specification data sheets, or other documentation, that compares how the performance of their products complies with the RFQ requirements. In order to accurately compare the properties of one antenna vendor’s product with another’s, all parties in the supply chain must have a common understanding of the antenna parameters definitions, and just as critically, the methodology used to calculate and validate the associated specifications. This section of the white paper addresses the calculation and validation of the RF specifications.
4.2 General Guidance
• For the validation and the specification of radiation pattern derived parameters, the NGMN guidelines require that a specific set of subbands and associated frequencies be measured and analyzed. See Section 8.1 for details.
• Parameters are classified as absolute or statistical. Statistical parameters are further classified as
single-sided parameters or double-sided parameters.
• In general, absolute parameters are defined for the full frequency range of an antenna, and are based on swept frequency measurements of the input ports. It will be assumed the specification is for the full frequency range, full electrical downtilt range, and associated ports of the antenna. For the example in this paper: 1710-2170 MHz; 0°-10°;+45 and -45 ports. Exceptions for a specific parameter must be identified.
• In general, statistical parameters are defined in subbands of the full frequency range of an antenna, and are based on radiation pattern measurements. It will be assumed the specification is for the full subband frequency range, full electrical downtilt range, and associated ports of the antenna. For the example in this paper: 1710-1880 MHz; 0°-10°;+45 and -45 ports. Exceptions for a specific parameter must be identified.
• Statistical parameters must be specified for each of the subbands included in the frequency range of the antenna, except where otherwise noted as a special case.
• A “typical” specification is defined as a mean value with a tolerance. This is a double-sided parameter. The tolerance is defined as +/- 1.5 standard deviations from the mean. For a normal distribution, 84% of measured data points will validate the specification of a “typical” parameter value for double side parameter.
• Gain is a special case of a “typical” specification. It is specified for each of the subbands included in the frequency range of the antenna and for the specific low, mid, and high tilt values over the tilt range of the antenna. In addition, an “over all tilts” gain is specified as a mean value plus a tolerance of +/- 1.5 standard deviations for each subband. All tilt angles are included in the calculation (in measurement intervals of 1°).
• A “maximum” or “minimum” specification is defined as a threshold value. This is a single-sided parameter. The “maximum” threshold value is determined by the mean plus the standard deviation. The “minimum” threshold value is determined by the mean minus the standard deviation. For a

t
Page 55 (119) N-P-BASTA White Paper Version 9.6 <15 -January -2013 >
normal distribution, 84% of measured data points will validate the specification of a “maximum” or “minimum” value for a single-sided parameter.
• For single-sided parameters there can be no excursion beyond 3 dB of the specified value. This is a
general rule and exceptions may be noted for individual parameters. For example, if the first upper sidelobe suppression is specified > 15.2, then there can be no measured values < 12.2 dB, or the specification will need to be de-rated to bring all values within the 3 dB excursion requirement.
• Some parameters require the measurement of cross-polar radiation patterns.
• Pattern data will be taken at a minimum of 1° angular resolution.
• Pattern data for electrical downtilting antennas will be taken every 1° over the entire specified tilt range.
• Pattern data will be provided for the elevation and azimuth pattern cuts.
• Legacy vendor specification data sheets will not be required to be changed as a whole. It is foreseen that operators may request NGMN compliance for new RFQs and new products.
4.3 Absolute RF Parameters For absolute parameters, 100% of the measured data falls below a maximum value or above a minimum value and statistical analysis is not necessary.
For absolute parameters such return loss, isolation, PIM, etc. there will be no data points excursions beyond the specified value. Typically these parameters are specified for the full frequency range, full electrical downtilt range, and associated ports of the antenna. For the example antenna in the white paper this is: 1710-2170 MHz; 0°-10°;+45 and -45 ports. In general, for antennas where this is not the case, the subband frequency range, referenced port, and downtilt range should be referenced otherwise it will be assumed the specification is for the full frequency range, full electrical downtilt range, and associated ports of the antenna.
4.4 Statistical RF Parameters
4.4.1 General methodology For a given antenna model number, the antenna’s radiation patterns are measured at the NGMN recommended frequencies for each of the NGMN required subbands of the full antenna bandwidth. The specified full antenna bandwidth, or frequency range, of the antenna that is used as an example in the white paper is:
Frequency Range 1710-2170 MHz Certain parameters, according to NGMN guidelines, are required to be specified in the NGMN recommend subbands. The subbands frequency ranges for the example antenna are:
1710-1880 MHz 1850-1990 MHz 1920-2170 MHz
A list of the NGMN recommended subbands can be found in Section 8.1.

t
Page 56 (119) N-P-BASTA White Paper Version 9.6 <15 -January -2013 >
For antennas with variable electrical downtilt, patterns are measured at 1° beam tilt increments. For each beam parameter, the individual patterns are analyzed, and a value calculated per the parameter definition. The resulting data set of parameter values is analyzed statistically, per the specification definition, to calculate the specification associated with the beam parameter. For one subband, 1710 – 1880 MHz, an example of a full data set of parameter values for the azimuth beamwidth specification is shown in the table below:
Table 1—Full parameter value data set – one subband.
4.4.2 Double-Sided Specifications Nominal A value referencing a parameter value which is not a specification nor has it been statistical validated.
Example 65° BSA
Typical For some parameters, their relevance is best captured by how the data set of calculated values fall within a range of values around a typical parameter value; therefore, they are designated as double-sided parameters. These specifications are defined as “typical”. Statistically, typical is defined as the mean of the measured data with a range defined by as +/- 1.5 standard deviations from the mean. Note that for normally distributed data, +/- 42% of the measured validation data points, or 84% of the data points will fall within the range specified. The statistical validation is applied in the units identified in the specification definition.
“Typical (=)” Specification: Mean +/- 1.5 standard deviations

t
Page 57 (119) N-P-BASTA White Paper Version 9.6 <15 -January -2013 >
Figure 29—Double-sided specification.
4.4.3 Double-Sided Specification Example–Azimuth Beamwidth Validation For this example of the validation process, the calculation of the azimuth beamwidth specification, the subband of 1710 – 1880 MHz will be used.
1710-1880 MHz 1850-1990 MHz 1920-2170 MHz Azimuth Beamwidth 67.9° +/- 1.9° 65.0° +/- 1.6° 63.4° +/- 2.3°
The antennas radiation patterns for the subband are analyzed per the parameter definition. Parameter Definition
The 3dB, or half power, azimuth beamwidth of the antenna is defined as the angular width of the azimuth radiation pattern, including beam peak maximum, between points 3 dB down from maximum beam level (beam peak).
Figure 30—Azimuth beam peak patterns plots - 1710 - 1880 MHz, all ports, and all tilts.
84%
-1.5 σ 1.5 σ
Degrees
dB

t
Page 58 (119) N-P-BASTA White Paper Version 9.6 <15 -January -2013 >
The values for azimuth beamwidth are calculated for each frequency in the subband, each port, and each downtilt setting.
Table 2—Complete data set azimuth beamwidths.
The set of measured values is analyzed statistically to determine the specification.
Table 3—Summary of azimuth beamwidth statistics (1710 – 1880 MHz).
Az -3 dB beamwidth Min Max Mean Stdv 1.5 Stdv
1710 - 1880 MHz 65.41 70.51 67.90 1.26 1.89
The specification is set as:
Parameter Mean +/- 1.5 Standard Deviations (Stdv) Azimuth Beamwidth 67.9° +/- 1.9° As previously state, in the white paper example, the azimuth beamwidth has been calculated for one subband (1710-1880 MHz).
1710-1880 MHz Parameter Mean +/- 1.5 Stdv Azimuth Beamwidth 67.9° +/- 1.9°
This procedure was repeated two additional times to populate the full specification table for the azimuth beamwidth parameter which is shown below:
1710-1880 MHz 1850-1990 MHz 1920-2170 MHz
Azimuth Beamwidth 67.9° +/- 1.9° 65.0° +/- 1.6° 63.4° +/- 2.3°

t
Page 59 (119) N-P-BASTA White Paper Version 9.6 <15 -January -2013 >
For the white paper, it is instructive to plot the azimuth beamwidth values as a function of frequency, and the distribution of the calculated values in a histogram. These plots are shown below:
Figure 31—Plot of azimuth beamwidth values.
Figure 32—Histogram of azimuth beamwidth values.
GHz
69.8° 66.0° 67.9°
Degrees
67.9°
66.0°
69.8°
Degrees

t
Page 60 (119) N-P-BASTA White Paper Version 9.6 <15 -January -2013 >
4.4.4 Double-Sided Specification Example–Azimuth Beam Squint Validation
For this example of the validation process, the calculation of the azimuth beam squint specification, the subband of 1710 – 1880 MHz will be used.
1710-1880 MHz 1850-1990 MHz 1920-2170 MHz Azimuth Beam Squint 1.1° +/- 2.4° 2.7° +/- 2.7° 2.6° +/- 2.6°
The antennas radiation patterns for the subband are analyzed per the parameter definition. Parameter Definition
• Beam pointing angle in the azimuth cut defined using center of 3 dB points; referenced to the
antenna’s mechanical boresight The values for azimuth beam squint are calculated for each frequency in the subband, each port, and each downtilt setting.
Table 4—Complete data set azimuth beam squint values.
The set of measured values is analyzed statistically to determine the specification.
Table 5—Summary of azimuth beam squint statistics (1710 – 1880 MHz).
Az Beam peak angle (bisected at -3 dB) Min Max Mean Stdv 1.5 Stdv
1710 -18810 MHz -2.36 4.92 1.08 1.58 2.37

t
Page 61 (119) N-P-BASTA White Paper Version 9.6 <15 -January -2013 >
The specification is set as:
Parameter Mean +/- 1.5 Standard Deviations (Stdv) Azimuth Beam Squint 1.1° +/- 2.4° As previously state, in the white paper example, the azimuth beam squint has been calculated for one subband (1710-1880 MHz).
1710-1880 MHz Parameter Mean +/- 1.5 Stdv Azimuth Beam Squint 1.1° +/- 2.4°
This procedure was repeated two additional times to populate the full specification table for the azimuth beam squint parameter which is shown below:
1710-1880 MHz 1850-1990 MHz 1920-2170 MHz
Azimuth Beam Squint 1.1° +/- 2.4° 2.7° +/- 2.7° 2.6° +/- 2.6°
For the white paper, it is instructive to plot the azimuth beamwidth values as a function of frequency, and the distribution of the calculated values in a histogram. These plots are shown below:
Figure 33—Plot of azimuth beam squint value.
3.5°
GHz
1.1°
- 1.3°

t
Page 62 (119) N-P-BASTA White Paper Version 9.6 <15 -January -2013 >
Figure 34—Histogram of azimuth beam squint value.
4.4.5 Single-sided Specifications Minimum and Maximum
For some parameters, their relevance is best captured by how the data set of calculated values fall above or below a threshold parameter value; therefore, they are designated as single-sided parameters. A “minimum” specification for a parameter is defined when an antenna’s performance is generally greater than the specified value, and a “maximum” specification for a parameter is defined when an antenna’s performance is generally less than the specified value. Statistically, “maximum” is a threshold value defined by the mean plus one standard deviation of the measured data set of values used to validate the specification; for a normal distribution, 84% of the parameter values will fall below this specification. Statistically, “minimum” is a threshold value defined by the mean minus one standard deviation of the measured data set of values used to validate the specification; for a normal distribution, 84% of the parameter values will fall above this specification. The statistical validation is applied in the units identified in the specification definition.
Degrees
3.5° 1.1° -1.3°
“Maximum (<)” Specification: Mean + 1.0 standard deviation

t
Page 63 (119) N-P-BASTA White Paper Version 9.6 <15 -January -2013 >
Figure 35—Single-sided specification (maximum).
.
Figure 36—Single-sided specification (minimum).
4.4.6 Single-sided Specification Example–F/B Total Power +/- 30° Validation
For this example of the validation process, the calculation of the azimuth beamwidth specification, the subband of 1710 – 1880 MHz will be used.
1710-1880 MHz 1850-1990 MHz 1920-2170 MHz Front-to-Back Ratio, Total Power, +/- 30° > 25.0 > 26.4 > 25.8
The antennas radiation patterns for the subband are analyzed per the parameter definition.
Parameter Definition
• The front-to-back ratio, or F/B, is defined as the ratio of power gain between the beam peak and rear ±30º angular region of the azimuth cut, using the backward (180º) direction as the reference.
84%
“Minimum (>)” Specification: Mean – 1.0 standard deviation
84%

t
Page 64 (119) N-P-BASTA White Paper Version 9.6 <15 -January -2013 >
Figure 37—Azimuth pattern plots – 1710 to 1880 MHz, all ports, and all tilts.
Table 6—Complete data set total power F/B.

t
Page 65 (119) N-P-BASTA White Paper Version 9.6 <15 -January -2013 >
Table 7—Summary of total power F/B statistics (1710 – 1880 MHz).
Az Total Power at +180 (+/-)30 deg. Min Max Mean Stdv
1710 - 1880 MHz 23.17 28.61 26.16 1.18
The specification is set as:
Parameter Mean - 1.0 Standard Deviations (Stdv) F/B, Total Power , +/- 30° > 25.0 dB° Note that the specification is not more than 3 dB lower than the minimum value; therefore, the specifications do not need to be derated. See Section 4.2. As previously state, in the white paper example, the F/B, Total Power, +/- 30° has been calculated for one subband (1710-1880 MHz).
1710-1880 MHz Parameter Mean - 1 Stdv F/B, Total Power , +/- 30° > 25.0 dB
This procedure was repeated two additional times to populate the full specification table for the Azimuth Beamwidth parameter which is shown below:
1710-1880 MHz 1850-1990 MHz 1920-2170 MHz F/B, Total Power , +/- 30° > 25.0 > 26.4 > 25.8
For the white paper, it is instructive to plot the azimuth beamwidth values as a function of frequency, and the distribution of the calculated values in a histogram. These plots are shown below:

t
Page 66 (119) N-P-BASTA White Paper Version 9.6 <15 -January -2013 >
Figure 38—Plot of F/B, total power, +/- 30 degrees.
Figure 39—Histogram F/B, total power, +/- 30 degrees.
4.4.7 Single-sided Specification Example–Upper Side Lobe Suppression 20° Validation
For this example of the validation process, the calculation of the upper sidelobe suppression specification, the subband of 1710 – 1880 MHz will be used.
> 25.0 dB
> 25.0 dB

t
Page 67 (119) N-P-BASTA White Paper Version 9.6 <15 -January -2013 >
1710-1880 MHz 1850-1990 MHz 1920-2170 MHz Upper Sidelobe Suppression, Peak to 20° > 18.6 > 17.8 > 16.2
The antennas radiation patterns for the subband are analyzed per the parameter definition. Parameter Definition • The minimum suppression level of the side lobes above the main beam peak to a 20° angle
referenced to the main beam peak
Figure 40—Upper side lobe suppression, peak to 20º.
Angular region of specification - 20° above the main beam peak
Main beam peak 10º electrical tilt
Degrees
dB
Elevation Pattern

t
Page 68 (119) N-P-BASTA White Paper Version 9.6 <15 -January -2013 >
Full set of elevation pattern plots 1710 -1880 MHz, both ports, in 1° elevation downtilt increments
Figure 41—Elevation pattern plots – 1710 to 1880 MHz, all ports, and all tilts.
Table 8—Complete data set upper side lobe suppression, peak to 20°.
Table 9—Summary of upper side lobe suppression statistics (1710 – 1880 MHz).
El Upper side lobe suppression @20, db Min Max Mean Stdv
1710 - 1880 MHz 16.89 25.06 20.65 2.01

t
Page 69 (119) N-P-BASTA White Paper Version 9.6 <15 -January -2013 >
The specification is set as:
Parameter Mean - 1 Standard Deviations (Stdv) Upper Sidelobe Suppression, Peak to 20° > 18.6 dB Note that the specification is not more than 3 dB lower than the minimum value; therefore, the specifications do not need to be derated. See Section 4.2. As previously state, in the white paper example, the Upper Sidelobe Suppression, Peak to 20° has been calculated for one subband (1710-1880 MHz).
1710-1880 MHz Parameter Mean - 1 Stdv Upper Sidelobe Suppression, Peak to 20° > 18.6 dB
This procedure was repeated two additional times to populate the full specification table for the Azimuth Beamwidth parameter which is shown below:
1710-1880 MHz 1850-1990 MHz 1920-2170 MHz
Upper Sidelobe Suppression, Peak to 20° > 18.6 > 17.8 > 16.2
4.5 Gain Validation Gain values are typically determined by the gain by substitution method, or the gain by directivity / loss method. Section 8.2.5 describes these methods. Both methods can be used to validate the gain specification, and the validation process described below is applicable to gain data generated by either method. The gain specification is based on the average value measured on all relevant ports, over the specified subband frequency ranges, and at the low, mid, and high electrical downtilt settings. A gain over all tilts is also specified, and it is calculated using measurements over all the antenna downtilt values. The antenna gain must be specified for each of the subbands included in the frequency range of the antenna. Gain measurements must be made carefully to assure accuracy. It can difficult to repeat a gain validation measurement precisely and the accuracy and repeatability of a gain measurement is determined by a number of factors. Section 8.5 provides a discussion of the accuracy of gain measurements. The repeatability of a gain measurement is generally set by experts at between 0.5 dB and 1.0 dB. The repeatability margin specification recommended for gain in this white paper is 0.8 dB. It is a value chosen by industry experts based on experience, and is applied to the specified gain value (mean) of all units of a specific model, measured accurately on all calibrated antenna ranges, at any time, in good environmental conditions. For a specified NGMN BSA subband, the standard frequencies of gain data points averaged will be all the low, mid, and high frequencies of the Tx and Rx bands within the subband. For example, an antenna that had gain specified for the NGMN BSA subband, 1710 – 1880 MHz would be measured at the following frequencies:

t
Page 70 (119) N-P-BASTA White Paper Version 9.6 <15 -January -2013 >
• GSM 1800 Tx (Downlink) 1710, 1748, 1785 MHz • GSM 1800 Rx (Uplink) 1805, 1843, 1880 MHz • AWS Rx (Uplink) 1710, 1733, 1755 MHz • GSM 1900 Rx (Uplink) 1850 MHz
Note that only the Rx subband of the AWS band is in the 1710 – 1880 MHz frequency range of this NGMN BSA subband. Note that only the low frequency point of the GSM 1900 Rx band is in the 1710 – 1880 MHz frequency range of this NGMN BSA subband. See Section 8.1 for the full NGMN BSA subband frequency table. The NGMN recommendation is that Gain is to be specified in two ways:
1. At the specific minimum, median, and maximum values of an antenna’s tilt range. In this case, the validation data for each specified tilt is analyzed only at that tilt, not a range of tilts.
2. Over all tilts of an antenna’s tilt range. In this case, the validation data is analyzed over the entire tilt range as measured in 1° increments of electrical downtilt.
Note that section 8.5 provides guidance on measurement tolerances and best practices for pattern and gain measurements.
4.5.1 Gain Validation for a Single Tilt Value For this example of the gain validation process, that is, the calculation of the gain specification, the subband of 1710 – 1880 MHz, and an electrical downtilt of 0 degrees will be used.
Gain Specification
All ports 1710-1880 MHz 1850-1990 MHz 1920-2170 MHz
0 Tilt 17.1 17.4 17.7 5 Tilt 17.3 17.5 17.7 10 Tilt 17.0 17.0 17.2
The gain measurements for the subband and tilt value are analyzed per the parameter definition.
Parameter Definition • The antenna gain is a measure of input power concentration in the main beam direction as a ratio
relative to an isotropic antenna source. It is determined as the ratio of the maximum power density in the main beam peak direction, at a defined input power, compared to the power density of a lossless isotropic radiator with the same input power. It is defined in the farfield of the antenna.
The values for gain are measured for each frequency in the subband, each port, and 0 degrees of electrical downtilt.
Table 10—Complete data set gain (1710 – 1880 MHz, 0° tilt) .

t
Page 71 (119) N-P-BASTA White Paper Version 9.6 <15 -January -2013 >
The data set of measured values is analyzed statistically to determine the mean..
Table 11—Summary of gain statistics (1710 – 1880 MHz, 0° tilt).
Total Gain, dBi Min
Max Mean
1710 - 1880 MHz 16.85 17.44 17.09
The specification is set by rounding of the mean value to 17.1 dBi. As previously stated, in the white paper example, the Gain has been calculated for one subband (1710-1880 MHz) and one value of electrical downtilt (0 degrees).
All ports 1710-1880 MHz Mean
Gain 0 Tilt 17.1 dBi 5 Tilt 10 Tilt
This procedure was repeated eight additional times to populate the gain specification table as shown:
All ports 1710-1880 MHz 1850-1990 MHz 1920-2170 MHz
Gain dBi 0 Tilt 17.1 17.4 17.7 5 Tilt 17.3 17.5 17.7 10 Tilt 17.0 17.0 17.2
Per the NGMN guidelines, the repeatability margin associated with a 17.1 dBi gain specification is 17.1 dBi – 0.8 dBi, or 16.3 dBi. For the white paper, it is instructive to plot the measured gain values as a function of frequency, and the distribution of the values in a histogram. These plots are shown below:

t
Page 72 (119) N-P-BASTA White Paper Version 9.6 <15 -January -2013 >
Gain Plot for 0° Tilt
Figure 42—Gain plot for 0º tilt, both ports.
17.1 dBi
17.1 dBi
Figure 43—Gain histogram.

t
Page 73 (119) N-P-BASTA White Paper Version 9.6 <15 -January -2013 >
Figure 44—Gain plot with repeatability margin.
4.5.2 Gain Validation for the “Over All Tilts” Value Gain “over all tilts” is also specified. In this specification. the gain is averaged for all values of the tilt range measured in 1° increments. For this example of the gain validation process, that is, the calculation of the “over all tilts” gain specification, the subband of 1850 – 1990 MHz will be used.
All ports 1710-1880 MHz 1850-1990 MHz 1920-2170 MHz 0 Tilt 17.1 17.4 17.7 5 Tilt 17.3 17.5 17.7 10 Tilt 17.0 17.0 17.2
Over all tilts 17.2 +/- 0.2 17.4 +/- 0.3 17.5 +/- 0.3
The values for gain are measured for each frequency in the subband, each port, and all degrees of electrical downtilt in the tilt range of the antenna in 1° tilt increments.
0.8 dB repeatability
17.1 dBi
16.3 dBi

t
Page 74 (119) N-P-BASTA White Paper Version 9.6 <15 -January -2013 >
Table 12—Complete data set gain, over all tilts, 1850 – 1990 MHz.
The data set of measured values is analyzed statistically to determine the mean .and 1.5x standard deviation
Table 13—Summary of gain statistics, over all tilts, 1850 – 1990 MHz.
The specification is set by rounding of the mean value to 17.4 dBi and the rounding up of the tolerance to 0.3 dBi
All ports 1710-1880 MHz 1850-1990 MHz 1920-2170 MHz 0 Tilt 5 Tilt 10 Tilt
Over all tilts 17.4 +/- 0.3
For the white paper, it is instructive to plot the measured gain values as a function of frequency, and the distribution of the values in a histogram. These plots are shown below:

t
Page 75 (119) N-P-BASTA White Paper Version 9.6 <15 -January -2013 >
Figure 45—Gain plot for all tilts, both ports.
Figure 46—Gain histogram.
17.4 dBi
17.7 dBi
17.1 dBi
17.1 dBi 17.4 dBi 17.7 dBi

t
Page 76 (119) N-P-BASTA White Paper Version 9.6 <15 -January -2013 >
The repeatability margin value of 0.8 dBi is graphed below:
Figure 47—Gain plot with repeatability margin.
4.6 Validation of Elevation Downtilt Deviation The validation of the electrical downtilt deviation is a special case. For this example of the validation process, the calculation of the elevation downtilt deviation specification, the antenna subbands of 1710 – 1880, 1859 – 1990, and 1920 -2170 MHz will be used.
1710-1880 MHz 1850-1990 MHz 1920-2170 MHz Elevation Downtilt Deviation < 0.5 < 0.4 < 0.4
The antennas radiation patterns for the subbands are analyzed per the parameter definition.
Parameter Definition
• Maximum absolute deviation from the nominal tilt value in the elevation beam pointing angle
17.4 dBi
16.6 dBi
0.8 dBi repeatability

t
Page 77 (119) N-P-BASTA White Paper Version 9.6 <15 -January -2013 >
Figure 48—Elevation pattern plots – 1710 to 1880 MHz, all ports, and all tilts.
Table 14—Complete data set elevation downtilt deviation.

t
Page 78 (119) N-P-BASTA White Paper Version 9.6 <15 -January -2013 >
The specification value is determined by calculating the absolute value of the deviation from the (nominal) tilt setting value over relevant frequencies, ports and tilt settings. See Table 14. Note that the gray marked values are the elevation beam peak values reference to the mechanical boresight of the antenna. For example:
At the 7° electrical tilt setting, the beam peak measures -6.8°. The deviation of the beam tilt is 0.2° as is the absolute value of the deviation (absolute deviation). The average (mean value) and standard deviation of the absolute deviation value is calculated. The specification is determined by taking the mean value and adding one standard deviation and then rounding up to the nearest tenth of a degree. See the histograms below.
Figure 49—Histogram of down tilt deviation—3 subbands.
1710-1880 MHz 1850-1990 MHz 1920-2170 MHz Elevation Downtilt Deviation < 0.5 < 0.4 < 0.4

t
Page 79 (119) N-P-BASTA White Paper Version 9.6 <15 -January -2013 >
4.7 Guidance on Gain Specifications Provided in Radio Planning Files The recommendation for RF planning tool data file formats is that they follow the same frequency and downtilt convention as the compliance data, preferably to the NGMN recommended frequencies. The gain in the data for each pattern should be the actual measured gain determined when the pattern was taken. Note that this is different than the recommendation for specification sheet gain definition.
5 MECHANICAL PARAMETERS AND SPECIFICATIONS
5.1 Antenna Dimensions: Length, Width, Depth Parameter Definition
• The outer antenna dimensions without additional antenna system components as e.g. the mount or
the RET/ACU unit. • The dimensions are defined along the three axis of a Cartesian coordinate system defining the height
(H), the width (W) and the depth (D) of the product (see figures below).
Specification Definition • Nominal values in metric [mm] scale • Example: HxWxD mm 1391 x 350 x 110 • Assuming the antenna is oriented similar to its alignment on the tower prior any tilting:
o Height is measured along the vertical direction of the antenna (typically this is also the largest extension).
o Width is measured along the horizontal direction of the antenna o Depth is measured perpendicular to the plane spanned by vertical and horizontal direction
XML - Tag Example
<antenna_dimensions height="1391" with="350" depth="110"/>
Relevance
• The antenna dimensions are relevant to plan detailed antenna installations regarding required space,
required fixation points and visual impact. • The antenna dimensions also impact the wind load at a rated wind speed.
Figure 50—Antenna dimensions example.

t
Page 80 (119) N-P-BASTA White Paper Version 9.6 <15 -January -2013 >
Figure 51—Spherical coordinate system for the installed BSA.
5.2 Mechanically Tilted Antennas: Impact on Antenna Loads Parameter Definition
• Accessories or kits allowing mechanical tilt of BSA are optional. • In case such a mechanical tilt is realized, the antenna outline dimensions are impacted depending on
the actual tilt angle applied. • As this depends on the actual tilt angle no guidance value is provided here.
Specification Definition
• Not applicable
Relevance
• The changes of the effective antenna loads at a rated wind speed need to be considered by the
structural designers.

t
Page 81 (119) N-P-BASTA White Paper Version 9.6 <15 -January -2013 >
Figure 52—Mechanically tilted antenna example.
5.3 Packing Size Parameter Definition
• The outer dimensions of t • The packaged antenna • The package includes ordered components as mounting hardware, the accessories as e.g.,
RET/ACU or other options • The dimensions are defined along the three axis of a Cartesian coordinate system defining the height
(H), the width (W) and the depth (D) of the package.
Specification Definition
• Nominal values in metric [mm] • Example: HxWxD 1391 x 350 x 110 mm • The definitions of H, W and D are aligned with these dimensions of the unpacked antenna
independent of the orientation of the package during transport or storage.
XML - Tag Example
<packing_size height="1391" with="350" depth="110"/>
Relevance

t
Page 82 (119) N-P-BASTA White Paper Version 9.6 <15 -January -2013 >
• The packaged antenna dimensions are relevant to plan and optimize transport and storage of the
antenna.
5.4 Net Weight Parameter Definition
• The net weight of an antenna without mounting hardware and without accessories or other options • The net weight of the individual antenna options as e.g. antenna mounting hardware (including all
nuts, bolts and brackets of the corresponding variant) or the RET/ACU • Providing the individual values provides all information required and avoids missing clarity of different
kits or options.
Specification Definition
• Nominal values in SI units [kg] • Examples: Weight w/o Mtg Hardware, 14.5 kg • Mounting Hardware Weight, 3.4 kg
XML - Tag Example
<net_weight weight_wo_mtg_hardware="14.5" mounting_hardware_weight ="3.4"/>
Relevance
• The antenna weight is relevant to plan detailed antenna installations regarding pole loading, transportation and installation work.
5.5 Shipping Weight Parameter Definition • The shipping weight of an antenna includes the antenna, its packaging and all other options put into
the package (as e.g., the selected mount)
Specification Definition
• Nominal values in SI units [kg] • Examples: Shipping Weight, 22.5 kg
XML - Tag Example
< shipping_weight value="22.5"/>
Relevance
• The antenna shipping weight is required for the logistics to manage shipping and storage of antennas

t
Page 83 (119) N-P-BASTA White Paper Version 9.6 <15 -January -2013 >
5.6 Connector Type Parameter Definition
• The antenna connector type specifies the interface ports of the antenna to attach other system
components (e.g., feeder cables, RRH connections). This includes RF connectors as well as those that interface with the RET/ACU.
Specification Definition
• RF connectors follow standards nomenclature regarding the size and detail it with the male/female
information. Selected options as long/short neck are specified. • Example: 7-16 Long Neck Female • Mechanical interface connectors for the RET/ACU are often proprietary. No generic guidance can be
provided within this white paper.
XML - Tag Example
<connector_type value="7-16_long_neck_female"/>
Relevance • The antenna connector types are relevant for the operators to ensure the system components can be
connected with the antenna in an efficient way without the need for additional connectors or adapters.
5.7 Connector Quantity Parameter Definition
• The antenna connector quantity specifies the number of interface connectors of the antenna. This
includes RF connectors as well as those that interface with the RET. • The quantity depends on the number of sub-bands and polarizations that are supported by the
antenna.
Specification Definition
• The nominal value of the quantity is defined • Example: (4) 7-16 Long Neck Female
XML - Tag Example
<connector_quantity value="4"/>
Relevance
• The antenna connectors define the input interfaces to connect the antenna to the rest of the system.
This is relevant for the operators to ensure their system design matches the antenna input needs regarding the connection as well as for the different inputs.

t
Page 84 (119) N-P-BASTA White Paper Version 9.6 <15 -January -2013 >
5.8 Connector Position Parameter Definition
• This parameter defines the position of the different antenna interface connectors together with a
marking of the corresponding required input (frequency band, polarization). • Remark: The detailed position of the individual connector will vary by the antenna manufacturer
design. Minimum generic information to be provided is the side where the connectors are located in (back, bottom).
Specification Definition
• If nominal values of spacing or dimensions versus reference planes are indicated they have to be stated in SI units [mm].
XML - Tag Example
<connector_position value="top"/> Or <connector_position value="back"/> Or <connector_position value="bottom"/> Relevance
• Knowledge of the connector position is required for proper antenna operation. It also supports upfront
planning of antenna system cabling for the individual installation site.
5.9 Antenna Connector Specification: Marking Parameter Definition
• The antenna interface marking provides information about the polarization and the band aligned with
the corresponding input.
Specification Definition
• Nominal values of frequency given in [MHz] • Nominal value of the polarization in deg. and associated orientation with ‚+‘ or ‚-‘ • Color marking of the connectors and RET/ACU input (if applicable) of each subband antenna • Example: Figure 53—Bottom end cap example with marking.
XML - Tag Example
Not relevant, as that is printed onto the antenna.
<windload-maximum value = “640”2

t
Page 85 (119) N-P-BASTA White Paper Version 9.6 <15 -January -2013 >
Relevance
• This information facilitates installation to avoid wrong connections.
Figure 53—Bottom end cap example with marking.
5.10 Windload, Calculation Parameter Definition • While the means of determining the windload itself is left to the antenna provider, the following
methods are listed in the order of best practice and reliability: 1. Wind tunnel testing with measured wind loads. 2. Computation fluid dynamics simulation of the antenna mounted as standalone device with no interaction with other antenna. 3. Calculation by similarity to antennas where the load is already known by applying methods 1 or 2. 4. Load Factors calculated from published literature for flow sections of similar cross-sections.
5.11 Windload, Maximum Parameter Definition • The windload - maximum defines the maximum load on the antenna resulting at the rated wind
speed. The incoming angle of the wind resulting in the maximum load for a defined antenna design depends on the design.
Specification Definition • Windload based on SI units [N] • Example:
o Rated Wind Speed: 150 km/h o Wind Load - Maximum @ rated wind speed, 640 N

t
Page 86 (119) N-P-BASTA White Paper Version 9.6 <15 -January -2013 >
XML - Tag Example <windload-maximum value="640" rated_wind_speed=”150”/> Relevance • The windload values are required by structural engineers to calculate resulting tower load in order to
dimension the towers appropriately. The windload – maximum provides figures for a ‚worst case assessment at a rated wind speed.
5.12 Windload, Frontal Parameter Definition • The windload - front defines the load resulting at the rated wind speed for a wind incoming from the
front of the antenna (perpendicular to the front plane of the antenna).
Specification Definition • Windload based on SI units [N] • Example:
o Rated Wind Speed, 150 km/h o Wind Load - Frontal @ Rated Wind, 640 N o
XML - Tag Example
<windload-frontal value="640" rated_wind_speed=”150”/>
Relevance • The windload values are required to calculate resulting tower load to dimension the towers
appropriately.
5.13 Windload, Lateral Parameter Definition • The windload-side defines the load resulting at the rated wind speed for a wind incoming from the side
of the antenna (perpendicular to the plane spanned by the vertical and the broadside direction). Specification Definition • Windload based on SI units [N] • Example:
o Rated Wind Speed, 150 km/h o Wind Load - Side @ Rated Wind 147 N
XML - Tag Example
<windload-lateral value="147" rated_wind_speed=”150”/>

t
Page 87 (119) N-P-BASTA White Paper Version 9.6 <15 -January -2013 >
Relevance • The windload values are required to calculate resulting tower load to dimension the towers
appropriately.
5.14 Survival Wind Speed Parameter Definition • The survival wind speed defines the maximum wind velocity the BSA can withstand without taking
permanent damage. It must also survive without being impacted or misaligned due to wind forces in any way that would require service maintenance at the site.
Specification Definition • Nominal value in SI units [km/h] • Examples: Survival wind speed 200 km/h XML - Tag Example <survival_wind_speed value="200"/>
Relevance • The survival wind speed marks one limiting factor in the network viability against environmental
impact. For the operators it is relevant that the product remains unharmed as well as the existing network installation in order to avoid additional OPEX. In some countries this is even requested by the government to ensure communication systems availability after natural catastrophes as hurricanes or tornados. Antenna companies might offer specific products designed for higher survival wind speeds than standard as requested by customers.
5.15 Radome Material Parameter Definition • The radome material provides high level information about the material the antenna radome is made
from. This information will not be detailed to certain composition variants and/or supplier references. Specification Definition • No specific unit applicable • Examples: antenna radome is made from a PVC material
XML - Tag Example <radome_material value="PVC"/>
Relevance • The material of the radome contributes to the overall antenna environmental compliance.

t
Page 88 (119) N-P-BASTA White Paper Version 9.6 <15 -January -2013 >
5.16 Radome Color Parameter Definition • The radome color is a simple statement about the color of the radome. This is strongly related to the
material used. • Color options for BSA radomes are uncommon.
Specification Definition • No specific unit applicable • Examples: RAL color code e.g., RAL7005
XML - Tag Example <radome_color value="RAL7005"/>
Relevance • The radome color might be of interest to minimize obtrusiveness of an antenna installation
5.17 Product Environmental Compliance Parameter Definition • Overall the environmental compliance is the combination of all individual environmental compliance
statements declared for the product. • Recyclability of the product falls also under the environmental compliance term. • A variety of different standards with different content and focus exist across the globe. • Compliance requirements for the product depend on the country it shall be shipped to or installed in.
The product must fulfill these requirements. • The necessity to state the environmental compliance in the data sheet depends on the individual
standard. Nevertheless it can be done for marketing purposes. • The compliance information must be provided as part of the product documentation and/or shipping
papers in order to ensure import and export of the product into countries is possible. • Specific product marking requirements (if any) are defined by the corresponding environmental
standard.
Specification Definition • No specific unit applicable • Examples: RoHS, Reach, WEEE
XML - Tag Example
<product_environmental_compliance standard="ETSI EN300019-1-1 for storage" compliance="Class 1.2"/>
<product_environmental_compliance standard="ETSI EN 300019-1-2 for transportation" compliance="Class 2.3"/>
<product_environmental_compliance standard="ETSI EN 300019-1-4 for environmental conditions" compliance="Class 4.1 E"/>
<product_environmental_compliance standard="RoHS" compliance="full_compliant"/>

t
Page 89 (119) N-P-BASTA White Paper Version 9.6 <15 -January -2013 >
Relevance • The compliance to individual environmental standards might be required by law, can be an industry
wide accepted ‘best practice’ or might be requested by the individual customer.
5.18 Mechanical Distance between Mounting Points—Antenna Parameter Definition • The mechanical distance between mounting points – antenna defines the vertical distance between
the fixation points of the antenna to its mounting hardware. Specification Definition • Nominal values in metric units [mm] • Example: S = 1274,00 mm
XML - Tag Example
<mechanical_distance_between_mounting_points-antenna value="1274.0"/>
Relevance • The value is of interest for installation site planning to ensure the corresponding tower provides
sufficient clearance. This value is also of interest for the installation teams in order to mount the antenna correctly.
5.19 Mechanical Distance between Mounting Points – Pole Parameter Definition • The mechanical distance between mounting points – pole defines the vertical distance between the
mounting brackets of an antenna at the pole. • Remark: This might be in line with the Distance of mounting points – Antenna.
Specification Definition • Nominal values in metric units [mm] • Example: see picture, S2 = 1019,00
XML - Tag Example
<mechanical_distance_between_mounting_points_-_pole value="1019.0"/>
Relevance • The value is of interest for installation site planning to ensure the corresponding tower provides
sufficient clearance. • This value is also of interest for the installation teams in order to mount the antenna correctly.

t
Page 90 (119) N-P-BASTA White Paper Version 9.6 <15 -January -2013 >
Figure 54—Example highlighting the potential differences of the mechanical distance between mounting points for antenna and pole.
5.20 Lightning Protection
Parameter Definition: • Basically it is assumed, that according good practice and relevant national standards the supporting
structures and poles are grounded and/or connected to the lightning protection system of the building. • It has to be specified, if the Base Station Antenna is equipped with a special connection joint for
grounding purposes or if the antenna has a conductive structure, which ensures a grounding connection by attaching the antenna with fixing clamps to the pole.
Specification Definition: • Nominal values in SI units • Example: Grounding: The metal parts of the antenna including the mounting kit and the inner
conductors are DC grounded. In case that the antenna is attached at the tip of a pole, the lightning protection has to be declared • Example: Lightning Protection: The antenna is designed to withstand a lightning current of 150 KA
(impulse: 10/350 μs), according to IEC 62305 parts 1–4 an VDE 0855-300, and thereby fulfils the requirements of lightning protection class II. Grounding cross-section: 22 mm2 copper.
6 ENVIRONMENTAL STANDARDS
6.1 23458293Base Station Antenna Environmental Criteria The operating environment of base station antennas is classified as remote, stationary, outdoor, uncontrolled and not weather-protected. The electromagnetic environment includes close proximity to intentionally radiating devices and installation on structures prone to lightning strikes. The systems are expected to operate in this environment for an extended period of time. This, together with storage, transport and installation conditions, defines the “mission profile” for antennas and other tower top systems – a key factor needed to their determine reliability.

t
Page 91 (119) N-P-BASTA White Paper Version 9.6 <15 -January -2013 >
The European Telecommunications Standards Institute (ETSI) defined climatic classifications appropriate to describe the operating environment for tower top systems. Because installation environments vary, a single classification is not appropriate for all locations. A summary of these classifications is given in Table 1. Class 4.1 represents a nominal uncontrolled outdoor environment. Class 4.1E extends temperature and humidity ranges to the average minimum and maximum temperatures in the 5 European climatic zones. Classes 4.2L and 4.2H represent more extreme climates addressed by ETSI but, in practice even these are further extended in regions outside of Europe. For example, high temperature operation at +70ºC is a common requirement for base station antennas. Table 15—ETSI 300 019-1-4 stationary, non-weather protected environmental classes.
Environmental Parameter 4.1 4.1E 4.2L 4.3H Unit
Minimum air temperature -33 -45 -65 -20 ºC Maximum air temperature 40 45 35 55 ºC Minimum relative humidity 15 8 20 4 %RH Maximum relative humidity 100 100 100 100 %RH Minimum absolute humidity 0.26 0.03 0.003 0.09 g/m3 Maximum absolute humidity 25 30 22 36 g/m3 Rain intensity 6 15 15 15 mm/min Maximum temperature change rate 0.5 0.5 0.5 0.5 ºC/min Minimum air pressure 70 70 70 70 kPa Maximum air pressure 106 106 106 106 kPa Solar radiation 1120 1120 1120 1120 W/m2 Maximum wind speed 50 50 50 50 m/s
The standard BSA product complies: • ETSI EN300019-1-1 for storage: Class 1.2 • ETSI EN 300019-1-2 for transportation: Class 2.3 • ETSI EN 300019-1-4 for environmental conditions: Class 4.1 E As mentioned customer requirements and application scenarios might call for more rigid environmental class compliance as 4.2L or 4.2H. The specific design changes and material selections required for that compliance is out of the scope of this white paper.
6.2 Environmental Test Approach The generic test approach for qualifying BSA products to environmental parameters is similar to other technical qualification best practice rules. Overall target is to demonstrate compliance to the applicable standard and environmental class (see Section 4.1). This qualification requires for each of the parameters to be verified: • A defined test set-up: This serves as instruction to set-up the test in a defined reproducible way using
certified test equipment. It consists typically of a plan or block diagram identifying the components and devices of the test set-up, their serial numbers and a wiring diagram. For test equipment the start settings and/or calibration procedure shall also be included.
• The definition of standard atmospheric conditions (see IEC 68-1) in which the tests take place (even if during test the specimen might be subject to strongly deviating conditions). These conditions are defined with some range to enable testing also in not completely climatic controlled environment.
• A uniform and reproducible method of environmental test (see Section 4.3). The individual test procedures of IEC 60068 cover the different environmental parameters applicable to BSA.
• Trained test operator(s) proficient in the application of the test equipment and measurement devices. • A defined number of test specimens. This is rarely prescribed by IEC60068. Nevertheless, the team
should consider this in relation to the foreseen risk on the test and the reproducibility of the devices production, materials, number of suppliers, etc. In case the test effects have some statistic behaviour

t
Page 92 (119) N-P-BASTA White Paper Version 9.6 <15 -January -2013 >
the number of test specimen should be selected accordingly (under consideration of test efforts in time and budget).
• A defined set of acceptance criteria. The test specimen shall comply to the defined acceptance criteria prior and after the test. Depending on the test these criteria are also to be observed and rated during the test itself. Available test equipment might limit this ‘during the test’ assessment so a practical but also documented approach on what is required and what can be done is necessary. The list of acceptance criteria differs by parameter. For environmental performance parameters it typically includes functional tests, electrical measurements and visual inspection.
• A test documentation: The test documentation consists of the raw test data and test protocols rating the actual measured values against the test criteria, the identification of the tested specimen (e.g., by model number and serial number) and finally by the test report. It documents the compliance of the tested devices prior the tests, specific test events, observations, consolidated test data of the test itself and the device compliance to the acceptance criteria after the test was performed. The test report is concluded by an assessment of the test results, compliance statement and conclusion for the proceeding.
6.3 Environmental Test Methods The following criteria are used to demonstrate base station antennas can operate as needed in the environments that they will be used. These tests alone cannot determine antenna reliability. Reliability is, the probability over time that they will continue to operate as needed in these environments (see Section 5). However, they can establish initial reliability and indicate service life. Criteria are based on publicly available and widely accepted test methods. They are generally based on ETSI Class 4.1 for common performance needs under nominal conditions or Class 4.1E for extended use (10 years or more) in harsher environments. Comparing the ETS300019-2-4 with the IEC60068 it needs to be acknowledged that the characteristic severities of the ETS might deviate from the corresponding testing severities of the IEC. In general the definitions of these standards should be sanity checked considering the BSA application. Therefore, in some cases, this white paper recommends test limits that deviate from corresponding ETS and IEC rules.
6.3.1 Packaged Storage While packaged, transported and stored, antennas shall tolerate non-temperature controlled weather protected environments without degradation, Baseline: ETS 300 019-1-1 Class 1.2; -25 to +55°C; 10% to 100% Relative Air Humidity. The conditions for water from sources other than rain are the limiting factor for the environmental class of packaged storage. The higher classes 1.3 and 1.3E include splashing water also from side or bottom direction. As the antennas are packed in cardboard boxes these would draw water, get wet and softening up until ripping apart. Therefore the packaged storage class is limited to 1.2.
6.3.2 Cold Temperature Survival Antennas shall operate within specifications after exposure to cold air temperature following IEC 60068-2-1 test methods. Baseline: ETS 300 019-1-4 Class 4.1; 16 hours at -33°C. Extended: ETS 300 019-1-4 Class 4.1E – further extended to 16 hours at -40°C. Due to test equipment limitations it is not possible to demonstrate proper operation of all antenna parameters during the cold temperature survival test. The operation of the device is verified prior and following to the test.
6.3.3 Hot Temperature Survival Antennas shall operate within specifications after exposure to hot air temperature following IEC 60068-2-2 test methods. Baseline: ETS 300 019-1-4 Class 4.1; 16 hours at +40/55°C. Extended: ETS 300 019-1-4 Class 4.1E – further extended to 16 hours at +60°C. Due to test equipment limitations it is not possible to demonstrate proper operation of all antenna parameters during the hot temperature survival test. The operation of the device is verified prior and following to the test.

t
Page 93 (119) N-P-BASTA White Paper Version 9.6 <15 -January -2013 >
6.3.4 Temperature Cycling Antennas shall operate within specifications after exposure to temperature cycling following IEC 60068-2-14 test methods. Baseline: ETS 300 019-2-4 Class T4.1; 2 cycles with T1 = 3h and 0.5 °C/min from -10°C to +40°C. Extended: ETS 300 019-2-4 Class T4.1E; 2 cycles with T1 = 3h and 0.5 °C/min from -10°C to +45°C. BASTA team recommendation: 5 cycles with 1 °C/min from -25 °C to +45 °C (T1 = 3 h). The T1 is the holding duration that is key at the extreme limits of the temperature cycling range. The actual temperature change rate has little impact. The characteristic severity of the lower temperature of ETS300019-2-4 strongly differs from the lower temperature limit defined in the cycle testing of IEC 60068-2-14. Technically the risk for failures increases in the lower end of the temperature range. Based on these considerations and available testing capabilities, allowing temperature change rates of 1 °C/min, the team agreed to apply 5 cycles from -25 to +45 °C as a proper compromise between the ETSI and the IEC requirements.
6.3.5 Vibration – Sinusoidal Antennas shall operate within specifications after (non-operating) exposure to sinusoidal vibration following IEC 60068-2-6 test methods. Baseline: Five 2-200 Hz sweeps in each X, Y and Z axis, limited to 0.5g. Extended: Five 2-200 Hz sweeps in each X, Y and Z axis, limited to 1.0g. BASTA team recommendation: Start frequency range with 5 Hz due to test equipment limitations.
6.3.6 Humidity Exposure Antennas shall operate within specifications after (non-operating) exposure to humidity exposure following the IEC 60068-2-30 test methods or their equivalent. Baseline: 2 cycles between 25 and 40°C in 24 hours at 90-98% relative humidity. Extended: 2 cycles at 30°C in 24 hours at 90-98% relative humidity. BASTA team recommendation: Standard test: 2 cycles over T = 8 h Extended test: 6 cycles over T = 24 h The joint experience is that no failures have been observed for this test. Therefore, it is considered to be a low risk parameter that could be verified with a shorter standard test of 2 cycles/8 hours. In the case where a new design with major design changes and/or different materials is tested, the experts teams still could apply the more rigid 6 cycle/24 h testing.
6.3.7 Rain Antennas shall operate within specifications after (non-operating) exposure to simulated rain exposure following the IEC 68-2-18 test methods. Baseline: ETS 300 019-1-4 Class 4.1; 6 mm/minute for 30 min Extended: ETS 300 019-1-4 Class 4.1E; 15 mm/minute for 30 min BASTA team recommendation: IEC-68-2-18 10 mm/minutes for 30 min The IEC requirements with 10 mm/min for 30 minutes were considered an acceptable compromise between the ETS characteristic severities.
6.3.8 Water Ingress Antennas electronics and RF path interconnections potentially exposed to water shall be protected against splashed, sprayed or windblown ingress to a rating of IPX6 as defined by IEC 60529 degrees of protection provided by enclosures (IP Code). BASTA team recommendation: Value not to be stated in the technical customer documentation and data sheets. The teams only very rarely receive customer inquiries on this. It is seldom tested or the applicable class might be directly limited by design features (e.g., rain drop holes). It was jointly agreed that this is a parameter not to be stated in the data sheets.

t
Page 94 (119) N-P-BASTA White Paper Version 9.6 <15 -January -2013 >
6.3.9 Dust and Sand Ingress Antenna components potentially harmed to dust or sand exposure shall be protected from ingress to a rating of IP5X as defined by IEC 60529 degrees of protection provided by enclosures (IP Code). Baseline: An IP5X dust ingress rating may be assumed without testing based on demonstration of an IPX6 water ingress rating. Extended: IEC 68-2-68 Test Lc1 or the equivalent. BASTA team recommendation: Value not to be stated in the technical customer documentation and data sheets. Overall not considered to be a problem. Extremely rarely tested, if at all. If inquired the figure might be deducted from the water Ingress test figure. It was jointly agreed that this is a parameter not to be stated in the data sheets.
6.3.10 Survival Wind Speed Antennas shall survive exposure to forces simulating the effects of strong winds without damage, calculated using methods consistent with Eurocode 1: Actions on structures - Part 1-4: General actions - Wind actions (EN 1991-1-4) and/or EIA/TIA 222-G. Detailed reference to be used might vary by country and has to be checked accordingly. Baseline: 50 meters/sec 180 km/h (112 mph). Extended: 50 meters/sec 180 km/h (112 mph). BASTA team recommendation: 55.6 meter/sec; 200 km/h (124 mph) for standard duty antennas, 66.6 meters/sec 240 km/h (150 mph) for heavy duty antennas. The maximum wind velocities cited in ETS 3000019 are not considered to be sufficient for the BSA application. Consequently and in line with the customer requirements a standard survival wind speed of 200 km/h is defined. For higher wind load designs typically 240 km/h is realized although individual customer tailored design solutions might be required. It is acceptable to demonstrate compliance to this survival wind speed by • dynamic testing • static testing • FEM modeling & simulation • similarity to existing verified products • analytics applying best structural engineering practices.
6.3.11 UV/Weather Exposure Antenna materials shall not degrade significantly after simulated solar exposure following the IEC 68-2-18 test methods or their equivalent. The IEC defines three different methods with two cyclic (cycle of light and dark) and one continuous radiation exposure. The cyclic tests are considered to be more aggressive, especially the procedure B that has 20 light and only 4 h dark time. Baseline: Procedure B (20 hrs on / 4 hrs off) at 55°C for 56 cycles/56 days (1344 h). In order to save time shortening the test duration was discussed. Experience is that test duration of at least 1000 h shows the material failures. The test samples have to be visually inspected. Some mechanical tests (tensile and/or bending) have to be performed to ensure the materials keep their properties and do not get brittle. The standards define detailed lists of light sources qualified for the test with resulting impact on test conditions (typically the wavelength of the UV applied). Any light source compatible with the cycling procedure B is acceptable. Crack, chalking or permanent dimensional change might appear in any intermediate test or final inspection. The individual material changes that might be tolerated depend on the material and where it is used. This is to be risk assessed by the mechanical designer on a case by case basis. No generic applicable guidance can be provided in this white paper. As an example these material specific limits could be defined considering following behavior as a failure of the material: Mean tensile strength change > 10% Mean elastic modulus change >30% Mean elongation change >30% Mean impact strength change >30%

t
Page 95 (119) N-P-BASTA White Paper Version 9.6 <15 -January -2013 >
Remark: Significant color changes completely changing the visual aspect of the antenna could become an issue for customer acceptance even if they would not negatively impact the environmental reliability of the antenna.
6.3.12 Corrosion Resistance Antenna materials and surface finishes shall be corrosion resistant for the intended service lifetime. The system, or its components and materials, shall be tested for corrosion resistance following the IEC 68-2-11, test Ka method (a.k.a. B117) using a salt fog (mist) from a neutral, 5 weight percent sodium chloride solution for 28 days (720 hours). Standard Baseline: 10 days (240 h). Extended: Procedure B (20 hrs on / 4 hrs off) at 40°C for 28 days (672 h). BASTA team recommendation: Functional tests are to be done prior to and after the corrosion exposure. The visual acceptance criteria are a wide field and require some definition. While it is jointly agreed that after 28 days of salt spray testing there are always some ‘salt’ remains on the device (which is acceptable) corrosion starting at metal parts creating corrosion traces is not acceptable. Due to limitations of test equipment it is not feasible to test complete antenna products in all cases. Typically test samples are selected that are suitable to demonstrate the viability of the antenna including all connectors, sealing, materials, joints and moving parts versus salt corrosion. The test duration defined in IEC68-2-11 ranges from 16 h to 672 h (28 days). Individual customer inquiries asking for even longer test durations might occur. Acceptance criteria: Visual inspection to be done before and after test: - Excessive corrosion in critical areas - Salt deposits in electrical critical areas - Corrosion of insulating materials and metals - clogging or binding of movable parts
After completing the test, the exposed materials may be washed with warm water and lightly brushed to remove the salt deposits and expose the base material under the salt. Look for the following indications of failure: 1. That the base material has been attacked by the salt deposits. 2. In the case of plating, look for indications that the plating is bubbling, lifting or has been eaten through. 3. For assemblies with working mechanical pieces like thread and seals inspect and use to make sure they still work. 4. Make sure that there is no indication of leakage during testing. 5. Check that all part marking and nameplate are still legible. Electrical Measurements to be done before and after test (if applicable):
- VSWR - Isolation - Intermodulation
6.3.13 Shock & Bump Test Method : IEC 60068-2-27, Test Eb : Bump Requirements : half sine / 6 directions without packaging Duration : 100 ‘bumps’ in each direction BASTA team recommendation: Apply independent of the product weight the test spec defining 50 m/s² acceleration and 11 ms duration.
Input Acceleration Duration

t
Page 96 (119) N-P-BASTA White Paper Version 9.6 <15 -January -2013 >
50 m/s² 11 ms
6.3.14 Free Fall (Packaged Product)
Test Method : IEC 60068-2-31, Requirements : 1 fall per face or 2 falls in specified altitude
Table 16—Free fall test heights.
Mass [kg] Free fall test height [m]
Class T 2.2 Free fall test height [m]
Class T 2.3 < 10 0.8 1.0 < 20 0.6 0.8 < 30 0.5 0.6 < 40 0.4 0.5 < 50 0.3 0.4 < 100 0.2 0.3 > 100 0.1 0.1
BASTA team recommendation: This is either tested or compliance can be declared referring to existing test results of products with similar packaging design. It was also agreed that the test is only applied for the 6 flat sides of the package. No corner drop test is applied.
6.3.15 Broad Band Random Vibration Test Method : IEC 60068-2-64, Test Fh : Vibration broadband BASTA team recommendation: Tested frequency spectrum for broad band random vibration should be aligned with the frequency range applied for the sinusoidal testing.
6.3.16 Steady State Humidity Test Method : IEC 60068-2-56, Test Cab : Damp Heat, Steady state Relative humidity : 93% Temperature : +40°C +/- 2°C Duration : 21 days The steady state humidity test according IEC 60068-56 allows different combinations of temperature [°C] and relative humidity [%]. The test durations range from 12 h to 1344 h (56 days). The selected parameters above define very stringent (highest temperature combined with highest relative humidity, second longest test duration) test conditions.
7 RELIABILITY STANDARDS Reliability is the probability that a product or service will perform as needed for a specified time and under specified operating conditions. It deals with understanding the physics of failure and designing to reduce failure rates throughout service life or, for complex systems, to tolerate failures when they do happen. Acceptance and qualification tests address initial quality by showing that no failures occur under certain operating and environmental conditions. While they may include “reliability demonstrations,” such as corrosion tests run for a fixed time, these tests cannot determine a product’s reliability. By contrast, reliability tests are meant to actually cause failures, usually by accelerating product “aging,” so that realistic failures happen quickly. They are designed to measure failure rates (or MTBF values) and useful operating lives. While there are many references for general reliability test methods (the IEC 60605

t
Page 97 (119) N-P-BASTA White Paper Version 9.6 <15 -January -2013 >
family of standards is one example) in practice most reliability tests and predictions are customized around product features and dominant failure mechanisms. As a result, failure rates, MTBF values and lifetimes are always approximations with several assumptions, which must be known and understood to properly compare predictions from different sources.
8 ADDITIONAL TOPICS
8.1 Recommended Subbands and Associated Frequency List
Figure 55—Common cellular frequency bands—Low band (approximately 1 GHz)
Table 17—NGMN recommended low band BSA subband frequency ranges.
NGMN Recommended BSA Subband Frequency Ranges (MHz)
698 894 792 960
Table 18—Common cellular bands in the low band NGMN BSA subbands.
COMMON CELLULAR BANDS IN NGMN BSA SUBBANDS LTE700-AB / CD (Digital Dividend US) ELTE 800 (Digital dividend Europe) GSM 850 EGSM 900
Table 19—NGMN BSA subband frequency table for low band.
FREQ (MHz) BAND DESCRIPTION

t
Page 98 (119) N-P-BASTA White Paper Version 9.6 <15 -January -2013 >
698 LTE700-AB UP LINK LOW 704 LTE700-AB UP LINK MID 710 LTE700-AB UP LINK HIGH 728 LTE700-AB DOWN LINK LOW 734 LTE700-AB DOWN LINK MID 740 LTE700-AB DOWN LINK HIGH 746 LTE700-CD UP LINK LOW 753 LTE700-CD UP LINK MID 763 LTE700-CD UP LINK HIGH 776 LTE700-CD DOWN LINK LOW 785 LTE700-CD DOWN LINK MID 792 ELTE 800 DOWN LINK LOW 793 LTE700-CD DOWN LINK HIGH 807 ELTE 800 DOWN LINK MID 822 ELTE 800 DOWN LINK HIGH 824 GSM 850 UP LINK LOW 832 ELTE 800 UP LINK LOW 837 GSM 850 UP LINK MID 847 ELTE 800 UP LINK MID 849 GSM 850 UP LINK HIGH 862 ELTE 800 UP LINK HIGH 869 GSM 850 DOWN LINK LOW 880 EGSM 900 UP LINK LOW 882 GSM 850 DOWN LINK MID 894 GSM 850 DOWN LINK HIGH 898 EGSM 900 UP LINK MID 915 EGSM 900 UP LINK HIGH 925 EGSM 900 DOWN LINK LOW 943 EGSM 900 DOWN LINK MID 960 EGSM 900 DOWN LINK HIGH

t
Page 99 (119) N-P-BASTA White Paper Version 9.6 <15 -January -2013 >
Figure 56—Common cellular frequency bands—high band (approximately 2 GHz).
Table 20—NGMN recommended high band BSA subband frequency ranges.
NGMN Recommended Subband Frequency Ranges (MHz)
1710 1880 1850 1990 1920 2170 2300 2690
Table 21—Common cellular bands in the high band NGMN BSA subbands.
Common Bands Contained in the NGMN Subbands GSM 1800 AWS (US) GSM 1900 UMTS 2100 TDD Band 40 - 2300 UMTS EXTENSION 2500
Table 22—NGMN BSA subband frequency table for high band.
FREQ (MHz) BAND DESCRIPTION 1710 AWS & GSM 1800 (DCS) UP LINK LOW 1733 AWS UP LINK MID 1748 GSM 1800 (DCS) UP LINK MID 1755 AWS UP LINK HIGH 1785 GSM 1800 (DCS) UP LINK HIGH 1805 GSM 1800 (DCS) DOWN LINK LOW
TDD Band 40
2300 2500

t
Page 100 (119) N-P-BASTA White Paper Version 9.6 <15 -January -2013 >
1843 GSM 1800 (DCS) DOWN LINK MID 1850 GSM 1900 (PCS) UP LINK LOW
1880 GSM 1800 (DCS) DOWN LINK HIGH & GSM 1900 (PCS) UP LINK MID
1910 GSM 1900 (PCS) UP LINK HIGH 1920 UMTS (2100) UP LINK LOW 1930 GSM 1900 (PCS) DOWN LINK LOW 1950 UMTS (2100) UP LINK MID 1960 GSM 1900 (PCS) DOWN LINK MID 1980 UMTS (2100) UP LINK HIGH 1990 GSM 1900 (PCS) DOWN LINK HIGH 2110 AWS & UMTS (2100) DOWN LINK LOW 2133 AWS DOWN LINK MID 2140 UMTS (2100) DOWN LINK MID 2155 AWS DOWN LINK HIGH 2170 UMTS (2100) DOWN LINK HIGH 2300 TDD Band 40 2350 TDD Band 40 2400 TDD Band 40 2500 UMTS EXTENSION (3G-LTE) UP LINK LOW 2535 UMTS EXTENSION (3G-LTE) UP LINK MID 2570 UMTS EXTENSION (3G-LTE) UP LINK HIGH 2620 UMTS EXTENSION (3G-LTE) DOWN LINK LOW 2655 UMTS EXTENSION (3G-LTE) DOWN LINK MID 2690 UMTS EXTENSION (3G-LTE) DOWN LINK HIGH
Note that the NGMN recommended subbands and frequency tables were based on the common bands in use at the time of the publication of the white paper.
8.2 Guidance on Pattern and Gain Measurements A general guideline is that all equipment used should be calibrated with a visible sticker of latest calibration date.
8.2.1 Mechanical Alignment of Test System Calibrate the mechanical boresight of the antenna / measurement system by testing the antenna elevation pattern two times, change the antenna mounting 180 degrees or if possible flip the antenna mounting axis (recommended). In both cases the absolute value of the antenna tilt should be the same, re-align mechanics if not and test again.
8.2.2 Phase Center Check Antenna under test should be rotated around its own phase center. This can be checked by running an Azimuth pattern test of the antenna and view the phase response over Azimuth angle. Ideally the phase curve should be flat in a sector corresponding to the main beam of the antenna. If not, adjust the antenna position away from or towards the mechanical rotation center of the system until the system mechanical rotation center is aligned with the antenna phase center.
8.2.3 Antenna Pattern Testing Set-up the system to measure the frequencies per Section 8.1 as a minimum. It is recommended that as a minimum the cuts Elevation co-polar and Azimuth co- and cross polar are measured for each port and tilt of interest. Pattern is tested at every Azimuth degree. It is recommended that one calibration is taken for each port (normally Elevation, min tilt) and all the other patterns Elevation / Azimuth of that port are

t
Page 101 (119) N-P-BASTA White Paper Version 9.6 <15 -January -2013 >
measured using same calibration. Signal levels can easily be compared and evaluated relatively to each other.
8.2.4 Pattern Accuracy Estimation The following quick steps are recommended before taking measurements:
• Run a pattern sweep 360 degrees. Check the signal level of measurement points -180º and +180º.
The signal level should be the same since it is the same measurement point, but measured with a time difference between them. If the signal level is not the same, it is an indication of instability in the measurement set-up or surrounding environment that should be further investigated (loose connections, signal interference, stability in instruments).
• Run a new pattern test where the antenna mounting is rotated 180º. Check both patterns. Check for
symmetry issues (for example right hand side of pattern in test 1 should look the same as left hand side of pattern in test 2). This test can give information of asymmetries in the measurement range (reflections or interfering signals from one direction). This test is worth doing in both elevation and azimuth cuts.
• When possible, measure a golden unit antenna with known performance from another range.
8.2.5 Gain Measurement For gain measurement accuracy discussion see section 8.5
8.2.5.1 Gain by Substitution Gain by substitution method is using a known gain reference antenna to compare the AUT with. The gain reference antenna is typically an absolute gain calibrated standard gain horn. It is also known as the Gain by comparison method. Step one is to calibrate the system using the gain reference. Position the gain reference in its phase center and main beam direction and calibrate the system (zero reference). Calibrate for each individual polarization of interest since the transfer function of the range can be different in different polarizations. Step two is to measure the antenna under test in its phase center and main beam direction. The gain of the antenna under test is found by taking the measured values under step two and adding the known gain of the reference antenna which is typically found in a gain table delivered with the antenna.
8.2.5.2. Gain by Directivity/Loss Method In this section an alternative gain measurement is described. This can be performed by measuring the directivity of an antenna and considering the antenna losses.
Calculating the Antenna Gain of an Antenna
Gain G and directivity D are linked by the formula
DkG ×=
with the antenna effective factor k (0 ≤ k ≤ 1) which corresponds to the overall losses of the antenna. Therefore the antenna gain can be calculated by

t
Page 102 (119) N-P-BASTA White Paper Version 9.6 <15 -January -2013 >
[ ] [ ] [ ]dBadBDdBG antenna−= . Calculating the Directivity Gain of an Antenna
With a spherical near field measurement system, the whole surface of a base station antenna can almost be measured without any disturbance through the measurement system themselves.
Figure 57—Spherical nearfield system.
The directivity cannot be measured directly, but computed from the normalized power pattern.
( )∫∫=
φθθφθπ
ddPD
n sin.4
with D = directivity and Pn = 3D power pattern In practice the directivity is calculated from a full 3D pattern measurement.
[ ] [ ] [ ] ( )π4lg10 ⋅+−= dBPowersumdBMaxFFdBD
with MaxFF = overall peak of the measured and computed far field Powersum = Sum of all measured and computed far field points (3D) List of Possible errors: • Shadowing effects of scanner cause the wrong powersum • Probe correction error (in near to far field transformation) • FFT density (sampling criteria during scanning and near to far field transformation) • Wrong FF-reference polarization • High crosspol level
Measuring the Internal Losses of an Antenna
The antenna losses are the sum of all ohmic and dielectric losses between the input connector and the outer surface of the radome and the loss due to the impedance mismatch:
radomematchantennamisnetworkantenna aaaa ++=
The feeding loss networka can be measured with a network analyzer showed in the following picture.
OEWG
Theta –Axis
Phi Axis
AUT
Theta Range : -90° to 90° / Phi Range: -180° to 180°

t
Page 103 (119) N-P-BASTA White Paper Version 9.6 <15 -January -2013 >
Radiating elements
Electrical components
Network-analyzer
Connector
Network
Figure 58—Block diagram of loss measurement.
The measurement can be done in three steps:
1. radiating elements have to be detached 2. transmission of each path is measured 3. transmission losses are added up
The antenna mismatch has to be calculated with
( )[ ]dBramissmatch
21lg10 −⋅−=
Therefore the overall network loss is
smatchnetworkmiscomponentssscableharnenetwork aaaa ++= The dielectric losses of the radome depend on the loss factor δtan which differs for different materials. Because normally the radome is thin the value is less than 0.05dB and therefore can be neglected.
8.3 Guidance on Production Electrical Testing In order to validate the performance and quality of each antenna produced, the following best practices for the production testing of BSAs should be observed by manufacturers
• VSWR (Return Loss)
o Measurement to be performed in an anechoic chamber o VNA calibration to be performed at least once per day (once per shift) o For variable downtilt antennas, measure Return Loss through the full tilt range and record the
worst case value o Final test plots should be recorded and kept on file or shipped a paper copy with the antenna
• Isolation o Measurement to be performed in an anechoic chamber o VNA calibration to be performed at least once per day (once per shift) o For variable downtilt antennas, measure isolation through the full tilt range and record the worst
case value o Final test plots should be recorded and kept on file or shipped a paper copy with the antenna
• PIM o Measurement to be performed in an anechoic chamber o Connectors should be clear of debris and void of damage o Power should be verified at the end of the test cable to ensure appropriate carrier power is
presented to the antenna under test

t
Page 104 (119) N-P-BASTA White Paper Version 9.6 <15 -January -2013 >
If not done, loss in test cable could mask true PIM levels o Equipment noise floor must be validated/calibrated using a low-PIM load o Measurement to be performed in swept mode, that is with one of the two tests tones sweeping in
frequency o For variable downtilt antennas, measure PIM through the full tilt range and record worst case
value o For broadband antennas measuring PIM performance at one subband is generally sufficient to
characterize the PIM performance of the antenna o Final test plots should be recorded and kept on file or shipped a paper copy with the antenna o Best practice is to place dynamic stress on the antenna during PIM testing
• For antennas with cabled corporate feed networks there should be a quality assurance process for assuring the cables are wired properly
• General Comments o Valid equipment calibration stickers should be visible on production equipment o Test technicians should be properly trained
8.4 Recommend Vendor’s Reference Polarization Labelling Convention Given the legacy issue of vendors having defined slant 45 polarization using different naming conventions and geometries, a labeling convention approach is recommended as opposed to harmonizing vendors on a common polarization naming convention. This will avoid inconsistency with an existing installed base of antennas; it does, however, require installer’s attention to interpreting and comparing the labels of different vendors. The labeling convention requires vendors to define the polarization geometry and naming convention they have adopted for their antenna products. This information is to be clearly depicted on a label placed on the back of the antenna. This convention is then applied to labels for each antenna port identifying their polarization. An example of a vendor label defining a polarization geometry and naming convention
Figure 59—Example polarization conventional label.
An example of the label affixed to the back of an antenna

t
Page 105 (119) N-P-BASTA White Paper Version 9.6 <15 -January -2013 >
Figure 60—Polarization conventional label of the antenna back.
An example of the ports labeled per the convention described on antenna back label
Figure 61—Ports identified by polarization.
8.5 Discussion of the Accuracy of Gain Measurements
8.5.1 Gain by Comparison The following section details and discusses potential sources of errors when measuring antenna gain and recommendations in order to minimize these errors. This discussion is mainly focused on gain measurements on far-field ranges using the method of substitution using a known reference antenna, but is in many ways applicable for near-field antenna gain measurements. This is also referred to as “gain by comparison”. As a general rule it is strongly advised that that the measurement equipment is calibrated with reference antenna as close in time as possible prior to the gain measurements and that all instruments has reached their working temperature. After the gain measurements have been performed the reference antenna should be mounted and measured again against the previous calibration to record any deviation.

t
Page 106 (119) N-P-BASTA White Paper Version 9.6 <15 -January -2013 >
8.5.2 Antenna Mismatch between Reference Antenna and AUT The measurement system is typically calibrated by the interface of the receiver (network analyzer) and not out at the interface of antenna under test. The VSWR is typically different between reference antenna and antenna under test, which we will give some error in the calibration due to different reflections in the measurement. Since IEEE definition of gain is not used (the power reflected due to mismatch is not compensated for), the error is estimated to be ~0.1dB. In order to minimize the error it is recommended that long measurement cables are used and that RL is < -20dB measuring into the cable towards the network analyzer.
8.5.3 Size Difference between Reference Antenna and AUT Typically standard gain horn antennas are used as references antennas for gain. Standard gain horn antennas typically have significantly smaller antenna aperture compared to the antenna under test. The quite zone of a far-field range is typically not perfect, having some amplitude and phase variation over the quite zone and depending on the size of the antenna the average signal may differ over the antenna aperture. This can typically account for ~0.1-0.2 dB error in the measurements. This error can however be minimized if the fields in the quite zone is integrated over the mean antenna lengths typically measured and compensated for in the gain calculation.
Figure 62—Example probed data of a quite zone, amplitude ripple.
8.5.4 Temperature/Humidity Draft in Instruments The signal level measured at the receiver (network analyzer) is typically depending on the surrounding temperature and humidity. Recommendation is that temperature/humidity surrounding measurement equipment is controlled to 25ºC.
8.5.5 Polarization The transfer function in the measurement chamber is typically not the same for different polarizations. It is recommended that each measured polarization is individually calibrated.

t
Page 107 (119) N-P-BASTA White Paper Version 9.6 <15 -January -2013 >
8.5.6 Direct Gain Comparison Between Two Antennas The gain difference between two similar antennas can be quit accurately determined by using gain by comparison method. In this case the power level difference between the AUT and the reference antenna (second AUT) is the difference in gain between the two antennas
8.5.7 Reference Antenna Reference antennas should be absolutely calibrated and should periodically be checked/calibrated. Due to errors in the absolute calibration method an error is estimated to be~0.2 dB on the published values.
9 FORMAT FOR THE ELECTRONIC TRANSFER OF SPECIFICATION DATA It is expected that the antenna vendors will provide the parameter (or at least a subset of them) discussed in this white paper in their future datasheets. As it has become common practice that operators request antenna specifications from vendors in tabular format in addition to the datasheet format, it seems useful, to have an agreed upon standard format for data exchange.
Requirements for the data format: • limited flexibility for providing information outside the agreed content • easy to maintain (export / import) • no dependency on any proprietary software
Main formats which were under consideration: • MS - Excel Advantages: easy to be handled, available for everybody Disadvantages: a lot space for having not agreed content, format changes by Microsoft (xls -> xlsx -> xlsy) could be an issue • MS – Access Advantages: agreed structure cannot easily be changed on a case- by- case basis. Disadvantages: not as easy to handle as MS - Excel, format changes by Microsoft (mdb -> mdbx -> mdby) could be an issue
• XML Advantages: it is a standard for data exchange; IT experts know how to handle it. No space for non agreed upon content. No risk of format changes. XML also offers a data definition language. Disadvantages: not as easy to handle as MS – Excel
• JSon As xml, just simplified
The NGMN recommended format is XML
9.1 XML Generic
XML (Extensible Markup Language) is today’s data-interchange format. Details can be found on the Web: http://de.wikipedia.org/wiki/Extensible_Markup_Language and in many other places as well.
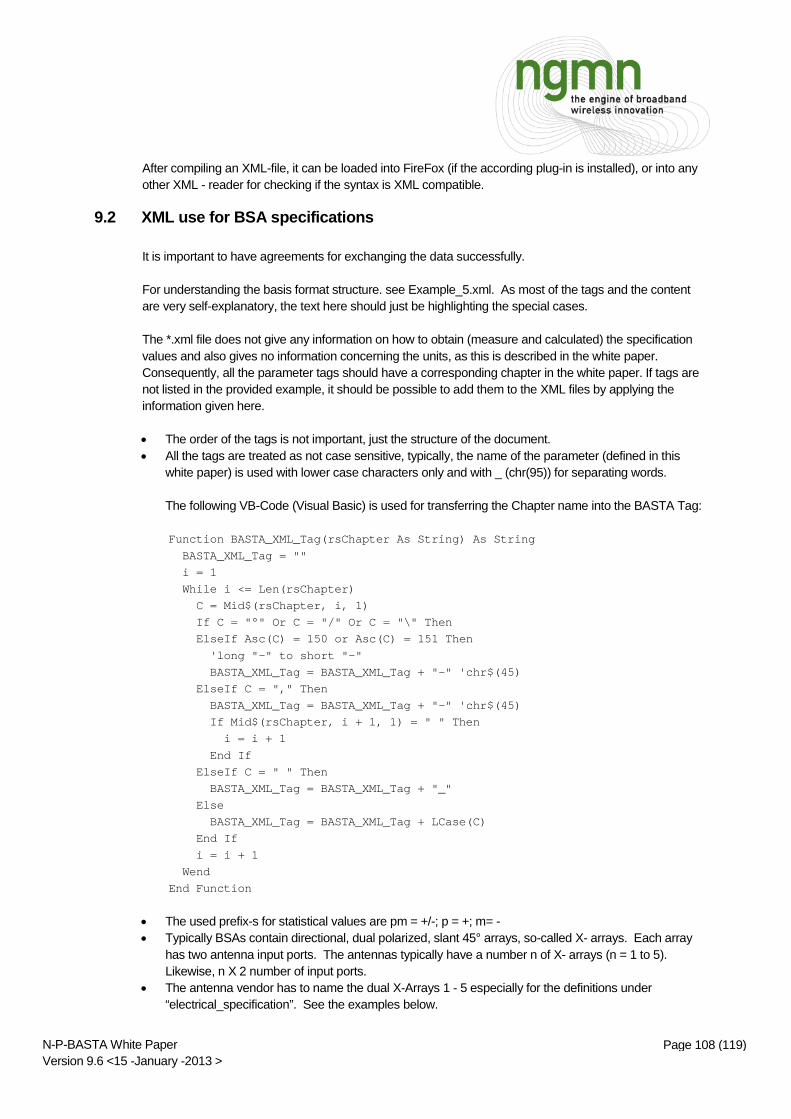
t
Page 108 (119) N-P-BASTA White Paper Version 9.6 <15 -January -2013 >
After compiling an XML-file, it can be loaded into FireFox (if the according plug-in is installed), or into any other XML - reader for checking if the syntax is XML compatible.
9.2 XML use for BSA specifications
It is important to have agreements for exchanging the data successfully. For understanding the basis format structure. see Example_5.xml. As most of the tags and the content are very self-explanatory, the text here should just be highlighting the special cases. The *.xml file does not give any information on how to obtain (measure and calculated) the specification values and also gives no information concerning the units, as this is described in the white paper. Consequently, all the parameter tags should have a corresponding chapter in the white paper. If tags are not listed in the provided example, it should be possible to add them to the XML files by applying the information given here.
• The order of the tags is not important, just the structure of the document. • All the tags are treated as not case sensitive, typically, the name of the parameter (defined in this
white paper) is used with lower case characters only and with _ (chr(95)) for separating words. The following VB-Code (Visual Basic) is used for transferring the Chapter name into the BASTA Tag: Function BASTA_XML_Tag(rsChapter As String) As String BASTA_XML_Tag = "" i = 1 While i <= Len(rsChapter) C = Mid$(rsChapter, i, 1) If C = "°" Or C = "/" Or C = "\" Then ElseIf Asc(C) = 150 or Asc(C) = 151 Then 'long "–" to short "-" BASTA_XML_Tag = BASTA_XML_Tag + "-" 'chr$(45) ElseIf C = "," Then BASTA_XML_Tag = BASTA_XML_Tag + "-" 'chr$(45) If Mid$(rsChapter, i + 1, 1) = " " Then i = i + 1 End If ElseIf C = " " Then BASTA_XML_Tag = BASTA_XML_Tag + "_" Else BASTA_XML_Tag = BASTA_XML_Tag + LCase(C) End If i = i + 1 Wend End Function
• The used prefix-s for statistical values are pm = +/-; p = +; m= - • Typically BSAs contain directional, dual polarized, slant 45° arrays, so-called X- arrays. Each array
has two antenna input ports. The antennas typically have a number n of X- arrays (n = 1 to 5). Likewise, n X 2 number of input ports.
• The antenna vendor has to name the dual X-Arrays 1 - 5 especially for the definitions under “electrical_specification”. See the examples below.

t
Page 109 (119) N-P-BASTA White Paper Version 9.6 <15 -January -2013 >
• Vendor-specific parameters and the associated specification values could be brought into the format with the tags “vendor_specific,” and if not avoidable, then also with a separate namespace.
• Comments can be used everywhere under the tag “annotation.”
Example 1:
X-a
rray
„a1"
X-a
rra y
„a2"
por t
„p1"
/ f1
/ +4
5po
rt „p
2" /
f1 /
- 45
port
„p4"
/ f2
/ -4
5po
rt „p
3" /
f2 /+
45
<electrical_specification>
<ambit>
<port name="p1" polarization="+45" />
<port name="p2" polarization="-45" />
<x-array name="a1"></x-array>
<frequency_ranges>
<range start="880" stop="915" />
<range start="925" stop="960" />
</frequency_ranges>
</ambit>
<values>
. . . . .
</values>
</electrical_specification>
<electrical_specification>
<ambit>
<port name="p3" polarization="+45" />
<port name="p4" polarization="-45" />
<x-array name="a2"></x-array>
<frequency_ranges>
<range start="1710" stop="1785" />
<range start="1805" stop="1880" />
</frequency_ranges>
</ambit>
<values>
. . . . .
</values>
</electrical_specification>
Example 2

t
Page 110 (119) N-P-BASTA White Paper Version 9.6 <15 -January -2013 >
X-a
rray
„a1"
X-a
rray
„a2"
port
„p1"
/ f1
& f2
/ +4
5
port
„p2"
/ f1
& f2
/ -4
5
C C
<electrical_specification>
<ambit>
<port name="p1" polarization="+45" />
<port name="p2" polarization="-45" />
<x-array name="a1"></x-array>
<frequency_ranges>
<range start="880" stop="915" />
<range start="925" stop="960" />
</frequency_ranges>
</ambit>
<values>
. . . . .
</values>
</electrical_specification>
<electrical_specification>
<ambit>
<port name="p1" polarization="+45" />
<port name="p2" polarization="-45" />
<x-array name="a1"></x-array>
<frequency_ranges>
<range start="1710" stop="1785" />
<range start="1805" stop="1880" />
</frequency_ranges>
</ambit>
<values>
. . . . .
</values>
</electrical_specification>
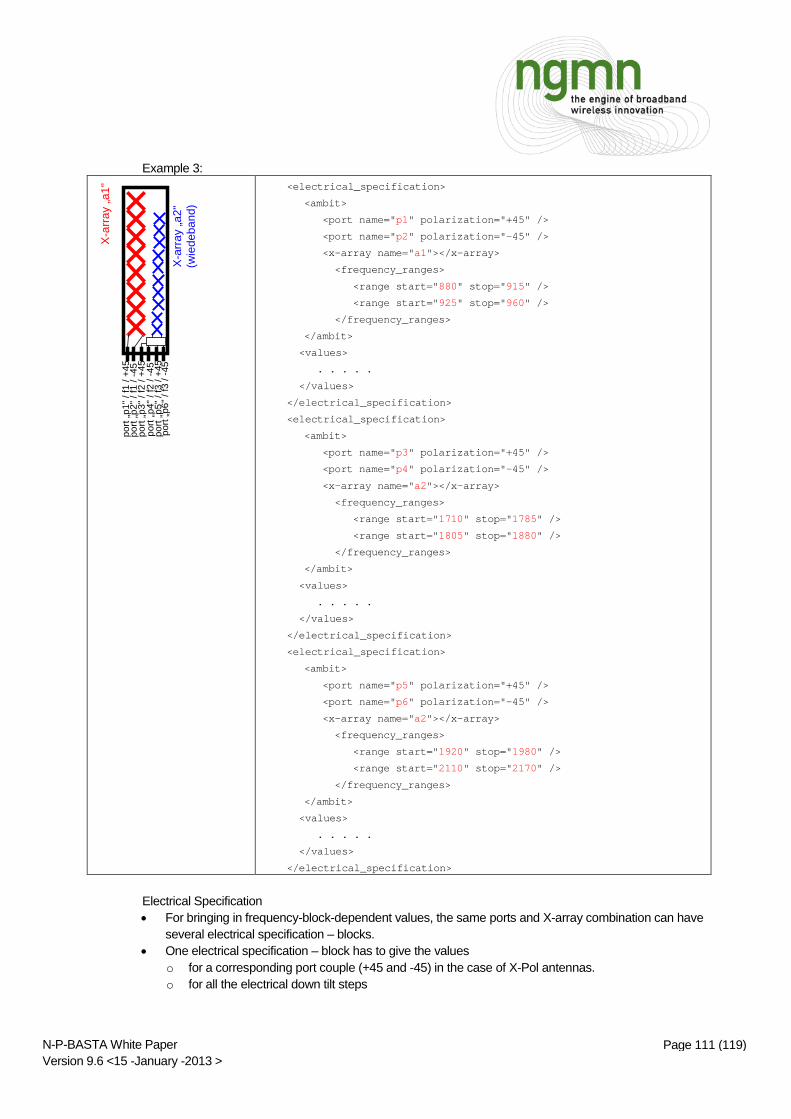
t
Page 111 (119) N-P-BASTA White Paper Version 9.6 <15 -January -2013 >
Example 3:
X-a
rray
„a1"
X-a
rray
„a2"
(w
iede
band
)
port
„p1"
/ f1
/ +4
5po
rt „p
2" /
f1 /
-45
port
„p3"
/ f2
/ +4
5po
rt „p
4" /
f2 /
-45
port
„p5"
/ f3
/ +4
5po
rt „p
6" /
f3 /
-45
<electrical_specification>
<ambit>
<port name="p1" polarization="+45" />
<port name="p2" polarization="-45" />
<x-array name="a1"></x-array>
<frequency_ranges>
<range start="880" stop="915" />
<range start="925" stop="960" />
</frequency_ranges>
</ambit>
<values>
. . . . .
</values>
</electrical_specification>
<electrical_specification>
<ambit>
<port name="p3" polarization="+45" />
<port name="p4" polarization="-45" />
<x-array name="a2"></x-array>
<frequency_ranges>
<range start="1710" stop="1785" />
<range start="1805" stop="1880" />
</frequency_ranges>
</ambit>
<values>
. . . . .
</values>
</electrical_specification>
<electrical_specification>
<ambit>
<port name="p5" polarization="+45" />
<port name="p6" polarization="-45" />
<x-array name="a2"></x-array>
<frequency_ranges>
<range start="1920" stop="1980" />
<range start="2110" stop="2170" />
</frequency_ranges>
</ambit>
<values>
. . . . .
</values>
</electrical_specification>
Electrical Specification • For bringing in frequency-block-dependent values, the same ports and X-array combination can have
several electrical specification – blocks. • One electrical specification – block has to give the values
o for a corresponding port couple (+45 and -45) in the case of X-Pol antennas. o for all the electrical down tilt steps

t
Page 112 (119) N-P-BASTA White Paper Version 9.6 <15 -January -2013 >
This means that it is not allowed to have separate electrical specification – blocks for differing parameters for different downtilts. • frequency range:
should be split after every subband, for example, 1710-1880 MHz, 1850- 1990 MHz, 1920 – 2170 MHz, as this gives clear indication on which frequency sets measurements have been conducted as a basis for all the parameters.

t
Page 113 (119) N-P-BASTA White Paper Version 9.6 <15 -January -2013 >
APPENDIX A – EXAMPLE SPECIFICATIONS SHEET
Note that the RF parameter and mechanical and environmental sample specification sheets are generic and based upon different antenna models from two vendors.

t
Page 114 (119) N-P-BASTA White Paper Version 9.6 <15 -January -2013 >

t
Page 115 (119) N-P-BASTA White Paper Version 9.6 <15 -January -2013 >
APPENDIX B – EXAMPLE SPECIFICATION XML DATA FILE
Note that this example XML data file contains both the required and optional RF specifications recommended in the white paper.
<basta version="9.6"> <annotation>xmlns="urn:aisg.prg.uk:schemas:ngmn:basta seen as a
spaceholder</annotation> <antenna vendor_name="Antenna Company" vendor_ID="t.b.d." vendor_antenna_type="Model -
number" vendor_antenna_description="High Broadband X-Pol 1710-2690MHz" valid_from="2012-03-01" valid_status="final">
<!-- valid_status can be "preliminary" or "final" -->
<type_replacements> <vendor_antenna_type type="7721.08"/> <vendor_antenna_type type="7721.10"/>
</type_replacements> <datasheet_replacement datasheet="P65-18-XB-N" valid_from="2011-12-24"/> <electrical_specifications> <all>
<!-- electrical_specification, valid for the complete antenna should be provided under all. It is up to the antenna constructor, if a certain parameter is listed under all, or in the specific section
--> <interband_isolation value="99.9"/> <nominal_beam_axis value="0"/> <impedance value="99.9"/> <vswr value="99.9"/> <return_loss value="99.0"/> <passive_intermodulation value="99.9"/> <maximum_effective_power_per_port value="99.9"/>
</all> <electrical_specification>
<!-- electrical_specification to be used for every subantenna -->
<ambit> <port name="p1" polarization="+45"/> <port name="p2" polarization="-45"/> <x-array name="a1"/> <frequency_ranges> <range start="99.9" stop="99.9"/> <range start="99.9" stop="99.9"/>
</frequency_ranges> </ambit>
<values> <nominal_horizontal_half_power_beamwith value="99.9"/> <gain value_at_min_tilt="99.9" value_at_mid_tilt="99.9" value_at_max_tilt="99.9"/> <gain_over_all_ tilts value="99.9" tolerance_prefix="pm" tolerance_value="99.9"/>

t
Page 116 (119) N-P-BASTA White Paper Version 9.6 <15 -January -2013 >
<azimuth_beamwidth value="99.9" tolerance_prefix="pm" tolerance_value="99.9"/> <azimuth_beam_squint value="99.9" tolerance_prefix="pm" tolerance_value="99.9"/> <elevation_beamwidth value="99.9" tolerance_prefix="pm" tolerance_value="99.9"/> <electrical_downtilt start="99.9" stop="99.9"/> <elevation_downtilt_deviation value="99.9" tolerance_prefix="pm" tolerance_value="99.9"/> <cross_polar_isolation value="99.9"/> <front_to_back_ratio_total_power_pm30 value="99.9"/> <front-to-back_ratio_over_30_angular_region-total_power_az_and_el value="99.9"/> <null_fill value="99.9"/> <first_upper_side_lobe_suppression value="99.9"/> <upper_side_lobe_suppression_peak_to_20 value="99.9"/> <cross_polar_discrimination_over_sector value="99.9"/> <cross_polar_discrimination_at_boresight value="99.9"/> <cross_polar_discrimination_over_3_db_azimuth_beamwidth value="99.9"/> <cross_polar_discrimination_over_10_db_beamwidth value="99.9"/> <cross_polar_discrimination_over_the_3_db_elevation_beamwidth value="99.9"/> <cross_polar_discrimination_over_the_10_db_elevation_beamwidth value="99.9"/> <azimuth_beam_port-to-port_tracking value="99.9"/> <azimuth_beam_roll-off value="99.9" tolerance_prefix="pm" tolerance_value="99.9"/> <elevation_beam_squint value="99.9"/> <upper_sidelobe_suppression_horizon_to_plus_20_degrees value="99.9"/> <maximum_upper_sidelobe_level value="99.9"/> <azimuth_interference_ratio value="99.9" tolerance_prefix="pm" tolerance_value="99.9"/> <azimuth_beam_pan_angle value="99.9"/> <azimuth_beam_pan_range start="99.9" stop="99.9"/> <azimuth_beamwidth_fan_range start="99.9" stop="99.9"/> <azimuth_beam_squit value="99.9" tolerance_prefix="pm" tolerance_value="99.9"/> <port-to-port_isolation value="30"/>
<!-- When this optional parameter is used, specific ports referenced will need to be
specified and a value provided --></values> </electrical_specification>
<electrical_specification> <annotation>the electrical_specification is used for every subantenna</annotation> <ambit> <port name="p1" polarization="+45"/> <port name="p2" polarization="-45"/> <x-array name="a1"/> <frequency_ranges> <range start="99.9" stop="99.9"/> <range start="99.9" stop="99.9"/>
</frequency_ranges> </ambit>
<values> <nominal_horizontal_half_power_beamwith value="99.9"/> <gain value_at_min_tilt="99.9" value_at_mid_tilt="99.9" value_at_max_tilt="99.9"/> <gain_over_all_ tilts value="99.9" tolerance_prefix="pm" tolerance_value="99.9"/> <azimuth_beamwidth value="99.9" tolerance_prefix="pm" tolerance_value="99.9"/> <azimuth_beam_squint value="99.9" tolerance_prefix="pm" tolerance_value="99.9"/> <elevation_beamwidth value="99.9" tolerance_prefix="pm" tolerance_value="99.9"/> <electrical_downtilt start="99.9" stop="99.9"/> <elevation_downtilt_deviation value="99.9" tolerance_prefix="pm" tolerance_value="99.9"/>

t
Page 117 (119) N-P-BASTA White Paper Version 9.6 <15 -January -2013 >
<cross_polar_isolation value="99.9"/> <front_to_back_ratio_total_power_pm30 value="99.9"/> <front-to-back_ratio_over_30_angular_region-total_power_az_and_el value="99.9"/> <null_fill value="99.9"/> <first_upper_side_lobe_suppression value="99.9"/> <upper_side_lobe_suppression_peak_to_20 value="99.9"/> <cross_polar_discrimination_over_sector value="99.9"/> <cross_polar_discrimination_at_boresight value="99.9"/> <cross_polar_discrimination_over_3_db_azimuth_beamwidth value="99.9"/> <cross_polar_discrimination_over_10_db_beamwidth value="99.9"/> <cross_polar_discrimination_over_the_3_db_elevation_beamwidth value="99.9"/> <cross_polar_discrimination_over_the_10_db_elevation_beamwidth value="99.9"/> <azimuth_beam_port-to-port_tracking value="99.9"/> <azimuth_beam_roll-off value="99.9" tolerance_prefix="pm" tolerance_value="99.9"/> <elevation_beam_squint value="99.9"/> <upper_sidelobe_suppression_horizon_to_plus_20_degrees value="99.9"/> <maximum_upper_sidelobe_level value="99.9"/> <azimuth_interference_ratio value="99.9" tolerance_prefix="pm" tolerance_value="99.9"/> <azimuth_beam_pan_angle value="99.9"/> <azimuth_beam_pan_range start="99.9" stop="99.9"/> <azimuth_beamwidth_fan_range start="99.9" stop="99.9"/> <azimuth_beam_squit value="99.9" tolerance_prefix="pm" tolerance_value="99.9"/> <port-to-port_isolation value="30"/>
<!-- When this optional parameter is used, specific ports referenced will need to be
specified and a value provided --> </values> </electrical_specification>
<electrical_specification> <annotation>the electrical_specification is used for every subantenna</annotation> <ambit> <port name="p1" polarization="+45"/> <port name="p2" polarization="-45"/> <x-array name="a1"/> <frequency_ranges> <range start="99.9" stop="99.9"/> <range start="99.9" stop="99.9"/>
</frequency_ranges> </ambit>
<values> <nominal_horizontal_half_power_beamwith value="99.9"/> <gain value_at_min_tilt="99.9" value_at_mid_tilt="99.9" value_at_max_tilt="99.9"/> <gain_over_all_ tilts value="99.9" tolerance_prefix="pm" tolerance_value="99.9"/> <azimuth_beamwidth value="99.9" tolerance_prefix="pm" tolerance_value="99.9"/> <azimuth_beam_squint value="99.9" tolerance_prefix="pm" tolerance_value="99.9"/> <elevation_beamwidth value="99.9" tolerance_prefix="pm" tolerance_value="99.9"/> <electrical_downtilt start="99.9" stop="99.9"/> <elevation_downtilt_deviation value="99.9" tolerance_prefix="pm" tolerance_value="99.9"/> <cross_polar_isolation value="99.9"/> <front_to_back_ratio_total_power_pm30 value="99.9"/> <front-to-back_ratio_over_30_angular_region-total_power_az_and_el value="99.9"/> <null_fill value="99.9"/>

t
Page 118 (119) N-P-BASTA White Paper Version 9.6 <15 -January -2013 >
<first_upper_side_lobe_suppression value="99.9"/> <upper_side_lobe_suppression_peak_to_20 value="99.9"/> <cross_polar_discrimination_over_sector value="99.9"/> <cross_polar_discrimination_at_boresight value="99.9"/> <cross_polar_discrimination_over_3_db_azimuth_beamwidth value="99.9"/> <cross_polar_discrimination_over_10_db_beamwidth value="99.9"/> <cross_polar_discrimination_over_the_3_db_elevation_beamwidth value="99.9"/> <cross_polar_discrimination_over_the_10_db_elevation_beamwidth value="99.9"/> <azimuth_beam_port-to-port_tracking value="99.9"/> <azimuth_beam_roll-off value="99.9" tolerance_prefix="pm" tolerance_value="99.9"/> <elevation_beam_squint value="99.9"/> <upper_sidelobe_suppression_horizon_to_plus_20_degrees value="99.9"/> <maximum_upper_sidelobe_level value="99.9"/> <azimuth_interference_ratio value="99.9" tolerance_prefix="pm" tolerance_value="99.9"/> <azimuth_beam_pan_angle value="99.9"/> <azimuth_beam_pan_range start="99.9" stop="99.9"/> <azimuth_beamwidth_fan_range start="99.9" stop="99.9"/> <azimuth_beam_squit value="99.9" tolerance_prefix="pm" tolerance_value="99.9"/> <port-to-port_isolation value="30"/>
<!-- When this optional parameter is used, specific ports referenced will need to be
specified and a value provided --> </values> </electrical_specification> </electrical_specifications>
<mechanical_specifications> <antenna_dimensions length="99.9" with="99.9" depth="99.9"/> <packing_size height="99.9" with="99.9" depth="99.9"/> <net_weight weight_wo_mtg_hardware="99.9" mounting_hardware_weight="99.9"/> <shipping_weight value="99.9"/> <connector_type value="7-16_long_neck_female"/>
<!-- connector_type e.g. 7-16_long_neck_female -->
<connector_quantity value="99"/> <connector_position value="top"/>
<!-- connector_position are "top", "back", "bottom" -->
<windload-frontal value="99.9" rated_wind_speed="99.9"/> <windload-lateral value="99.9" rated_wind_speed="99.9"/> <windload-maximum value="99.9" rated_wind_speed="99.9"/> <survival_wind_speed value="99.9"/> <radome_material value="PVC"/>
<!-- radome_material the Vendor should state the material name -->
<radome_color value="RAL7005"/> <lightning_protection value="direct gounded"/> <mechanical_distance_between_mounting_points-antenna value="99.9"/> <mechanical_distance_between_mounting_points-pole value="99.9"/>
<!--

t
Page 119 (119) N-P-BASTA White Paper Version 9.6 <15 -January -2013 >
Any optional antenna accessories can be stated -->
<product_environmental_compliance standard="ETSI EN300019-1-1 for storage" compliance="Class 1.2"/>
<product_environmental_compliance standard="ETSI EN 300019-1-2 for transportation" compliance="Class 2.3"/>
<product_environmental_compliance standard="ETSI EN 300019-1-4 for environmental conditions" compliance="Class 4.1 E"/>
<product_environmental_compliance standard="RoHS" compliance="full_compliant"/> <!-- any other environmental or test procedure compliancy has to be stated
accordingly --> </mechanical_specifications> </antenna> </basta>