recommendation: buy cvs caremark corp. - fisher … stock... · · 2013-07-11revenue growth...
TRANSCRIPT
Market Data
Market Capitalization $55.85B
Shares Outstanding 1.25B
Dividend Yield 1.5%
Dividend $0.65
Beta 0.87
52 Week Price Range $36.44-$49.23
Financial Data (FY 2011)
Revenue $107.1B
Revenue Growth 11.82%
Gross Margin 19.20%
Operating Margin 5.91%
Earnings Per Share $2.57
Price to Earnings 15.22
-50%
0%
50%
100%
150%
200%
250%
02 03 04 05 06 07 08 09 10 11 12
Sh
are
Pri
ce
Year
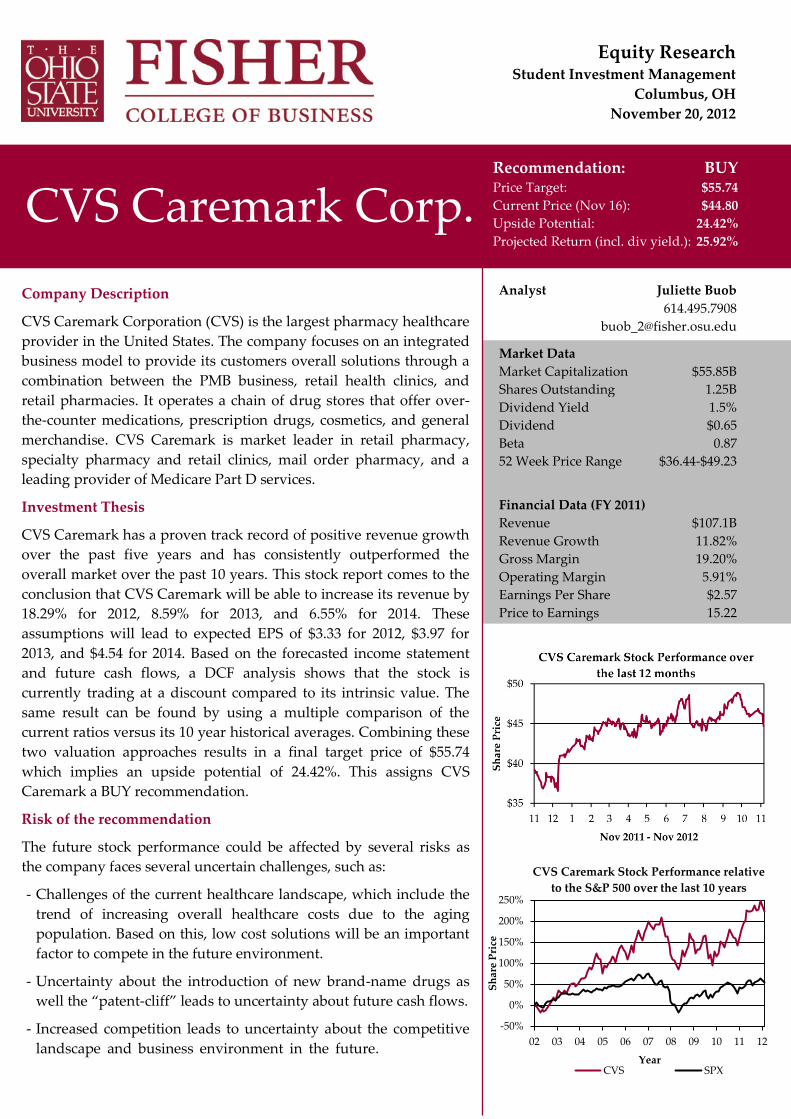
CVS Caremark Stock Performance relative
to the S&P 500 over the last 10 years
CVS SPX
Djkdff d
Company Description
CVS Caremark Corporation (CVS) is the largest pharmacy healthcare
provider in the United States. The company focuses on an integrated
business model to provide its customers overall solutions through a
combination between the PMB business, retail health clinics, and
retail pharmacies. It operates a chain of drug stores that offer over-
the-counter medications, prescription drugs, cosmetics, and general
merchandise. CVS Caremark is market leader in retail pharmacy,
specialty pharmacy and retail clinics, mail order pharmacy, and a
leading provider of Medicare Part D services.
Investment Thesis
CVS Caremark has a proven track record of positive revenue growth
over the past five years and has consistently outperformed the
overall market over the past 10 years. This stock report comes to the
conclusion that CVS Caremark will be able to increase its revenue by
18.29% for 2012, 8.59% for 2013, and 6.55% for 2014. These
assumptions will lead to expected EPS of $3.33 for 2012, $3.97 for
2013, and $4.54 for 2014. Based on the forecasted income statement
and future cash flows, a DCF analysis shows that the stock is
currently trading at a discount compared to its intrinsic value. The
same result can be found by using a multiple comparison of the
current ratios versus its 10 year historical averages. Combining these
two valuation approaches results in a final target price of $55.74
which implies an upside potential of 24.42%. This assigns CVS
Caremark a BUY recommendation.
Risk of the recommendation
The future stock performance could be affected by several risks as
the company faces several uncertain challenges, such as:
- Challenges of the current healthcare landscape, which include the
trend of increasing overall healthcare costs due to the aging
population. Based on this, low cost solutions will be an important
factor to compete in the future environment.
- Uncertainty about the introduction of new brand-name drugs as
well the “patent-cliff” leads to uncertainty about future cash flows.
- Increased competition leads to uncertainty about the competitive
landscape and business environment in the future. dddddddd
Equity Research Student Investment Management
Columbus, OH
November 20, 2012
CVS Caremark Corp. Recommendation: BUY
Price Target: $55.74
Current Price (Nov 16): $44.80
Upside Potential: 24.42%
Projected Return (incl. div yield.): 25.92%
Analyst Juliette Buob
614.495.7908
Stock Data !

CVS Caremark Corporation - Stock Report Juliette Buob
Student Investment Management Autumn 2012 Page 2/20
Table of Content
CVS Caremark - Company Overview ...................................................................................... 3
Business segments .................................................................................................................................. 3
Pharmacy Services .............................................................................................................................. 4
Retail Pharmacy Segment .................................................................................................................. 4
Corporate Segment ............................................................................................................................. 4
Business Strategy and Competitive Advantages ............................................................................... 4
Drivers and Strategy of the Pharmacy Services Segment ............................................................. 5
Drivers and Strategy of the Retail Pharmacy Services .................................................................. 5
Competitors and Market Share............................................................................................................. 5
Recent Developments and Stock Performance ................................................................................... 6
Investment Thesis ........................................................................................................................ 7
Relative Stock Performance................................................................................................................... 7
Financials ............................................................................................................................................... 10
Peer Comparison .............................................................................................................................. 12
Valuation Analysis and Price Target ................................................................................................. 12
Discounted Cash Flow Model ......................................................................................................... 12
Multiples Evaluation ........................................................................................................................ 13
Risks.............................................................................................................................................. 15
Conclusion ................................................................................................................................... 15
References .................................................................................................................................... 17
Appendix 1: Income Statement Forecasting .......................................................................... 18
Appendix 2: Peer Comparison ................................................................................................. 19
Appendix 3: Discounted Cash Flow Analysis ...................................................................... 20

CVS Caremark Corporation - Stock Report Juliette Buob
Student Investment Management Autumn 2012 Page 3/20
CVS Caremark - Company Overview
Founded in 1892, CVS Caremark Corporation, headquartered in
Woonsocked, Rhode Island, is the largest pharmacy healthcare
provider in the United States. The company is divided in three
business segments, pharmacy services, retail pharmacy, and the
corporate division. Through its segments, the company is a market leader in retail pharmacy,
specialty pharmacy and retail clinics, mail order pharmacy, and a leading provider of Medicare
Part D services. With approximately 200,000 employees, CVS Caremark provides a network of
more than 65,000 pharmacies, including more than 7,300 CVS/pharmacy stores, to provide the
best available service for its customers across the United States (CVS Caremark Corp. (2012b)).
Business segments
As mentioned before, CVS Caremark operates its business through three main segments: phar-
macy services, retail pharmacy, and the corporate segment. Pharmacy and retail pharmacy ser-
vices accounted for about 50% each of total sales in the last three years with a slightly over-
weight of pharmacy services (53.64%) compared to retail pharmacy (46.36%) in the third quarter
of 2012. A summary of the three segments of CVS Caremark for the last three years and the third
quarter of 2012 is provided in Figure 1.
Business segments 2012 Q3 2011 2010 2009
in millions Net
Revenue in %
Net
Revenue in %
Net
Revenue in %
Net
Revenue in %
Pharmacy Service Segment $54,802 53.64% $58,874 49.69% $47,145 45.12% $50,551 47.73%
Retail Pharmacy Segment $47,373 46.36% $59,599 50.31% $57,345 54.88% $55,355 52.27%
Corporate Segment - 0.00% - 0.00% - 0.00% - 0.00%
Intersegment eliminations ($10436)
($11373)
($8712)
($7691)
Consolidated Revenue $91,739 $107,100
$95,778 $98,215
Consolidated Revenue (excl.
Intersegment eliminations) $102,175 100% $118,473 100% $104,490 100% $105,906 100%
Even though the pharmacy services segment and the retail pharmacy segment attribute almost
the same sales numbers to the consolidated revenue of CVS Caremark, the distribution of the
percentage attribution to the gross profit and the operating profit shows another view on the
two segments. Figure 2 provides an overview about the numbers for the last quarter and the
year 2011. It is obvious that the retail pharmacy segment accounted more than twice as much as
j
Business segments 2012 Q3 2011
in millions Gross
Profit in %
Operat-
ing Profit in %
Gross
Profit in %
Operat-
ing Profit in %
Pharmacy Service Segment $2,474 15.00% $1,644 31.59% $3,279 15.80% $2,220 34.07%
Retail Pharmacy Segment $14,014 85.00% $4,071 78.23% $17,468 84.20% $4,912 75.38%
Corporate Segment - 0.00% ($511) -9.82% - 0.00% ($616.00) -9.45%
Intersegment eliminations ($279)
($279)
($186)
($186)
Consolidated Profit $16,209
$4,925 $20,561 $6,330
Consolidated Profit (excl.
Intersegment eliminations) $16,488 100% $5,204 100% $20,747 100% $6,516 100%
Figure 1: Overview about revenue by segments (CVS Caremark Corp. (2012c) and CVS Caremark Corp. (2012e)).
Figure 2: Gross and operating profit by segments (CVS Caremark Corp. (2012e) and CVS Caremark Corp. (2012c)).

CVS Caremark Corporation - Stock Report Juliette Buob
Student Investment Management Autumn 2012 Page 4/20
the pharmacy services segment to the consolidated gross and operating profit, which clearly
indicates that the costs in the first segment are much higher than in the second one.
Pharmacy Services
Through its pharmacy service segment, CVS Caremark provides a full range of Pharmacy Bene-
fit Management (PBM) services, which includes for example the mail order and the specialty
pharmacy services, the discounted drug purchase arrangements, Medicare Part D services, clini-
cal services, and pharmacogenomics. The provided services mainly focus on clients like employ-
ers, unions, insurance companies, managed care organizations, and government employee
groups. The pharmacy service segment operates under different names, such as CVS Caremark®
Pharmacy Services, Caremark®, CVS Caremark®, CarePlus, CVS/pharmacy®, CarePlus™,
RxAmerica® and Accordant® (CVS Caremark Corp. (2012c)).
Retail Pharmacy Segment
The retail pharmacy segment focuses on the sale of prescription drugs and general merchandise,
such as over-the-counter drugs, greeting cards, beauty products and cosmetics, seasonal mer-
chandise, and convenience foods through its CVS/pharmacy retail store network and through
the CVS.com website, whereas the majority of the retail pharmacy revenue is generated through
the sale of prescription drugs. Another branch of the retail pharmacy segment is the offer of
healthcare services through its MinuteClinic healthcare clinics, which are operated by nurse
practitioners and physician assistants. The aim of these clinics is to diagnose and treat minor
health conditions, e.g. by performing health screenings, monitoring chronic conditions, or deliv-
ering vaccinations. The segment operates mainly under the names CVS/pharmacy®, Longs
Drugs®, and MinuteClinic®, and the website CVS.com (CVS Caremark Corp. (2012c)).
Corporate Segment
The corporate segment does not contribute any revenue to the company’s income statement. Its
main activity focuses on providing management and administrative services in order to support
the overall company. Services of the corporate segment include corporate relations, human re-
sources, legal, information technology, finance activities, and compliance (CVS Caremark Corp.
(2012c)).
Business Strategy and Competitive Advantages
CVS Caremark’s strategy focuses on its integrated business model, which means providing its
customers overall solutions through a combination between the PMB business, the retail health
clinics and the retail pharmacies. The aim of this business model is to provide its customers with
greater access, choice, and convenience to pharmacy care, to deliver solutions to improve their
health, and to reduce the overall healthcare costs. Besides the customer focus, CVS Caremark’s
strategy also focuses on enhancing shareholder value through productive and long-term
growth, the generation of significant free cash, and the adherence to the company’s disciplined
capital allocation strategy (CVS Caremark Corp. (2012a)). Through its unique business model,
CVS Caremark is well-positioned in the market and owns a market share of about 26.3% (see
subchapter about “Competitors and Market Share” for more details).

CVS Caremark Corporation - Stock Report Juliette Buob
Student Investment Management Autumn 2012 Page 5/20
Drivers and Strategy of the Pharmacy Services Segment
The pharmacy services segment includes several drivers to support the overall business strategy
and to expand its competitive advantages. One major driver is the clinical expertise that allows
the company to deliver innovative plan designs and best-in-class services for its clients and
members and therefore enjoying a high client retention rate. Besides the PMB business, CVS
Caremark is an industry leader in its specialty pharmacy and a strong player in the field of Med-
icare Part D prescription drug plans. Another focus area of the company includes the building a
leadership position in the Part D business and investing in new systems to handle its challeng-
ing regulatory requirements and complex benefit designs (CVS Caremark Corp. (2012a)).
Drivers and Strategy of the Retail Pharmacy Services
The major drivers behind the growth in the retail pharmacy segment include increased customer
access, superior customer service, and patient care improvements. Almost 17.5% of the front-
store revenue was reached by the store brand category, which represents another growth driver
in the retail pharmacy business. These products not only provide higher margins for the compa-
ny, they also help create loyalty and are less expensive for customers. The strategy includes the
release of more store brand products every year. Another powerful competitive advantage in
this business branch is the ExtraCare® Loyalty Program, which is the largest and most success-
ful retail loyalty program. This program provides the opportunity to execute targeted promo-
tional strategy and increase front-store profitability (CVS Caremark Corp. (2012a)).
Further, a major growth opportunity in this segment and part of the company’s business strate-
gy is the operation of its MinuteClinic®, which achieved breakeven profitability in 2011 (CVS
Caremark Corp. (2012a)). The number of operated MinuteClinics across the US was approxi-
mately 600 at the end of 2011c and is expected to increase to 1,000 by 2016 (CVS Caremark Corp.
(2012b)). A major driver behind the MinuteClinics is the belief that they will play an important
role in addressing the cost challenges of healthcare in the US and the shortage of primary care
physicians. This situation will be exacerbated through the healthcare reform in 2014 (See sub-
chapter “Key Fundamental and Economic Drivers” for more information, CVS Caremark Corp.
(2012a)).
Competitors and Market Share
The competitive environment in the pharmacy and retail drug industry is intensive due to the
increasing demand for healthcare and prescription drugs in the upcoming years (IBISWorld Inc.
(2012)). Several factors, such as the US healthcare reform act, the aging baby boomers or the ex-
piring patents support this demand even more (Murphy (2012), Wikinvest (2012), and Zanoni
(2011)). The growing sales of pharmaceuticals and retail drugs have elicited increased competi-
tion from non-traditional drugstores, such as mass merchandisers, online pharmacies, conven-
ience stores, supermarkets, or health clinics. As a response to the higher competition, traditional
drugstores like CVS Caremark or Walgreen Company try to stay competitive by offering con-
venience factors to their customers (e.g. drive-through pharmacy windows, longer operation
hours, standalone capabilities). However, due to the high competition, a continuing consolida-
tion within the industry is expected (IBISWorld Inc. (2012)).

CVS Caremark Corporation - Stock Report Juliette Buob
Student Investment Management Autumn 2012 Page 6/20
The main competitors of CVS Caremark are Walgreen Company, Rite Aid Corporation, and Ex-
press Scripts Holding Company. Other competitors include Costco Wholesale Corporation, as
well as Wal-Mart Stores Incorporation (Yahoo! Finance (2012a), and IBISWorld Inc. (2012)). Fig-
ure 3 provides an overview about the market share of the three traditional drugstore companies
in the US. CVS Caremark is, with a market share of 26.3%, only 4% behind Walgreen Company
(30.9%). Even though all of these competitors operate similar business activities as CVS Care-
mark, it is difficult to make out one main
competitor because all have slightly differ-
ent business models, do not address exactly
the same clientele, and their geographic
region does not match completely. An eval-
uation of the comparison between key fi-
nancial ratios in terms of size, growth rates
and multiples will follow in the subchapter
“Peer comparison” on page 12. Further, ap-
pendix 2 on page 19 provides a detailed
overview of the key financial ratios of CVS
Caremark and its competitors.
Recent Developments and Stock Performance
The most recent event affecting the stock price of CVS Caremark was the release of the third
quarter result on November 6, 2012. According to the management of CVS Caremark the net
revenues increased by 13.3% and reached a record level of $30.2 billion. The increase in sales is
the result of a 22.2% increase in the pharmacy services and a moderate increase of 5.5% in the
retail pharmacy segment. As explained by the company, the revenue growth mostly results from
the growth in the Medicare Part D program, drug cost inflation, and the gain of new clients in
the retail pharmacy segment.
Further, the Management of CVS Caremark adjusted the guidance for the 2012 EPS to $3.38 to
$3.41 (former guidance was $3.32 to $3.38) due to the strong third-quarter performance, the ben-
efits from the share repurchase program announced on September 19, and the optimism about
keeping more than 60% of the prescriptions gained during the impasse between its two competi-
tors Walgreen and Express Scripts pharmacy. The stock market reacted slightly positively to
these news, shares rose by 25 cents and closed at $46.88 on November 6, 2012 (CVS Caremark
Corp. (2012d), and Johnson (2012)).
Figure 4 depicts a timeline with the events that affected CVS Caremark during the last 12
months. Most of the developments are related to the announcement of the company’s EPS guid-
ance for the fiscal year 2012 and there were no exceptional events that had a big influence on the
stock price. The continuing increase of the EPS guidance compared to the end of 2011 until the
last earnings report is a positive development and a good indicator for the estimated revenue
growth assumed in the pro forma income statement later in this report.
11.8%
26.3%
30.9%
31.0%
Major Players (Market share)
Rite Aid Corporation
CVS Caremark
Walgreen Company
Other
Figure 3: Major players in retail drug industry in the US
(IBISWorld Inc. (2012)

CVS Caremark Corporation - Stock Report Juliette Buob
Student Investment Management Autumn 2012 Page 7/20
Dec 20, 2011
CVS Caremark
announced 2012
Guidance for
diluted EPS of
$3.15 to $3.25.
Analysts are
expecting $3.21.
Jan 12, 2012
Agreement to pay $5m
charges for inaccurate
pricing of some drugs for
elderly and disabled
Feb 8, 2012
EPS Guidance
for first quarter:
$0.61 to $0.63.
Analysts are
expecting $0.61.
May 2, 2012
Increase of 2012
EPS Guidance:
$3.23 to $3.33.
Analysts are
expecting $3.27.
Jun 12, 2012
CVS Caremark
announced that
it expects to add
$12.6b in net
revenues with
98% retention
rate.
Aug 7, 2012
Increase of 2012
EPS Guidance:
$3.32 to $3.38.
Analysts are
expecting $3.33.
Sep 19, 2012
Announcement of
$6.0b share repur-
chase program
authorization and
approval of
$0.1625 quarterly
dividend
Nov 6, 2012
Increase of 2012
EPS Guidance:
$3.38 to $3.41.
Analysts are
expecting $3.37.
Jan 10, 2012
Reaffirmation of
2012 Guidance
for diluted EPS of
$3.15 to $3.25.
Analysts are
expecting $3.24.
Figure 4: CVS Caremark stock timeline for past 12 months (Yahoo! Finance (2012b), and CVS Caremark Corp. (2012d)).
Investment Thesis
The aim of this paragraph is to provide a brief overview about the investment analysis and the
calculation of the target prices for the CVS Caremark stock. Before taking a briefer look at the
discounted cash flow model and the valuation outcome, the following paragraphs first consider
the relative price movements over the last years, the fundamental and economic drivers behind
the stock performance, the forecasting of the income statement for the next three years and the
underlying assumptions of the overall process.
Relative Stock Performance
CVS Caremark is part of the consumer staples sector which typically moves non-cyclical within
the overall market. The demand for staples goods such as pharmaceutical drugs, groceries, and
healthcare products, which are part of CVS Caremark product range, is generally independent
of the state of the economy and a good buffer during economic downturns or recessions. If we
consider the performance of the CVS Caremark stock relative to the S&P 500, the consumer sta-
ples sector and the retail drugs industry over the last 10 years, we see that the stock continuous-
ly outperformed the market. On the other hand, the price does not move completely inversely to

CVS Caremark Corporation - Stock Report Juliette Buob
Student Investment Management Autumn 2012 Page 8/20
the market as expected by most of the staple companies (see figure 5). This observation is sup-
ported by the fact that Yahoo! Finance provides a beta of 0.87.
If we execute a regression analysis between the stock and the S&P 500 with a time horizon of
one year, the analysis shows that CVS Caremark is positively correlated with the market. The
price movement of the S&P 500 explains, according to the adjusted R Square, 73.05% of the vari-
ation in CVS Caremark’s stock price over the last year. However, the beta received by the re-
gression is with 1.1375 slightly higher than the beta provided by Finance! Yahoo. To conclude, it
is difficult to say whether the CVS Caremark stock acts as a typical counter-cyclical company or
moves in line with the market, but the stock price outperformed the market in every state of the
economy over the last 10 years and therefore provided a good and constant performance for its
investors.
Key Fundamental and Economic Drivers
The performance of CVS Caremark depends on several key drivers and industry trends that
affect the future growth opportunities. The following paragraphs give a brief overview about
the most important drivers behind prospective performance. Keep in mind that the list is not
exhaustive and that other factors can affect the company’s performance as well.
Healthcare Reform
An important driver among the industry is the number of people with health insurance, which
is one of the factors whether people can afford the pharmaceuticals or not. The upcoming
healthcare reform in the United States, starting in 2014, will lead to an increase in revenue vol-
ume for the overall retail drugs industry as an estimated amount of 32 million Americans will
gain insurance coverage for prescription drugs (IBISWorld Inc. (2012)). Therefore, the change in
healthcare regulation positively affects the future growth opportunities of CVS Caremark (CVS
Caremark (2012f)).
Influence of Brand-Drugs and “Patent Cliff”
The introduction of new released brand-name drugs of pharmaceutical manufactures is ex-
pected to decrease, which will result in an adverse affection of CVS Caremark’s revenue growth.
-50%
0%
50%
100%
150%
200%
250%
2002 2003 2004 2005 2006 2007 2008 2009 2010 2011 2012
Sh
are
Pri
ce
Year
CVS Caremark Stock Performance over the last 10 years
CVS SPX CVS.S CVS.I
SUMMARY OUTPUT
Regression Statistics
Multiple R 0.8553
R Square 0.7315
Adjusted R Square 0.7305
Standard Error 3.6634
Observations 264
Coefficients
Intercept 5.0404
Beta CVS Caremark 1.1375
Figure 5: CVS Caremark stock performance and regression output (data based on Thomson Baseline, 11/18/2012).

CVS Caremark Corporation - Stock Report Juliette Buob
Student Investment Management Autumn 2012 Page 9/20
On the other side, the upcoming “patent cliff”, which means the expiration of number of patents
through 2013, will lead to the replacement of various brand-name drugs by generic versions.
This process will likely decline the average pharmacy prices but also will allow higher gross
profit margins for the retail drugstores and therefore positively affect industry’s future growth
opportunities (IBISWorld Inc. (2012)), Murphy (2012), and Zanoni (2011)).
Shortage of primary care physicians
The number of primary care physicians in the United States is expected to decrease over the fol-
lowing years and will result in a shortfall of a least 45,000 by 2020. This shortage will positively
affect the demand and therefore the revenue of in-store clinic provider like CVS Caremark offers
throughout its retail pharmacy services, as well as through its MinuteClinic (IBISWorld Inc.
(2012), and CVS Caremark Corp. (2012b)).
Consumer Spending
Another driver for future growth opportunities within the drugstore industry is the amount of
consumers’ disposable income per capita. The per capita income determines the ability of a con-
sumer to purchase consumer goods. As we mentioned before, the demand for prescription
products is not very susceptible to changes in consumer expenditures because they can be nec-
essary for health concerns. However, the demand of nonessential goods, such as cosmetics, can
vary a lot with changes in the per capita disposable income (IBISWorld Inc. (2012)). Figure 6
shows the positive correlation between the consumer spending, as well as the correlation be-
tween the disposable income and the CVS Caremark stock performance. Both variables have a
highly positive correlation of more than 0.90 with the price chart of the share.
Demographics
Another factor that increases the demand for pharmaceuticals is the aging population in the
United States. The so called “aging baby-boomers” and the fact that life expectancy is raising
will positively affect the sales volume in the industry as the need for healthcare will increase.
The reason for this need is due to the fact that this age group shows an increased risk of diseases
(IBISWorld Inc. (2012), and Wikinvest (2012)). Figure 7 provides an overview about the expected
demographics of the population in 2025 and 2050. Especially in more developed regions, like the
United States, the percentage of the people aged over 60 will be more than one third of the
population which means increased demand for healthcare products.
Figure 6: Correlation between consumer spending or disposable income and CVS Caremark (data from Thomson
Baseline, 11/18/2012)

CVS Caremark Corporation - Stock Report Juliette Buob
Student Investment Management Autumn 2012 Page 10/20
Government activities
Even though the revenue of prescrip-
tion drugs is positively affected by the
above mentioned drivers, such as the
expected increase in insured people
due to the healthcare reform, it is ex-
pected that the government will also
initiate cost cutting measures to re-
duce the overall healthcare costs. Such
activities could adversely affect the
profit margin across the industry
(IBISWorld Inc. (2012)).
Financials
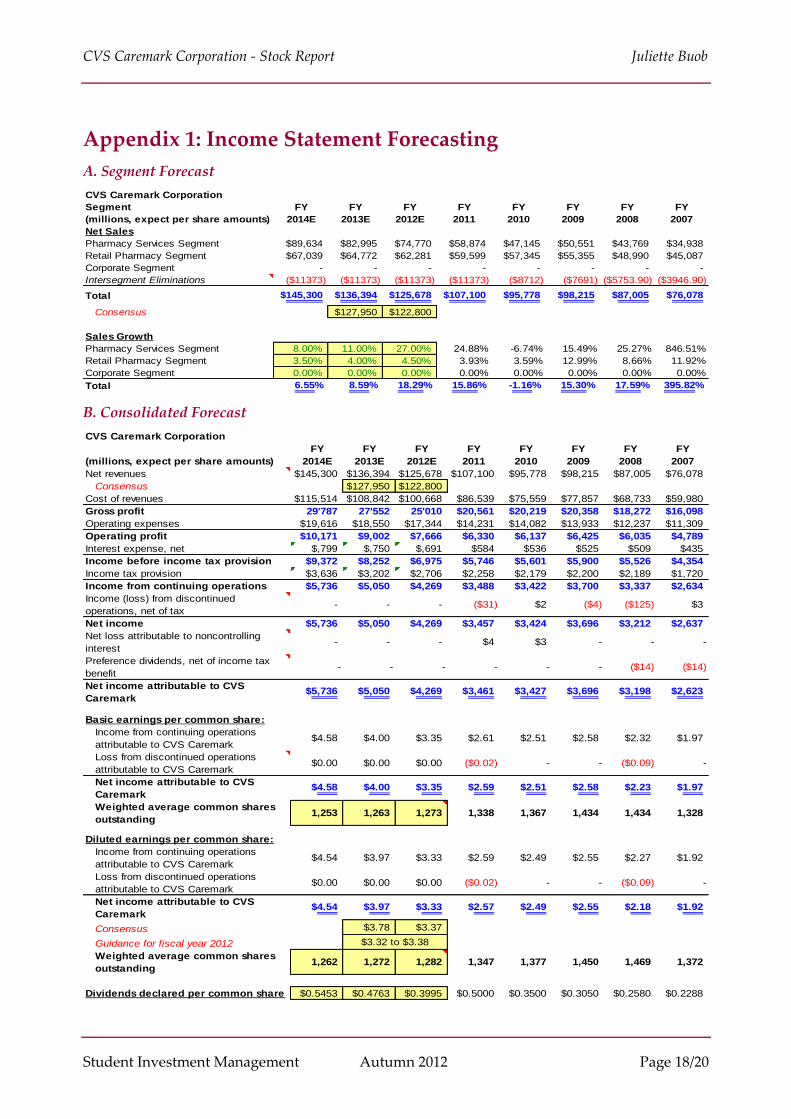
A copy of the total pro forma income statement for segment data as well as the consolidated
income statement can be found in appendix 1 on page 18. The resulting numbers are based on
the following assumptions:
Revenue
Historically, CVS Caremark used to have strong positive growth rates for its revenue over the
past five years except for the fiscal year 2010. Even in the critical years of the financial crisis of
2008/2009, the growth rates were still positive, which is another indicator that CVS Caremark’s
products are not that highly correlated with consumer’s disposable income as other consumer
goods are.
Forecasting the income statement for the following three fiscal years, the assumed growth rates
for the consolidated revenue are 18.29% for FY2012, 8.59% for FY2013, and 6.55% for FY2014.
The large growth rate for 2012 is based on the assumption that the revenue in the pharmacy
segment is supposed to increase with a rate of 27% and the revenue of the retail pharmacy seg-
ment with a moderate rate of 4.5%. The immense growth in pharmacy services results from sev-
eral changes in business, including the increase in the mail choice claims due to significant num-
ber of new clients, drug cost inflation in specialty business, increase in generic dispensing rate
because of new generic prescription drug instructions, increase in pharmacy network claim due
to new clients and higher activity with Medicare Part D program, and new activities resulting
from the acquisition of UAM Medicare PDP. Considering the third quarter results of November
6, 2012, the published net revenue numbers for the pharmacy service segment underline the
growth rate of 27%, as the third quarter net revenue increased by 27.4% compared to the prior
year period. On the other side, the assumption for the retail pharmacy segment is positive as
well but in a more moderate dimension that the one of the first segment. The revenue increase of
4.5% is based on several business drivers, including the increase in front store and pharmacy
store sales, significant increase due to the win of new clients resulting of the contractual impasse
between Walgreen Company and Express Scripts Holding, and positive affection due to the ma-
jor industry trends. These favorable industry trends include primarily an aging American popu-
lation which results in a greater consumption of prescription drugs and the increased use of
pharmaceuticals for individual healthcare as a first line of defense. However, the net revenue in
8 9 11
15
22
12 15
21
27
33
6 6 8
13
20
0
5
10
15
20
25
30
35
40
1950 1975 2009 2025 2050P
erc
en
tag
e
Proportion of population aged 60 or over, 1950-2050
World
More developed regions
Less developed regions
Figure 7: Expected demographics 1950-2050 (United Nations (2009)).

CVS Caremark Corporation - Stock Report Juliette Buob
Student Investment Management Autumn 2012 Page 11/20
the retail pharmacy segments is adversely affected by the negative impact of the replacement of
brand name drugs by equivalent generic drugs (which have a lower selling price), the reduced
amount of new brand name drug releases, and higher consumer co-insurance arrangements and
co-payments. Again, taking into consideration the third quarter results, the assumption of a
4.5% growth rate is a bit more conservative but almost in line with the 5.5% increase compared
to its prior year revenue (CVS Caremark Corp. (2012c)). A revenue growth rate of 18.29% is not
sustainable over several years, even if the company can benefit from the mentioned industry
trends and revenue growth drivers. Because of this, the forecasted income statement uses lower
growth rates for 2013 and 2014 but still in a positive range.
Cost of Revenues and Operating Expenses
Considering the cost of revenues in percentage of the net revenue, the costs were in a range of
78.84%-80.80% over the past five years. Therefore, the spread between the historical percentages
was only 1.96%. The assumed numbers for the forecasted three years slightly decrease due to the
fact that they were quite high in 2011 compared to the previous four years. However, they still
stay higher than in 2010 due to higher revenue expectations and investment opportunities to
support future growth.
The same thoughts apply for the forecasting of the operating expenses in percentage of the net
revenue. To include a more conservative view regarding the expenses, the ratio is slightly higher
in 2012 compared to 2011 and decreases in 2013 and 2014. The reason for these thoughts is the
higher percentages for the years 2008-2010. However, the increase in the operating expenses
mainly results of higher costs associated with the Medicare Part D business, whereas the per-
centage is positively affected by the high revenue growth rate (CVS Caremark Corp. (2012c)).
Interest Expense and Income Tax Provision
The rate of interests in percentage of the revenue moved in a range between 0.53%-0.59% and
result in an average of 0.56% over the past five years. The forecasted percentages amounts with
0.55% to a lower level than its historical average due to the general low interest rate level in the
current economy and therefore lower average borrowing costs. On the other side, the lower per-
centage is also positively affected by the assumed future revenue growth.
Income Tax Provisions were lower in the second quarter results compared to the past five years.
Therefore, the applied rate for the forecast of the income statement amounted to 38.80%, which
is slightly less than its five year historical average. However, the uncertainty about the “fiscal
cliff” leads to an increase in uncertain tax positions and the tax rate for the third quarter was
with 39.2% slightly higher as assumed in the financial statement (CVS Caremark Corp. (2012c)).
Average Outstanding of Common Shares
The amount of outstanding shares in the forecasted income statement will decrease due to the
authorization of two share repurchase program in 2011 and in 2012. The latest authorization in
September 2012, include a repurchase for up to $6.0 billion of outstanding shares. Further, the
company entered into a share repurchase agreement with Barclays with a value of $1.2 billion on
September 19, 2012. These assumptions lead to a diluted EPS of $3.33 for 2012, $3.97 for 2013,
and $4.54 for 2014. The expected EPS of $3.33 is slightly below the consensus value of $3.40 and
lower than the company’s guidance of $3.38-3.41 (Yahoo! Finance (2012c)). These differences

CVS Caremark Corporation - Stock Report Juliette Buob
Student Investment Management Autumn 2012 Page 12/20
results from a more conservative approach regarding future cost savings and future growth op-
portunities. For 2013 the estimated EPS of $3.97 is slightly higher than the consensus of $3.82
(Yahoo! Finance (2012c)).
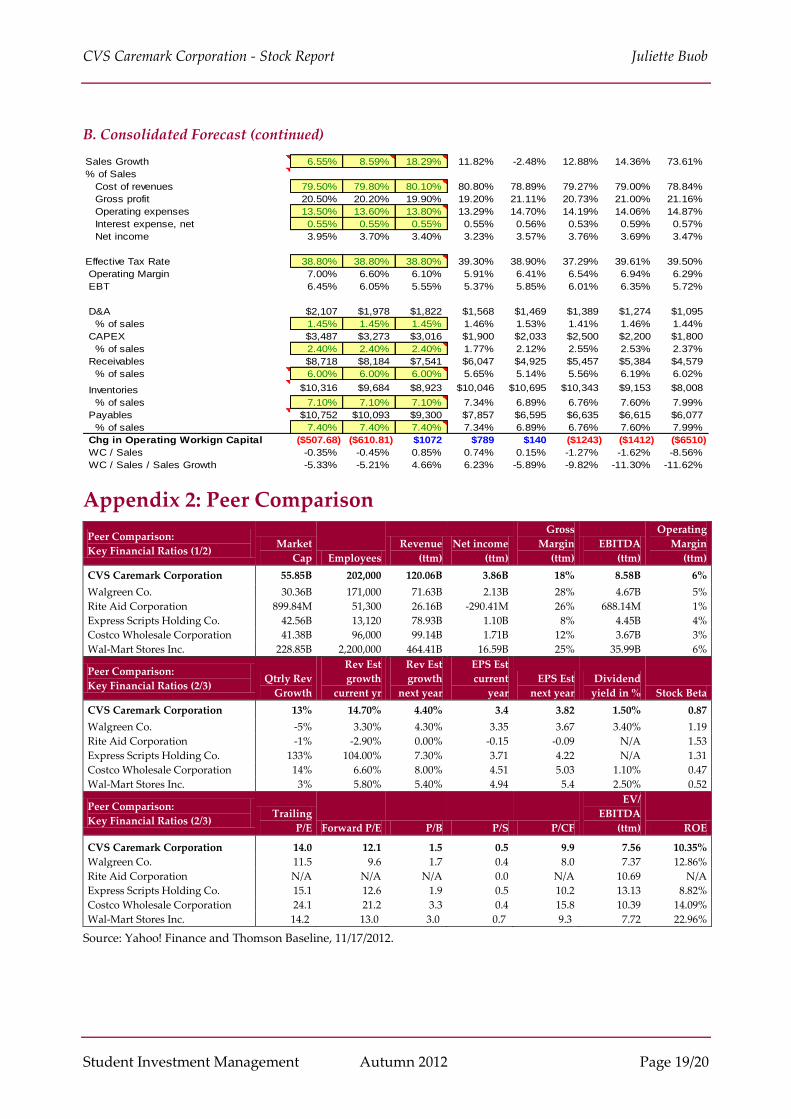
Peer Comparison
A detailed comparison of various key financial ratios including margins, growth rates, and mul-
tiples can be found in appendix 2 on page 19. The company that resembles CVS Caremark the
most in terms of size is Walgreen Company, especially in the number of employees, revenue and
market capitalization even though the numbers are smaller than the ones of CVS Caremark. The
other competitors have more or less lower ratios, except for Wal-Mart Incorporation. Comparing
the quarterly and the future expected revenue growth rates, CVS Caremark has one of the best
future growth opportunities among its competitors, whereas the EPS consensus is ranked in the
average range. Finally, considering the valuation ratios, CVS Caremark has slightly higher mul-
tiples than Walgreen Company, expect the P/B and ROE ratio. Compared to the other competi-
tors, the ROE ratio has a slightly lower value with exception of Express Scripts Holding Compa-
ny.
Valuation Analysis and Price Target
The following two subchapters use two different approaches, namely the DCF model and a mul-
tiples analysis, to estimate the target price for the CVS Caremark stock. We should be aware that
both approaches are based on various assumptions and depend on current economic circum-
stances.
Discounted Cash Flow Model
The detailed discounted cash flow analysis for CVS Caremark can be found in appendix 3 on
page 20. The model provided an estimated value per share of $57.93 and indicates that CVS
Caremark is currently traded at a discount relative to its implied intrinsic value with upside po-
tential of 29.3% over the closing price on November 16, 2012. The underlying calculations of a
DCF analysis are extremely sensitive to changes in the assumptions, especially in variations of
the cash flow’s growth and the discount rate. According to this sensitivity, the following para-
graphs provide an overview about these two factors used in the model.
The terminal growth rate of 3% is only slightly lower than the assumed 4% growth rate of the
overall market. As CVS Caremark is part of the consumer staples sector and therefore a defen-
sive stock, the revenue will grow steadily and constant but slower than the market. The positive
long-term growth rate results from the industry trends discussed in the subchapter “Key Funda-
mental and Economic Drivers”. On the other side, the possibility of these growth opportunities
will likely increase the competition and saturation of the US market will lead to a lower growth
rate in perpetuity.
As part of the consumer staples sector, CVS Caremark inhibits relatively modest risk compared
to the overall market. This phenomenon is also reflected in the low beta of 0.87. According to
this, the terminal discount rate used in the model is 9.30% which is 70 basis points below the
overall market discount rate. Besides the terminal growth and discount rate, the model is based
on cost in percentage of the revenue of 79%, a final operating margin of 6.3%, constant interest of
0.55%, and a constant tax rate of 38.8%.

CVS Caremark Corporation - Stock Report Juliette Buob
Student Investment Management Autumn 2012 Page 13/20
As mentioned before, the estimated growth and the discount rate have a huge impact on the
intrinsic value implied by the DCF model. The sensitivity analysis presented in figure 8 shows
how sensible the implied share price reacts to changes in these two variables and which influ-
ences this has on the upside potential over the current stock price. If we limit the terminal
growth rate to a reasonable range between 1.5% in the worst case and 3.5% in the best case, as
well a range for the discount rate between 8.5% and 9.5%, the implied value ranges from $51.46-
$71.21. This is equivalent to a spread of $19.75. These wide spread is also visible if we consider
the upside potential over the stock price of $44.80. The span of the upside potential ranges from
10.72%-58.96%, which means a spread of more than 48.24%.
Growth Rate
Terminal
Discount Rate
1.0% 1.5% 2.0% 2.5% 3.0% 3.5% 4.0%
6.5% $77.04 $82.26 $88.64 $96.62 $106.87 $120.55 $139.69
7.0% $70.14 $74.31 $79.32 $85.43 $93.08 $102.91 $116.02
7.5% $64.31 $67.70 $71.70 $76.50 $82.36 $89.69 $99.12
8.0% $59.33 $62.11 $65.36 $69.19 $73.80 $79.42 $86.46
8.5% $55.02 $57.34 $60.00 $63.12 $66.80 $71.21 $76.61
9.0% $51.26 $53.21 $55.42 $57.99 $60.97 $64.50 $68.74
9.5% $47.96 $49.60 $51.46 $53.59 $56.05 $58.92 $62.31
10.0% $45.02 $46.43 $48.01 $49.79 $51.84 $54.20 $56.95
Growth Rate
Terminal
Discount Rate
1.0% 1.5% 2.0% 2.5% 3.0% 3.5% 4.0%
6.5% 71.96% 83.62% 97.86% 115.67% 138.55% 169.08% 211.81%
7.0% 56.56% 65.87% 77.04% 90.70% 107.77% 129.71% 158.97%
7.5% 43.55% 51.11% 60.04% 70.75% 83.84% 100.21% 121.25%
8.0% 32.43% 38.64% 45.89% 54.45% 64.73% 77.28% 92.98%
8.5% 22.82% 27.98% 33.94% 40.89% 49.10% 58.96% 71.01%
9.0% 14.43% 18.76% 23.72% 29.43% 36.10% 43.98% 53.44%
9.5% 7.05% 10.72% 14.87% 19.63% 25.11% 31.51% 39.08%
10.0% 0.50% 3.63% 7.15% 11.15% 15.71% 20.97% 27.12%
Multiples Evaluation1
The aim of a multiple analysis is to show whether the stock price of CVS Caremark is underval-
ued, fairly valued, or overvalued relative to the S&P 500, the consumer staples sector, or the re-
tail drug industry. The data is based on a 10 year historical average and is extracted from Thom-
son Baseline.
CVS Caremark Valuation relative to the S&P 500
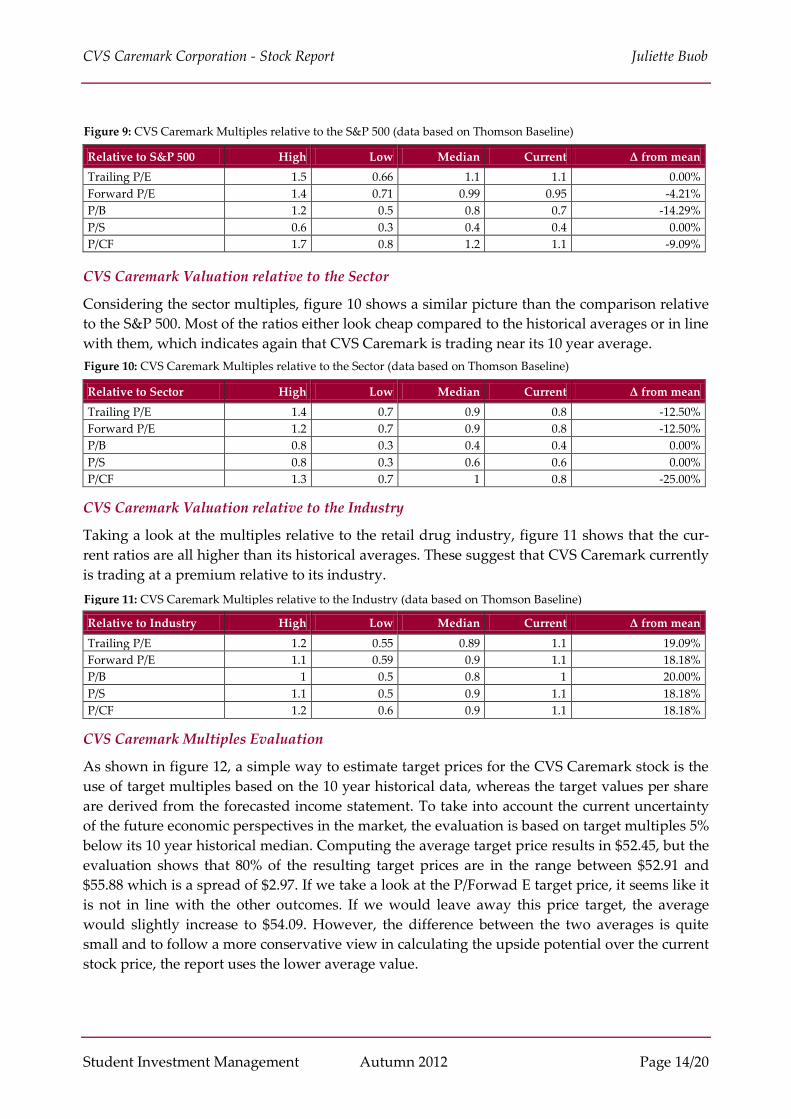
As shown in figure 9, most of the ratios indicate that CVS Caremark is trading near to its 10 year
average of S&P 500 multiples or is slightly undervalued compared to its historical average. The
undervaluation could be a result of the 10 year horizon, as it includes a period of time where the
premium for certainty was extremely high.
1 Based on data of November 16, 2012.
Figure 8: DCF sensitivity analysis of target price and resulting upside potential due to changes in the growth and
discount rate
CVS Caremark Corporation - Stock Report Juliette Buob
Student Investment Management Autumn 2012 Page 14/20
Relative to S&P 500 High Low Median Current Δ from mean
Trailing P/E 1.5 0.66 1.1 1.1 0.00%
Forward P/E 1.4 0.71 0.99 0.95 -4.21%
P/B 1.2 0.5 0.8 0.7 -14.29%
P/S 0.6 0.3 0.4 0.4 0.00%
P/CF 1.7 0.8 1.2 1.1 -9.09%
CVS Caremark Valuation relative to the Sector
Considering the sector multiples, figure 10 shows a similar picture than the comparison relative
to the S&P 500. Most of the ratios either look cheap compared to the historical averages or in line
with them, which indicates again that CVS Caremark is trading near its 10 year average.
Relative to Sector High Low Median Current Δ from mean
Trailing P/E 1.4 0.7 0.9 0.8 -12.50%
Forward P/E 1.2 0.7 0.9 0.8 -12.50%
P/B 0.8 0.3 0.4 0.4 0.00%
P/S 0.8 0.3 0.6 0.6 0.00%
P/CF 1.3 0.7 1 0.8 -25.00%
CVS Caremark Valuation relative to the Industry
Taking a look at the multiples relative to the retail drug industry, figure 11 shows that the cur-
rent ratios are all higher than its historical averages. These suggest that CVS Caremark currently
is trading at a premium relative to its industry.
Relative to Industry High Low Median Current Δ from mean
Trailing P/E 1.2 0.55 0.89 1.1 19.09%
Forward P/E 1.1 0.59 0.9 1.1 18.18%
P/B 1 0.5 0.8 1 20.00%
P/S 1.1 0.5 0.9 1.1 18.18%
P/CF 1.2 0.6 0.9 1.1 18.18%
CVS Caremark Multiples Evaluation
As shown in figure 12, a simple way to estimate target prices for the CVS Caremark stock is the
use of target multiples based on the 10 year historical data, whereas the target values per share
are derived from the forecasted income statement. To take into account the current uncertainty
of the future economic perspectives in the market, the evaluation is based on target multiples 5%
below its 10 year historical median. Computing the average target price results in $52.45, but the
evaluation shows that 80% of the resulting target prices are in the range between $52.91 and
$55.88 which is a spread of $2.97. If we take a look at the P/Forwad E target price, it seems like it
is not in line with the other outcomes. If we would leave away this price target, the average
would slightly increase to $54.09. However, the difference between the two averages is quite
small and to follow a more conservative view in calculating the upside potential over the current
stock price, the report uses the lower average value.
Figure 9: CVS Caremark Multiples relative to the S&P 500 (data based on Thomson Baseline)
Figure 10: CVS Caremark Multiples relative to the Sector (data based on Thomson Baseline)
Figure 11: CVS Caremark Multiples relative to the Industry (data based on Thomson Baseline)

CVS Caremark Corporation - Stock Report Juliette Buob
Student Investment Management Autumn 2012 Page 15/20
Absolute Valu-
ation (10year) High Low Median Current
Target
Multiple
Target E, S,
B, etc/Share Target Price
P/Forward E 22.0 9.6 14.5 12.1 13.775 $3.33 $45.87
P/S 0.8 0.4 0.6 0.5 0.57 $98.03 $55.88
P/B 3.7 1.0 1.9 1.5 1.805 $29.57 $53.37
P/EBITDA 12.63 4.88 7.71 6.45 7.3245 $7.4 $54.20
P/CF 18.3 7.5 11.9 9.9 11.305 $4.68 $52.91
Average of Target Prices $52.45
Average of Target Prices (excluding P/Forward E) $54.09
Upside/Downside Potential over Current Stock Price ($44.80) +9.83%
Risks
There are several risks in this stock report. The pro forma income statement and the DCF model
are based on various assumptions about future growth opportunities of CVS Caremark. Howev-
er, these opportunities might turn out to be wrong or not fully reachable. The company faces
several uncertain challenges that can have an impact on the company in the future, e.g.:
- Challenges of the current healthcare landscape, which includes the trend of increasing overall
healthcare costs due to the aging population. Based on this, the focus on low cost solutions,
such as preventive care and prescription drugs, plays an important factor within the future
environment (CVS Caremark Corp (2012a)).
- Uncertainty about future new brand-name drugs and as well the “patent-cliff”, which results
in the exchange of brand-name drugs by similar generic products, can lead to uncertainty in
future cash flows (CVS Caremark Corp. (2012a)).
- Increase in the competitive landscape within the retail drug sector can lead to future consoli-
dations among competitors. The expected consolidation process leads to uncertainty about
future circumstances of CVS Caremark and its position in the market. Also changes in the
market presents a risk to the assumptions, as we do not know how the business will change
in the future, especially if the demand for prescription drugs shifts from drugstores to mass
merchandisers or even to online retailers (IBISWorld Inc. (2012)).
Conclusion
In order to come up with a final target price for the CVS Caremark stock, we will combine the
two target prices of the DCF analysis and the multiples valuation. To do so, the two target prices
will be weighted with a ratio of 60:40 which results in a final target price of $55.74 and an upside
potential of 24.42% compared to the closing price of November 16, 2012. The reason for the
heavier weight of the DCF value is that it is believed to be the most accurate value for the com-
pany. Even if considered a more conservative view and weighted both valuation methods equal-
ly, we would still receive a target price of $55.19. According to this great upside potential, CVS
Caremark has been given a BUY recommendation. An overview about the final target price cal-
culation can be found in figure 13.
As the underlying assumptions of the DCF model are chosen on the conservative side of the
possible range, the price of $55.74 represents a conservative suggestion as well. As we have seen
Figure 12: CVS Caremark multiples evaluation and target price (data based on Thomson Baseline)

CVS Caremark Corporation - Stock Report Juliette Buob
Student Investment Management Autumn 2012 Page 16/20
Calculation of Final Target Price
for CVS Caremark Corporation Price Upside/Downside Potential Weight
Current Price $44.80
DCF Target Price $57.93 +29.31% 60%
Multiple Valuation Target Price $52.45 +9.83% 40%
Weighted Final Target Price $55.74 +24.42% 100%
in the sensitivity analysis of the DCF model, the calculations are highly sensitive to changes in
the discount rate and the terminal growth rate. On the other side, we should also consider the
sensitivity of the multiples valuation, as the median changes if we choose different time hori-
zons. With the decision to choose target multiples that were below the historical median, the
target price of this model is chosen more conservative as well. However, even a conservative
view of the future growth opportunities suggests that the CVS Caremark share is a great BUY
opportunity with high upside potential of 24.42%. Besides the quantitative upside potential, the
stock includes other advantages that make it a good BUY, such as:
- CVS Caremark is a strong company within the US market and operates a long-lasting
product and retail range across the country with future growth opportunities due to key
industry trends (e.g. aging population, patent-cliff, healthcare reform, etc.).
- The fact that the company is part of the non-cyclical consumer staples companies makes
it a less risky investment compared to other companies within the market. Especially in
these times where there are major uncertainties in the economy, the stock provides the
opportunity to diversify the overall risk in the portfolio.
- CVS Caremark provided strong positive revenue growth for the last quarter’s earnings
announcement, as well as for the past years the stock outperformed the market constant-
ly.
Taking into account the current dividend yield of 1.5%, CVS Caremark is supposed to provide a
projected return of 25.92%.
Figure 13: Calculation of CVS Caremark’s final target price and upside potential

CVS Caremark Corporation - Stock Report Juliette Buob
Student Investment Management Autumn 2012 Page 17/20
References
CVS Caremark Corporation (Corp.), 2012a, CVS Caremark 2011 Annual Report from website,
http://media.corporate-ir.net/media_files/IROL/99/99533/CVSCaremark2011_AR.pdf,
11/14/2012.
CVS Caremark Corporation (Corp.), 2012b, 2011 Corporate Responsibility Report - Helping
people on their path to better health from website,
http://info.cvscaremark.com/sites/cvscaremark.com/files/2011_CVS_Caremark_CSR-
Report_Secured.pdf, 11/14/2012.
CVS Caremark Corporation (Corp.), 2012c, Form 10-Q for the Quarterly Period Ended Septem-
ber 30, 2012 from website, http://services.corporate-
ir.net/SEC.Enhanced/SecCapsule.aspx?c=99533&fid=8446842, 11/11/2012.
CVS Caremark Corporation (Corp.), 2012d, Press Releases from website, http://phx.corporate-
ir.net/phoenix.zhtml?c=99533&p=irol-news, 11/14/2012.
CVS Caremark Corporation (Corp.), 2012e, Form 10-K for the fiscal year ended December 31,
2011 from website, http://services.corporate-
ir.net/SEC.Enhanced/SecCapsule.aspx?c=99533&fid=8016313, 11/10/2012.
CVS Caremark, 2012f, Connected from website, http://www.cvscaremarkfyi.com/blogs/cvs-
caremark-2012-insights-report-reviews-pbm-trends, 11/18/2012.
IBISWorld Incorporation (Inc.), 2012, IBISWorld Industry Report 44611 Pharmacies & Drug
Stores in the US from website,
http://clients1.ibisworld.com/reports/us/industry/default.aspx?entid=1054, 11/12/2012.
Johnson, Linda A., 2012, CVS Caremark 3Q profit up 16 pct. as sales rise from website,
http://finance.yahoo.com/news/cvs-caremark-3q-profit-16-123246513.html, 11/14/2012.
Murphy, Tom, 2012, CVS Caremark profit jumps 18 pct; boosts outlook from website,
http://finance.yahoo.com/news/cvs-caremark-profit-jumps-18-pct-boosts-outlook-
125317628--finance.html, 09/02/2012.
United Nations, 2009, World Population Ageing 2009 from website,
http://www.un.org/esa/population/publications/WPA2009/WPA2009_WorkingPaper.pdf,
11/18/2012.
Wikinvest, 2012, CVS Caremark Corporation (CVS) from website,
http://www.wikinvest.com/wiki/CVS_Caremark_corporation, 09/02/2012.
Yahoo! Finance, 2012a, CVS Caremark Corporation (CVS) - Competitors from website,
http://www.wikinvest.com/wiki/CVS_Caremark_corporation, 11/17/2012..
Yahoo! Finance, 2012b, CVS Caremark Corporation (CVS) - Interactive Chart from website,
http://finance.yahoo.com/echarts?s=CVS+Interactive#symbol=cvs;range=1y;compare=;indica
tor=ke_sd+volume;charttype=line;crosshair=on;ohlcvalues=0;logscale=off;source=undefined,
11/14/2012.
Yahoo! Finance, 2012c, CVS Caremark Corporation (CVS) – Analyst estimates from website
http://finance.yahoo.com/q/ae?s=CVS+Analyst+Estimates, 11/17/2012.
Zanoni, David, 2011, CVS Caremark, Walgreen To Benefit From Expiring Patents from website,
http://seekingalpha.com/article/303465-cvs-caremark-walgreen-to-benefit-from-expiring-
patents, 09/02/2012.
CVS Caremark Corporation - Stock Report Juliette Buob
Student Investment Management Autumn 2012 Page 18/20
Appendix 1: Income Statement Forecasting
A. Segment Forecast
B. Consolidated Forecast
CVS Caremark Corporation
Segment FY FY FY FY FY FY FY FY
(millions, expect per share amounts) 2014E 2013E 2012E 2011 2010 2009 2008 2007
Net Sales
Pharmacy Services Segment $89,634 $82,995 $74,770 $58,874 $47,145 $50,551 $43,769 $34,938
Retail Pharmacy Segment $67,039 $64,772 $62,281 $59,599 $57,345 $55,355 $48,990 $45,087
Corporate Segment - - - - - - - -
Intersegment Eliminations ($11373) ($11373) ($11373) ($11373) ($8712) ($7691) ($5753.90) ($3946.90)
Total $145,300 $136,394 $125,678 $107,100 $95,778 $98,215 $87,005 $76,078
Consensus $127,950 $122,800
Sales Growth
Pharmacy Services Segment 8.00% 11.00% 27.00% 24.88% -6.74% 15.49% 25.27% 846.51%
Retail Pharmacy Segment 3.50% 4.00% 4.50% 3.93% 3.59% 12.99% 8.66% 11.92%
Corporate Segment 0.00% 0.00% 0.00% 0.00% 0.00% 0.00% 0.00% 0.00%
Total 6.55% 8.59% 18.29% 15.86% -1.16% 15.30% 17.59% 395.82%
CVS Caremark Corporation
FY FY FY FY FY FY FY FY
(millions, expect per share amounts) 2014E 2013E 2012E 2011 2010 2009 2008 2007
Net revenues $145,300 $136,394 $125,678 $107,100 $95,778 $98,215 $87,005 $76,078
Consensus $127,950 $122,800
Cost of revenues $115,514 $108,842 $100,668 $86,539 $75,559 $77,857 $68,733 $59,980
Gross profit 29'787 27'552 25'010 $20,561 $20,219 $20,358 $18,272 $16,098
Operating expenses $19,616 $18,550 $17,344 $14,231 $14,082 $13,933 $12,237 $11,309
Operating profit $10,171 $9,002 $7,666 $6,330 $6,137 $6,425 $6,035 $4,789
Interest expense, net $,799 $,750 $,691 $584 $536 $525 $509 $435
Income before income tax provision $9,372 $8,252 $6,975 $5,746 $5,601 $5,900 $5,526 $4,354
Income tax provision $3,636 $3,202 $2,706 $2,258 $2,179 $2,200 $2,189 $1,720
Income from continuing operations $5,736 $5,050 $4,269 $3,488 $3,422 $3,700 $3,337 $2,634
Income (loss) from discontinued
operations, net of tax- - - ($31) $2 ($4) ($125) $3
Net income $5,736 $5,050 $4,269 $3,457 $3,424 $3,696 $3,212 $2,637
Net loss attributable to noncontrolling
interest- - - $4 $3 - - -
Preference dividends, net of income tax
benefit- - - - - - ($14) ($14)
Net income attributable to CVS
Caremark$5,736 $5,050 $4,269 $3,461 $3,427 $3,696 $3,198 $2,623
Basic earnings per common share:
Income from continuing operations
attributable to CVS Caremark$4.58 $4.00 $3.35 $2.61 $2.51 $2.58 $2.32 $1.97
Loss from discontinued operations
attributable to CVS Caremark$0.00 $0.00 $0.00 ($0.02) - - ($0.09) -
Net income attributable to CVS
Caremark$4.58 $4.00 $3.35 $2.59 $2.51 $2.58 $2.23 $1.97
Weighted average common shares
outstanding1,253 1,263 1,273 1,338 1,367 1,434 1,434 1,328
Diluted earnings per common share:
Income from continuing operations
attributable to CVS Caremark$4.54 $3.97 $3.33 $2.59 $2.49 $2.55 $2.27 $1.92
Loss from discontinued operations
attributable to CVS Caremark$0.00 $0.00 $0.00 ($0.02) - - ($0.09) -
Net income attributable to CVS
Caremark$4.54 $3.97 $3.33 $2.57 $2.49 $2.55 $2.18 $1.92
Consensus $3.78 $3.37
Guidance for fiscal year 2012
Weighted average common shares
outstanding1,262 1,272 1,282 1,347 1,377 1,450 1,469 1,372
Dividends declared per common share $0.5453 $0.4763 $0.3995 $0.5000 $0.3500 $0.3050 $0.2580 $0.2288
Sales Growth 6.55% 8.59% 18.29% 11.82% -2.48% 12.88% 14.36% 73.61%
% of Sales
Cost of revenues 79.50% 79.80% 80.10% 80.80% 78.89% 79.27% 79.00% 78.84%
Gross profit 20.50% 20.20% 19.90% 19.20% 21.11% 20.73% 21.00% 21.16%
Operating expenses 13.50% 13.60% 13.80% 13.29% 14.70% 14.19% 14.06% 14.87%
Interest expense, net 0.55% 0.55% 0.55% 0.55% 0.56% 0.53% 0.59% 0.57%
Net income 3.95% 3.70% 3.40% 3.23% 3.57% 3.76% 3.69% 3.47%
Effective Tax Rate 38.80% 38.80% 38.80% 39.30% 38.90% 37.29% 39.61% 39.50%
Operating Margin 7.00% 6.60% 6.10% 5.91% 6.41% 6.54% 6.94% 6.29%
EBT 6.45% 6.05% 5.55% 5.37% 5.85% 6.01% 6.35% 5.72%
D&A $2,107 $1,978 $1,822 $1,568 $1,469 $1,389 $1,274 $1,095
% of sales 1.45% 1.45% 1.45% 1.46% 1.53% 1.41% 1.46% 1.44%
CAPEX $3,487 $3,273 $3,016 $1,900 $2,033 $2,500 $2,200 $1,800
% of sales 2.40% 2.40% 2.40% 1.77% 2.12% 2.55% 2.53% 2.37%
Receivables $8,718 $8,184 $7,541 $6,047 $4,925 $5,457 $5,384 $4,579
% of sales 6.00% 6.00% 6.00% 5.65% 5.14% 5.56% 6.19% 6.02%
Inventories $10,316 $9,684 $8,923 $10,046 $10,695 $10,343 $9,153 $8,008
% of sales 7.10% 7.10% 7.10% 7.34% 6.89% 6.76% 7.60% 7.99%
Payables $10,752 $10,093 $9,300 $7,857 $6,595 $6,635 $6,615 $6,077
% of sales 7.40% 7.40% 7.40% 7.34% 6.89% 6.76% 7.60% 7.99%
Chg in Operating Workign Capital ($507.68) ($610.81) $1072 $789 $140 ($1243) ($1412) ($6510)
WC / Sales -0.35% -0.45% 0.85% 0.74% 0.15% -1.27% -1.62% -8.56%
WC / Sales / Sales Growth -5.33% -5.21% 4.66% 6.23% -5.89% -9.82% -11.30% -11.62%
$3.32 to $3.38
CVS Caremark Corporation - Stock Report Juliette Buob
Student Investment Management Autumn 2012 Page 19/20
B. Consolidated Forecast (continued)
Appendix 2: Peer Comparison
Peer Comparison:
Key Financial Ratios (1/2) Market
Cap Employees
Revenue
(ttm)
Net income
(ttm)
Gross
Margin
(ttm)
EBITDA
(ttm)
Operating
Margin
(ttm)
CVS Caremark Corporation 55.85B 202,000 120.06B 3.86B 18% 8.58B 6%
Walgreen Co. 30.36B 171,000 71.63B 2.13B 28% 4.67B 5%
Rite Aid Corporation 899.84M 51,300 26.16B -290.41M 26% 688.14M 1%
Express Scripts Holding Co. 42.56B 13,120 78.93B 1.10B 8% 4.45B 4%
Costco Wholesale Corporation 41.38B 96,000 99.14B 1.71B 12% 3.67B 3%
Wal-Mart Stores Inc. 228.85B 2,200,000 464.41B 16.59B 25% 35.99B 6%
Peer Comparison:
Key Financial Ratios (2/3) Qtrly Rev
Growth
Rev Est
growth
current yr
Rev Est
growth
next year
EPS Est
current
year
EPS Est
next year
Dividend
yield in % Stock Beta
CVS Caremark Corporation 13% 14.70% 4.40% 3.4 3.82 1.50% 0.87
Walgreen Co. -5% 3.30% 4.30% 3.35 3.67 3.40% 1.19
Rite Aid Corporation -1% -2.90% 0.00% -0.15 -0.09 N/A 1.53
Express Scripts Holding Co. 133% 104.00% 7.30% 3.71 4.22 N/A 1.31
Costco Wholesale Corporation 14% 6.60% 8.00% 4.51 5.03 1.10% 0.47
Wal-Mart Stores Inc. 3% 5.80% 5.40% 4.94 5.4 2.50% 0.52
Peer Comparison:
Key Financial Ratios (2/3) Trailing
P/E Forward P/E P/B P/S P/CF
EV/
EBITDA
(ttm) ROE
CVS Caremark Corporation 14.0 12.1 1.5 0.5 9.9 7.56 10.35%
Walgreen Co. 11.5 9.6 1.7 0.4 8.0 7.37 12.86%
Rite Aid Corporation N/A N/A N/A 0.0 N/A 10.69 N/A
Express Scripts Holding Co. 15.1 12.6 1.9 0.5 10.2 13.13 8.82%
Costco Wholesale Corporation 24.1 21.2 3.3 0.4 15.8 10.39 14.09%
Wal-Mart Stores Inc. 14.2 13.0 3.0 0.7 9.3 7.72 22.96%
Source: Yahoo! Finance and Thomson Baseline, 11/17/2012.
CVS Caremark Corporation
FY FY FY FY FY FY FY FY
(millions, expect per share amounts) 2014E 2013E 2012E 2011 2010 2009 2008 2007
Net revenues $145,300 $136,394 $125,678 $107,100 $95,778 $98,215 $87,005 $76,078
Consensus $127,950 $122,800
Cost of revenues $115,514 $108,842 $100,668 $86,539 $75,559 $77,857 $68,733 $59,980
Gross profit 29'787 27'552 25'010 $20,561 $20,219 $20,358 $18,272 $16,098
Operating expenses $19,616 $18,550 $17,344 $14,231 $14,082 $13,933 $12,237 $11,309
Operating profit $10,171 $9,002 $7,666 $6,330 $6,137 $6,425 $6,035 $4,789
Interest expense, net $,799 $,750 $,691 $584 $536 $525 $509 $435
Income before income tax provision $9,372 $8,252 $6,975 $5,746 $5,601 $5,900 $5,526 $4,354
Income tax provision $3,636 $3,202 $2,706 $2,258 $2,179 $2,200 $2,189 $1,720
Income from continuing operations $5,736 $5,050 $4,269 $3,488 $3,422 $3,700 $3,337 $2,634
Income (loss) from discontinued
operations, net of tax- - - ($31) $2 ($4) ($125) $3
Net income $5,736 $5,050 $4,269 $3,457 $3,424 $3,696 $3,212 $2,637
Net loss attributable to noncontrolling
interest- - - $4 $3 - - -
Preference dividends, net of income tax
benefit- - - - - - ($14) ($14)
Net income attributable to CVS
Caremark$5,736 $5,050 $4,269 $3,461 $3,427 $3,696 $3,198 $2,623
Basic earnings per common share:
Income from continuing operations
attributable to CVS Caremark$4.58 $4.00 $3.35 $2.61 $2.51 $2.58 $2.32 $1.97
Loss from discontinued operations
attributable to CVS Caremark$0.00 $0.00 $0.00 ($0.02) - - ($0.09) -
Net income attributable to CVS
Caremark$4.58 $4.00 $3.35 $2.59 $2.51 $2.58 $2.23 $1.97
Weighted average common shares
outstanding1,253 1,263 1,273 1,338 1,367 1,434 1,434 1,328
Diluted earnings per common share:
Income from continuing operations
attributable to CVS Caremark$4.54 $3.97 $3.33 $2.59 $2.49 $2.55 $2.27 $1.92
Loss from discontinued operations
attributable to CVS Caremark$0.00 $0.00 $0.00 ($0.02) - - ($0.09) -
Net income attributable to CVS
Caremark$4.54 $3.97 $3.33 $2.57 $2.49 $2.55 $2.18 $1.92
Consensus $3.78 $3.37
Guidance for fiscal year 2012
Weighted average common shares
outstanding1,262 1,272 1,282 1,347 1,377 1,450 1,469 1,372
Dividends declared per common share $0.5453 $0.4763 $0.3995 $0.5000 $0.3500 $0.3050 $0.2580 $0.2288
Sales Growth 6.55% 8.59% 18.29% 11.82% -2.48% 12.88% 14.36% 73.61%
% of Sales
Cost of revenues 79.50% 79.80% 80.10% 80.80% 78.89% 79.27% 79.00% 78.84%
Gross profit 20.50% 20.20% 19.90% 19.20% 21.11% 20.73% 21.00% 21.16%
Operating expenses 13.50% 13.60% 13.80% 13.29% 14.70% 14.19% 14.06% 14.87%
Interest expense, net 0.55% 0.55% 0.55% 0.55% 0.56% 0.53% 0.59% 0.57%
Net income 3.95% 3.70% 3.40% 3.23% 3.57% 3.76% 3.69% 3.47%
Effective Tax Rate 38.80% 38.80% 38.80% 39.30% 38.90% 37.29% 39.61% 39.50%
Operating Margin 7.00% 6.60% 6.10% 5.91% 6.41% 6.54% 6.94% 6.29%
EBT 6.45% 6.05% 5.55% 5.37% 5.85% 6.01% 6.35% 5.72%
D&A $2,107 $1,978 $1,822 $1,568 $1,469 $1,389 $1,274 $1,095
% of sales 1.45% 1.45% 1.45% 1.46% 1.53% 1.41% 1.46% 1.44%
CAPEX $3,487 $3,273 $3,016 $1,900 $2,033 $2,500 $2,200 $1,800
% of sales 2.40% 2.40% 2.40% 1.77% 2.12% 2.55% 2.53% 2.37%
Receivables $8,718 $8,184 $7,541 $6,047 $4,925 $5,457 $5,384 $4,579
% of sales 6.00% 6.00% 6.00% 5.65% 5.14% 5.56% 6.19% 6.02%
Inventories $10,316 $9,684 $8,923 $10,046 $10,695 $10,343 $9,153 $8,008
% of sales 7.10% 7.10% 7.10% 7.34% 6.89% 6.76% 7.60% 7.99%
Payables $10,752 $10,093 $9,300 $7,857 $6,595 $6,635 $6,615 $6,077
% of sales 7.40% 7.40% 7.40% 7.34% 6.89% 6.76% 7.60% 7.99%
Chg in Operating Workign Capital ($507.68) ($610.81) $1072 $789 $140 ($1243) ($1412) ($6510)
WC / Sales -0.35% -0.45% 0.85% 0.74% 0.15% -1.27% -1.62% -8.56%
WC / Sales / Sales Growth -5.33% -5.21% 4.66% 6.23% -5.89% -9.82% -11.30% -11.62%
$3.32 to $3.38

CVS Caremark Corporation - Stock Report Juliette Buob
Student Investment Management Autumn 2012 Page 20/20
Appendix 3: Discounted Cash Flow Analysis
Analyst: 9.30%
Date: 29.09.2012 3.00%
TERMINAL
Year 2012E 2013E 2014E 2015E 2016E 2017E 2018E 2019E 2020E 2021E 2022E
Net Revenues $125,678 $136,394 $145,300 $153,292 $160,497 $167,077 $173,259 $179,150 $184,883 $190,429 $196,142
% Growth 8.53% 6.53% 5.50% 4.70% 4.10% 3.70% 3.40% 3.20% 3.00% 3.00%
Cost of revenues $100,668 $108,842 $115,514 $121,714 $127,290 $132,375 $137,152 $141,707 $146,150 $150,458 $154,952
% of Net Revenues 80.10% 79.80% 79.50% 79.4% 79.3% 79.2% 79.2% 79.1% 79.1% 79.0% 79.0%
Gross profit $25,010 $27,552 $29,787 $31,578 $33,207 $34,702 $36,107 $37,442 $38,733 $39,971 $41,190
Gross margin 19.90% 20.20% 20.50% 20.60% 20.69% 20.77% 20.84% 20.90% 20.95% 20.99% 21.00%
Operating expenses $17,344 $18,550 $19,616 $21,001 $22,293 $23,508 $24,672 $25,798 $26,900 $27,974 $28,833
% of Net Revenues 13.80% 13.60% 13.50% 13.70% 13.89% 14.07% 14.24% 14.40% 14.55% 14.69% 14.70%
Operating Profit $7,666 $9,002 $10,171 $10,577 $10,914 $11,194 $11,435 $11,645 $11,832 $11,997 $12,357
Operating Margin 6.10% 6.60% 7.00% 6.90% 6.80% 6.70% 6.60% 6.50% 6.40% 6.30% 6.30%
Interest expense, net $691 $750 $799 $843 $883 $919 $953 $985 $1,017 $1,047 $1,079
Interest % of Sales 0.550% 0.550% 0.550% 0.550% 0.550% 0.550% 0.550% 0.550% 0.550% 0.550% 0.550%
Income before income tax
provision$6,975 $8,252 $9,372 $9,734 $10,031 $10,275 $10,482 $10,659 $10,816 $10,950 $11,278
Income tax provision $2,706 $3,202 $3,636 3'777 3'892 3'987 4'067 4'136 4'196 4'248 4'376
Tax Rate 38.80% 38.80% 38.80% 38.80% 38.80% 38.80% 38.80% 38.80% 38.80% 38.80% 38.80%
Income from continuing
operations$4,269 $5,050 $5,736 $5,957 $6,139 $6,288 $6,415 $6,524 $6,619 $6,701 $6,902
Income (loss) from
discontinued operations,
net of tax
- - - - - - - - - - -
Net Income $4,269 $5,050 $5,736 $5,957 $6,139 $6,288 $6,415 $6,524 $6,619 $6,701 $6,902
% Growth 18.30% 13.57% 3.86% 3.05% 2.43% 2.01% 1.69% 1.47% 1.24% 3.00%
Add Depreciation/Amort $1,822 $1,978 $2,107 $2,223 $2,327 $2,423 $2,512 $2,598 $2,681 $2,761 $2,844
% of Sales 1.45% 1.45% 1.45% 1.45% 1.45% 1.45% 1.45% 1.45% 1.45% 1.45% 1.45%
Plus/(minus) Changes WC $1072 ($610.81) ($507.68) ($463.71) ($414.88) ($376.76) ($352.58) ($335.01) ($325.39) ($314.21) ($323.63)
% of Sales 0.85% -0.45% -0.35% -0.30% -0.26% -0.23% -0.20% -0.19% -0.18% -0.17% -0.17%
Subtract Cap Ex $3016 $3273 $3487 $3,497 $3,471 $3,415 $3,335 $3,236 $3,120 $2,987 $2,844
Capex % of sales 2.40% 2.40% 2.40% 2.28% 2.16% 2.04% 1.93% 1.81% 1.69% 1.57% 1.45%
Free Cash Flow 4'165 3'416 4'117 4'467 4'803 5'115 5'407 5'689 5'964 6'238 6'625
% Growth -17.98% 20.53% 8.51% 7.51% 6.50% 5.71% 5.21% 4.83% 4.60% 6.20%
NPV of Cash Flows 31'313 41%
NPV of terminal value 44'511 59% Terminal Value 108'310
Projected Equity Value 75'824 100%
Free Cash Flow Yield 7.10% Free Cash Yield 6.12%
Current P/E 13.7 11.6 10.2 Terminal P/E 15.7
Projected P/E 17.8 15.0 13.2
Current EV/EBITDA 7.0 6.1 5.4 Terminal EV/EBITDA 7.6
Projected EV/EBITDA 8.8 7.6 6.8
Shares Outstanding 1,309
Current Price $44.80
Implied equity value/share $57.93
Upside/(Downside) to DCF 29.30%
Debt $9,208
Cash $1,413
Cash/share 1.08
Total Assets $64,543
Debt/Assets 14.3%
Working Capital % of
Growth5.5%
CVS Caremark Corporation
Terminal Discount Rate =Juliette Buob
Terminal FCF Growth =