recollections the first years of the protein data...
TRANSCRIPT
Protein Science (1997), 6:1591-1597. Cambridge University Press. Printed in the USA Copyright 0 1997 The Protein Society
RECOLLECTIONS
The first years of the Protein Data Bank*’
EDGAR E MEYER Biographics Laboratory, Department of Biochemistry and Biophysics, Texas A&M University, College Station, Texas 77843-21 28
It is a challenge to paint portraits of yesterday with today’s colors, especially when we really want to paint tomorrow’s portraits, but let’s try. In describing the origin of the Protein Data Bank (PDB, Bernstein et al., 1977), it is essential to consider the state of sci- ence and technology (especially protein crystallography and com- puting). Describing computing with decks of punched cards or using Beevers-Lipson strips to calculate structure factors is like using the vocabulary of the electronics age to describe the function of a bronze-age artifact.
The conception and development of the Protein Data Bank was directly linked to its database, crystallographically determined pro- tein structures? and to the availability of facile graphics hardware and software. Structural studies of nucleic acids and oligosaccha- rides and analysis of proteins by NMR came some years later. A
Reprint requests to: Edgar E Meyer, Biographics Laboratory, Depart- ment of Biochemistry and Biophysics, Texas A&M University, College Station, Texas 77843-2128; e-mail: [email protected].
Edgar E Meyer obtained his B.S. in chemistry from North Texas State University and his Ph.D. in chemistry from the University of Texas, under the direction of Prof. Stanley H. Simonsen. He then was a postdoctoral fellow in the laboratory of Prof. Jack Dunitz at the Swiss Institute of Technology (E.T.H.), Zurich, and subsequently at M.I.T., in the laboratories of Prof. Alexander Rich and Prof. Cyrus Levinthal, where he was intro- duced to the “Kludge” at Project MAC. He spent his academic career thus far at Texas A&M University, first studying small molecule structures (metalloporphyrins and bile pigments) and later switching to protein- ligand complexes, especially porcine pancreatic elastase and more recently, the collagenolytic isozyme, Ht-d, from the hemorrhagic venom of the western diamondback rattlesnake, Crotalus atrox.
He was a Visiting Scientist at the Brookhaven National Laboratory from 1968-1974 and has been a Visiting Scientist at the Max-Planck Institut fur Biochemie, Martinsried, since 1979. He has been a Visiting Professor at the University of Florence, Italy, and the E.T.H., Zurich, Switzerland. Coming from the flats of Texas, he spends his scientific life looking at molecules in 3D, using or devising programs and methods, as necessary, and directing a small but productive research group balanced between computational and experimental methods.
*This paper is dedicated to the memory of Dr. Stanley H. Simonsen, Professor of Chemistry, The University of Texas (1918-1996).
’Presented in an abbreviated form at the XVII Congress of the Inter- national Union of Crystallography, Seattle, Washington, August, 1996.
’By 1970, solved protein structures included myoglobin, hemoglobin, lysozyme, ribonuclease, carboxypeptidase, a-chymotrypsin, papain, and subtilisin.
crucial component for the utilization of this database and later to the advancement of the crystallographic method was the develop- ment of interactive computer graphics3 (Hamilton, 1970). Three technologies contributed to this advancement. First was the Cal- comp plotter; second, the monochromatic (black and white) cath- ode ray tube (CRT) display, which appeared about the same time. CRT graphics existed at first only at very few locations (e.g., Project MAC at MIT) because ad hoc software had to be written for ad hoc hardware. Plotter graphics had the greatest initial impact on structural studies for two reasons: an affordable Calcomp plot- ter and the mature software package, ORTEP (Johnson, 1965): still in use today! The third and most durable technology was/is color raster graphics.
The birth place and cradle of interactive graphics was Project MAC at MIT. Prof. Cyrus Levinthal (1965, 1966) and his group (Langridge & Macewan, 1965) developed software to study known molecular structures and to try to predict novel structures; MAD or FORTRAN programs were written for the “kludge.” As the 1971 proceeding of the Cold Spring Harbor Symposium illustrates (Bany & North, 1972; Yankeelov & Coggins, 1972), affordable ad hoc displays were slow to appear. The Electronics Systems Laboratory (Marshall and Barry) at Washington University, St. Louis, began to develop original hardware and software, as did Tony North’s group at Leeds (Barry & North, 1972). In the early 1970s, Richard Feld- mann had assembled a graphics resource at the NIH and also had begun to gather atomic coordinates of proteins. His efforts in- cluded a search procedure for the Crystal Data Centre files, de- velopment of 3D teaching tools, modeling efforts, and serving the NIH community. The graphics laboratory at Princeton University, run for a time by Bob Langridge and Todd Wipke (cf. Langridge, 1988), used a PDP-10 and early Evans & Sutherland monochro- matic display (the “LDS-l”), costing ca. $700,000. In the early
3Just as books printed before 1500 are considered the incunubulu, in- teractive molecular graphics before 1970 may likewise be so considered.
4At the 1965 ACA meeting in Gatlinburg, Tennessee, Carroll Johnson offered to prepare a stereo slide, with thermal ellipsoids, from the coordi- nates of structures being presented. I used this opportunity to present the structure of the comn nucleus of vitamin B,z, synthesized by the Eschen- moser group and determined in Jack Dunitz’s laboratory at the E.T.H., Zurich (Bertele et al., 1964).
1591
I592 E.E Mever
1
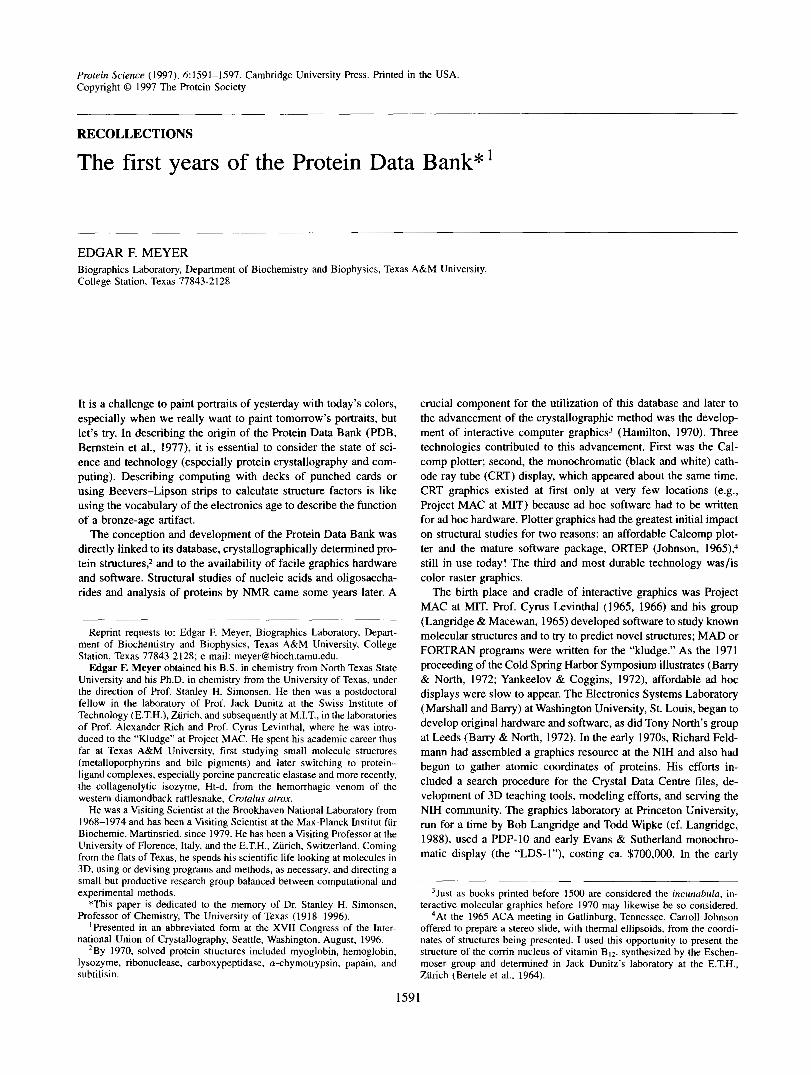
Fig. 1. Out shopping for a 3D graphics system. Dr. Bob Sparks. Tom Workman (President of Syntex Analytical). Neville Crooke (a salesman). and Dr. Walter Hamilton (left to right) are pictured during our visit to Syntex Analytical in 1972.
1970s. commercial graphics hardware was so expensive and com- puter memory so limiting that ad hoc programs were necessary and systems were not exportable-this did not change until the second generation Vector General display and PDP-I 1 led to the devel- opment of program FRODO (Jones, 1978) at Martinsried by Alwyn Jones in the late 1970s. Cost of hardware was the main bottleneck that limited progress with these early efforts, all of which used monochromatic displays.
While a member of Levinthal’s group at MIT, I wrote a program to display small molecule structures, but I had to generate the bond list by hand. After taking a faculty position at Texas A&M in 1967, my first program (UMZUG) used atomic radii and interatomic distance criteria to create FROM and RING connectivity lists sim- ilar to the descriptors used by Chemical Abstracts (Morgan, 1965). This procedure was automatic for well-refined small molecules, but the atomic positional errors of unrefined protein structures required occasional manual editing of the connectivity files.
In 1968, the third visualization technology, color raster graphics, was developed and became the predecessor of the graphics work- station. The high-energy physics laboratory at Brookhaven Na- tional Laboratory (BNL) developed the BRAD (Brookhaven RAster Display; Ophir et al., 1969) system, which drew digitized images of Hough-Powell bubble chamber photographs on a black and white TV monitor equipped with a keyboard and trackball pointer (the first mouse!). Operators at two stations worked two 8-h shifts, moving the track ball pointer along orthogonal projections of the paths of subatomic particles; the 3D trajectories were calculated off-line to try to identify elusive high-energy events. The devel- opers of the BRAD system perceived the potential of the BRAD system for 3D graphics and linked the two display channels to the red and green circuits of a Philco color television set.
In 1968, Dr. Walter Hamilton (cf. Fig. I ; also see Addendum), in the Chemistry Department at Brookhaven, recognized the potential of the BRAD display for 3D molecular graphics and invited me to spend a summer writing a program to draw 3D pictures of mol- ecules; my family did not see much of me that summer because the computer was free only on the third shift, from midnight to dawn. At the end of the summer, program DISPLAY (Meyer, 1968).
consisting of ca. 2,000 cards? could draw, rotate, zoom, and label molecular models in 3D. Because program DISPLAY could draw 3D models with up to 5 I2 atoms, it could draw the trace of C, positions of a protein or it could depict an enlarged view of a region of interest of a protein. Figure 2 shows an example of a stereo model drawn by this system.“
During my second visit to Brookhaven, in the summer of 1969, I wrote program LINK (Meyer, 1970b) to display small molecule structures and started using program DISPLAY to study protein structures. Benno Schoenbom provided me with an “unofficial” set of myoglobin coordinates, and the fun began. Punched cards contain- ing the C, and heme atom coordinates were extracted manually and input to the program; revealing the first color display of a model7 of the structure (Meyer, 197 I ). Upon visual inspection, one of the N atoms of the heme macrocycle was clearly nonplana3 (Fig. 1) due to an error in one of the atomic coordinates provided to me.
Beginning with the summer of 1970, I began to solicit coordi- nates from various groups, e.g., ribonuclease-S (Richards et al.,
‘This was not Project MAC: the rest of the world used punched cards or paper tape. These functions are now available at the flick of a command, knob, or icon.
“The full paper (Meyer, 1970a) only appeared two years later, first because a reviewer insisted that perspective be included-a feature totally ignored today-and then because the paper was somehow misplaced in moving the editorial offices of Acro Cnsfallo~ruphicu.
’Remember that most protein structures then were made of Kendrew models (brass rods; 1.25 cm = 1 A). Brass models took up a cubic meter of laboratory space and were dynamically unstable. Also, several develop- ers of early graphics systems were essentially blind in one eye. so not every program pursued the 3D properties of this new medium.
‘Because the first version of DISPLAY did not yct have moveable atoms, what should have taken I min at the graphics terminal took a month in batch mode, back in Texas. to add a subroutine for a least-squares plane calculation-and discover that a key punch mistake in the third significant figure (a 7 in place of a 6, as I recall) caused a 0.5 8, perpendicular displacement of an heme N atom. This alerted me to the need of an error-checking routine. as did the distance-dependent definition of bond- ing; refinement procedures in the 1970s were in their infancy, resulting in occasional occurrences of missing or excessive display of lines = bonds, and thus another strong visual cue (valuable even today).

Theprst years of the Protein Data Bank
Fig. 2. Reproduction of an original (1970) color transparency from the Philco TV monitor using the BRAD system to create a 3D image. Program SEARCH on the CDC 6600 used the “scoop” subroutine to load the myo- globin coordinates from the PDB, center on the Fe atom, and extract all atoms within 10 A. A card deck of the extracted atomic coordinates was loaded into program DISPLAY and an orientation obtained by inputting Eulerian angles from the BRAD teletype. Red/green spectacles were used to obtain a 3D view, which showed that a heme N atom was misplaced. The BRAD system required ca. 1 min to create such a view, which then could be queried interactively (distances, angles, atom type, etc.) by a track-ball pointer. Circles of various radii were used to indicate non-C atoms.
1972). I also received a printed listing of C, positions of subtilisin (Wright et al., 1969) from Joe Kraut’s laboratory at UCSD. Be- cause these structures were determined in the US., the coordinates were measured in inches? whereas the myoglobin coordinates were in centimeters. Looking ahead, I knew that Cotton’s group at MIT was working on the structure of staphylococcal nuclease (Cotton et al., 1972); I anticipated that the MIT structure would be reported in the local system of measure, the Smoot.lo I subsequently wrote program PROIN (Meyer, 1974), which accepted a variety of for- mats and dimensions and was independent of crystal class.
To facilitate the automatic processing of data, a dictionary of pointers to group and atom names and aqueous characteristics (charge, hydrophobic, etc.) was assembled. John Coggins, a post- doctoral associate in Biology with Elliott Shaw at Brookhaven and now a Professor of Biochemistry at the University of Glasgow, contributed to the fundamental design of the dictionary. Numeric pointers were packed in binary as a coded word for ease of ex- traction (and especially to save CPU memory). John was enor- mously helpful in making informed decisions for setting up the protocols for input and storage. He taught me some biochemistry and I taught him to be a key-punch operator.
’Structures then were built of Kendrew models as a mirror image of electron density in a Richards’ Box (Richards, 1968) and atomic positions were measured individually with a traveling telescope.
‘OAn MIT fraternity used a pledge, Oliver Smoot, to measure the length of Harvard Bridge from Boston to Cambridge over the Charles River; the distance is 364.4 Smoots and 1 ear (or 2,165 feet).
1593
Programmers today may not appreciate that the largest CPU memory (magnetic cores) available in 1970 was 32K words for storage of program + data. So program PROIN was written to pack nonstructural information in binary into control words that could be searched rapidly with shifting and logical masking oper- ations requiring one CPU cycle, in order to retrieve residue number or type, atom type, etc. Each atom was stored as a punched card image in the 80-column format, which is still maintained as an ASCII image by the PDB, requiring 20 A4 words (or 10 A8 words on the CDC 6600), whereas PROIN achieved a fourfold saving by compressing this to five words of CPU memory for internal stor- age and retrieval (three words stored the x, y , z atomic coordinates and two coded binary words described the atom type, residue name, and sequence number). Walter suggested that the coordi- nates be orthogonalized” with the crystallographic c axis unique for display purposes. Coordinates were stored in orthogonal 8, units; transformation matrices were placed in the header. Thus was the PDB begun.
This technology provided the capability to store and display the structures of a growing list of magnificent macromolecules. But diplomacy was needed to convince the crystallographic commu- nity of its merits, not of the utility of the PDB as an archival depository, but of the necessity of distributing the coordinates. Years, if not graduate-student lifetimes, were expended determin- ing these first structures. Refinement methods in 1970 were crude and generally not available; the structures were imprecise and subject to misinterpretation. The REMARK feature of the PDB was therefore introduced to permit authors to identify regions re- quiring special attention-or neglect. In order to establish the PDB, acceptance by the crystallographic community was necessary, re- quiring a pilgrimage in 1970 to the Medical Research Council (MRC) laboratory and Crystal Data Centre (CDC) in Cambridge. One result of this exchange was a concession that coordinates of protein structures would be stored in the same format as the small molecule CDC database (with a redundant ATOM label at the beginning of each card), retaining the now-arcane counting num- ber at the end. But the idea of a PDB was accepted by Professors Pemtz, Blow, Kennard, Diamond, and colleagues in Cambridge.
To this point, all available display terminals (with the exception of the BRAD system) were monochromatic and very expensive. At the American Crystallographic Association meeting in Ottawa in 1971,12 Syntex Analytical demonstrated a novel 3D color (512 X 512) raster display with ingenious use of 4,096 words of CPU memory (Data General Nova with a blazing 1-ms cycle time) and a disc with eight read heads, which could store programs, atomic information, and two complete, two-color stereo images, years before color raster graphics became commercially available (Table 1). This prototype (Willoughby et al., 1974) was delivered subsequently to my laboratory in Texas but, thanks primarily to
“ I recall distinctly the resistance I encountered from some members of the crystallographic community for wanting to use internal fractional co- ordinates so that the program could apply symmetry operators; is it disre- spectful to refer to that time as the bronze age of protein crystallography? To the contrary, it is a tribute to the heroic efforts of these pioneers, who obtained dramatic results with “bronze-age” tools.
I2At this same meeting, Picker X-ray demonstrated the first area-detector- like device, a TV display of a few diffraction spots. Bob Sparks remarked to me that although the Picker group didn’t know how to use this infor- mation (and shortly afterward Picker dropped their single-crystal division), Bob’s newly developed auto-indexing algorithm would make it possible to index these reflections.

1594
Table 1. Brief history of macromolecular Rraphics
1964
1965
1968
1970
1971 1975
1976
1977
1978
1981
1982 1985
1987 1988
1990
First interactive macromolecular display (the “Kluge,” Project
Program ORTEP (Carroll Johnson); stereo plots with thermal
First use of color raster graphics, program DISPLAY (E.M.):
Syntex color raster system (J Appl Cryst 7430-434):
MAC, MIT).
ellipsoids.
Brookhaven National Laboratory.
TV monitor + Data General computer: 4,096 words of memory.
3D display of density for ligand fitting (Barry & North). Staphylococcal nuclease fit to density (Cotton, Hazen, Legg),
PS2 graphics terminal from Evans & Sutherland. Monoclinic Lysozyme (Hogle & Sundaralingam). Sea snake venom toxin protein fit to density at UNC Petsko
Arabinose binding protein (Quiocho, Gilliland, Newcomber). Program FRODO (A. Jones, JAppl Cryst 11:268-272)
General purpose molecular modeling and refinement program-Jan Hermans’ refinement algorithm.
MPS color graphics terminal from Evans & Sutherland. BUILDER (Diamond; “Computational Crystallography,”
GRAMPS (O’Donnel & Olson, J Comp Graph 15:133-142). GRINCH (Williams & Brooks). FRODO ported to the Silicon Graphics workstation (Oakley,
GRANNY (Connolly & Olson, Comp & Chem 9:l-6). GRID (Goodford, J Med Chem 28349). Rice FRODO for the E&S PS300 (Pflugrath, Quiocho, Saper). MIDAS (J Mol Graph 6: 13-27). Program 0 (Alwyn Jones). Program CHAIN (Quiocho & Sack). Program PRONTO (Laczkowski & Swanson).
program FIT (Science 190:1047-1053).
et al. (Science 1971378-1381).
D. Sayer, ed., Clarendon Press, Oxford).
UCSD).
company leadership, the display was not developed commercially, despite Bob Spark’s genius at creating cutting-edge technology.I3 At that time, a few sensitive crystallographers were too easily offended by the jagged lines representing atomic bonds; the anti- aliasing algorithm had not yet been invented.
By 1970, available atomic coordinates of proteins were col- lected and stored with program PROIN in a uniform format at Brookhaven. They received little general use because of limited access to graphics displays; about all one could do was admire endless lists of atomic coordinates or bend brass rods to look like petrified earth worms. Therefore, the program SEARCH (Meyer, 1971) was written in FORTRAN to access the PDB and provide coordinates for off-line display. It could select a given protein from the PDB and extract atomic coordinates on the basis of atom type, residue type, or sequence range. Because 2,500 atoms would over- whelm the BRAD system,I4 a novel feature permitted the user to
”The price, ca. $30,000, was far less than commercial monochromatic systems, and commensurate with the price of workstations today, giving an endpoint to the market projection of the linear increase of computational power over time at constant price. Although the Syntex leadership ne- glected to exploit this breakthrough, Bob Sparks is well known for his vision and unparalleled ability to develop computer programs for the crys- tallographic community.
I4It took some 4 h to read the paper tapes containing the coordinates of a-chymotrypsin at 110 Baud = teletype speed (2,500 atoms X 80 ch/
E. E Meyer
select a position or residue and extract (scoop) all atoms within a given radius. Today, the ease of access of structural data with World Wide Web search engines and the facility of current display software make these pioneering efforts to store and retrieve struc- tural data appear crude, but one need only compare the illustrations in a biochemistry textbook of 1970 with those of today to see the dramatic transformation that has occurred in our lifetime.
Because of some personality conflicts at BNL, initially there wasn’t the necessary harmony between some in the Biology and Chemistry Departments at Brookhaven, but recently the PDB moved to the Biology Department. There was very little protein research (i.e., no protein crystallography) being pursued in the Chemistry Department, so the PDB, like some other databases, suffered ini- tially from a lack of local critical users and the necessary feedback they provide. Obviously, these difficulties have been overcome, but it is interesting to trace the contours of history and speculate about alternative trajectories. Even though the PDB has always been housed at Brookhaven, for a time during the early years, the only paid employee, Frances Bernstein, who has been with the PDB for almost 25 years, was a consultant for Texas A&M Uni- versity, thanks to NSF funding of the CRYSNET project. Her husband, Herbert, was extremely helpful in teaching elementary computer science to the first programmer, including the transition away from punched cards as text editors became available.
In perspective, it is revealing to see how far protein crystallog- raphy had progressed by 1971, which has been arbitrarily chosen as the beginning of the PDB, 25 years later. The Cold Spring Harbor SymposiumI5 of 1971 represented most of the then-current work, especially in terms of structures still being solved, over and above those already solved at that time. Earlier in 1971, the meet- ing of the American Crystallographic Association in North Caro- lina had an ad hoc session where the need for a PDB and some of the requirements of the user community were discussed. The sec- ond Alpbach meeting in early 1972 gave me the first opportunity to present the PDB informally to the European crystallographic community.
After the August 1971 ACA meeting in Iowa, Walter Hamilton and his family visited relatives in Waco, Texas, and spent the weekend with us in College Station. For some time, theoretical physicists (Professors John Nuttall and Ron Bryan) at Texas A&M, with the growing disapproval of the university administration, used a leased telephone line to Austin to compute on the CDC 6600 at the University of Texas, which was more user-friendly and com- putationally far superior to the “iron” from IBM here at Texas A&M. By administrative mandate, this usage was terminated that summer. But the phone company was a little slow in removing the teletype and leased line to the Physics Department. Also, Walter was exceptionally busy during my six-week visit to BNL that summer. So, on the first Monday, September 6, 1972, we went to the A&M Physics Department and used the teletype to connect to
atom X 8 bits/ch/l I O bits/s = 4 h). AT3 Internet connection (45 Mbits/s) is 400,000 times faster and even a 28-khit FAX/modem is 250 times faster than standard teletype I/O. But in retrospect, 1 I O Baud (ca. I O characteds) is about the response speed occasionally obtained during daytime use of the World Wide Web. Recently, on sabbatical leave in Zurich, I could access the PDB at 1 PM (7 AM in New York) at 61 bytes/% Ibs = Infobahnstau! So 110 Baud is not as primitive as it seems.
‘%e PDB was not represented in the published proceedings, although it had been described clearly in published papers (Meyer, 1970a, 1970b. 1971), because my department gave me the opportunity just then to present my first lectures in undergraduate biochemistry, an offer I could not refuse.

Thefirst years of the Protein Data Bank 1595
Fig. 3. The tetrahedral simplex is used to illustrate the four necessary components of structural biochemistry available by 1972, thanks to remote access to the PDB and facile 3D graphics. The CRYSNET consortium funded by the NSF linked Brookhaven, Helen Berman’s laboratory at the Institute for Cancer Research (Philadelphia), and Texas A&M by telephone lines and 4K modems. Modem developments like the World Wide Web now make these components readily available to users around the world. A contemporary version of the simplex would replace “crystallography” with “structure determination” in order to include structures from NMR and electron microscopy.
the CDC 6600 at BNL. Selecting myoglobin from the PDB with the Fe atom at the center, program SEARCH scooped out the atomic coordinates of ca. 50 heme atoms and nearby amino acids, which were printed out at I10 Baud over a distance of ca. 3,000 km. This was the genesis of the fourth apex (Fig. 3) of our tech- nology, networking (+crystallography, graphics, the PDB). The demonstration lasted less than 30 min, but set in motion the first practical use of networking for crystallography (Meyer et al., 1974), which brought together a critical mass of programmers (Fig. 4), funds for graphics displays, and distributed use of the BNL suite of
Fig. 4. The Vector General (monochromatic) graphics terminal of the CRYS- NET system is used to demonstrate graphics software being developed at Texas A&M. David Klunk (a graduate student, seated) is demonstrating a preliminary version of program FIT to Dr. Tom Koetzle, E.F.M., Drs. Herbert Bemstein and Tom Willoughby (left to right; missing are Drs. Lany Andrews and Carl Morimoto); the photo was taken at Brookhaven the summer of 1973.
crystallographic software and support for the PDB.I6 This was the first use of networking and remote, non-textual information re- trieval in the chemical and life-sciences.
As an occasional contributor to the PDB, and likewise as an avid user, I am pleased to see the wealth of information that has been amassed under one roof. Recent search engines (e.g., the 3DB browser by Jaime Prilusky [pers. comm.]) and the powerful SWISS- MODEL procedure (Peitsch & Jongeneel, 1993) made it possible for an undergraduate student, Kendra Worick, to predict on the basis of sequence similarities the structure of an homologous ma- trix metalloproteinase (Laczkowsky et al., 1996), which compared favorably with known structures in the PDB, even though stabi- lizing metal ions (Zn, Ca) were not included in the prediction algorithm.
In addition to founding the PDB, I have been able to use it to make some original contributions:
Foreseeing the impact structural data and interactive graphics would make on the field of structure-based drug design, I visited Prof. E.J. Ariens in Nijmegen, the Netherlands; he invited me to write a review chapter (Meyer, 1980) to sum- marize the current efforts and point the way for subsequent developments.17
A curious pattern of highly resolved internal water molecules in our first high-resolution (1.65 A) elastase structure (3EST) lead to a survey of structures. The original authors apparently ne- glected to trace out H-bonding chains radiating from buried active sites; this striking structural motif (Meyer, 1988, 1992) evolved from a curiosity into a fundamental mechanistic prin- ciple for proton conduction. Ready access to PDB files made it possible to look for confirming examples as well as counter- examples. A chain of H-bonds, often mediated by internal water molecules, is now an established structural/functional motif in enzymes (cf. Baciou & Michel, 1995; Kandori et al., 1995). Likewise, the necessity of low-energy dissipation of bound wa- ter molecules for ligand binding and product release was re- solved from a series of high-resolution structures by observing a tunnel or “back-door” through which water could pass in/out of the core of the enzyme. These two mechanistic roles could be enunciated thanks to access to the apices of the structural sim- plex (Fig. 3), each of which played a crucial role.
Most recently, a survey of structures led to a review of surpris- ing binding modes, showing the limitations of rigid models for structure-based drug design (Meyer et al., 1995). What motifs and surprises still await us?
I6The day-to-day details of the PDB were later cared for by a postdoc- toral associate in Walter’s lab, Tom Koetzle, who continued after Walter’s death to direct the PDB for some 20 years. Both distance and my status as a visiting scientist at Brookhaven prevented me from assuming a more active role in the continuing development of the PDB, which was assuming a life of its own. Ironically, the disadvantage of distance was a crucial factor in this first demonstration of crystallographic networking-who would have noticed if I had demonstrated program SEARCH at Brookhaven? But 3,000 km away, from Texas! Also, 1971 was about the time the ARPA network was getting started, showing the further relevance of these efforts.
”From my perspective, the rate-limiting step for introduction of structure- based drug design was the advent of color graphics, not in the laboratory. but in the board room. Tradition-minded organic chemists were difficult to convince that one could develop novel and useful compounds from playing around with computer models.

1596 E. E Meyer
Taking some liberty, a heuristic linear relationship appears to persist that equates the number of solved macromolecular struc- tures with the number of graphics workstations in use around the world. This equation may be expanded, on the one side, by prolific groups and the eagerness of NMR studies to present not 1, but 99 structures of a given macromolecule and, on the other side, by the explosion of Macintosh and PC displays with enhanced graphics capability. However, from my perspective, most displays still lack an essential component, stereo filters for emphatic 3D viewing- the difference is comparable to viewing a postcard of Niagara Falls versus a video versus virtual reality versus Niagara Falls itself. One is easily underwhelmed by high-resolution information that is mostly discarded in 2D images as colorful low-resolution worm- like representations (similar to calendar graphics or elevator music).
Even though the PBD is growing exponentially, I predict that the balance will shift in the direction of the number of 3D graphics workstations. Imagine surfing over to channel 512 where a Suss- man surrogate entertains questions in real-time about biological macromolecules with instantaneous display of answers, like: “Show me membrane-bound structures with reduced forms of disulfide linkages, and conformational shifts that occur relative to the oxi- dized forms.” “What is the sequence of events that occurs upon binding of an allosteric affector?” “Which structures have two aromatic groups within 4 8, of each other, and how do they pack?’ By extending database technology, other questions can be asked, such as: “give me the structure of the RNA polymerase with the tightest binding of rifampin” or “give me examples of drug mol- ecules which bind backward (Meyer et al., 1995) and how do their structures differ from ‘forwards-binding drugs’ ” or “which struc- tural features of hemoglobin make some mutants superior for ath- letes at high altitude” or “what mutations’* of mitochondrial proteins are unique to Olympic athletes?’ Of course, the display will be a flat screen with a 3D view. It will cost the same as today’s TV set, it will contain your phone, FAX, family albums, it will be linked to the libraries of the world, with simultaneous translations for cross-document searches (e.g., the metaphoric uses of “black” among Arabic and Venetian poets).
What will be left to the imagination? Well, the video screen and mouse interface are artificial; we need direct cranial hookups. With increased demand, we’ll need more responsive and reliable net- works to avoid cyber-boredom. Expert systems will be developed that successfully duplicate the neural networks of the experts; for all the efforts needed to develop this system, it will be antiquated in a generation-and a creator will publish a 25-year retrospective of how virtual neural networks began, between midnight and dawn, when the world slumbered at the close the electronic age. But such efforts to gaze into the future usually miss the mark, when viewed
I8The universally revered cockroach will be the common host for testing structure-based mutations, which will be synthesized by robots and injected and tested in safe facilities. The Protein Society will sponsor the Cockroach Olympics: marathon running, underwater swimming, track and field, and aerial events; Science will choose the Cockroach of the Year for its athletic and scientific prowess. High-school science fairs will never be the same. TV sit coms will let viewers diagnose and cure the physical or psychic diseases created by frantic producers; holograms of structures of mutant proteins will be collected and swapped by children’s fan clubs. The sequel to “Dungeons and Dragons” will be “Molecules and Mutants”; instead of memorizing metabolic pathways, medical students will learn to search the web; biochemists will be designing computational links between databases to fill the gaps, and computer scientists will be designing new algorithms to create optimal pathways in n-dimensional space to create totally new dNgS.
historically, yet we try, with the limited means at our disposal, which means that much indeed will be left to the imagination. This challenge is given further perspective by comparing current progress and prospects with those of 50 years ago, as enunciated by a much more enlightened seer, Vannevar Bush (Bush, 1945); the World Wide Web has the possibility to meet his challenge,I9 except for 3D (and higher dimensional) data. It is questionable whether software (e.g., virtual reality modeling language or VRML) can solve an essential hardware problem.
Conclusion
A visitor to the Accademia in Florence can see magnificent images that emerged from blocks of marble at the hands of Michelangelo. By analogy, the noncrystallographer can capture the vision that a crystallographer has when admiring a rigorously shaped crystal before exploring the marvelous structure hidden within. So the PDB is our museum, with models of molecules reflecting the wonders of nature and complex shapes that may be as old as life itself. With the aid of interactive graphics and networking, the PDB makes these images readily available. What wonders still remain hidden as we build, compare, and extend our database?
Beyond the initial use of color raster graphics for molecular modeling, what of this recollection is unique? We know of indi- viduals who have made greater contributions to the life sciences using one or another method discussed here. Perhaps it is the ability to forge a link between crystallography, a database, graph- ics, and a network to span computational and experimental sci- ences and thereby make the results conveniently available that will be viewed retrospectively as an original contribution?
With broad brushstrokes and subdued pigments, a vision emerges from a union of computational and experimental science that ap- peals directly to our most powerful input device, our eyes. AI- though many of the events related here appear arcane, one can only speculate how limited our current accomplishments may appear to the next generation. But we know where the life sciences would be without them.
Early efforts were supported by Brookhaven National Labora- tory and the US National Science Foundation. The Robert A. Welch Foundation (A-328) has provided sustaining support for 27 years?” Dr. Robert Spinrad (Xerox Corp.) provided supplemental informa- tion about the BRAD system. My wife, Catarina, has been a sus- taining inspiration for 31 years and I have benefited greatly from 20+ years of faithful collaboration and innovative algorithm de- velopment by Dr. Stan Swanson, as well as a number of capable students and postdoctoral associates. Drs. Erik Meyer and Rose- marie Swanson and Mrs. Francis Bemstein provided useful edito- rial suggestions. Walter’s close friend, Sidney Abrahams, and the obituary provided by BNL, were used to compose the addendum on Walter Hamilton.
The seed was planted in Stan Simonsen’s laboratory in Austin, where I grew my first crystals, measured my first data, and wrote my first programs. It took root in Jack Dunitz’s laboratory in Zurich and prospered at MIT. It blossomed when Walter invited a
19‘‘The difficulty seems to be, not so much that we publish unduly in view of the extent and variety of present-day interests, but rather that publication has been extended far beyond our present ability to make real use of the record.”
*OResearch in my laboratory has progressed even without 20+ years of NIH support, thanks mostly to very capable and dedicated colleagues.
The first years of the Protein Data Bank 1597
fellow Texan and his family to spend a few summers on Long Island. It continues to bear fruit.
Addendum
Dr. Walter C. Hamilton, Senior Chemist and Deputy Chairman of the Chemistry Department at Brookhaven National Laboratory, became one of the world’s leading crystallographers in his thirties as a result of his development of the neutron diffraction facilities at Brookhaven, his outstanding neutron investigations of magnetic and ferroelectric systems, and his neutron diffraction studies of H-bonding in water and amino acids, as well as by his books on crystallographic statistics, hydrogen bonding, and symmetry.
Born in Austin, Texas, February 16, 1931, Walter received a B.S. degree from Oklahoma State University (then, Oklahoma A&M); the following year he attended the Eidgenossiche Technische Hoch- schule in Zurich, Switzerland as a Swiss Government Fellow. He received his Ph.D. from Cal Tech with Verner Schomaker. He was an NSF Postdoctoral Fellow at the Mathematical Institute of Ox- ford University in England with Prof. C.A. Coulson. He then spent his professional career at Brookhaven, building an impressive crys- tallographic group and taking advantage of the automation that was then developing actively to use 4-circle diffractometers for the measurement of precise X-ray and neutron data. His neutron dif- fraction facility was one of the best in the world in the 1960s. He was thus able to take full advantage of other uses of computers, which were then becoming available (in particular, Digital’s PDP-8 at the low end and the CDC 6600 at the high end) to the scientific community. His brilliant work led to his appointment as Deputy Chair of the Chemistry Department at Brookhaven in 1968. He authored more than 100 scientific papers dealing with crystal and molecular structure determinations. He was author or co-author of three books: Statistics in Physical Science (1964), Hydrogen Bonding in Solids (1968), and Symmetry (1972). In 1966, he was appointed volume editor and member of the International Tables Commission of the IUCr.
Walter served from 1964, until his death from cancer at age 41, on the USA National Committee for Crystallography; he had been a delegate to several IUCr General Assemblies, was serving ac- tively on several National Research Council committees, and had organized the symposium “Computational Needs and Resources in Crystallography,” published posthumously as an influential report by the National Academy of Sciences. He developed an extensive set of crystallographic programs for small-molecule structure anal- ysis, which became a central part of our CRYSNET project.
References
Baciou L, Michel H. 1995. Interruption of the water chain in the reaction-center from rhodobacater-sphaeroides reduces the rates of the proton uptake and of the 2nd electron-transfer to Q(B). Biochem 347967-7972.
Bany CD, North ACT. 1972. The use of a computer-controlled display system in the study of molecular conformations. Cold Spring Harbor Symp Quant Biol 36577-584.
Bemstein FC, Koetzle TF, Williams GJB, Meyer EF Jr, Brice MD, Rodgers JR, Kennard 0, Shimanouchi T, Tasumi M. 1977. The Protein Data Bank: A computer-based archival file for macromolecular structures. J Mol Biol 112:535-542.
Bertele E, Boos H, Dunitz JD, Elsinger F, Eschenmoser A, Felner I, Gribi HP, Gschwend H, Meyer EF, Pesaro M, Scheffold R. 1964. Ein Synthetischer
Bush V. 1945. As we may think. The Atlantic Monthly 176101-108; cf. also Zugang zum Comnsystem. Angewandte Chemie 76393.
Cotton FA, Bier CJ, Day VW, Hazen EE Jr, Larsen S. 1972. Some aspects of the http://www.isg.sfu.ca/-duchier/misc/vbush/vbusb.txt.
structure of staphylococcal nuclease. Cold Spring Harbor Symp Quant Biol 36243-255.
Hamilton WC. 1970. The revolution in crystallography. Science 169133-141. Johnson CK. 1965. ORTEP. Oak Ridge National Laboratory Report. ORNL-
3794. Jones TA. 1978. A graphics model building and refinement system for macro-
molecules. J Appl Crystallogr 11:268-272. Kandori H, Yamazaki Y, Sasan J, Needleman R, Lanyi JK, Maeda A. 1995.
Water-mediated proton transfer in proteins: An FIlR study of bacteriorho- dopsin. J A m Chem Soc 1172118-2119.
Laczkowsky A, Meyer EF, Swanson SM, Worick RK. 1996. Molecular model- ing and rational drug design-A perspective. In: Mahmoudian M, ed. Proceedings, 12th Iranian congress of Physiology and Pharmacology. Forth- coming.
Langridge R. 1988. The early days of molecular graphics. In: Stezowski JJ, Huang JL, Shao MC, eds. Molecular structure: Chemical reactivity and biological activity. Oxford Oxford University Press. pp 583-588.
Langridge R, Macewan AW. 1965. IBM scientific symposium on computer aided experimentation. Yorktown Heights, New York IBM. p 305.
Levinthal C. 1965. IBM scientific symposium on computer aided experimenta- tion. Yorktown Heights, New York: IBM. p 315.
Levinthal C. 1966. Molecular model-building by computer. Scientific American 214:42-52.
Meyer EF. 1968. Annual Report, Brookhaven National Laboratory. p 81. Meyer EF. 1970a. Three-dimensional graphical models of molecules and a
time-slicing computer. J Appl Crystallogr 3:392-395. Meyer EF. 197Ob. Towards an automatic, three-dimensional display of structural
data. J Chem Doc 1085-86. Meyer EF. 1971. Interactive computer display for the three-dimensional study of
macromolecular structures. Nature 232255-257. Meyer EF. 1974. Storage and retrieval of macromolecular structural data. Bio-
polymers 13:419-422. Meyer EF. 1980. Interactive graphics in medicinal chemistry. In: Ariens EJ, ed.
Drug Design, vol IX. New York: Academic Press. pp 267-289. Meyer EF. 1988. A structure:function study of receptor+substrate interactions
derived from high-resolution X-ray crystallography. In: Stezowski J, Huang JL, Shao MC, eds. Molecular structure: Chemical reactivity and biological activity. Oxford: Oxford University Press. pp 179-188.
Meyer EF. 1992. Internal water molecules and H-bonding in biological macro- molecules: A review of structural features with functional implications. Protein Sci 1: 1543-1562.
Meyer EF, Botos I, Scapozza L, Zhang D. 1995. Backwards binding and other
Meyer EF, Morimoto CN, Villareal J, Berman HM, Carrel1 HL, Stodola RF, structural surprises. Perspectives in Drug Discovery and Design 3: 168-195.
Koetzle TF, Andrews LC, Bemstein FC, Bemstein HL. 1974. CRYSNET, a crystallographic computing network with interactive graphics display. Fed Proc 33:2399-2402.
Morgan HL. 1965. The generation of a unique machine description for chemical structures-A technique developed at chemical abstracts service. J Chem Doc 5107-117.
Ophir D, Shepherd BJ, Spinrad RJ. 1969. Three-dimensional computer display. Comm ACM 12:309-310.
Peitsch MC, Jongeneel CV. 1993. A 3D model for the CD40 ligand predicts that it is a compact trimer similar to the tumor necrosis factors. Int Immun 5233-238.
Richards F M . 1968. The matching of physical models to three-dimensional
Richards FM, Wyckoff H W , Carlson WD, Allewell NM. Lee B, Mitsui Y. 1972. electron-density maps: A simple optical device. J Mol Biol 37:225-230.
Protein structure, ribonuclease-S and nucleotide interactions. Cold Spring Harbor Symp Quant Biol3635-43.
Willoughby TV, Morimoto CN, Sparks RA, Meyer EF. 1974. Mini-computer control of a stereo graphics display. Appl Crystallogr 7430-434.
Wright CS, Alden RA, Kraut J. 1969. Structure of subtilisin BPN’ at 2.5 A resolution. Nature 221:235-242.
Yankeelov JA Jr, Coggins JR. 1972. Construction of space-filling models of proteins using dihedral angles. Cold Spring Harbor Symp Quant B i d 36585- 587.