recognition of human iris patterns - ethesisethesis.nitrkl.ac.in/3635/1/108cs056.pdf · 2...
TRANSCRIPT

1
Recognition of Human Iris Patterns
Animesh Das
Computer Science and Engineering
National Institute of Technology, Rourkela Rourkela – 769008, Odisha, India.

2
Recognition of Human Iris Patterns
A Thesis Submitted on
14th May, 2012
in partial fulfillment of the requirements for the degree of
Bachelor of Technology in
Computer Science and Engineering by
Animesh Das
(Roll No-108CS056)
Under the Guidance of
Prof. R. Baliarsingh
Computer Science and Engineering
National Institute of Technology, Rourkela Rourkela – 769008, Odisha, India.

3
Computer Science and Engineering
National Institute of Technology, Rourkela Rourkela – 769008, Odisha, India.
Certificate
This is to certify that the work in the thesis entitled ‘Recognition of Human Iris Patterns’
submitted by Animesh Das is an original research work carried out by him under my
supervision and guidance for partial fulfillment of the requirements for the award of the
degree of Bachelor of Technology in Computer Science and Engineering during the session
2011-12 in Department of Computer Science and Engineering, NIT Rourkela.
To the best of my knowledge, the matter embodied in this report has not been
submitted to any other University/Institute.
Date -14/05/2012
Rourkela
(Prof. R. Baliarsingh)
Department of Computer Science and Engineering
NIT Rourkela

4
Acknowledgment
I express my profound gratitude and indebtedness to Prof. R. Baliarsingh, Associate
Professor, Department of Computer Science and Engineering, National Institute of
Technology, Rourkela, for introducing the present topic and for his inspiring intellectual
guidance, constructive criticism and valuable suggestions throughout my project.
I would also like to thank my parents and my friends, for their support and motivation
for completion of this project.
Date-14/05/2012
Rourkela
Animesh Das

5
Abstract
A biometric system of identification and authentication provides automatic recognition of an
individual based on certain unique features or characteristics possessed by that individual. Iris
recognition is a biometric identification method that uses pattern recognition on the images of
the iris of an individual. Iris recognition is considered as one of the most accurate biometric
methods available owing to the unique epigenetic patterns of the iris. In this project, we have
developed a system that can recognize human iris patterns and an analysis of the results is
done. A hybrid mechanism has been used for implementation of the system. Iris localization
is done by amalgamating the Canny Edge Detection scheme and Circular Hough Transform.
The iris images are then normalized so as to transform the iris region to have fixed
dimensions in order to allow comparisons. Feature encoding has been used to extract the
most discriminating features of the iris and is done using a modification of Gabor wavelets.
And finally the biometric templates are compared using Hamming Distance which tells us
whether the two iris images are same or not.

6
Contents
Certificate………………………………………………………………………………….3
Acknowledgement………………………………………………………………………...4
Abstract……………………………………………………………………………………5
List of Figures……………………………………………………………………………..8
1. Introduction…………………………………………………………………………….9
1.1 Biometric Technology………………………………………………………….10
1.2 The Human Iris…………………………………………………………………11
1.3 Iris Recognition…………………………………………………………………12
1.4 Objective………………………………………………………………………..13
2. Segmentation…………………………………………………………………………….14
2.1 Overview………………………………………………………………………..15
2.2 Literature Review……………………………………………………………….15
2.2.1 Daugman’s Integro-Differential Operator…………………………….15
2.2.2 Hough Transform……………………………………………………...16
2.2.3 Active Contour Models………………………………………………..17
2.3 Implementation…………………………………………………………………..18
3. Normalization…………………………………………………………………………….20
3.1 Overview…………………………………………………………………………21

7
3.2 Literature Review………………………………………………………………..21
3.2.1 Daugman’s Rubber Sheet Model………………………………………21
3.2.2 Image Registration……………………………………………………..23
3.2.3 Virtual Circles………………………………………………………….23
3.3 Implementation…………………………………………………………………...24
4. Feature Encoding………………………………………………………………………..26
4.1 Overview………………………………………………………………………...27
4.2 Literature Review………………………………………………………………..27
4.2.1 Gabor Filter…………………………………………………………….27
4.2.2 Haar Wavelet…………………………………………………………...29
4.2.3 Zero Crossings of the 1D Wavelet……………………………………..29
4.3 Matching………………………………………………………………………….30
4.4 Implementation…………………………………………………………………...30
5. Results and Discussion…………………………………………………………………...33
5.1 Segmentation……………………………………………………………………..34
5.2 Normalization………………………………………………………………….....36
5.3 Accuracy………………………………………………………………………….37
6. Conclusion………………………………………………………………………………...39
7. References………………………………………………………………………………...41

8
List of Figures
No. Figure Caption Page No.
1.1 A front view of the human
iris
11
2.1 Application of canny edge
detection on eye image
19
3.1 Daugman’s rubber sheet
model
22
3.2 Overview of the
normalization process
25
4.1 A quadrature pair of Gabor
filters
28
4.2 An example of the encoding
process
32
5.1 Original image ‘S1001L01_0001’
34
5.2 Segmented iris image 34
5.3 Segmented image with noise detection
35
5.4 An example where segmentation fails
35
5.5 Normalization process on two sample images
36
5.6 FRR/FAR paired error graph 38

9
Chapter 1
Introduction
Biometric Technology
The Human Iris
Iris Recognition
Objective

10
Chapter 1
Introduction
1.1 Biometric Technology
Biometrics refers to the identification or authentication of an individual based on certain
unique features or characteristics. Biometric identifiers are the distinctive and measurable
features that is used to label and describe individuals [1]. There are two categories of
biometric identifiers namely physiological and behavioural characteristics [2]. Iris,
fingerprint, DNA, etc. belong to the former kind of biometric identifiers whereas typing
rhythm, gait, voice, etc. belong to the latter.
A biometric system usually functions by first capturing a sample of the feature, such as
capturing a digital colour image of a face to be used in facial recognition or a recording a
digitized sound signal to be used in voice recognition. The sample may then be refined so that
the most discriminating features can be extracted and noises in the sample are reduced. The
sample is then transformed into a biometric template using some sort of mathematical
function. The biometric template is a normalized and efficient representation of the sample
which can be used for comparisons. Biometric systems usually have two modes of
operations. An enrolment mode is used for adding new templates into the database and the
identification mode is used for comparing a template created for an individual, who wants to
be verified, with all the existing templates in the database.

11
A good biometrics is one which uses a feature that is highly unique. This reduces the chances
of any two people having the same characteristics to the minimal. The feature should also be
stable so that it does not change over the period of time.
1.2 The Human Iris
The iris is a thin circular anatomical structure in the eye. The iris’s function is to control the
diameter and size of the pupils and hence it controls the amount of light that progresses to the
retina. A front view of the iris is shown in Figure 1.1. To control the amount of light entering
the eye, the muscles associated with the iris (sphincter and dilator) either expand or contract
the centre aperture of the iris known as the pupil.
The iris consists of two layers: the pigmented front fibro vascular called as stroma and
beneath it are the pigmented epithelial cells [3]. The stroma is connected to the sphincter
muscle which is responsible for the contraction of the pupil and also to the set of dilator
muscles, responsible for the enlargement of the pupil which it does by pulling the iris radially
[14]. The iris is divided into two basic regions: the pupillary zone, whose edges form the
boundary of the pupil and the ciliary zone which constitutes the rest of the iris [3].
Figure 1.1 – A front view of the Human Iris

12
1.3 Iris Recognition
The iris is a well-protected organ that is externally visible and whose epigenetic patterns are
very unique and remain stable throughout most of a person’s life [13]. Its high uniqueness
and stability makes it a good biometrics that can be used for identifying individuals. These
unique patterns can be extracted using image processing techniques employed on a digitized
image of the eye and then the results can be encoded into a biometric template which can
later be stored in a database for future comparisons. The biometric template is usually created
using some sort of mathematical operations. If an individual wants to be identified by the
system, then first a digitized image of their eye is first produced, and then a biometric
template is created for their iris region. This biometric template is compared with all the other
pre-existing templates in the database using certain matching algorithms in order to get the
identification of the individual.
Although prototype systems of an iris recognition model had been proposed earlier, it was
only in the 1990’s that Professor John Daugman (University of Cambridge) implemented a
working model [4] [5]. The Daugmans system is patented and has been licensed to many
commercial developers of the iris recognition system. Though the Daugman system has been
the most popular and successful system known, there are many other efficient systems that
have been developed. The most notable of them are Wildes et al. [6], Boles and Boashash [7],
Lim et al. [8] and Noh et al. [9].
A large number of studies have tested the Daugman system and all have reported a failure
rate of zero. It’s claimed that the Daugman system can identify an individual perfectly from a
million possibilities. The Wildes et al. system also has a flawless performance [6], whereas
the Lim et al. system achieves an accuracy rate of 98.4 % [8].

13
Iris recognition can be considered as one of the most reliable and accurate method of
biometric technology when compared with other biometric technologies such as face,
fingerprint and speech recognition [13].
1.4 Objective
The objective of this project is to implement a system that can recognise human iris patterns
to be used for biometric identification. The tool that will be used to develop this system will
be MATLAB®. The projects emphasis will be on creating software that can perform iris
recognition instead of hardware components to capture an eye image.
The system will consist of a number of sub-systems, corresponding to each stage of iris
recognition. The stages can be classified as segmentation (localizing the iris in an image),
normalization (fixed dimensional representation of the iris region) and feature encoding
(creating a biometric template by applying certain mathematical operations). The dataset used
in this project is the CASIA database [10] which contains a total of 2657 greyscale images.

14
Chapter 2
Segmentation
Overview
Literature Review
Implementation

15
Chapter 2
Segmentation
2.1 Overview
The first part of iris recognition is to isolate or localize the actual iris region from the digital
eye image. The iris region can be thought of as two circles, one circle forming the iris/sclera
boundary and the other forming the iris/pupil boundary. Eyelids and eyelashes are also
present which usually cover the upper and lower parts of the iris region. Specular reflections
can also occur inside the iris region which may corrupt the iris pattern. So the technique used
must be able to exclude these noises and localize the circular iris region.
The degree to which the segmentation applied succeeds will greatly depend on the data set
being used. Images where specular reflection occurs can hamper the process of segmentation.
If the eyelids and eyelashes cover too much of the iris region then the segmentation process
may not result in a success. The segmentation process is very critical as data that has been
localized incorrectly will result in very poor recognition rates.
2.2 Literature Review
2.2.1 Daugman’s Integro-differential Operator
This method was proposed by Daugman in order to localize the iris region [5]. The operator
assumes the pupil and limbus region to be circular contours and it performs circular edge
detection. The upper and lower eyelids are also detected using the Integro-differential

16
operator by changing the contour search to a designed arcuate from circular. The Integro-
differential operator is defined as [5]:
( ) | ( )
∮
( )
|
Where I(x, y) is the input eye image, r being the radius that is to be searched for, Gσ is a
Gaussian function used for smoothing and s is the circle contour given by r,x0 and y0. The
operator makes a pixel-wise search through the input image and obtains the partial derivative
(blurred) of the integral over circular contours that have been normalized in different
contours. The boundaries of the pupil and the limbus are supposed to make the contour
integral derivative maximum, the point where there will be a sudden change in the values of
intensity over the circular borders.
2.2.2 Hough Transform
Hough transform is a standard image processing technique and analysis tool that is used for
finding curves and shapes that can be represented in a parametric form such as lines, circles
and polynomials. The recognition of some global pattern is achieved by using the local
patterns. For example, a circle can be detected in an image by using the strong edges in an
image as local patterns and searching for circular Hough transform’s maximum value.
Wildes et al. make use of this technique to localize irises [6]. The localization method is also
based on the first derivative of the image just like Daugman’s method. In the method that was
proposed by Wildes et al. an edge map is obtained first by thresholding the image intensity
gradient’s magnitude:
| ( ) ( )|

17
Where (
) and ( )
( ) ( )
. G(x, y) is a Gaussian function
used for smoothing with the scalar parameter σ which is used to select the proper scale. A
voting process is then used on the edge map to maximize the Hough transform defined for the
contour desired. Taking the obtained edge points as ( ) a Hough
transform can be written as:
( ) ∑ (
)
Where
( ) { ( )
The limbus and pupil are modelled as circles. The parametric function g is defined as:
( ) ( ) ( )
Assuming a circle with its centre (xc, yc) and radius r, the points that fall on the circle result in
a zero when evaluated by the function.
2.2.3 Active Contour Models
Active contour models have been used by Ritter et al. [11] for localizing the pupil in digitized
eye images. They respond to already set internal as well as external forces by either
deforming internally or moving around an image until a state of equilibrium is reached. The
contour contains some number of vertices, whose positions can be varied by two opposing
forces, an internal force, which is dependent on the characteristics desired and an external
force, which is dependent on the image. The equation in which each vertex is moved between
time t and t+1 is given as:

18
( ) ( ) ( ) ( )
Where Fi is the internal force, Gi is the external force and vi is the vertex position i. For
localizing the pupil region, the internal forces have to be calibrated such that the contours can
form a globally expanding but discrete circle.
2.3 Implementation
Of all the various approaches available circular Hough transform was used for localizing the
iris. It involves first using canny edge detection on the eye image so as to generate an edge
map. The gradients were first biased in the vertical direction so as to detect the outer
iris/sclera boundary as had been suggested by Wildes et al. [6]. The horizontal and vertical
gradients were weighted equally so as to detect the inner iris/pupil boundary.
To minimize the search range, the range of radius values of images in the CASIA [13]
database (which was known beforehand) were set manually. In the CASIA database, the
value of the pupil radius ranges from 25 to 75 pixels and that of the iris ranges from 90 to 160
pixels. To make the circle detection process more accurate and efficient, the Hough transform
for the outer boundary was performed first and then the Hough transform for the inner
boundary was performed, instead of the whole eye since we know that the pupil will always
be contained in the iris region. On completion of this process, six parameters are stored, the
radius and centre co-ordinates (x,y) of both the circles.
Eyelids were first isolated by fitting a line to both the upper as well as lower eyelid using
linear Hough transform. Then a second horizontal line is drawn which intersects the first line
at that iris edge which is closest to the pupil. The second horizontal line is used as it allows
maximum isolation of the eyelid regions. Canny edge detection was used to create the edge
map and the information in the horizontal gradient was only taken. The lines were also

19
restricted to lie exterior to the pupil region and interior to the iris region. Instead of parabolic
Hough transform, the linear version is used since there are fewer parameters to deduce and
hence it makes the process less computationally demanding.
For isolating eyelashes as well as specular reflections, a simple thresholding method is used
since it is known that eyelashes are generally quite dark in comparison to the rest of the
image and specular reflections are usually characterised by high pixel values.
Figure 2.1: Application of canny edge detection on eye image

20
Chapter 3
Normalization
Overview
Literature Review
Implementation

21
Chapter 3
Normalization
3.1 Overview
On having successfully segmented the eye image, the next step is to transform the iris region
of the eye image so that it has fixed dimensions in order to allow the feature extraction
process to compare two images. Dimensional inconsistencies may arise in eye images mainly
due to dilation of the pupil which causes the stretching of the iris. Pupil dilation usually
occurs due to varying levels of illumination falling on the eye. The other causes of
inconsistency are, varying imaging distance, camera rotation, head tilt, and rotation of the eye
within the socket. The normalization process will produce iris regions having constant
dimensions such that two images of the same iris taken at different conditions and time will
have the same characteristics features at the same locations spatially.
3.2 Literature Review
3.2.1 Daugman’s Rubber Sheet Model
Daugman [5] had devised a homogenous rubber sheet model which remapped each point
inside the iris region onto a pair of polar co-ordinates (r, θ) where r ranges from [0, 1] and θ
ranges from [0, 2 ].

22
Figure 3.1 – Daugman’s rubber sheet model [5]
The Cartesian to polar transform can be written as:
( ) ( ) ( ) ( )
( ) ( ) ( ) ( )
With
( ) ( ) ( )
( ) ( ) ( )
( ) ( ) ( )
( ) ( ) ( )
Where I(x, y) is the iris image, (x, y) are the actual Cartesian co-ordinates, (r, θ) are their
corresponding polar co-ordinates and xp , yp and xi , yi are the co-ordinates of pupil and iris
boundaries respectively along the θ direction. The rubber sheet model does take into account
size inconsistencies and pupil dilation and then produces a normalized pattern representation
with fixed and constant dimensions.

23
3.2.2 Image Registration
The Wildes et al. [6] had proposed a technique based on image registration that could be used
to normalize iris patterns. This technique geometrically wraps a new image, Ia(x, y) into
aligning with an image in the database, Id(x, y). The alignment process is actually a
transformation done by choosing a mapping function, (U(x, y), V(x, y)). The mapping
function should minimize the function:
∫ ∫( ( ) ( )
The alignment process also compensates for the rotational and scale variations. The mapping
function is constrained so as to capture a similarity transformation on image co-ordinates (x,
y) to (x’, y’). It is represented as:
(
) (
) ( ) (
)
Where s is the scaling factor and R (Ø) is a matrix that represents rotation by Ø. The
parameters s and Ø have to be recovered using an iterative minimization process.
3.2.3 Virtual Circles
The Boles system [7] uses a method in which the iris images are first scaled so that all images
have a constant diameter. Hence while comparing two images, one of the images are chosen
as a reference image. This method is different from other methods in the sense that
normalization is not done till we are trying to match two images. Once the two irises have
been normalized to have constant dimensions features are extracted from the iris region by
storing the values of the pixel intensities along virtual concentric circles with the pupil’s

24
centre being the origin. A normalization resolution is done so as to have the same number of
data points extracted from each iris.
3.3 Implementation
To normalize the iris region a technique similar to Daugman’s rubber sheet model was used.
The pupil’s centre was chosen as the reference point and there are redial vectors that pass
through the iris region. Along each radial line, certain numbers of data points are chosen and
this is called as the radial resolution. The total number of radial lines that are going around
the iris region is called as the angular resolution. Pupils may always not be concentric with
the iris. For such situations a remapping formula is used to rescale the points depending on
the angle it makes around the circle. This is given by:
√ √
With
( (
) )
Where r’ is the distance between the edge of the iris and the edge of the pupil made at an
angle an angle θ , r1 is the radius of the iris and ox ,oy are the displacement of the centre of the
pupil with respect to the centre of the iris.

25
Figure 3.2 – Overview of the normalisation process (with radial resolution
taken as 10 pixels and angular resolution taken as 40 pixels).
A definite number of points are to be chosen along each radial line, so that a constant number
of radial points are got, irrespective of whether the radius is narrow or wide at some
particular angle. The normalized patterns are created by backtracking in which the Cartesian
co-ordinates of data points are found out from the angular and radial position present in the
normalized pattern. Normalization on the iris region produces a 2D array where the
horizontal dimensions represent angular resolution and vertical dimensions represent radial
dimensions. A 2D array is also created for marking eyelashes, eyelids and reflections that
may have been detected in the segmentation process.
r
θ

26
Chapter 4
Feature Encoding
Overview
Literature Review
Matching
Implementation

27
Chapter 4
Feature Encoding
4.1 Overview
To provide for an accurate method of recognition of individuals, the features which are most
distinctive in an iris pattern must be extracted. Only these significant parts must be extracted
so that they can be encoded into biometric templates which can be used for comparisons. Iris
recognition systems usually use band-pass method to decompose an iris image into a
biometric template. The biometric templates generated in this process can be compared
together using an appropriate matching algorithm.
Wavelets are usually used to decompose the data in an iris image into different components.
A number of wavelet filters are applied on the normalized iris region, one for each of the two
resolutions with each wavelet being a scaled version of some mathematical operation. The
output of convolving the wavelets is encoded into a biometric template which can be used for
comparison.
4.2 Literature Review
4.2.1 Gabor Filter
A set of Gabor filters which have different frequencies and correspond to different
orientations can be used in extracting useful information or features from an image. The

28
frequency and orientation representation offered by Gabor filters are similar to those in the
human visual system, and hence they have been found to be particularly useful in texture
representation and discrimination. In the spatial domain, a 2D Gabor filter is actually a
sinusoidal plane wave that is modulated by a kernel Gaussian function [16].
Decomposition of a signal is actually done by using a quadrature pair of Gabor filters. The
real filter or even symmetric component is specified by a sine wave modulated by a Gaussian
function and the imaginary filter or odd symmetric component is specified by a cosine wave
modulated by a Gaussian. A 2D Gabor filter applied on an image (x, y) is represented as [12]:
( )
( )
( )
( ) ( )
Where (x0, yo) specify the position of the image, (α, β) specify the effective length and width
and (u0, vo) specify modulation with a spatial frequency √ . The real and
imaginary 2D Gabor filters are shown in Figure 4.1.
Figure 4.1 – A quadrature pair of Gabor filters.
Daugman [5] had demodulated the output produced by convolving the Gabor filters by
quantising the phase information in order to compress the amount of data that was produced.
The phase information was quantised into four levels, one for each quadrant in the complex

29
plane. From this quantised information a biometric template is created which can be used for
comparisons. The phase quantisation process can be written as [5]:
{ } { } ∫ ∫ ( ) ( ) ( ) ( )
Where { } is a complex valued bit dependent on the sign of the 2D integral and ( ) is
the iris image in polar form.
4.2.2 Haar Wavelet
Instead of Gabor wavelets, Lim et al. [8] made use of Haar wavelets to extract features from
the eye image. From multi-dimension filtering, a feature vector which consisted of 87
dimensions was computed [8]. As each dimension is real valued with a range from -1.0 to
+1.0, the feature vector was sign quantised in which the positive values are represented by 1
and negative values by 0. Lim et al. had compared the use of both Gabor and Haar wavelet
and had analysed that the recognition rate with Haar wavelet was 0.9% better then Gabor
wavelet [8].
4.2.3 Zero crossings of the 1D wavelet
1D wavelets were used by Boles and Boashash [7] to extract features. The wavelet was
defined as a second derivative of a smoothing function.
( ) ( )
The zero crossings obtained from the dyadic scales of the above filters are used to encode
features from the image. The wavelet transform for the signal is given as:
( )
( ) Where ( ) ( )

30
4.3 Matching
Hamming Distance
Hamming distance is used as a matching algorithm to compare two biometric templates. It
gives us knowledge of the number of bits that are same in two bit patterns. Upon using
hamming distance we are able to decide whether two patterns were generated from the same
iris or from different irises.
For comparing the two bit patterns X and Y , the hamming distance is defined as the sum of
the exclusive-or ( XOR) between X and Y over N , the total number of bits present in the bit
pattern.
∑ ( )
4.4 Implementation
For implementing feature encoding the normalized iris patterns were convolved with 1D Log-
Gabor wavelets. One disadvantage with Gabor filters is that there exist some DC components
in the even symmetric filter. However when using Log-Gabor filter (a Gabor filter which is
Gaussian but on a logarithmic scale) all the DC components are removed. Log-Gabor filters
can be represented as:
( )
( ( ( ) )
( (
) )
)
Where f0 is the centre frequency and σ is the filter bandwidth.

31
The 2D normalized iris patterns are broken up into a number of 1D signals which are then
convolved with the above 1D Gabor wavelets. Each row of the normalized iris pattern is
considered as the 1D signal. Here each row corresponds to one circular ring on the iris region.
The output obtained from filtering is then demodulated and phase quantized using
Daugman’s method [5]. The output is phase quantised to four levels, one for each quadrant in
the complex plane and each filter produces two bits of data in each phasor [15]. The output is
depicted in grey code. This is done because while going from one quadrant to another only 1
bit will change.
The feature encoding process produces a bitwise biometric template containing information
in the form of bits and a noise mask corresponding to the same image which depicts the
corrupt areas or noise patterns in the iris and marks those bits in the template. The regions
where amplitude is zero are also marked as noises as the phase information obtained from
those points are meaningless. The size of the template will depend on the size of the radial
resolution, the angular resolution and the number of filters being used. Figure 4.2 gives an
illustration of the entire feature encoding process.

32
Figure 4.2 – An example of the encoding process.

33
Chapter 5
Results and Discussion
Segmentation
Normalization
Accuracy

34
Chapter 5
Results and Discussion
Segmentation
The automatic model implemented for the segmentation process proved to be quite
successful. The images in the CASIA database had been specifically taken for research
related to iris recognition and hence the boundaries between the iris, the pupil and the sclera
were quite distinctive. The segmentation technique when applied on the CASIA database had
a success rate of 80%.
Figure 5.1 – Original Image ‘S1001L01_0001’ Figure 5.2 – Segmented iris image
(CASIA)[10]

35
Figure 5.3 – Segmented image with noise detection
There were certain images upon which the segmentation process failed owing to the fact that
there was little contrast between pupil and the iris regions and hence canny edge detection
failed to find the proper edges.
Figure 5.4 – An example where segmentation fails.
36
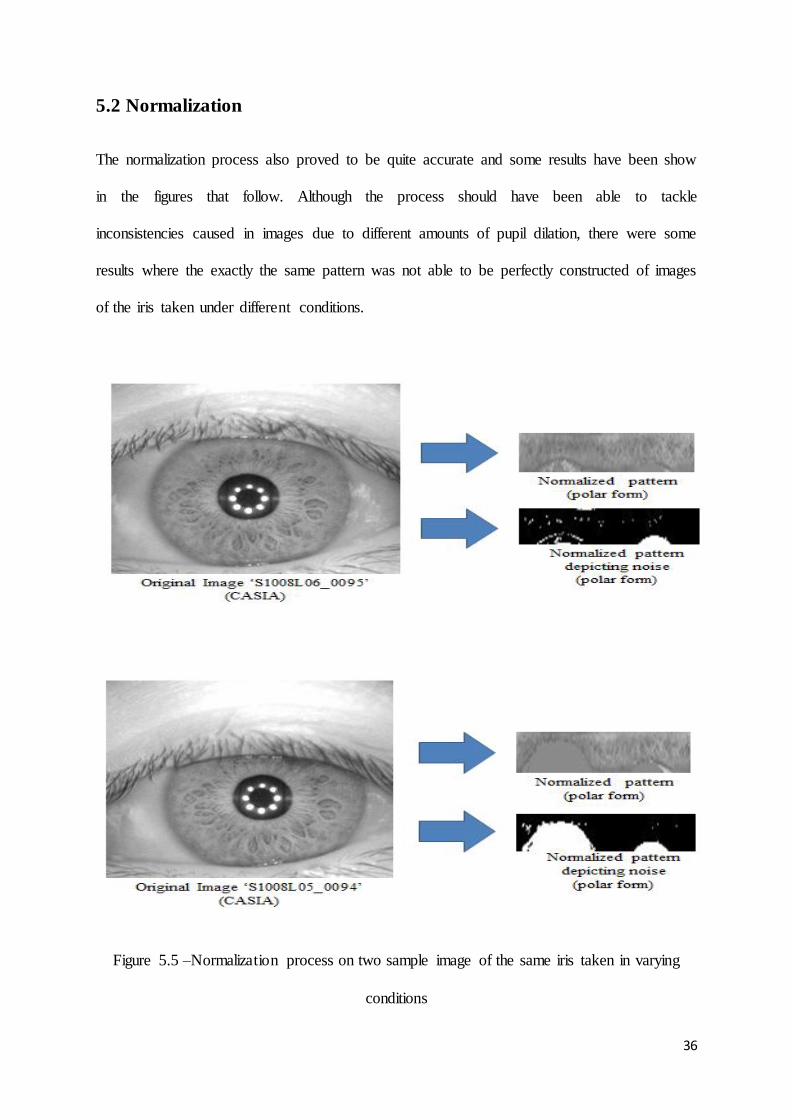
5.2 Normalization
The normalization process also proved to be quite accurate and some results have been show
in the figures that follow. Although the process should have been able to tackle
inconsistencies caused in images due to different amounts of pupil dilation, there were some
results where the exactly the same pattern was not able to be perfectly constructed of images
of the iris taken under different conditions.
Figure 5.5 –Normalization process on two sample image of the same iris taken in varying
conditions

37
5.3 Accuracy
The False Reject Rate (FRR) measures the probability that an individual who has enrolled
into the system is not identified by the system. It is also known as Type-I error.
FRR can be calculated as:
( )
And
∑ ( )
Where N is the total number of enrolments.
The False Acceptance Rate (FAR) measures the probability that an individual who may have
or have not enrolled into the system is identified as another individual. It is also known as a
Type-II error.
FAR can be calculated as:
( )
And
∑ ( )
Where N is the total number of enrolments.

38
From experimental results it is found that the iris recognition has a FRR of 5.26 % and FAR
of 4.72 %. The result for FAR/FRR are plotted and shown in figure 5.6.
Figure 5.6 – FRR/FAR paired error graph

39
Chapter 6
Conclusion

40
Chapter 6
Conclusion
The iris recognition system that was developed proved to be a highly accurate and efficient
system that can be used for biometric identification. The project again proved that iris
recognition is one of the most reliable methods available today the biometrics field. The
accuracy achieved by the system was very good and can be increased by the use of more
stable equipment and conditions in which the iris image is taken. The applications of the iris
recognition system are innumerable and have already been deployed at a large number of
places that require security or access control.

41
References
[1] Jain, A., Hong, L., & Pankanti, S. "Biometric Identification". Communications of the
ACM, 43(2), p. 91-98. DOI 10.1145/328236.328110, 2000.
[2] Jain, Anil K.; Ross, Arun. "Introduction to Biometrics". Jain, AK; Flynn, P; Ross, A.
Handbook of Biometrics. Springer. pp. 1–22. ISBN 978-0-387-71040-2., 2008.
[3] eye, human."Encyclopædia Britannica” from Encyclopædia Britannica Ultimate
Reference Suite DVD, 2006
[4] J. Daugman. How iris recognition works. Proceedings of 2002 International Conference
on Image Processing, Vol. 1, 2002.
[5] J. Daugman. Biometric personal identification system based on iris analysis. United States
Patent, Patent Number: 5,291,560, 1994.
[6] R. Wildes. Iris recognition: an emerging biometric technology. Proceedings of the IEEE,
Vol. 85, No. 9, 1997.
[7] W. Boles, B. Boashash. A human identification technique using images of the iris and
wavelet transform. IEEE Transactions on Signal Processing, Vol. 46, No. 4, 1998.
[8] S. Lim, K. Lee, O. Byeon, T. Kim. Efficient iris recognition through improvement of
feature vector and classifier. ETRI Journal, Vol. 23, No. 2, Korea, 2001.
[9] S. Noh, K. Pae, C. Lee, J. Kim. Multiresolution independent component analysis for iris
identification. The 2002 International Technical Conference on Circuits/Systems, Computers
and Communications, Phuket, Thailand, 2002.

42
[10] Chinese Academy of Sciences – Institute of Automation. Database of Greyscale Eye
Images. http://www.sinobiometrics.com Version 1.0, 2003.
[11] N. Ritter. Location of the pupil-iris border in slit-lamp images of the cornea. Proceedings
of the International Conference on Image Analysis and Processing, 1999.
[12] 3D surface tracking and approximation using Gabor filters, Jesper Juul Henriksen, South
Denmark University, March 28, 2007
[13] S. Sanderson, J. Erbetta. Authentication for secure environments based on iris scanning
technology. IEE Colloquium on Visual Biometrics, 2000.
[14] E. Wolff. Anatomy of the Eye and Orbit. 7th edition. H. K. Lewis & Co. LTD, 1976.
[15] A. Oppenheim, J. Lim. The importance of phase in signals. Proceedings of the IEEE 69,
529-541, 1981.
[16] T. Lee. Image representation using 2D Gabor wavelets. IEEE Transactions of Pattern
Analysis and Machine Intelligence, Vol. 18, No. 10, 1996.