recognition of driving postures by multiwavelet transform
TRANSCRIPT

Engineering Applications of Artificial Intelligence 25 (2012) 1677–1686
Contents lists available at SciVerse ScienceDirect
Engineering Applications of Artificial Intelligence
0952-19
http://d
n Corr
E-m
journal homepage: www.elsevier.com/locate/engappai
Recognition of driving postures by multiwavelet transformand multilayer perceptron classifier
Chihang Zhao a,n, Yongsheng Gao b, Jie He a, Jie Lian a
a College of Transportation, Southeast University, Nanjing 210096, PR Chinab School of Engineering, Griffith University, Brisbane, QLD 4111, Australia
a r t i c l e i n f o
Article history:
Received 17 July 2011
Received in revised form
30 July 2012
Accepted 20 September 2012Available online 16 October 2012
Keywords:
Driving postures
Feature extraction
Multiwavelet transform
Multilayer perceptron classifier
Driver behaviors
76/$ - see front matter Crown Copyright & 2
x.doi.org/10.1016/j.engappai.2012.09.018
esponding author.
ail address: [email protected] (C. Zhao
a b s t r a c t
To develop Human-centric Driver Assistance Systems (HDAS) for automatic understanding and
charactering of driver behaviors, an efficient feature extraction of driving postures based on
Geronimo–Hardin–Massopust (GHM) multiwavelet transform is proposed, and Multilayer Perceptron
(MLP) classifiers with three layers are then exploited in order to recognize four pre-defined classes of
driving postures. With features extracted from a driving posture dataset created at Southeast University
(SEU), the holdout and cross-validation experiments on driving posture classification are conducted by
MLP classifiers, compared with the Intersection Kernel Support Vector Machines (IKSVMs), the k-
Nearest Neighbor (kNN) classifier and the Parzen classifier. The experimental results show that feature
extraction based on GHM multwavelet transform and MLP classifier, using softmax activation function
in the output layer and hyperbolic tangent activation function in the hidden layer, offer the best
classification performance compared to IKSVMs, kNN and Parzen classifiers. The experimental results
also show that talking on a cellular phone is the most difficult one to classify among four predefined
classes, which are 83.01% and 84.04% in the holdout and cross-validation experiments respectively.
These results show the effectiveness of the feature extraction approach using GHM multiwavelet
transform and MLP classifier in automatically understanding and characterizing driver behaviors
towards Human-centric Driver Assistance Systems (HDAS).
Crown Copyright & 2012 Published by Elsevier Ltd. All rights reserved.
1. Introduction
Intelligent Transportation System (ITS) community has beenvery interested in the development of an intelligent DriverAssistance System (DAS) that continuously monitors not onlythe surrounding environment and the status of vehicle, but alsothe driver’s behaviors. Driving is stressful and requires intensivecognitive processing from the driver, as well as carefully perform-ing maneuvers. As a result, recent research on vehicle automationhas focused on developing Human-centric Driver AssistanceSystems (HDAS), which include integrated sensing, processingand networking. These systems aim to find solutions to trafficproblems, such as traffic accidents and traffic congestion, andbring together the factors of people, roads and vehicles into aunified consideration. Automatic understanding and characterizingof driver behaviors is one of the key aspects for the developmentof HDAS.
A driver’s behaviors reflect his or her driving conditions, suchas attention, fatigue levels and other unsafe actions including
012 Published by Elsevier Ltd. All
).
eating and talking on a cellular telephone. They will reduce thedriver’s alertness to the vehicle’s surrounding environment, andare more prone to being inattentive. Nadeau et al. Nadeau et al.(2003) carried out an epidemiological study on two large cohorts,namely users and non-users of cell phones, and the mostsignificant finding was that the adjusted relative risks for heavyusers were at least two times to those making minimal use of cellphones. To develop an effective driver behavior recognitionsystem, two important techniques have to be included, i.e., howto efficiently describe a driver’s postures or maneuvers, and howto reliably classify the postures accordingly.
The driver’s body information can be obtained in untetheredmanner using vision sensors. In the last decade, many newtechniques have been proposed for the recognition of somesimplified driving postures, such as moving forward, turning leftand turning right. Simon and Berger (Simon and Berger, 1998)presented a model registration system capable of tracking anobject, and the heart of the model registration system is the posecomputation method, which handles various features, such aspoints, lines and freeform curves. Oliver and Pentland (Oliver andPentland, 2002) proposed a machine learning framework formodeling and recognizing a driver’s movements, with emphasison how the context affects the driver’s performance using
rights reserved.

C. Zhao et al. / Engineering Applications of Artificial Intelligence 25 (2012) 1677–16861678
graphical models, Hidden Markov Models (HMMs) and CoupledHidden Markov Models (CHMMs). Liu et al. (2002) described avision system that tracks the driver’s face and estimates faceposes while driving using yaw orientation angles. Eren et al.(2007) presented a stereo vision system for predicting driver’sface poses using Principle Components Analysis (PCA). Sekizawaet al. (2007) designed an intelligent system of modeling driver’scollision avoidance behaviors at the moment that a vehicle aheadis brought to a sudden halt. Watta et al. (2007) presented a visionsystem that recognizes the directions, at which the driver islooking, using a nearest neighbor-neural network classifier. Tranet al. (2012) developed a vision-based framework for driver footbehavior analysis using optical flow for foot tracking, and aHidden Markov Model (HMM) based technique to characterizethe temporal foot behavior. Adam and Untaroiu (2011) proposeda methodology for classification of pre-crash occupant postureusing a Bayesian classification approach. Nine predefined classesof occupant postures were simulated with a human model, andthe corresponding data was recorded using sensor models imple-mented in a mid-size car interior.
To address the problem of lacking stable illumination inimages captured during driving by a color camera, Kato et al.(2004) developed a far infrared camera system to recognize thedirections of the driver’s gaze using the feature points of nose,mouth and ears. Ki et al., (2007) researched the gaze-based 3Dinteraction techniques on stereo display, such as parallax barrieror lenticular stereo display. Cheng et al. (2007) introduced amultiple video-based system for recognizing the driver’s bodyorientation using images of the driver’s head from thermal andcolor cameras, hands images from thermal cameras, and steeringwheel angle data from Controller Area Network (CAN) bus of thevehicle. Demirdjian and Varri (Demirdjian and Varri, 2009) usedan infrared time-of-flight (TOF) camera to estimate the locationand orientation of a driver’s limbs, including arms, hands, headand torsion. Also, Cheng and Trivedi (Cheng and Trivedi, 2006)suggested identifying a driver’s body pose using a commercialmotion-capture system that uses retroreflective markers placedon the driver’s head, right hand and left hand. Yang et al. (2009)presented an ECG system to monitor a driver’s sitting postures,i.e., forward movement, back movement, right back movementand left back movement. In (Cheng and Trivedi, 2010), a modifiedhistogram-of-oriented-gradients feature descriptor and a supportvector machine were used to classify occupants of the front seatsas driver, passenger, or none.
Most of the above research works for driver activities recogni-tion focused on the detection of driver face direction, headorientation and gaze, etc. Although many other kinds of motion-capture technologies exist in the literature to recover body posesby using different kind of sensors like mechanical, magnetic oroptical marker-based sensors to provide either three Degrees-Of-Freedom (DOF) position of a point on the subject’s body or full sixDOF body-part position and orientation, such techniques have thebiggest disadvantage that a subject is required to attach thesensor device or markers to his/her cloth or body, which is nota natural way of monitoring a driver’s activities. So, it is unlikelythat drivers would accept any tethered sensing solution, i.e. usingwired sensors or wireless sensors attached to the driver’s body.For this reason, image-based motion-capture would be moreapplicable in a consumer car without the requirement of specialmarkers or user intervention. A few of recent works attempted torecognize and understand the driver’s postures, such as graspingthe steel wheel, operating the shift lever, eating a cake and talkingon a cellular telephone by using the image-based system. OnlyHarini et al. (2005, 2007) proposed an agglomerative clusteringand a Bayesian Eigen-image classifier to recognize two types of adriver postures: safe type and unsafe type with a side-mounted
camera capturing the driver’s profile. How to characterize morerealistic driving postures, however, is still a challenging problem.
A decisive step in developing image-based driver posturerecognition is to extract suitable feature representation of thedriver images and characterize the differences between differentdriving postures. In this paper, we propose an efficient featureextraction of driving postures based on Geronimo–Hardin–Mas-sopust (GHM) multiwavelet transform, to describe driving pos-tures. And Multilayer Perceptron (MLP) classifiers, compared withthe Intersection Kernel Support Vector Machines (IKSVMs), the k-Nearest Neighbor (kNN) classifier and the Parzen classifier, are theredefined classes of driving postures: grasping the steel wheel,operating the shift n exploited in classifying feature vectors intoone of the four lever, eating a cake and talking on a cellulartelephone. The rest of this paper is organized as follows. InSection 2, the background of Southeast University (SEU) drivingposture data acquisition and normalization is outlined. In Section3, feature extraction by GHM multiwavelet transform is intro-duced. MLP classifier is presented in Section 4. Section 5 intro-duces IKSVMs, kNN classifier and Parzen classifier. Section 6details the experiments and reports the classification results forthe driving postures. Finally, Section 7 gives our conclusions.
2. Driving posture data acquisition and normalization
Driving posture dataset is collected in this work by using a side-mounted Logitech C905 CCD camera. There are 10 male drivers and10 female drivers in the driving postures dataset (SoutheastUniversity (SEU) dataset), and the lighting varied under the naturaloutdoor conditions, as the car was in an outdoor parking lot. TheSEU driving posture dataset consists of four driving postures, i.e.,grasping the steering wheel, operating the shift lever, eating a cakeand talking on a cellar phone. Fig. 1 shows samples of our SEUdriving posture dataset consisting of 80 driving posture images,each with a resolution of 480�640 pixels.
In order to address the problem of illumination variations inimages of SEU driving postures dataset, the well-known normal-ization technique, called Homomorphic Filter (HOMOF), isadopted to enhance the image quality (Heusch et al., 2005). WithHOMOF, the images are first transformed into logarithm and thena frequency domain to emphasize the high frequency compo-nents. Then the images are transformed back into spatial domainby applying the inverse Fourier transform, followed by appro-priate exponential operation. The objects of interest in the drivingimages are the skin-like regions, such as the driver’s head, righthand and left hand. It is a fact that human skin tones have verysimilar chromatic properties regardless of race, and skin-colordetection can be fairly robust under certain illumination condi-tions. The classification of color pixels into skin tones and non-skin tones can be performed by working in the normalized RGBspace. An RGB triplet (r, g, b) with values for each primary colorbetween 0 and 255 is normalized into the triplet (r0, g0, b0) byusing the following relationships:
r0 ¼255r
rþgþb, g0 ¼
255g
rþgþb, b0 ¼
255b
rþgþbð1Þ
The normalized color (r0, g0, b0) is classified as a skin-color if itlies within the region of the normalized RGB space described bythe following rules (Vezhnevets et al., 2003).
r0495, g0445, b420
maxr0,g0,b0�minr0,g0,b0415
r0�g0415, r04b0
8><>: ð2Þ
Fig. 2 shows the skin-color segmentation results of the fourexample images preprocessed by HOMOF.

Fig. 1. Example images of SEU driving posture dataset. (a) Grasping the steering wheel (b) operating the shift lever, (c) eating a cake and (d) talking on a cellular phone.
Fig. 2. Skin-color segmentation preprocessed by HOMOF. (a) Grasping the steering
wheel (b) operating the shift lever, (c) eating a cake and (d) talking on a cellular phone.
C. Zhao et al. / Engineering Applications of Artificial Intelligence 25 (2012) 1677–1686 1679
3. Feature extraction using multiwavelet transform
Vision-based human body pose recognition is challenging,primarily because of the wide range of configurations andappearances of a human body, and its tendency to occlude itselfin images. The problem is further complicated by the vehicularrequirement for algorithms to be robust to changing illumination.In this section, we show the potential of using the exposed skinspatial position of the driver’s head, right hand and left hand tobuild the driver’s posture features. Generalizing the wavelet case,one can allow a multiresolution analysis {Vn}, nAN, of L2(R) to begenerated by a finite number of scaling functions f(t)¼(f0(t),f1(t),y, fm�1(t))T, where mAN and t is a time variable (Strelaet al., 1999). Then, the multiscaling function f(t)T verifies a 2-scale equation
UðtÞ ¼Xm�1
c ¼ 0
L1½c�ffiffiffi2p
Uð2t�cÞ ð3Þ
where 0rcfrm�1 and L1[c] is a m�m low-pass matrix withreal coefficients. The multiresolution analysis structure givesV1¼V0�W0, where W0 is the orthogonal complement of V0 inV1. We can construct an orthonormal basis of W0 generated byW(t)¼(c0(t),c1(t),y,cm-1(t))T, and their integer translates withW(t) derived by
WðtÞ ¼Xm�1
c ¼ 0
L2½c�ffiffiffi2p
Uð2t�cÞ ð4Þ
where L2[c] is a m�m high-pass matrix with real coefficientsobtained by completion of {L1[c]}. Introduce the refinementsmasks
L1 z½ � : ¼1
2
Xn�1
n1 ¼ 0
L1½n1�z�n1 ð5Þ
L2 z½ � : ¼1
2
Xn�1
n2 ¼ 0
L2½n2�z�n2 ð6Þ
where 0rn1,n2rn�1, and z is a matrix variable. Eqs. (3) and (4)translate in Fourier domain into U(2o)¼L1(eJUo)U(o) andW(2o)¼L2(eJ o)W(o), JAZ, where o is a angular frequency vari-able. Furthermore, we will assume that sequences{L1(c),0rcrm�1} and {L2(c),0rcrm�1} are finite, and thusthat U(t) and W(t) have compact support. We also assume thatL1(z) verifies a matrix Smith–Barnwell orthonormality conditionso that the scaling function and their integer translate form anorthonormal basis of V0. Thus, for S(t)AV0, we have
SðtÞ ¼Xn�1
n1 ¼ 0
ST0½n1�Uðt�n1Þ ð7Þ
From V0¼V�1�W�1, we get
SðtÞ ¼Xn�1
n1 ¼ 0
ST�1 n1½ �U
t
2�n1
� �þDT
�1 n1½ �Wt
2�n1
� �� �ð8Þ
C. Zhao et al. / Engineering Applications of Artificial Intelligence 25 (2012) 1677–16861680
Then, we derive the well-known relations between the coeffi-cients at the analysis step
S�1½n� ¼Xm�1
c ¼ 0
L1½c�2n�S0½c� ð9Þ
D�1½n� ¼Xm�1
c ¼ 0
L2½c�2n�S0½c� ð10Þ
For the synthesis, we get
S0½n� ¼Xm�1
c ¼ 0
LT1½n�2c�S�1½c�þLT
2½n�2c�D�1½c� ð11Þ
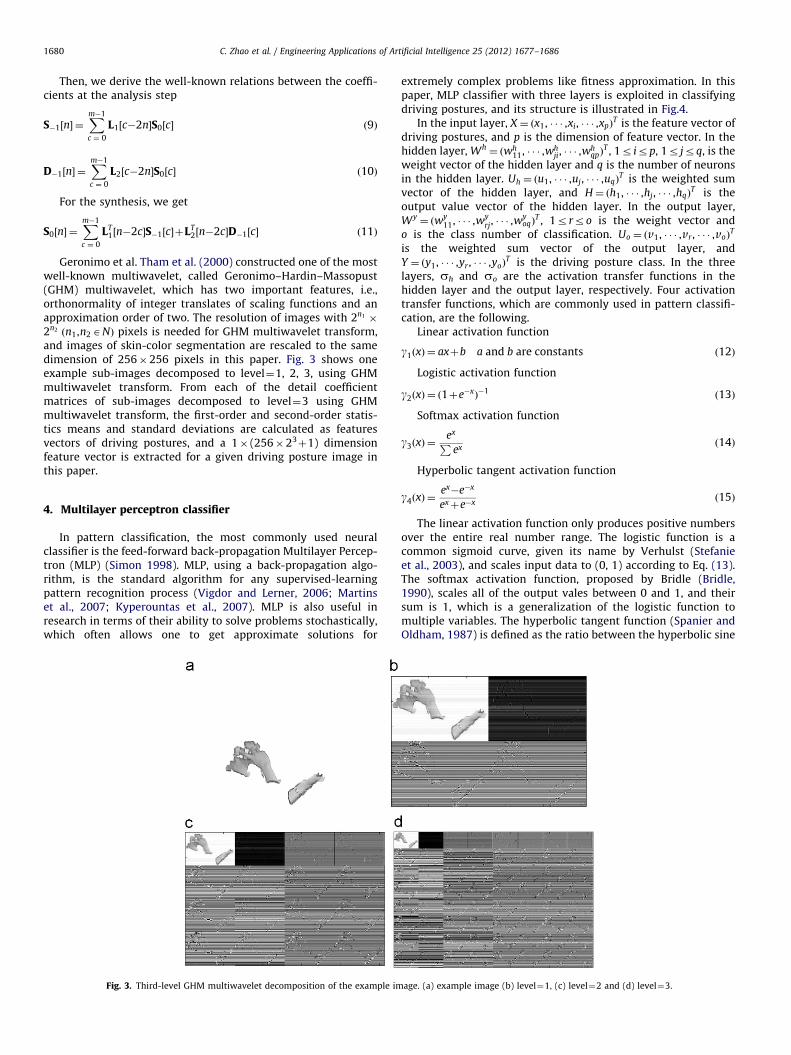
Geronimo et al. Tham et al. (2000) constructed one of the mostwell-known multiwavelet, called Geronimo–Hardin–Massopust(GHM) multiwavelet, which has two important features, i.e.,orthonormality of integer translates of scaling functions and anapproximation order of two. The resolution of images with 2n1 �
2n2 ðn1,n2ANÞ pixels is needed for GHM multiwavelet transform,and images of skin-color segmentation are rescaled to the samedimension of 256�256 pixels in this paper. Fig. 3 shows oneexample sub-images decomposed to level¼1, 2, 3, using GHMmultiwavelet transform. From each of the detail coefficientmatrices of sub-images decomposed to level¼3 using GHMmultiwavelet transform, the first-order and second-order statis-tics means and standard deviations are calculated as featuresvectors of driving postures, and a 1� (256�23
þ1) dimensionfeature vector is extracted for a given driving posture image inthis paper.
4. Multilayer perceptron classifier
In pattern classification, the most commonly used neuralclassifier is the feed-forward back-propagation Multilayer Percep-tron (MLP) (Simon 1998). MLP, using a back-propagation algo-rithm, is the standard algorithm for any supervised-learningpattern recognition process (Vigdor and Lerner, 2006; Martinset al., 2007; Kyperountas et al., 2007). MLP is also useful inresearch in terms of their ability to solve problems stochastically,which often allows one to get approximate solutions for
Fig. 3. Third-level GHM multiwavelet decomposition of the example im
extremely complex problems like fitness approximation. In thispaper, MLP classifier with three layers is exploited in classifyingdriving postures, and its structure is illustrated in Fig.4.
In the input layer, X ¼ ðx1, � � � ,xi, � � � ,xpÞT is the feature vector of
driving postures, and p is the dimension of feature vector. In thehidden layer, Wh
¼ ðwh11, � � � ,wh
ji, � � � ,whqpÞ
T , 1r irp, 1r jrq, is theweight vector of the hidden layer and q is the number of neuronsin the hidden layer. Uh ¼ ðu1, � � � ,uj, � � � ,uqÞ
T is the weighted sumvector of the hidden layer, and H¼ ðh1, � � � ,hj, � � � ,hqÞ
T is theoutput value vector of the hidden layer. In the output layer,Wy¼ ðwy
11, � � � ,wyrj, � � � ,w
yoqÞ
T , 1rrro is the weight vector ando is the class number of classification. Uo ¼ ðv1, � � � ,vr , � � � ,voÞ
T
is the weighted sum vector of the output layer, andY ¼ ðy1, � � � ,yr , � � � ,yoÞ
T is the driving posture class. In the threelayers, sh and so are the activation transfer functions in thehidden layer and the output layer, respectively. Four activationtransfer functions, which are commonly used in pattern classifi-cation, are the following.
Linear activation function
g1ðxÞ ¼ axþb a and b are constants ð12Þ
Logistic activation function
g2ðxÞ ¼ ð1þe�xÞ�1
ð13Þ
Softmax activation function
g3ðxÞ ¼exP
exð14Þ
Hyperbolic tangent activation function
g4ðxÞ ¼ex�e�x
exþe�xð15Þ
The linear activation function only produces positive numbersover the entire real number range. The logistic function is acommon sigmoid curve, given its name by Verhulst (Stefanieet al., 2003), and scales input data to (0, 1) according to Eq. (13).The softmax activation function, proposed by Bridle (Bridle,1990), scales all of the output vales between 0 and 1, and theirsum is 1, which is a generalization of the logistic function tomultiple variables. The hyperbolic tangent function (Spanier andOldham, 1987) is defined as the ratio between the hyperbolic sine
age. (a) example image (b) level¼1, (c) level¼2 and (d) level¼3.
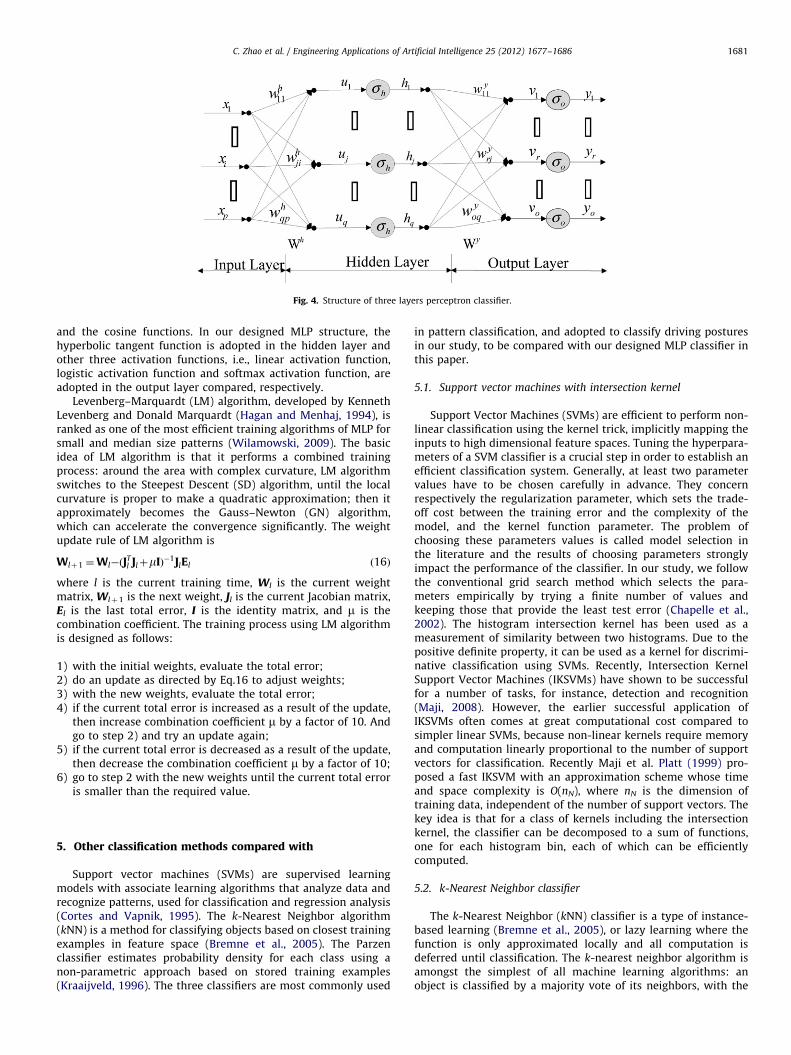
Fig. 4. Structure of three layers perceptron classifier.
C. Zhao et al. / Engineering Applications of Artificial Intelligence 25 (2012) 1677–1686 1681
and the cosine functions. In our designed MLP structure, thehyperbolic tangent function is adopted in the hidden layer andother three activation functions, i.e., linear activation function,logistic activation function and softmax activation function, areadopted in the output layer compared, respectively.
Levenberg–Marquardt (LM) algorithm, developed by KennethLevenberg and Donald Marquardt (Hagan and Menhaj, 1994), isranked as one of the most efficient training algorithms of MLP forsmall and median size patterns (Wilamowski, 2009). The basicidea of LM algorithm is that it performs a combined trainingprocess: around the area with complex curvature, LM algorithmswitches to the Steepest Descent (SD) algorithm, until the localcurvature is proper to make a quadratic approximation; then itapproximately becomes the Gauss–Newton (GN) algorithm,which can accelerate the convergence significantly. The weightupdate rule of LM algorithm is
Wlþ1 ¼Wl�ðJTl JlþmIÞ�1JlEl ð16Þ
where l is the current training time, Wl is the current weightmatrix, Wlþ1 is the next weight, Jl is the current Jacobian matrix,El is the last total error, I is the identity matrix, and m is thecombination coefficient. The training process using LM algorithmis designed as follows:
1)
with the initial weights, evaluate the total error; 2) do an update as directed by Eq.16 to adjust weights; 3) with the new weights, evaluate the total error; 4) if the current total error is increased as a result of the update,then increase combination coefficient m by a factor of 10. Andgo to step 2) and try an update again;
5)
if the current total error is decreased as a result of the update,then decrease the combination coefficient m by a factor of 10;6)
go to step 2 with the new weights until the current total erroris smaller than the required value.5. Other classification methods compared with
Support vector machines (SVMs) are supervised learningmodels with associate learning algorithms that analyze data andrecognize patterns, used for classification and regression analysis(Cortes and Vapnik, 1995). The k-Nearest Neighbor algorithm(kNN) is a method for classifying objects based on closest trainingexamples in feature space (Bremne et al., 2005). The Parzenclassifier estimates probability density for each class using anon-parametric approach based on stored training examples(Kraaijveld, 1996). The three classifiers are most commonly used
in pattern classification, and adopted to classify driving posturesin our study, to be compared with our designed MLP classifier inthis paper.
5.1. Support vector machines with intersection kernel
Support Vector Machines (SVMs) are efficient to perform non-linear classification using the kernel trick, implicitly mapping theinputs to high dimensional feature spaces. Tuning the hyperpara-meters of a SVM classifier is a crucial step in order to establish anefficient classification system. Generally, at least two parametervalues have to be chosen carefully in advance. They concernrespectively the regularization parameter, which sets the trade-off cost between the training error and the complexity of themodel, and the kernel function parameter. The problem ofchoosing these parameters values is called model selection inthe literature and the results of choosing parameters stronglyimpact the performance of the classifier. In our study, we followthe conventional grid search method which selects the para-meters empirically by trying a finite number of values andkeeping those that provide the least test error (Chapelle et al.,2002). The histogram intersection kernel has been used as ameasurement of similarity between two histograms. Due to thepositive definite property, it can be used as a kernel for discrimi-native classification using SVMs. Recently, Intersection KernelSupport Vector Machines (IKSVMs) have shown to be successfulfor a number of tasks, for instance, detection and recognition(Maji, 2008). However, the earlier successful application ofIKSVMs often comes at great computational cost compared tosimpler linear SVMs, because non-linear kernels require memoryand computation linearly proportional to the number of supportvectors for classification. Recently Maji et al. Platt (1999) pro-posed a fast IKSVM with an approximation scheme whose timeand space complexity is O(nN), where nN is the dimension oftraining data, independent of the number of support vectors. Thekey idea is that for a class of kernels including the intersectionkernel, the classifier can be decomposed to a sum of functions,one for each histogram bin, each of which can be efficientlycomputed.
5.2. k-Nearest Neighbor classifier
The k-Nearest Neighbor (kNN) classifier is a type of instance-based learning (Bremne et al., 2005), or lazy learning where thefunction is only approximated locally and all computation isdeferred until classification. The k-nearest neighbor algorithm isamongst the simplest of all machine learning algorithms: anobject is classified by a majority vote of its neighbors, with the

C. Zhao et al. / Engineering Applications of Artificial Intelligence 25 (2012) 1677–16861682
object being assigned to the class most common amongst its k-
nearest neighbors (k is a positive integer, typically small). If k¼1,then the object is simply assigned to the class of its nearestneighbor. The kNN rule is optimal in the asymptotic case, i.e., theerror tends to the Bayes error when the size of the training settends to infinity. The major drawback of the kNN algorithm is thecomputational complexity, caused by the large number of dis-tance computations.
5.3. Parzen classifier
The Parzen classifier is a technique for non-parametric densityestimation (Kraaijveld, 1996), which can be used for classification.Using a given function, the technique approximates a giventraining set distribution via a linear combination of kernelscentered on the observed points. The Parzen classifier estimatesthe relevant kernel width using the maximum likelihood principleproposed by Duin.
6. Experiments
Two standard experimental procedures, named the holdoutapproach and the cross-validation approach, are used to validatethe proposed feature extraction method and MLP classifiers,compared with IKSVMs, the kNN classifier and the Parzen classifier.The MLP classifier is configured as a structure with three layers,i.e., one input layer, one hidden layer and one output layer. Thenumber of neurons in the input layer is 2049, according to thefeature vector dimension of driving postures extracted by GHMmultiwavelet transform. There are 20 neurons in the hidden layer,and the number of neurons in the output layer is 4, according theclass number of driving postures. The initial weights of the hiddenlayer and the output layer are drawn from a zero mean and unitvariance isotropic Gaussian distribution, and normalized using themethod of Nguyen and Widrow (Nguyen and Widrow, 1990). LMalgorithm (Hagan and Menhaj, 1994) is used to train the MLPclassifier, and ‘‘early stopping’’ mechanism is used to overcomethe problem of over-fitting (Caruana et al., 2001). During thetraining process, the maximum number of epochs and the combi-nation coefficient are 1000 and 0.01, respectively. In the holdoutapproach, certain amounts of feature vectors extracted fromimages of SEU driving postures dataset (shown in Fig. 5) arereserved for testing, and the rest are for training. In k-fold cross-validation approach, the driving posture datasets are partitionedinto k sub-datasets. The kth sub-dataset is retained for testing andthe remaining k–1 sub-datasets are used for training.
6.1. Holdout experiments
Holdout experiments are based on randomly dividing featurevectors of driving postures into a training dataset (80% of featurevectors of driving postures extracted from images of SEU drivingposture dataset) and a test dataset (20% of feature vectors ofdriving postures extracted from images of SEU driving posturedataset). Using the holdout experiment approach, only the testdataset is used to estimate the generalization error. We repeat theholdout experiment 100 times by randomly splitting SEU drivingposture dataset, and recorded the classification results.
In the first holdout experiment, the same set of training andtesting are applied to MLPs using three different activationfunctions (i.e., linear activation function, logistic activation func-tion and Softmax activation function) in the output layer, andhyperbolic tangent activation function in the hidden layer. Theclassification performances are simultaneously compared, and theresults of classification rate for the driving postures are displayed
in the bar plots of Fig. 6(a) and box plots of Fig. 6(b), which are theaveraged classification results from the 100 random splits of SEUdriving posture dataset into training and testing sets. The averageclassification accuracies of MLP classifiers, using linear activationfunction, logistic activation function and softmax activationfunction in the output layer, are 87.81%, 88.69% and 89.25%,respectively. From Fig. 6, it is clear that MLP classifier, usingsoftmax activation function in the output layer and hyperbolictangent activation function in the hidden layer, offers the bestperformance in the first holdout experiment.
In the second holdout experiment, the same set of training andtesting are applied to MLP, using softmax activation function in theoutput layer and hyperbolic tangent activation function in thehidden layer, and the other three classifiers, i.e., IKSVMs, the kNNclassifier and the Parzen classifier, and their classification perfor-mances are simultaneously compared. The results of classificationrate of IKSVMs, the kNN classifier, the Parzen classifier and MLPusing softmax activation function in the output layer and hyper-bolic tangent activation function in the hidden layer, displayed inFig. 7, are 83.31%, 87.63%, 87.38% and 90.5%, respectively. FromFig. 7, it show that MLP classifier, using softmax activation functionin the output layer and hyperbolic tangent activation function inthe hidden layer, offers the best classification performance rate ofthe four classifiers in the second holdout experiment.
To further measure the classification performance regardingthe information about actual and predicted classificationsacquired, confusion matrix is often used. A confusion matrix is asquare matrix or table that represents the number/proportion ofexamples from one class classified into another (or same) class. Inthe confusion matrix, the rows and columns indicate true andpredicted class, respectively. The diagonal entries representcorrect classifications, while the off-diagonal entries representincorrect ones. In the holdout experiment, the confusion matrixthat summarizes the detailed performance of feature extractionby GHM multiwavelet transform and MLP classifier, using soft-max activation function in the output layer and hyperbolictangent activation function in the hidden layer, is shown inTable 1. The rows and columns of the confusion matrix expressthe posture classes of grasping the steering wheel, operating theshift gear, eating a cake and talking on a cellular phone. Thecorresponding classification accuracies are 93.27%, 92.82%, 87.59%and 83.01%. From the confusion matrix of the holdout experi-ments, it is clear that of the four classes, talking on a cellularphone is the most difficult to classify.
6.2. Cross-validation experiments
The k-fold cross-validation approach (Zhang and Zhang, 2008)is another commonly used technique that takes a set of m
examples and randomly partitions them into k folds of size m/k.For each fold, the classifier is tested on one fold (consists of m/kexamples) and trained on the other k – 1 folds (consisting ofm(1–1/k) examples). In the following experiments, 10-fold cross-validation was used. The 80 sets of feature vectors of drivingposture extracted from images of SEU driving posture dataset arerandomly divided into 10 subset of equal size (every subsetconsists of 8 feature vectors). Nine of these 10 subsets are trainedand then tested on the one left out, each time leaving out adifferent one.
In the first cross-validation experiment, the comparisons of MLPclassifiers using three different activation functions (i.e., linearactivation function, logistic activation function and Softmax activa-tion function) in the output layer, and hyperbolic tangent activa-tion function in the hidden layer, are processed similarly as in theabove. The feature vectors of driving postures extracted fromimages of SEU driving posture dataset are randomly divided into

Fig. 5. SEU driving postures dataset.
Fig. 6. Classification performance of three activation functions in holdout experiments. (a) Bar plots of classification rates and (b) box plots of classification rates.
Fig. 7. Classification performance of MLP and other three methods in holdout experiment. (a) Bar plots of classification rates and (b) box plots of classification rates.
Table 1Confusion matrix for the result from GHM multiwavelet transform and MLP
classifier (using softmax activation function in the output layer and hyperbolic
tangent activation function in the hidden layer) in the holdout experiments.
(I) grasping the steering wheel, (II) operating the shift gear, (III) eating a cake, and
(V) talking on a cellular phone.
class I II III V
I 93.27% 6.73 0 0
II 6.91% 92.82% 0.27% 0
III 0 0 87.59% 12.41%
V 2.18% 0 14.81% 83.01%
C. Zhao et al. / Engineering Applications of Artificial Intelligence 25 (2012) 1677–1686 1683
10 folds for 100 times, and 100 cross-validation experiments arecarried out. The average classification accuracies of the 100 cross-validation experiments are displayed in the bar plots ofFig. 8(a) and the box plots of Fig. 8(b). The average classificationaccuracies of MLP classifiers, using three different activationfunctions (i.e., linear activation function, logistic activation func-tion and Softmax activation function) in the output layer, andhyperbolic tangent activation function in the hidden layer, are88.38%, 89.42%, and 90.44%, respectively. It again show that MLPclassifier, using softmax activation function in the output layer andhyperbolic tangent activation function in the hidden layer, offersthe best performance in the first cross-validation experiment.

Fig. 8. Classification performance of three activation functions in Cross-validation experiments. (a) Bar plots of classification rates and (b) box plots of classification rates.
Fig. 9. Classification performance of MLP classifier and other three methods in Cross-validation experiments. (a) Bar plots of classification rates and (b) box plots of
classification rates.
C. Zhao et al. / Engineering Applications of Artificial Intelligence 25 (2012) 1677–16861684
In the second cross-validation experiment, 10-fold cross vali-dations are applied to MLP classifier, using softmax activationfunction in the output layer and hyperbolic tangent activationfunction in the hidden layer, and the other three classifiers,IKSVMs, the kNN classifier and the Parzen classifier, and theirclassification performances are simultaneously compared. Theresults of classification rate of IKSVMs, the kNN classifier, theParzen classifier and MLP using softmax activation function in theoutput layer and hyperbolic tangent activation function in thehidden layer, displayed in Fig. 9, are 84.64%, 89.56%, 89.43% and90.61%, respectively. From Fig. 9, it also show that MLP, usingsoftmax activation function in the output layer and hyperbolictangent activation function in the hidden layer, offers the bestclassification performance rate of the four classifiers in the secondcross-validation experiment.
In the second cross-validation experiment, the confusionmatrix that summarizes the detailed performance of featureextraction by GHM multiwavelet transform and MLP classifier,using softmax activation function in the output layer and hyper-bolic tangent activation function in the hidden layer, is shown inTable 2. The accuracies of the four classes are 97.78%, 91.74%,89.09% and 84.04%, and once again, it is clear that talking on acellular phone is the most difficult posture to classify among thefour classes in the cross-validation experiments.
6.3. Discussions
Nguyen widrow weight initialization (Maji, 2008) is a meansof assigning initial values to the weight of a neural network, and
this technique is one of the most effective neural network weightinitialization methods available. In our designed MLP classifier,the initial weights of the hidden layer and the output layer aredrawn from a zero mean and unit variance isotropic Gaussiandistribution, and normalized using the method of Nguyen widrowweight initialization. The following experiment is created to showthe impact of Nguyen widrow weight initialization on theclassification results of four driving posture classes in this paper.One training dataset (80% of feature vectors of driving postures) israndomly sampled from SEU driving posture dataset, and the restacts as the test dataset (20% of feature vectors of drivingpostures). Using the same training dataset and test dataset, theclassification experiments are conducted 100 times with theweights of MLP classifier initialized 100 times using Nguyenwidrow weight initialization. The 100 times experimental resultsof Nguyen widrow weight initialization are shown in Fig. 10.From Fig. 10, it shows that the most experimental accuracies areover 86%, and only one is less than 86%, which can be consideredas the outlier result. In order to eliminate the outlier impact onthe experimental results, the mean value of n times experimentscan be used, and in our 100 experiments, the mean value of theexperimental results is 93.31%, which show that Nguyen widrowweight initialization is effective in our designed MLP classifier,using softmax activation function in the output layer and hyper-bolic tangent activation function in the hidden layer, in classifica-tion of driving postures.
Compared to other state of the art methodologies for monitor-ing driver’s behaviors in current research literature, threecontributions are presented in this paper. With the potential for

Table 2Confusion matrix for the result from GHM multiwavelet transform and MLP
classifier (using softmax activation function in the output layer and hyperbolic
tangent activation function in the hidden layer) in the cross-validation experi-
ment. (I) grasping the steering wheel, (II) operating the shift gear, (III) eating a
cake, and (V) talking on a cellular phone.
class I II III V
I 97.78% 2.22% 0 0
II 7.16% 91.74% 1.10% 0
III 0 1.12% 89.09% 9.79%
V 1.8% 0 14.16% 84.04%
Fig. 10. Experimental results from the same training dataset and testing dataset
for 100 times using the Nguyen widrow weight initialization.
C. Zhao et al. / Engineering Applications of Artificial Intelligence 25 (2012) 1677–1686 1685
short support and the capability of being both symmetric andorthogonal, multiwavelet transform has the good ability forfeature description of images. The first contribution of this paperis that we proposed an effective feature extraction approach fordriving postures using GHM multiwavelet transform. The secondcontribution is the MLP classifier with three layers, i.e., the inputlayer, the hidden layer and the output layer, is exploited inclassifying four pre-defined classes of driving postures. The thirdcontribution is that the holdout and cross-validation experimentsare created, and the experimental results show the effectivenessof our proposed feature extraction method and our designed MLPclassifier with three layers, using softmax activation function inthe output layer and hyperbolic tangent activation function in thehidden layer. The confusion matrices of the holdout and cross-validation experiments show that talking on a cellular phone isthe most difficult one among the four driving posture classesstudied. The most advantage of our proposed approach forrecognizing driver postures is that four detailed classes of drivingpostures have been be realized with high recognition rates usingthe vision sensor.
Our study is limited by the fact that our proposed method forrecognizing driving postures is more sensitive to the skin-likecolor areas in the vehicles. When a driver dressed in clothes ofskin-like color, the recognition system of driving postures willdetect not only two hands and faces of drivers, but also the area ofskin-like color clothes. And also when a driver dressed in gloves ofno skin-like color, the area of two hands will be missed using ourrecognition system of driving postures. In the future, we willcontinue researching on the hand detection methods of driversunder bad conditions.
7. Conclusions
To automatically understand and characterize the driverbehaviors, we proposed an effective features extraction approachbased on GHM multiwavelet transform, and then, MLP classifierswith three layers, using hyperbolic tangent activation function inthe hidden layer and softmax activation function in the outputlayer, was exploited in recognizing predefined four classes ofdriving postures, compared with IKSVMs, the kNN classifier andthe Parzen classifier. With features extracted from SEU drivingposture dataset, the holdout and cross-validation experimentsshow that feature extraction by GHM multiwavelet transform andMLP classifier with three layers, using hyperbolic tangent activa-tion function in the hidden layer and softmax activation functionin the output layer, offers the best classification performance thanIKSVMs, the kNN classifier and the Parzen classifier. The experi-mental results also showed that talking on a cellular phone is themost difficult one among the four classes studied, with classifica-tion accuracies of 83.01% and 84.04% in the holdout and cross-validation experiments. The results demonstrate the effectivenessof the proposed feature extraction approach and MLP classifiers inautomatically understanding and characterizing driver behaviorstowards HDAS.
Acknowledgments
This work was supported by the National Natural ScienceFoundation of China under Project no. 51078087.
Appendix. definition of symbols used in this paper
Symbol
Meaning/definition(r, g, b)
the red, green and blue values ina color image(r0, g0, b0)
the normalized red, green andblue values in a color imaget
the time variable o the angular frequency variable L2(R) the function spaces definedusing the natural generalizationof the 2-norm for finite-dimensional vector spaces
{Vn}, nAN
multiresolution analysis of thespace L2(R)f(t)¼(f0(t), f1(t),y, fm-
1(t))T
the scaling function
L1[c]
m�m low-pass matrix L2[c] m�m high-pass matrixX ¼ ðx1, � � � ,xi, � � � ,xpÞT
feature vector of the drivingposture where p is thedimension of feature vector
Wh¼ ðwh
11, � � � ,whji, � � � ,w
hqpÞ
T ,
1r irp, 1r jrq
the weight vector of the hiddenlayer where q is the number ofneurons in the hidden layer
Uh ¼ ðu1, � � � ,uj, � � � ,uqÞT
the weighted sum vector of thehidden layer
H¼ ðh1, � � � ,hj, � � � ,hqÞT
the output value vector of thehidden layer
Wy¼ ðwy
11, � � � ,wyrj, � � � ,w
yoqÞ
T ,
1rrro
the weight vector and o is theclass number
Uo ¼ ðv1, � � � ,vr , � � � ,voÞT
the weighted sum vector of theoutput layer
C. Zhao et al. / Engineering Applications of Artificial Intelligence 25 (2012) 1677–16861686
sh
the activation transfer functionin the hidden layerso
the activation transfer functionin the output layer,Y ¼ ðy1, � � � ,yr , � � � ,yoÞT
The vector of driving postureclasses
Wl the current weight matrix wherel is the current training time
Wlþ112
the next weight matrix
Jl
the current Jacobian matrix El the last total error matrix I the identity matrix m the combination coefficientReferences
Nadeau, C.L., Maag, U., Bellavance, F., Lapierre, S.D., Desjardins, D., Messier, S.,Saidi, A., 2003. Wireless telephones and the risk of road crashes. Accid. Anal.Prev. 35 (5), 649–660.
Simon, G., Berger, M.O., 1998. A two-stage robust statistical method for temporalregistration from features of various types. IEEE Sixth International Conferenceon Computer Vision, pp. 261–266.
Oliver, N., Pentland, A.P., 2002. Graphical models for driver behavior recognition ina smartcar. IEEE Intell. Vehicle Symp., 7–12.
Liu, X., Zhu, Y.D., Fujimura K., 2002. Real-time pose classification for drivermonitoring. IEEE 5th International Conference on Intelligent TransportationSystems, pp. 174–178.
Eren, H., Celik, U., Poyraz, M., 2007. Stereo vision and statistical based behaviorprediction of driver. IEEE Intell. Vehicle Symp., 657–662.
Sekizawa, S., Inagaki, S., Suzuki, T., Hayakawa, S., Tsuchida, N., Tsuda, T., Fujinami,H., 2007. Modeling and recognition of driving behavior based on stochasticswitched ARX model. IEEE Trans. Intell. Transp. Syst. 8 (4), 593–606.
Watta, P., Lakshmanan, S., Hou, Y.L., 2007. Nonparametric approaches for estimat-ing driver pose. IEEE Trans. Veh. Technol. 56 (4), 2028–2041.
Tran, C., Doshi, A., Trivedi, M.M., 2012. Modeling and prediction of driver behaviorby foot gesture analysis. Comput. Vis. and Image Und., 116 (3), 435–445.
Adam, T., Untaroiu, C.D., 2011. Identification of occupant posture using a Bayesianclassification methodology to reduce the risk of injury in collision. Transp. Res.Part C: Emerging Technol. 19 (6), 1078–1094.
Kato, T., Fujii, T., Tanimoto, M., 2004. Detection of driver’s posture in the car byusing far infrared camera. IEEE Intell. Vehicle Symp., 339–344.
Ki, J., Kwon, Y., Sohn, K., 2007. 3D Gaze tracking and analysis for attentive humancomputer interaction. IEEE Front. Convergence of Biosci. Inform. Technol.,617–621.
Cheng, S.Y., Park, S., Trivedi, M.M., 2007. Multi-spectral and multi-perspectivevideo arrays for driver body tracking and activity analysis. Comput. Vis. ImageUnderst. 106 (2–3), 245–257.
Demirdjian, D., Varri, C., 2009. Driver poses estimation with 3D time-of-flightsensor. IEEE Workshop on Comput. Intel. Vehicles and Veh. Sys., 16–22.
Cheng, S.Y., Trivedi., M.M., 2006. Turn-intent analysis using body pose forintelligent driver assistance. IEEE Perv. Comp. 5 (4), 28–37.
Yang, C.M., Wu, C.C., Chou, C.M., Yang, T.L., 2009. Vehicle driver’s ECG and sittingposture monitoring system. IEEE 9th International Conference on InformationTechnology and Application in Biomedicine, pp. 1–4.
Cheng, S.Y., Trivedi., M.M., 2010. Vision-based infotainment user determination byhand recognition for driver assistance. IEEE Trans. Intell. Transp. Syst. 11 (3),759–764.
Harini, V., Stefan, A., Nathaniel, B., Paul, S., Nikolaos, P., 2005. Driver activitymonitoring through supervised and unsupervised learning. IEEE Conf. Intell.Transp. Syst., 895–900.
Harini, V., Nathaniel, B., Stefan, A., Nikolaos, P., 2007. Classifiers for driver activitymonitoring. Transport. Res. Part C 15 (1), 51–67.
Heusch, G., Cardinaux, F., Marcel, S., 2005. Lighting normalization algorithms forface verification. Tech. Rep. IDIAP.
Vezhnevets, V., Sazonov, V., Andreeva., A., 2003. A survey on pixel-based skin colordetection techniques. Proc. Graphicon, 85–92.
Strela, V., Heller, P.N., Strang, G., Topiwala, P., Heil, C., 1999. The application ofmultiwavelet filter banks to image processing. IEEE Trans. Imag. Process. 8 (4),548–563.
Tham, J.Y., Shen, L.X., Lee, S.L., Tan, H.H., 2000. A general approach for analysis andapplication of discrete multiwavelet transform. IEEE Trans. Signal Process. 48(2), 457–464.
Simon, H., 1998. Neural Networks: A Comprehensive Foundation, 2ed. PrenticeHall.
Vigdor, B., Lerner, B., 2006. Accurate and fast off and online fuzzy ARTMAP-basedimage classification with application to genetic abnormality diagnosis. IEEETrans. Neural Netw. 17 (5), 1288–1300.
Martins, J.F., Pires, V.F., Pires, A.J., 2007. Unsupervised neural-network-basedalgorithm for an online diagnosis of three-phase induction motor stator fault.IEEE Trans. Ind. Electron. 54 (1), 259–264.
Kyperountas, M., Tefas, A., Pitas, I., 2007. Weighted piecewise LDA for solving thesmall sample size problem in face verification. IEEE Trans. Neural Netw. 18 (2),506–519.
Stefanie, J., Rens, B., Jennifer, H., 2003. Probabilistic Linguistics. Massachusetts:MIT Press, Cambridge.
Bridle, J.S., 1990. Probabilistic interpretation of feedforward classification networkoutputs, with relationships to statistical pattern recognition. In: FoglemanSoulie, F., Herault, J. (Eds.), Neurocomputing: Algorithms, Architectures andApplications. Springer-Verlag, Berlin, pp. 227–236.
Spanier, J., Oldham, K.B., 1987. The Hyperbolic Tangent and Cotangent Functions.Ch. 30 in an atlas of functions. Washington, DC, Hemisphere, pp. 279–284.
Hagan, M.T., Menhaj, M., 1994. Training feedforward networks with the Marquardtalgorithm. IEEE Trans. Neural Netw. 5 (6), 989–993.
Wilamowski, B.M., 2009. Neural network architectures and learning algorithms.IEEE Ind. Electron. Mag. 3 (4), 56–63.
Cortes, C., Vapnik, V., 1995. Support-vector networks. Machine Learning 20,273–297.
Bremne, D., Demaine, E., Erickson, J., Iacono, J., Langerman, S., Morin, P., Toussaint,G., 2005. Output-sensitive algorithms for computing nearest-neighbor deci-sion boundaries. Discrete and Computational Geometry 33 (4), 593–604.
Kraaijveld, M.A., 1996. A Parzen classifier with an improved robustness againstdeviations between training and test data. Pattern Recogn. Lett. 17 (7),679–689.
Chapelle, O., Vapnik, V., Bousquet, O., Mukherjee, S., 2002. Choosing multipleparameters for support vector machines. Machine Learning 46 (1–3), 131–159.
Maji, S., 2008. Classification using intersection kernel support vector machines isefficient. IEEE Conference on Computer Vision and Pattern Recognition, pp. 1–8.
Platt, J., 1999. Fast Training of SVMS Using Sequential Minimal Optimization.Advances in Kernel Methods Support Vector Machine. MIT Press, Cambridge185–208.
Nguyen, D., Widrow, B., 1990. Improving the learning speed of 2-layer neuralnetworks by choosing initial values of the adaptive weights. Proceedings ofInternational Joint Conference on Neural Networks, pp. 21–26.
Caruana, R., Lawrence, S., Giles, C.L., 2001. Overfitting in neural networks: back-propagation, conjugate gradient, and early Stopping. Adv. Neural Inf. Process.Syst. 13, 402–408.
Zhang, B.L., Zhang, Y.C., 2008. Classification of cerebral palsy gait by kernel fisherdiscriminant analysis. Int. J. Hybrid Intell. Syst. 5 (4), 209–218.