recognising team activities from noisy data - amazon s3 · recognising team activities from noisy...
TRANSCRIPT
Recognising Team Activities from Noisy Data
Alina Bialkowski1,2, Patrick Lucey1, Peter Carr1, Simon Denman2, Iain Matthews1, Sridha Sridharan2
1Disney Research, Pittburgh, USA2Image and Video Laboratory, Queensland University of Technology, Australia
{alina.bialkowski,s.denman,s.sridharan}@qut.edu.au,{patrick.lucey,peter.carr,iainm}@disneyresearch.com
Abstract
Recently, vision-based systems have been deployed inprofessional sports to track the ball and players to en-hance analysis of matches. Due to their unobtrusive nature,vision-based approaches are preferred to wearable sensors(e.g. GPS or RFID sensors) as it does not require players orballs to be instrumented prior to matches. Unfortunately, incontinuous team sports where players need to be trackedcontinuously over long-periods of time (e.g. 35 minutes infield-hockey or 45 minutes in soccer), current vision-basedtracking approaches are not reliable enough to provide fullyautomatic solutions. As such, human intervention is re-quired to fix-up missed or false detections. However, in in-stances where a human can not intervene due to the sheeramount of data being generated - this data can not be useddue to the missing/noisy data. In this paper, we investigatetwo representations based on raw player detections (and nottracking) which are immune to missed and false detections.Specifically, we show that both team occupancy maps andcentroids can be used to detect team activities, while theoccupancy maps can be used to retrieve specific team ac-tivities. An evaluation on over 8 hours of field hockey datacaptured at a recent international tournament demonstratesthe validity of the proposed approach.
1. IntroductionAs the sophistication of analysis increases in profes-
sional sport, more organisations are looking at using playertracking data to obtain an advantage over their competi-tors. For sports like field-hockey, the dynamic and continu-ous nature makes analysis extremely challenging as game-events are not segmented into discrete plays, the speed ofplay is very quick (e.g. the ball can move at 125km/h), andthe size of the field is very large, with each player free tooccupy any area at any time. A common approach to thisproblem is to use each player’s trajectory path (e.g. lin-ear or polynomial) and learn a combined model which can
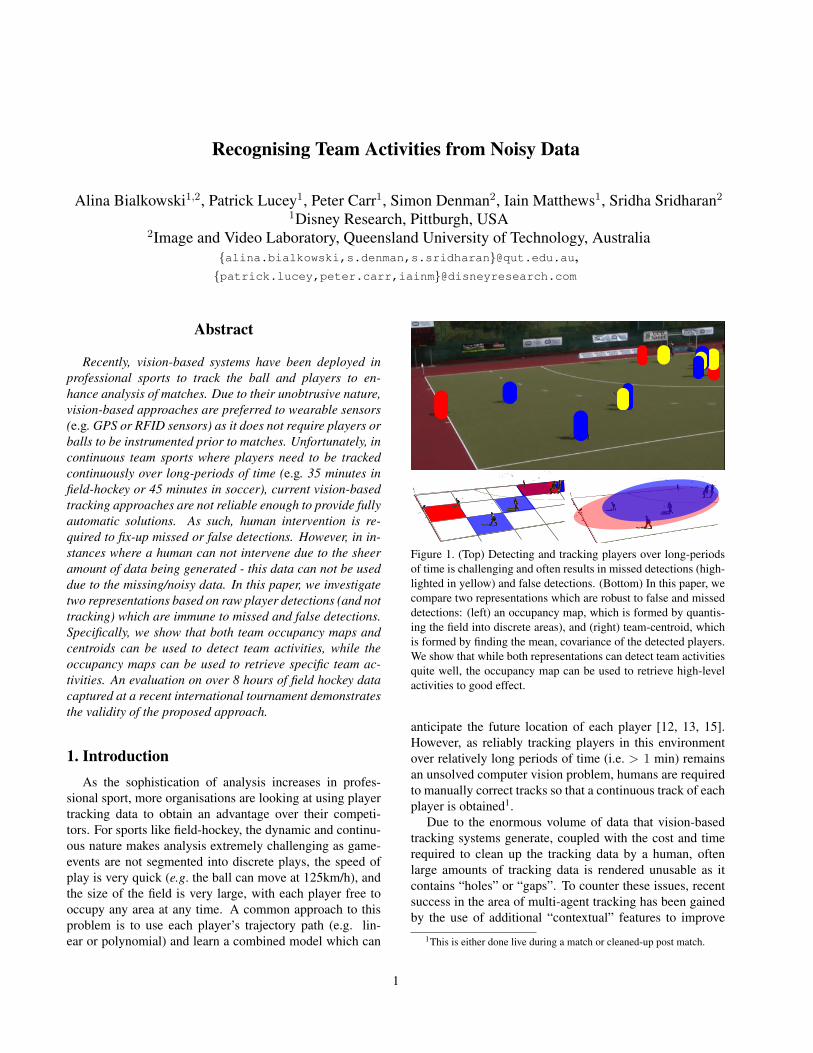
Figure 1. (Top) Detecting and tracking players over long-periodsof time is challenging and often results in missed detections (high-lighted in yellow) and false detections. (Bottom) In this paper, wecompare two representations which are robust to false and misseddetections: (left) an occupancy map, which is formed by quantis-ing the field into discrete areas), and (right) team-centroid, whichis formed by finding the mean, covariance of the detected players.We show that while both representations can detect team activitiesquite well, the occupancy map can be used to retrieve high-levelactivities to good effect.
anticipate the future location of each player [12, 13, 15].However, as reliably tracking players in this environmentover relatively long periods of time (i.e. > 1 min) remainsan unsolved computer vision problem, humans are requiredto manually correct tracks so that a continuous track of eachplayer is obtained1.
Due to the enormous volume of data that vision-basedtracking systems generate, coupled with the cost and timerequired to clean up the tracking data by a human, oftenlarge amounts of tracking data is rendered unusable as itcontains “holes” or “gaps”. To counter these issues, recentsuccess in the area of multi-agent tracking has been gainedby the use of additional “contextual” features to improve
1This is either done live during a match or cleaned-up post match.
1

tracking performance. As player motion and position (i.e.proximity to teammates and opponents) is heavily linked towhere the action on the field is taking place and the game-context (i.e. is one team attacking or defending), these con-textual features can be used to fill in the gaps of missedtracks (due to missed or false detections). Most notably,Liu et al. [17] used a coarse player occupancy map to get anindication of the game-state (i.e. is one team attacking or de-fending) to improve player tracking, while Lucey et al. [19]used team centroid as a contextual feature to approximateplayer role in conjunction with a spatiotemporal bilinearmodel to clean-up noisy data. In this paper, we compare:1) the occupancy map representation – which is formed byquantising the field into a series of areas and counting theplayers in each area; to 2) a team-centroid representation –which is formed by calculating the mean and covariance ofthe detections (see Figure 1).
To enable this research we used player detection datacaptured via 8 fixed high-definition (HD) cameras, acrossseven complete field-hockey matches (over 8 hours ofmatch data for each camera). We utilise a state-of-the-artreal-time player detector [3] to give player positions at everyframe, affiliate detection results into teams using a colourhistogram model, and compare both approaches across aseries of labelled team activities. Additionally, we showthe utility of these representations for the task of play re-trieval. We evaluate the performance relative to ground truthannotations, and demonstrate that our descriptor is able toquickly and accurately locate activities similar to a querywithout any tracking information.
2. Related workDue to the host of military, surveillance and sport appli-
cations, research into recognising group behaviour has re-cently increased dramatically. Outside of the sports realm,most of this work has focussed on dynamic teams (i.e.where individual agents can leave and join teams over theperiod of the observations). An initial approach was torecognise the activities of individual agents and then com-bine these to infer group activities [1]. Sukthankar andSycara recognised group activities as a whole but pruned thesize of possible activities by using temporal ordering con-straints and agent resource dependencies [26, 27]. Sadilekand Kautz [23] used GPS locations of multiple agents ina “capture the flag” game to recognise low-level activitiessuch as approaching and being at the same location. All ofthese works assume that the position and movements of allagents are known, and that all behaviours can be mappedto an activity within the library. Recently, Zhang et al. [29]used a “bag of words” and Support Vector Machine (SVM)approach to recognise group activities on the Mock Prisondataset [4].
Sport related research mostly centres on low-level ac-
tivity detection with the majority conducted on AmericanFootball. In the seminal work by Intille and Bobick [11],they recognised a single football play pCurl51, using aBayesian network to model the interactions between theplayers trajectories. Li et al. [16], modelled and classifiedfive offensive football plays (dropback, combo dropback,middle run, left run, right run). Siddiquie et al. [24], per-formed automated experiments to classify seven offensivefootball plays using a shape (HoG) and motion (HoF) basedspatio-temporal features. Instead of recognising footballplays, Li and Chellapa [15] used a spatio-temporal drivingforce model to segment the two groups/teams using theirtrajectories. Researchers at Oregon State University havealso done substantial research in the football space [9, 8, 25]with the goal of automatically detecting offensive playsfrom a raw video source and transferring this knowledgeto a simulator. For soccer, Kim et al. [13] used the globalmotion of all players in a soccer match to predict wherethe play will evolve in the short-term. Beetz et al. [2] de-veloped the automated sport game models (ASPOGAMO)system which can automatically track player and ball posi-tions via a vision system. Using soccer as an example, thesystem was used to create a heat-map of player positions(i.e. which area of the field did a player mostly spend timein) and also has the capability of clustering passes into low-level classes (i.e. long, short etc.), although no thoroughanalysis was conducted due to a lack of data. In basket-ball, Perse et al. [22] used trajectories of player movementto recognise three type of team offensive patterns. Morariuand Davis [21] integrated interval-based temporal reason-ing with probabilistic logical inference to recognise eventsin one-on-one basketball. Hervieu et al. [7] also used playertrajectories to recognise low-level team activities using a hi-erarchical parallel semi-Markov model.
It is worth noting that an enormous amount of researchinterest has used broadcast sports footage for video sum-marisation in addition to action, activity and highlight de-tection [14, 18, 10, 28, 20, 6, 2, 5], but given that theseapproaches are not automatic (i.e. the broadcast footageis generated by humans) and that the telecasted view cap-tures only a portion of the field, analysing groups has beenimpossible because some individuals are normally out offrame. Although similar in spirit to the research mentionedabove, our work differs as: 1) we rely only on player detec-tions rather than tracking, and 2) we compare across manymatches (7 compared to 1).
3. Detection Data3.1. Field-Hockey Test-Bed
To enable this research we used player detection datacaptured via 8 fixed HD cameras, and over seven completefield-hockey matches (over 8 hours of match data for each
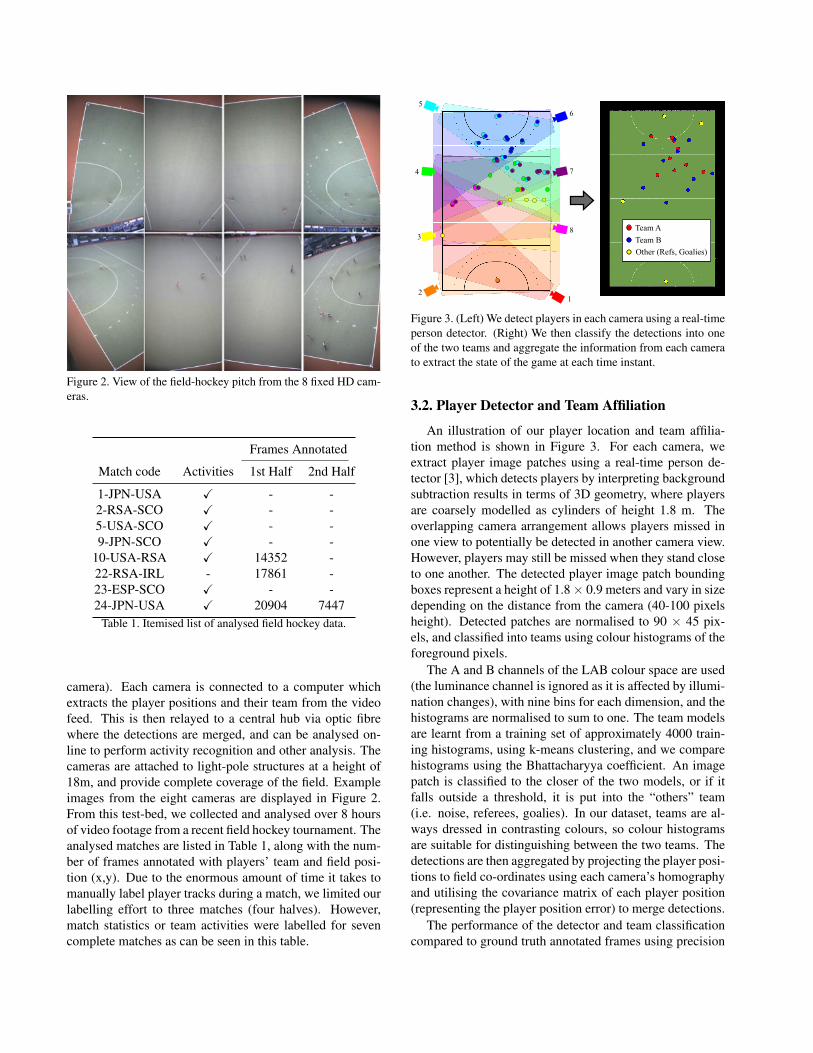
Figure 2. View of the field-hockey pitch from the 8 fixed HD cam-eras.
Frames Annotated
Match code Activities 1st Half 2nd Half
1-JPN-USA X - -2-RSA-SCO X - -5-USA-SCO X - -9-JPN-SCO X - -
10-USA-RSA X 14352 -22-RSA-IRL - 17861 -23-ESP-SCO X - -24-JPN-USA X 20904 7447
Table 1. Itemised list of analysed field hockey data.
camera). Each camera is connected to a computer whichextracts the player positions and their team from the videofeed. This is then relayed to a central hub via optic fibrewhere the detections are merged, and can be analysed on-line to perform activity recognition and other analysis. Thecameras are attached to light-pole structures at a height of18m, and provide complete coverage of the field. Exampleimages from the eight cameras are displayed in Figure 2.From this test-bed, we collected and analysed over 8 hoursof video footage from a recent field hockey tournament. Theanalysed matches are listed in Table 1, along with the num-ber of frames annotated with players’ team and field posi-tion (x,y). Due to the enormous amount of time it takes tomanually label player tracks during a match, we limited ourlabelling effort to three matches (four halves). However,match statistics or team activities were labelled for sevencomplete matches as can be seen in this table.
1
8
7
65
4
3
2
Team ATeam BOther (Refs, Goalies)
Figure 3. (Left) We detect players in each camera using a real-timeperson detector. (Right) We then classify the detections into oneof the two teams and aggregate the information from each camerato extract the state of the game at each time instant.
3.2. Player Detector and Team AffiliationAn illustration of our player location and team affilia-
tion method is shown in Figure 3. For each camera, weextract player image patches using a real-time person de-tector [3], which detects players by interpreting backgroundsubtraction results in terms of 3D geometry, where playersare coarsely modelled as cylinders of height 1.8 m. Theoverlapping camera arrangement allows players missed inone view to potentially be detected in another camera view.However, players may still be missed when they stand closeto one another. The detected player image patch boundingboxes represent a height of 1.8 ⇥ 0.9 meters and vary in sizedepending on the distance from the camera (40-100 pixelsheight). Detected patches are normalised to 90 ⇥ 45 pix-els, and classified into teams using colour histograms of theforeground pixels.
The A and B channels of the LAB colour space are used(the luminance channel is ignored as it is affected by illumi-nation changes), with nine bins for each dimension, and thehistograms are normalised to sum to one. The team modelsare learnt from a training set of approximately 4000 train-ing histograms, using k-means clustering, and we comparehistograms using the Bhattacharyya coefficient. An imagepatch is classified to the closer of the two models, or if itfalls outside a threshold, it is put into the “others” team(i.e. noise, referees, goalies). In our dataset, teams are al-ways dressed in contrasting colours, so colour histogramsare suitable for distinguishing between the two teams. Thedetections are then aggregated by projecting the player posi-tions to field co-ordinates using each camera’s homographyand utilising the covariance matrix of each player position(representing the player position error) to merge detections.
The performance of the detector and team classificationcompared to ground truth annotated frames using precision
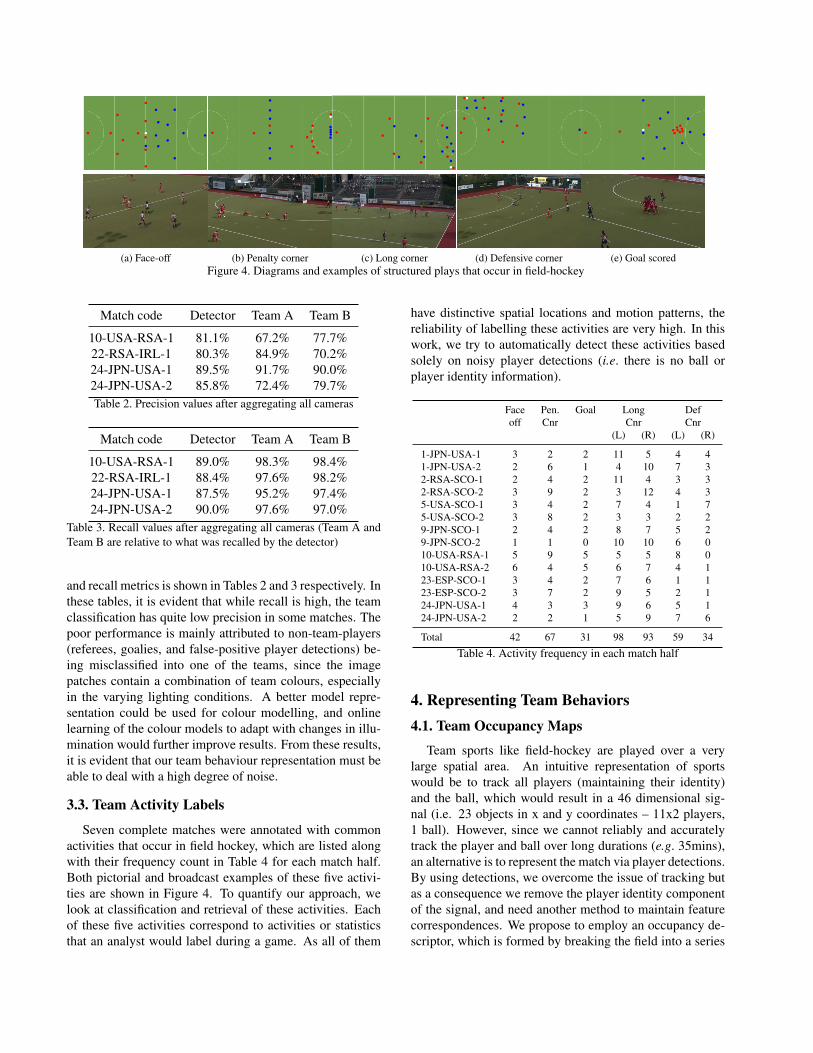
(a) Face-off (b) Penalty corner (c) Long corner (d) Defensive corner (e) Goal scoredFigure 4. Diagrams and examples of structured plays that occur in field-hockey
Match code Detector Team A Team B
10-USA-RSA-1 81.1% 67.2% 77.7%22-RSA-IRL-1 80.3% 84.9% 70.2%24-JPN-USA-1 89.5% 91.7% 90.0%24-JPN-USA-2 85.8% 72.4% 79.7%Table 2. Precision values after aggregating all cameras
Match code Detector Team A Team B
10-USA-RSA-1 89.0% 98.3% 98.4%22-RSA-IRL-1 88.4% 97.6% 98.2%24-JPN-USA-1 87.5% 95.2% 97.4%24-JPN-USA-2 90.0% 97.6% 97.0%
Table 3. Recall values after aggregating all cameras (Team A andTeam B are relative to what was recalled by the detector)
and recall metrics is shown in Tables 2 and 3 respectively. Inthese tables, it is evident that while recall is high, the teamclassification has quite low precision in some matches. Thepoor performance is mainly attributed to non-team-players(referees, goalies, and false-positive player detections) be-ing misclassified into one of the teams, since the imagepatches contain a combination of team colours, especiallyin the varying lighting conditions. A better model repre-sentation could be used for colour modelling, and onlinelearning of the colour models to adapt with changes in illu-mination would further improve results. From these results,it is evident that our team behaviour representation must beable to deal with a high degree of noise.
3.3. Team Activity LabelsSeven complete matches were annotated with common
activities that occur in field hockey, which are listed alongwith their frequency count in Table 4 for each match half.Both pictorial and broadcast examples of these five activi-ties are shown in Figure 4. To quantify our approach, welook at classification and retrieval of these activities. Eachof these five activities correspond to activities or statisticsthat an analyst would label during a game. As all of them
have distinctive spatial locations and motion patterns, thereliability of labelling these activities are very high. In thiswork, we try to automatically detect these activities basedsolely on noisy player detections (i.e. there is no ball orplayer identity information).
Face Pen. Goal Long Defoff Cnr Cnr Cnr
(L) (R) (L) (R)
1-JPN-USA-1 3 2 2 11 5 4 41-JPN-USA-2 2 6 1 4 10 7 32-RSA-SCO-1 2 4 2 11 4 3 32-RSA-SCO-2 3 9 2 3 12 4 35-USA-SCO-1 3 4 2 7 4 1 75-USA-SCO-2 3 8 2 3 3 2 29-JPN-SCO-1 2 4 2 8 7 5 29-JPN-SCO-2 1 1 0 10 10 6 010-USA-RSA-1 5 9 5 5 5 8 010-USA-RSA-2 6 4 5 6 7 4 123-ESP-SCO-1 3 4 2 7 6 1 123-ESP-SCO-2 3 7 2 9 5 2 124-JPN-USA-1 4 3 3 9 6 5 124-JPN-USA-2 2 2 1 5 9 7 6
Total 42 67 31 98 93 59 34Table 4. Activity frequency in each match half
4. Representing Team Behaviors4.1. Team Occupancy Maps
Team sports like field-hockey are played over a verylarge spatial area. An intuitive representation of sportswould be to track all players (maintaining their identity)and the ball, which would result in a 46 dimensional sig-nal (i.e. 23 objects in x and y coordinates – 11x2 players,1 ball). However, since we cannot reliably and accuratelytrack the player and ball over long durations (e.g. 35mins),an alternative is to represent the match via player detections.By using detections, we overcome the issue of tracking butas a consequence we remove the player identity componentof the signal, and need another method to maintain featurecorrespondences. We propose to employ an occupancy de-scriptor, which is formed by breaking the field into a series
of spatial bins and counting the number of players that oc-cupy each of the bins.
The team occupancy descriptor x
o
i
is a quantised oc-cupancy map of the player positions on the field for eachteam represented at time i. Given we have the locationsof players from the player detector system and have as-signed team affiliation, for each frame, an occupancy mapis calculated by quantising the field into P bins, and count-ing how many player detections for that team fall withineach location. The dimensionality of the formation de-scriptor is equal to twice the number of bins (i.e. P ⇥ 2)so that both teams A and B are accounted for, resultingin x
o
i
= [a1, . . . , aP ; b1, . . . , bP ], where a
l
and b
l
are theplayer counts for teams A and B in each bin l. Depend-ing on the level of complexity of the activity that we wantto recognise, we can use varying descriptors (coarse tofine). In this paper we evaluate five different descriptorsizes: P = 2(2 ⇥ 1), P = 8(4 ⇥ 2), P = 32(8 ⇥ 4),P = 135(15 ⇥ 9), and P = 540(30 ⇥ 18). The differ-ent quantisations represent how much tolerance there is inplayer’s positions within an activity and can be thought ofas the space each player occupies in the activity (e.g. in15⇥ 9 quantisation, each player occupies an area of 6m2).
Since an activity can occur for either team, we comparethe template descriptors in both orientations (xo = [a,b]T ,and x
o = [brot
,a
rot
]T , where a
rot
represents a rotation ofthe field by 180� for team a’s formation descriptor, so thatthe new descriptor is given by a
rot
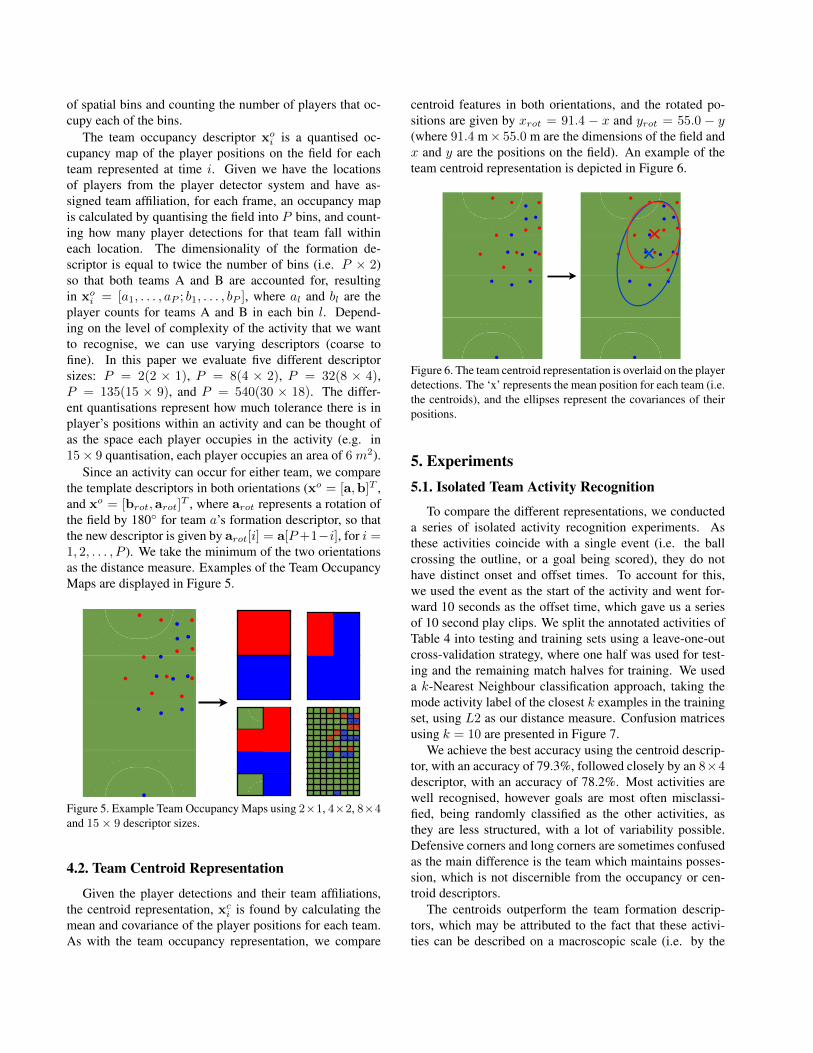
[i] = a[P+1�i], for i =1, 2, . . . , P ). We take the minimum of the two orientationsas the distance measure. Examples of the Team OccupancyMaps are displayed in Figure 5.
a b d g h z a c d k p m n o s p g a d
d z k s p l n m v z q e t e p a b g h c
Team A Playbook
Team B Playbook
Figure 5. Example Team Occupancy Maps using 2⇥1, 4⇥2, 8⇥4and 15⇥ 9 descriptor sizes.
4.2. Team Centroid RepresentationGiven the player detections and their team affiliations,
the centroid representation, xc
i
is found by calculating themean and covariance of the player positions for each team.As with the team occupancy representation, we compare
centroid features in both orientations, and the rotated po-sitions are given by x
rot
= 91.4 � x and y
rot
= 55.0 � y
(where 91.4 m⇥ 55.0 m are the dimensions of the field andx and y are the positions on the field). An example of theteam centroid representation is depicted in Figure 6.
a b d g h z a c d k p m n o s p g a d
d z k s p l n m v z q e t e p a b g h c
Team A Playbook
Team B Playbook
a b d g h z a c d k p m n o s p g a d
d z k s p l n m v z q e t e p a b g h c
Team A Playbook
Team B Playbook
Figure 6. The team centroid representation is overlaid on the playerdetections. The ‘x’ represents the mean position for each team (i.e.the centroids), and the ellipses represent the covariances of theirpositions.
5. Experiments5.1. Isolated Team Activity Recognition
To compare the different representations, we conducteda series of isolated activity recognition experiments. Asthese activities coincide with a single event (i.e. the ballcrossing the outline, or a goal being scored), they do nothave distinct onset and offset times. To account for this,we used the event as the start of the activity and went for-ward 10 seconds as the offset time, which gave us a seriesof 10 second play clips. We split the annotated activities ofTable 4 into testing and training sets using a leave-one-outcross-validation strategy, where one half was used for test-ing and the remaining match halves for training. We useda k-Nearest Neighbour classification approach, taking themode activity label of the closest k examples in the trainingset, using L2 as our distance measure. Confusion matricesusing k = 10 are presented in Figure 7.
We achieve the best accuracy using the centroid descrip-tor, with an accuracy of 79.3%, followed closely by an 8⇥4descriptor, with an accuracy of 78.2%. Most activities arewell recognised, however goals are most often misclassi-fied, being randomly classified as the other activities, asthey are less structured, with a lot of variability possible.Defensive corners and long corners are sometimes confusedas the main difference is the team which maintains posses-sion, which is not discernible from the occupancy or cen-troid descriptors.
The centroids outperform the team formation descrip-tors, which may be attributed to the fact that these activi-ties can be described on a macroscopic scale (i.e. by the

2 x 1 Confusion Matrix
fo go pc lcl lcr dcl dcr
fo
go
pc
lcl
lcr
dcl
dcr0
20
40
60
80
1004 x 2 Confusion Matrix
fo go pc lcl lcr dcl dcr
fo
go
pc
lcl
lcr
dcl
dcr0
20
40
60
80
1008 x 4 Confusion Matrix
fo go pc lcl lcr dcl dcr
fo
go
pc
lcl
lcr
dcl
dcr0
20
40
60
80
10015 x 9 Confusion Matrix
fo go pc lcl lcr dcl dcr
fo
go
pc
lcl
lcr
dcl
dcr0
20
40
60
80
10030 x 18 Confusion Matrix
fo go pc lcl lcr dcl dcr
fo
go
pc
lcl
lcr
dcl
dcr0
20
40
60
80
100Centroid Confusion Matrix
fo go pc lcl lcr dcl dcr
fo
go
pc
lcl
lcr
dcl
dcr0
20
40
60
80
1004x2, accur. = 74.2% 8x4, accur. = 78.2% 15x9, accur. = 74.0% 30x18, accur. = 69.1% Centroids, accur. = 79.3%2x1, accur. = 44.2%
Figure 7. Confusion matrices for isolated activity recognition using different descriptor sizes, and centroids (far right)
global distribution of players, which is captured by the cen-troid, rather than individual positions as represented by themore fine descriptors). The 8 ⇥ 4 descriptor captures sim-ilar granularity to the centroid and is also very effective indistinguishing between the labelled activities, and both rep-resentations are able to accurately recognise the game state,despite their simplicity, in the presence of noise and withoutany tracking information.
5.2. Continuous Team Activity RecognitionRecognising team activities in a continuous sense is a
more challenging task than isolated recognition, as eventsare not separated and a lot of movements and formationscan appear very similar to labelled activities (particularlywithout knowledge of where the ball is, and in the presenceof noise). In this section, we qualitatively demonstrate howour representations can be used to retrieve team activities ina continuous domain.
In Figure 8, centroids for match half 24-USA-JPN-1 aredisplayed with ground truth labels for goals and penalty cor-ners. It can be seen that goals correspond to regions whereboth teams are located close to the goals, followed by amovement to the centre of the field. A penalty corner (‘PC’)is characterised by the team centroids being separated for aduration of time (as they move into formation, and the at-tacking team plans their attack), followed by a convergencetowards the goal when the ball is brought into play. This in-formation can be used to quickly recognise the game state.
0 1 2 3 4 5 6 7x 10⁴
0
10
20
30
40
50
60
70
80
90
Y C
entr
oid
Posi
tion
Time (frames)
USA Goal USA PC USA GoalJPN PC JPN Goal
Figure 8. Team centroids (y-position) across a match half 24-USA-JPN-1. It can be seen that centroids provide important informationfor game state and can be used to assist in retrieving activities.
While centroids are very useful, many team behaviourswill have similar centroids, and to pick up on more specificbehaviours and activities, a finer descriptor is necessary. Todemonstrate retrieval, we calculate the distances between
the occupancy map descriptors extracted from a game anda template of the activity of interest using a sliding window.In Figure 9, we used a 15 ⇥ 9 descriptor to recognise twodifferent activities in match half 2-RSA-SCO-2. A 15 ⇥ 9descriptor was used as it was found that a smaller descriptorsize was often confused with non-activities when comparedin a continuous domain. It can be seen that the descriptoris able to effectively locate the ground truth activity regionsfor a penalty corner and a face off.
0 2000 4000 6000 8000 10000
4
5
6
7
8
9
10
x 10−3 PC RRMS − Distance from Template, GameID3
Descriptor index
Dis
tanc
e fro
m te
mpl
ate
0 2000 4000 6000 8000 100007
8
9
10
11
12x 10−3 FO RRMS − Distance from Template, GameID3
Descriptor index
Dist
ance
from
tem
plat
e
Figure 9. Retrieval distances for a Penalty Corner (left) and FaceOff (right). The plots show the distances from an example activitytemplate we wish to retrieve (in blue) vs ground truth activity onset(black dashed vertical line). A low distance (high similarity) isapparent at the ground-truth locations.
6. Conclusions
Accurately tracking players over long durations of timeis an unsolved computer vision problem, and prevents auto-mated analysis of team sports using traditional representa-tions based on player tracks. In this paper, we presented afully automated method which is able to recognise team ac-tivities from raw player detections, without player trackingor ball information. We investigated two representations –a team centroid representation and team occupancy maps –which are robust to missed and false detections and demon-strated that both team occupancy maps and centroids canbe used to accurately recognise team activities in the pres-ence of noise. While both representations are able to detectteam activities quite well, the occupancy map can be usedto retrieve more specific team activities.
Future work will involve improving the team classifica-tion, and learning activities in an unsupervised fashion. Wealso seek to automatically predict future events/activitiesbased on an observed sequence of play.
References[1] D. Avrahami-Zilberbrand, B. Banerjee, L. Kraemer,
and J. Lyle. Multi-Agent Plan Recognition: Formal-ization and Algorithms. In AAAI, 2010.
[2] M. Beetz, N. von Hoyningen-Huene, B. Kirchlechner,S. Gedikli, F. Siles, M. Durus, and M. Lames. AS-POGAMO: Automated Sports Game Analysis Mod-els. International Journal of Computer Science inSport, 8(1), 2009.
[3] P. Carr, Y. Sheikh, and I. Matthews. Monocular objectdetection using 3d geometric primitives. In ECCV.Springer, 2012.
[4] M. Chang, N. Krahnstoever, and W. Ge. ProbabilisticGroup-Level Motion Analysis and Scenario Recogni-tion. In ICCV, 2011.
[5] T. D’Orazio and M. Leo. A Review of Vision-BasedSystems for Soccer Video Analysis. Pattern Recogni-tion, 43(8), 2010.
[6] A. Gupta, P. Srinivasan, J. Shi, and L. Davis. Un-derstanding Videos, Constructing Plots: Learning aVisually Grounded Storyline Model from AnnotatedVideos. In CVPR, 2009.
[7] A. Hervieu and P. Bouthemy. Understanding sportsvideo using players trajectories. In J. Zhang, L. Shao,L. Zhang, and G. Jones, editors, Intelligent VideoEvent Analysis and Understanding. Springer Berlin /Heidelberg, 2010.
[8] R. Hess and A. Fern. Discriminatively Trained ParticleFilters for Complex Multi-Object Tracking. In CVPR,2009.
[9] R. Hess, A. Fern, and E. Mortensen. Mixture-of-Parts Pictorial Structures for Objects with VariablePart Sets. In ICCV, 2007.
[10] C. Huang, H. Shih, and C. Chao. Semantic Analysisof Soccer Video using Dynamic Bayesian Networks.T. Multimedia, 8(4), 2006.
[11] S. Intille and A. Bobick. A Framework for Recog-nizing Multi-Agent Action from Visual Evidence. InAAAI, 1999.
[12] S. Intille and A. Bobick. Recognizing Planned, Multi-Person Action. Computer Vision and Image Under-standing, 81:414–445, 2001.
[13] K. Kim, M. Grundmann, A. Shamir, I. Matthews,J. Hodgins, and I. Essa. Motion Fields to Predict PlayEvolution in Dynamic Sports Scenes. In CVPR, 2010.
[14] M. Lazarescu and S. Venkatesh. Using Camera Mo-tion to Identify Different Types of American FootballPlays. In ICME, 2003.
[15] R. Li and R. Chellappa. Group Motion Segmenta-tion Using a Spatio-Temporal Driving Force Model.In CVPR, 2010.
[16] R. Li, R. Chellappa, and S. Zhou. Learning Multi-Modal Densities on Discriminative Temporal Inter-action Manifold for Group Activity Recognition. InCVPR, 2009.
[17] J. Liu, P. Carr, R. Collins, and Y. Liu. Tracking SportsPlayers with Context-Conditioned Motion Models. InCVPR, 2013.
[18] T. Liu, W. Ma, and H. Zhang. Effective FeatureExtraction for Play Detection in American FootballVideo. In MMM, 2005.
[19] P. Lucey, A. Bialkowski, P. Carr, S. Morgan,I. Matthews, and Y. Sheikh. Representing and Discov-ering Adversarial Team Behaviors using Player Roles.In CVPR, 2013.
[20] A. Money and H. Agius. Video Summarisation: AConceptual Framework and Survey of the State of theArt. Journal of Visual Communication and ImageRepresentation, 19(2):121–143, 2008.
[21] V. Morariu and L. Davis. Multi-Agent Event Recog-nition in Structured Scenarios. In CVPR, 2011.
[22] M. Perse, M. Kristan, S. Kovacic, and J. Pers. ATrajectory-Based Analysis of Coordinated Team Ac-tivity in Basketball Game. Computer Vision and Im-age Understanding, 2008.
[23] A. Sadilek and H. Kautz. Recognizing Multi-AgentActivities from GPS Data. In AAAI, 2008.
[24] B. Siddiquie, Y. Yacoob, and L. Davis. RecognizingPlays in American Football Videos. Technical report,University of Maryland, 2009.
[25] D. Stracuzzi, A. Fern, K. Ali, R. Hess, J. Pinto, N. Li,T. Konik, and D. Shapiro. An Application of Trans-fer to American Football: From Observation of RawVideo to Control in a Simulated Environment. AIMagazine, 32(2), 2011.
[26] G. Sukthankar and K. Sycara. Hypothesis Pruningand Ranking for Large Plan Recognition Problems. InAAAI, 2008.
[27] G. Sukthankar and K. Sycara. Activity Recognitionfor Dynamic Multi-Agent Teams. ACM Trans. Intell.Syst. Technol, 2012.
[28] C. Xu, Y. Zhang, G. Zhu, Y. Rui, H. Lu, and Q. Huang.Using Webcast Text for Semantic Event Detection inBroadcast. T. Multimedia, 10(7), 2008.
[29] Y. Zhang, W. Ge, M. Chang, and X. Liu. Group Con-text Learning for Event Recognition. In WACV, 2012.