‘recipe for safety’ initiative - iosh
TRANSCRIPT

The joint industry/HSE ‘Recipe for Safety’ initiative - an update
Richard Morgan, Head of HSE General Manufacturing Section
October 2013

Recipe for Safety – the beginning
Joint HSE/food industry initiative to reduce injuries & occupational ill-health at work
Started in early 1990s after HSC highlighted in their ‘Plan of Work 1990/91’ food manufacture injuries were
2.3x the ‘all-manufacturing’ average main causes of injuries needed to be identified/addressed
HSE Food Section worked with the FDF H&S Committee and TUs to: identify the main causes of injuries/ill health agree and publish industry/topic guidance became known as the ‘Recipe for Safety’ initiative

Recipe for Safety
R4S initiative currently overseen by the Food & Drink Manufacture H&S Forum
14 trade associations 4 trade unions HSE Manufacturing Sector with support from IOSH Food & Drink Group >>>
Meets 2x year to discuss and take action on H&S priorities Aim to reduce injuries and occupational ill health

Food & drink manufacturing forum
Members: Food & Drink Federation
Dairy UK
Agricultural Industries Confederation
British Poultry Council
Meat Trades Joint Working Party
National Assoc. of Master Bakers
Federation of Bakers
Chilled Food Association
National Assoc. of British & Irish Millers
British Beer & Pub Association
British Soft Drinks Association
Pet Food Manufacturers’ Association
Scotch Whisky Association
Maltsters’ Association of GB
GMB, T&G, USDAW & BFAWU
HSE Manufacturing Sector
IOSH Food and Drink Group

Recipe for Safety Causes of injuries and occupational ill health

Causes of injuries and ill health April 1943
H&S problems included:
lung disease
lifting weights - guidance then 65lb(30kg) for women and 45lb(20kg) for girls of 14 yrs
dermatitis
machinery (then causing 18%
of accidents, now 8%)

H&S problems April 1943
Other issues:
lead poisoning (from 1058
cases/yr in 1900 to 72 cases/yr in 1942)
dust explosions (‘frequent’)
absenteeism from TNT & detonator factories

TNT factory

TNT factory 35 women died

H&S priorities April 1943
Other priorities:
how to camouflage your factory
employers obligations re: venereal disease
employment of police-women in factories to
‘ensure girls did not do things they should not do’

Factory policewomen ‘….principally there for moral guidance….’

Food & drink manufacture Causes of injuries and ill health 2013

Injuries in GB food/drink manufacture
In the 30 different food/drink manufacturing industries:
5200 injuries/year* reported to HSE under RIDDOR (23% of all manufacturing injuries reported to HSE)
average injury rate (injuries per 100,000 workers) is 1.6x general manufacture average
plus around 11,000 cases of occupational ill health * injuries prior to 2012, injuries reduced to 4,043 injuries/yr in 2012/13 with change from O-3-D to O-7-D reporting

Variation in injury rates 2011/12 for 16 food & drink manufacturing industries
0
200
400
600
800
1000
1200
1400
1600
1800
2000
2200
2400
2600
2800
Inju
ries p
er
10
0,0
00
wo
rkers
Food or drink sector
Processing poultry
Processing meat
Dairies and cheese making
FOOD MANUFACTURING AVERAGE
Bread and fresh pastry/cakes
Soft drinks
Processing fish
Brewing
Meat and poultry products
Sugar confectionery
Grain and flour milling
Spirits
Animal feeds
Fruit and vegetable processing
Potato processing
Margarine & edible fats
Homogenised/dietetic foods

Causes of injury in food and drink manufacture
0
200
400
600
800
1000
1200
1400
1600
Nu
mb
er
of
inju
rie
s
Injury agent
Analysis of >5000 major and over-3-day absence injuries
Manual handling (32%)
Slips/trips - mostly slips (25%)
Hit by moving/falling object (13%)
Moving machinery (8%)
Falls from height (6%)
Hit something fixed/stationary (5%)
Contact with harmful substance (4%)
Hit by moving vehicle (2%)
Injured by animal (0.4%)
Electricity (0.4%)
Physical assault (0.2%)
Fire/explosion (0.1%)
Drowned/asphyxiated

Main causes of occupational ill health in food/drink manufacture
35
29
23
64
2 10
5
10
15
20
25
30
35
%
Back injuries
Mental ill health
Upper limb disorders
Occupational asthma
Occupational dermatitis
Rhinitis
Hearing loss

‘Recipe for Safety’ priority topics
>96% of all injuries /ill health caused by just 12 things: workplace transport falls from height machinery/plant entry into confined spaces slips/trips struck by objects/knives
manual handling ULDs occupational asthma dermatitis noise-induced hearing loss work-related stress

A Recipe for Safety booklet
highlights the 12 H&S priorities and how to tackle them
First edition 1993
Second edition 1999
Third edition 2005
Fourth edition 2013/14 (in draft) also on HSE website: www.hse.gov.uk/food

priority topics
1943 manual handling
machinery
dermatitis
lung disease
morals
VD
how to camouflage factory
lead poisoning
dust explosions
2013
manual handling/ULDs
machinery
dermatitis
occupational asthma
workplace transport
falls from height
slips/trips
entry to confined spaces
struck by objects
noise-induced hearing loss
work-related stress

R4S initiative
……… success so far ……………>>

Overall injury rate (food & drink manufacture)
56% injury rate drop between 1990/91-2011/12
(O-3-D reporting was replaced by O-7-D reporting April 2012 so comparable data 2012/13 not available)
Note: 'Recipe for Safety' initiative started 1990
700
1100
1500
1900
2300
2700
1987
/88
1988
/89
1989
/90
1990
/91
1991
/92
1992
/93
1993
/94
1994
/95
1995
/96
1996
/97
1997
/98
1998
/99
1999
/00
2000
/01
2001
/02
2002
/03
2003
/04
2004
/05
2005
/06
2006
/07
2007
/08
2008
/09
2009
/10
2010
/11
2011
/12
All
in
jury r
ate
Pre RFS initiative RFS initiative (SIC2003 data) RFS initiative (SIC2007 data)

Major injury rate (food & drink manufacture)
42% injury rate drop in 16 yrs. (since RIDDOR 95)
150
200
250
300
350
1996/
97
1997/
98
1998/
99
1999/
00
2000/
01
2001/
02
2002/
03
2003/
04
2004/
05
2005/
06
2006/
07
2007/
08
2008/
09
2009/
10
2010/
11
2011/
12
2012/
13
Ma
jor
inju
ry r
ate
Food/drink major injury rate (SIC2003) Food/drink major injury rate (SIC2007)

Food industry fatal injuries Analysis from April 2000 - 2013
Topic No. of related fatals
Machinery/plant 20 (35%) Transport 15 (26%) Falls from height 10 (18%) Confined space/asphyxiation 6 (11%) Hit by object 4 (7%) Animal 1 (2%) Electrocution 1 (2%) Total 57

Fatal injuries/year - food & drink manufacture 2001/02 - 2012/13
0123456789
101112
1987/88
1988/89
1989/90
1990/91
1991/92
1992/93
1993/94
1994/95
1995/96
1996/97
1997/98
1998/99
1999/00
2000/01
2001/02
2002/03
2003/04
2004/05
2005/06
2006/07
2007/08
2008/09
2009/10
2010/11
2011/12
2012/13
2013/14
Fata
l in
juri
es /
year
Pre RFS initiative RFS initiative running Linear (Pre RFS initiative) Linear (RFS initiative running)

Recipe for Safety 3 challenges for 2014 onwards

Challenges for 2013/14 onwards (1)
Keep concentrating on the R4S priority topics >96% of all injuries /ill health caused by just 12 things:
manual handling/ULDs workplace transport machinery slips/trips falls from height entry to confined spaces struck by objects
dermatitis occupational asthma noise-induced hearing loss work-related stress

Challenges for 2013/14 onwards (2)
continuing to improve communication with non-English speaking workers/migrant workers 30% of food operatives born outside UK
40% of packers born outside UK
- learning from success of others - using the available guidance
e.g. www.hse.gov.uk/food/migrant
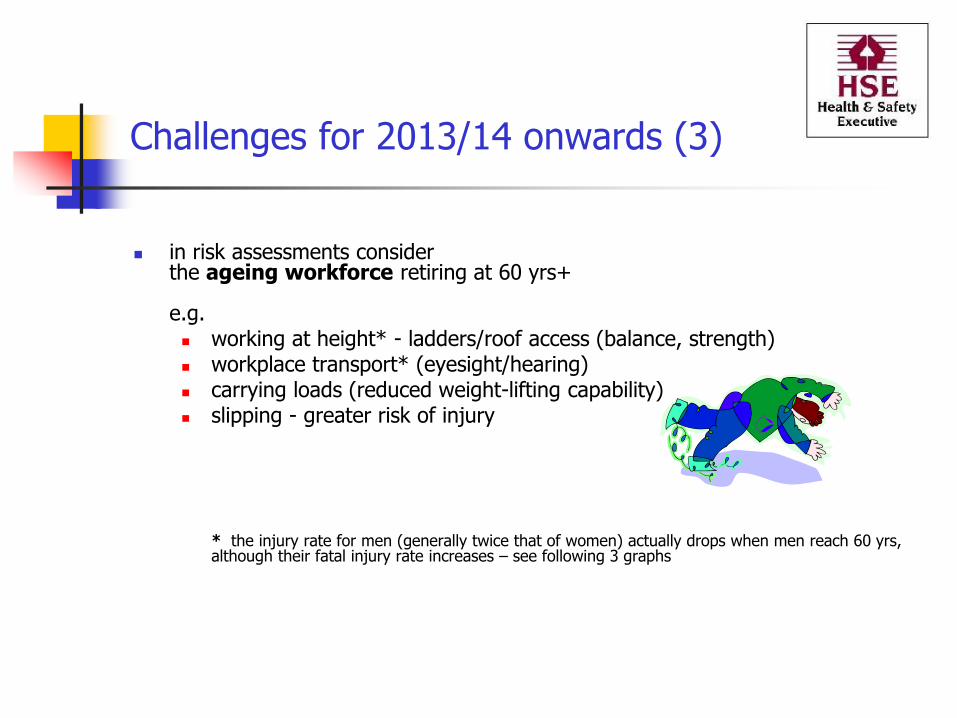
Challenges for 2013/14 onwards (3)
in risk assessments consider the ageing workforce retiring at 60 yrs+ e.g. working at height* - ladders/roof access (balance, strength) workplace transport* (eyesight/hearing) carrying loads (reduced weight-lifting capability) slipping - greater risk of injury
* the injury rate for men (generally twice that of women) actually drops when men reach 60 yrs, although their fatal injury rate increases – see following 3 graphs

Ageing workforce Injury rates (O-3-D) – men twice that of women but reduce >60 yrs (injuries per 100,000 workers in 2008/09p)
0
100
200
300
400
500
600
16-19 20-24 25-34 35-44 45-54 55-59 60-64 65+
age of worker (yrs)
male - O-3-D female - O-3-D
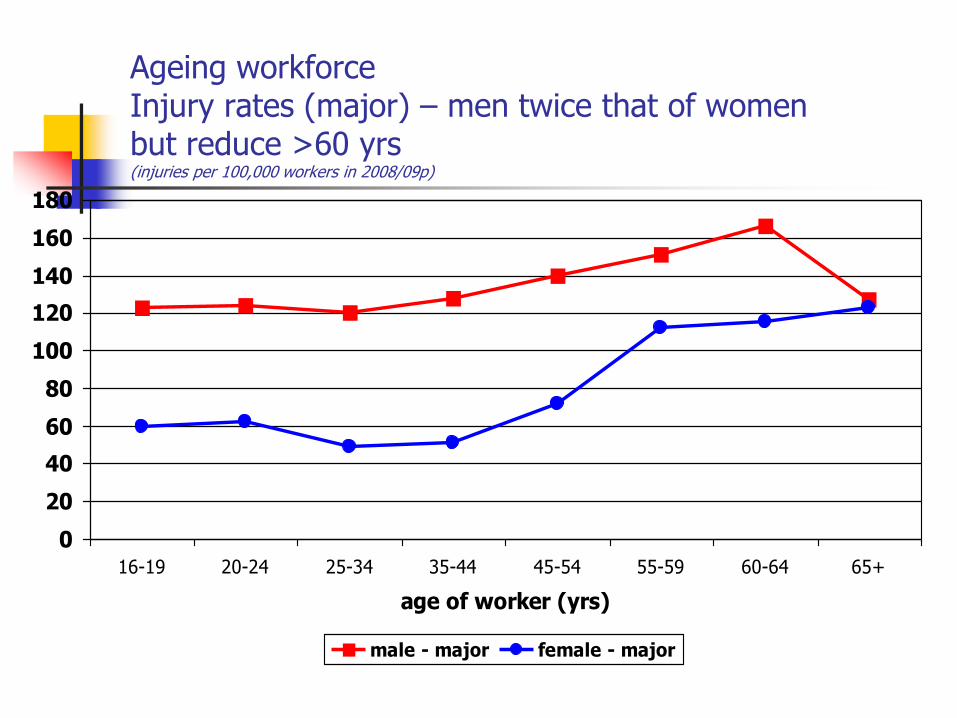
Ageing workforce Injury rates (major) – men twice that of women but reduce >60 yrs (injuries per 100,000 workers in 2008/09p)
0
20
40
60
80
100
120
140
160
180
16-19 20-24 25-34 35-44 45-54 55-59 60-64 65+
age of worker (yrs)
male - major female - major

Ageing workforce Fatal injury rates for GB workers by age (fatalities per 100,000 workers in 2007/08 (blue) and 2008/09 (red)
Fatals at 65+ mainly related to - WPT (eg struck by vehicle) - FFH (eg fall through fragile roof, ladders)
0
1
2
3
4
5
16-19 20-24 25-34 35-44 45-54 55-59 60-64 65+
age of worker (yrs)
male female male female

poorer eyesight……

Challenges for 2013/14 and beyond
> 12 ‘Recipe for Safety’ topics > non-English speaking/migrant workers > risk assessments: consider ageing workforce
