recession, retrenchment, and recovery: state higher
TRANSCRIPT
Recession, Retrenchment, and Recovery: State Higher Education Funding & Student Financial Aid
Center for the Study of Education Policy, Illinois State University National Association of State Student Grant Aid Programs
State Higher Education Executive Officers
October 2006
Supported by funding from the Lumina Foundation for Education
Recession, Retrenchment, and Recovery i
Introduction and Acknowledgements The Recession, Retrenchment, and Recovery Project was first conceived at a 2004 symposium on higher education finance sponsored by the Center for the Study of Education Policy at Illinois State University. During the symposium, concerns were voiced about the gradual but relentless erosion of support for higher education and related decline in financial access for students. Cuts in state funding for higher education combined with increased student demand have resulted in “roller coaster funding” during each of the four recessions in the past 25 years. As the nation emerges from the first recession of the 21st century, states need to assess the consequences, take stock of their challenges and resources, and do what they can to prepare for the inevitable next fiscal crisis. In this context, the particular goal of this project is to identify and disseminate successful state-level strategies and policy tools to protect students’ access to postsecondary education through recession, retrenchment, and recovery, and to identify strategies to help bridge these cycles. Of particular concern to the researchers was the effect of recessions on access to college for students, particularly low-income students. With Lumina Foundation for Education support, three organizations – the Center for the Study of Education Policy at Illinois State University, the National Association of State Student Grant and Aid Programs (NASSGAP), and the State Higher Education Executive Officers (SHEEO) –conducted this project. The first step was to collect trend data from various sources. The researchers appreciate the assistance and cooperation of David Wright of SHEEO’s State Higher Education Finance; James Palmer, Grapevine; Virginia McMillan, Consultant,
and Frank Morgan, National Center for Education Statistics (NCES); Mike Solomon, NASSGAP Annual Report on Student Financial Aid; Sue Kleeman, the Illinois Student Assistance Commission; Caroline Altman Smith and Dewayne Mathews, Lumina Foundation for Education; Kathy Raudenbush, State of Washington Higher Education Coordinating Board; and Tom Mortenson, Higher Education Opportunity. We are grateful for the advice and assistance of the members of our National Advisory Committee, each of whom brought to the project special expertise and a firm dedication to access for students. Several people provided guidance and support throughout the project—Charles Lenth, SHEEO, Cheryl Maplethorpe, the Minnesota Office of Higher Education, and Steven Bragg, James Palmer and Debra Smitley, Illinois State University. We also wish to acknowledge the time and counsel provided by the 54 individuals interviewed in the seven states we visited. The unique and complimentary expertise and extraordinary contributions of the seven member project team provided this report with a high level of quality on every front. Edward R. Hines headed the economic and fiscal analysis team, Allison Ambrose compiled state profiles, Chris Mushrush served as economic and statistical consultant, Sheila Pruden was the financial aid policy consultant and headed the survey team, Paul Vogt served as methodologist, Kathleen Kelly served as lead author and principal contributor to the fiscal analysis, and Ross Hodel was the project’s director. Ross Hodel
Illinois State
University
Maureen Laffey
NASSGAP
Paul Lingenfelter
SHEEO
Recession, Retrenchment, and Recovery ii
National Advisory Committee Sandy Baum Senior Policy Analyst The College Board and Skidmore College David W. Breneman Dean, The Curry School of Education University of Virginia Joni Finney Vice President National Center for Public Policy & Higher Education Larry Gladieux Education and Public Policy Consultant Donald E. Heller Center for the Study of Higher Education The Pennsylvania State University
Stanley G. Jones Commissioner Indiana Commission for Higher Education David Longanecker Executive Director Western Interstate Higher Education Commission Cheryl Maplethorpe Director, Student Financial Aid Services Minnesota Office of Higher Education Reginald Robinson President and CEO Kansas Board of Regents Richard Wagner Executive Director; Retired Illinois Board of Higher Education
The opinions expressed in this report are those of the authors and do no necessarily represent the view of Lumina Foundation or its employees.
Lumina Foundation for Education, an Indianapolis-based, private, independent foundation, strives to help people achieve their potential by expanding access and success in education beyond high school. Through grants for research, innovation, communication, and evaluation, as well as policy education and leadership development, Lumina Foundation addresses issues that affect access and educational attainment among all students, particularly underserved student groups, including adult learners. The Foundation bases its mission on the belief that postsecondary education remains one of the most beneficial investments that individuals can make in themselves and that society can make in its people. For more details on the Foundation, visit its Web site at www.luminafoundation.org.

Recession, Retrenchment, and Recovery iii
Recession, Retrenchment, and Recovery iv
Contents
Executive Summary .................................................................... 1 Introduction Recession: Consequences on State Funding and Financial Access Retrenchment: The Impact of the 2001 Recession Recovery and Beyond: Strategies for Maintaining Financial Access
Introduction ............................................................................... 7 Purpose of the Project Background Normal Cycle or Downward Spiral Priorities and Policy Choices
Chapter 1 - Consequences of Recessions ................................... 11
Introduction Data and Methods Findings
States’ Economies and Higher Education Appropriations National Recessions Recessions and Higher Education Appropriations Financial Access
Factors Affecting Financial Access Indicators of Financial Access Balancing Need-based Aid and Tuition Balancing Need-based Aid and Tuition with Family Income
Selection of States for Further Study Summary and Discussion
Chapter 2 - Impact of the 2001 Recession ...........................................25 Introduction Background Survey Overview The Respondents Survey Results
State and Higher Education Priorities Program and Policy Changes Strategies Used by States to Help Maintain Financial Access Outlook for Recovery
Analysis of Responses Conclusion
Chapter 3 - State Visit Report ..............................................................41 Introduction Overview of Research Methods State Selection Findings
Recession, Retrenchment, and Recovery v
Planning and Coordination Relationships Challenges
Concluding Observations and Recommendations to States in Improving Financial Access to College
Chapter 4 – Recovery and Beyond: Strategies for Maintaining Financial Access .........................................52 Bibliography and References................................................................56 Appendices
1. Fiscal and Economic Analysis Tables .......................................58 2. Data and Research Design ....................................................66 3. State Survey Questionnaire...................................................74 4. Policymakers and Higher Education Leaders Interviewed ...........82
Recession, Retrenchment, and Recovery 1
Recession, Retrenchment, and Recovery Executive Summary
Introduction The Recession, Retrenchment, and Recovery Project examined the effects of recessions on financial access to college during the 25-year period 1979-2004, identified states that have been relatively successful in maintaining financial access, and collected policy strategies used by these states. The national recession of 2001 lasted only a few months, from March to November, but it affected states’ economies and appropriations for higher education for years. A particular concern was the impact of recessions on financial access—the balance of state financial aid and tuition and fees—for students attending public institutions. This project had three phases:
• Analysis of 25-year trends in state appropriations for higher education, allocations to student financial aid, and changes in tuition and fees at public institutions in the context of national recessions and related changes in states’ economies.
• Survey of state higher education
organizations to ascertain how they dealt with the 2001 recession with a focus on priorities that guided state funding and allocation decisions, the changes to programs and policies in response to declining resources, strategies for maintaining financial access, and the outlook for recovery.
• Interviews with higher education,
student financial aid, and governmental leaders in seven states that ranked well on one or more measures of financial access. Interviews addressed policies and strategies the selected states used to
maintain and expand financial access across successive economic cycles.
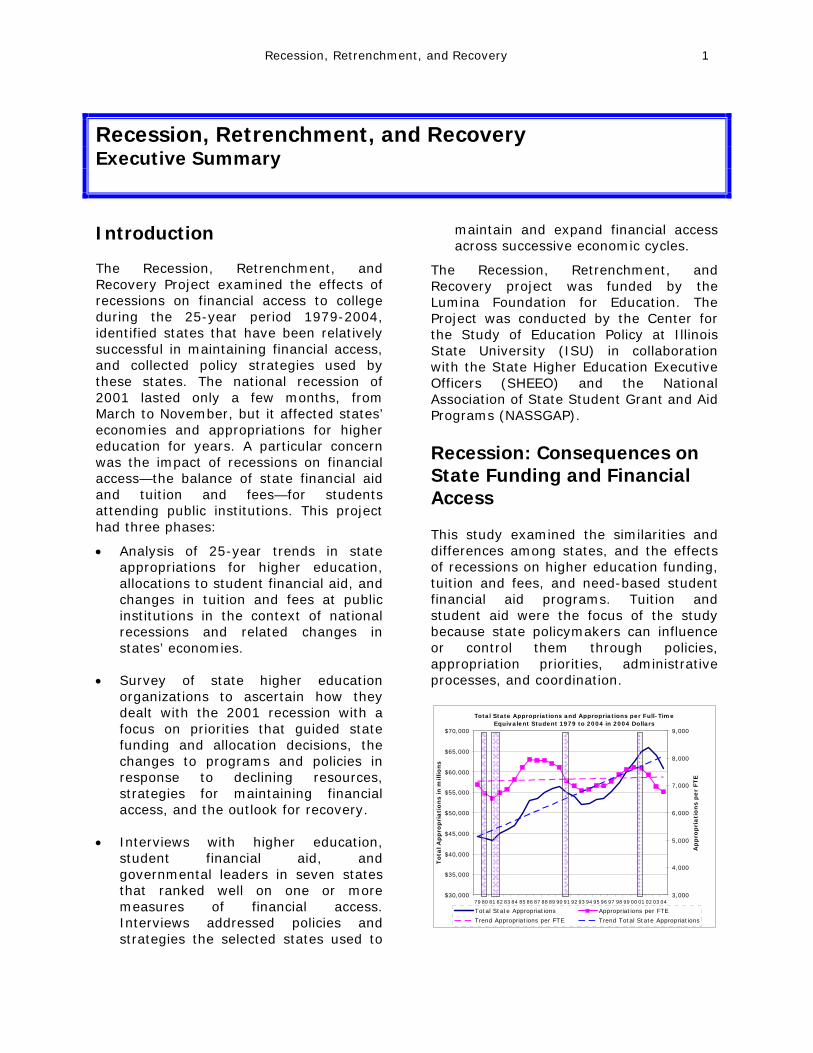
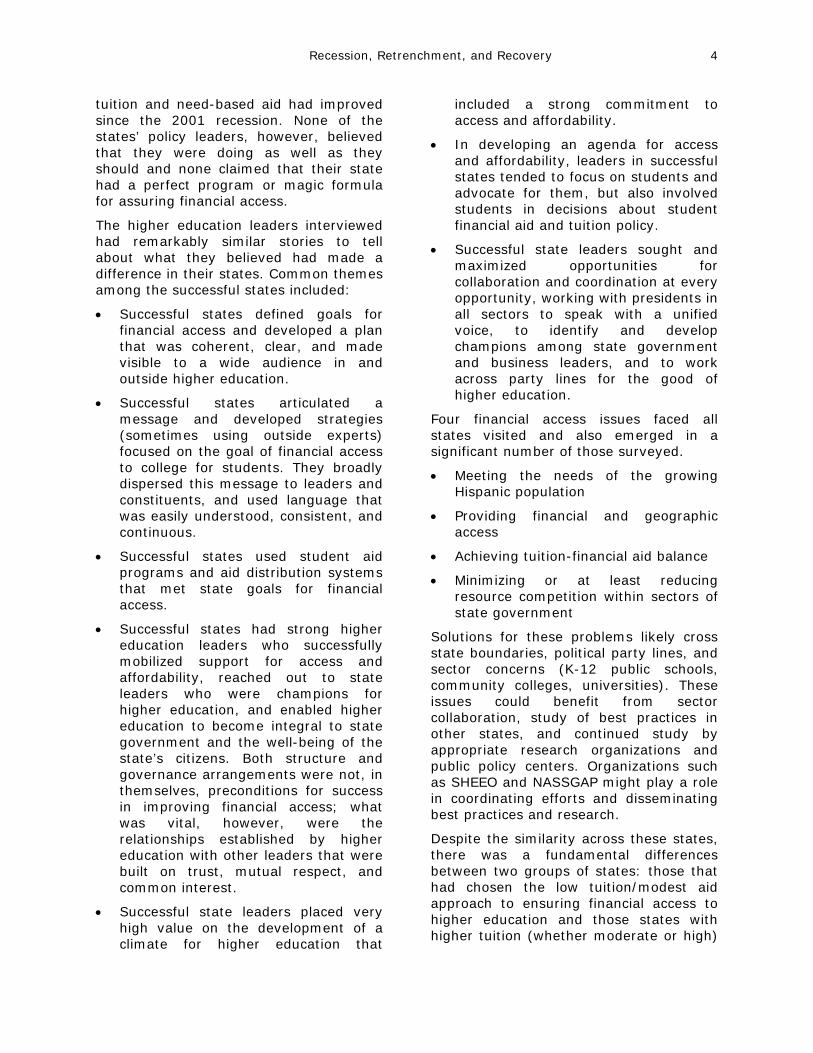
The Recession, Retrenchment, and Recovery project was funded by the Lumina Foundation for Education. The Project was conducted by the Center for the Study of Education Policy at Illinois State University (ISU) in collaboration with the State Higher Education Executive Officers (SHEEO) and the National Association of State Student Grant and Aid Programs (NASSGAP). Recession: Consequences on State Funding and Financial Access This study examined the similarities and differences among states, and the effects of recessions on higher education funding, tuition and fees, and need-based student financial aid programs. Tuition and student aid were the focus of the study because state policymakers can influence or control them through policies, appropriation priorities, administrative processes, and coordination.
Total State Appropriations and Appropriations per Full-Time Equivalent Student 1979 to 2004 in 2004 Dollars
$30,000
$35,000
$40,000
$45,000
$50,000
$55,000
$60,000
$65,000
$70,000
79 80 81 82 83 84 85 86 87 88 89 90 91 92 93 94 95 96 97 98 99 00 01 02 03 04
Tota
l A
pp
rop
ria
tio
ns in m
illio
ns
3,000
4,000
5,000
6,000
7,000
8,000
9,000
Ap
pro
pri
ati
on
s p
er
FTE
Total State Appropriations Appropriations per FTE
Trend Appropriations per FTE Trend Total State Appropriations
Recession, Retrenchment, and Recovery 2
The analyses found that: • Higher education appropriations did
not keep pace with growth in the state economy in any state. In all states, the real Gross State Product (GSP) increased faster than higher education appropriations during the period of the study.
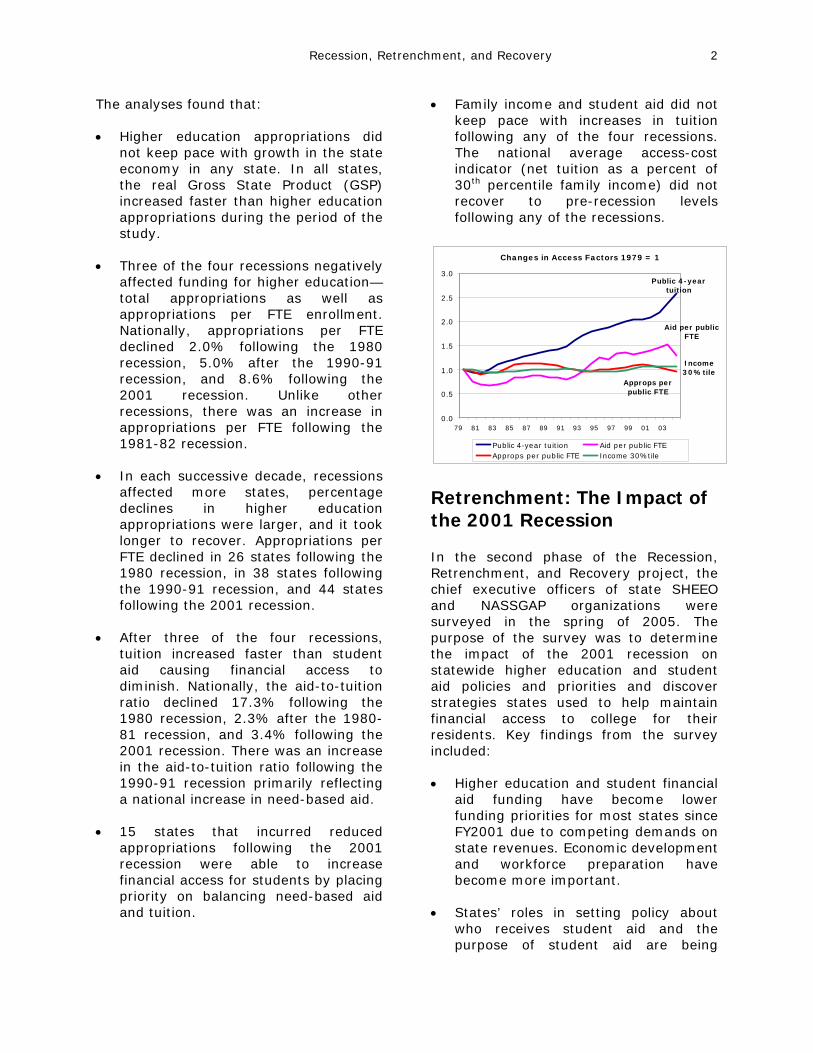
• Three of the four recessions negatively
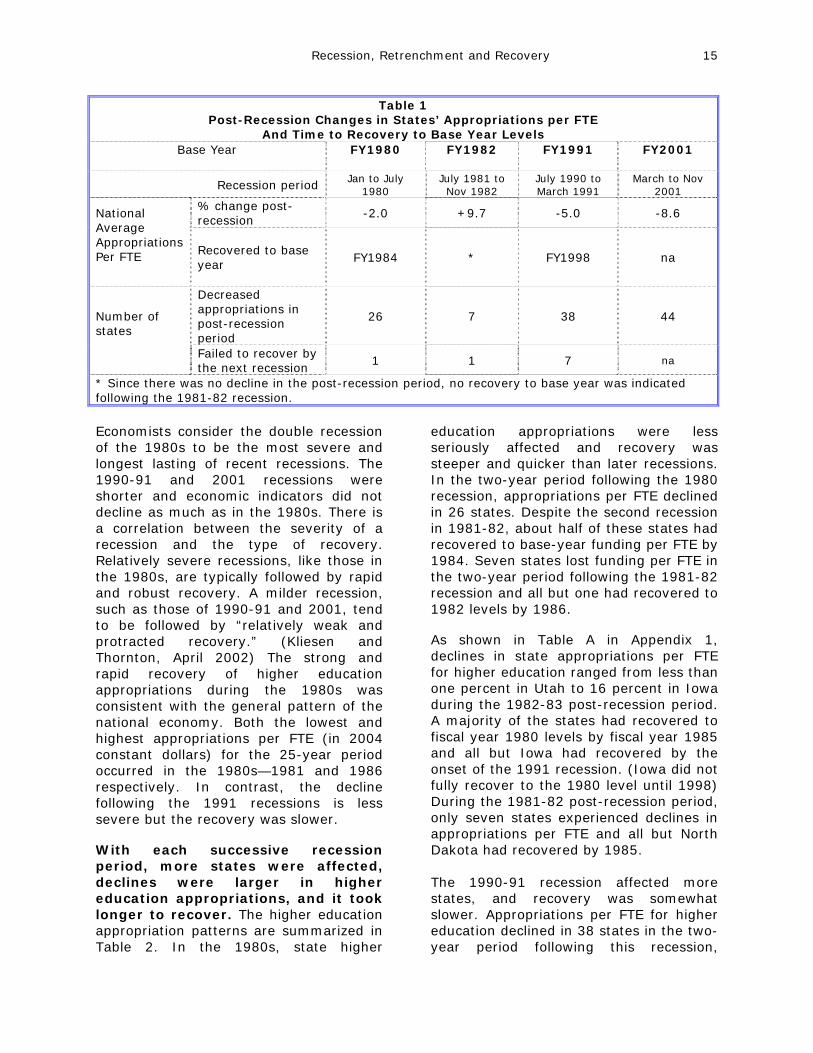
affected funding for higher education—total appropriations as well as appropriations per FTE enrollment. Nationally, appropriations per FTE declined 2.0% following the 1980 recession, 5.0% after the 1990-91 recession, and 8.6% following the 2001 recession. Unlike other recessions, there was an increase in appropriations per FTE following the 1981-82 recession.
• In each successive decade, recessions
affected more states, percentage declines in higher education appropriations were larger, and it took longer to recover. Appropriations per FTE declined in 26 states following the 1980 recession, in 38 states following the 1990-91 recession, and 44 states following the 2001 recession.
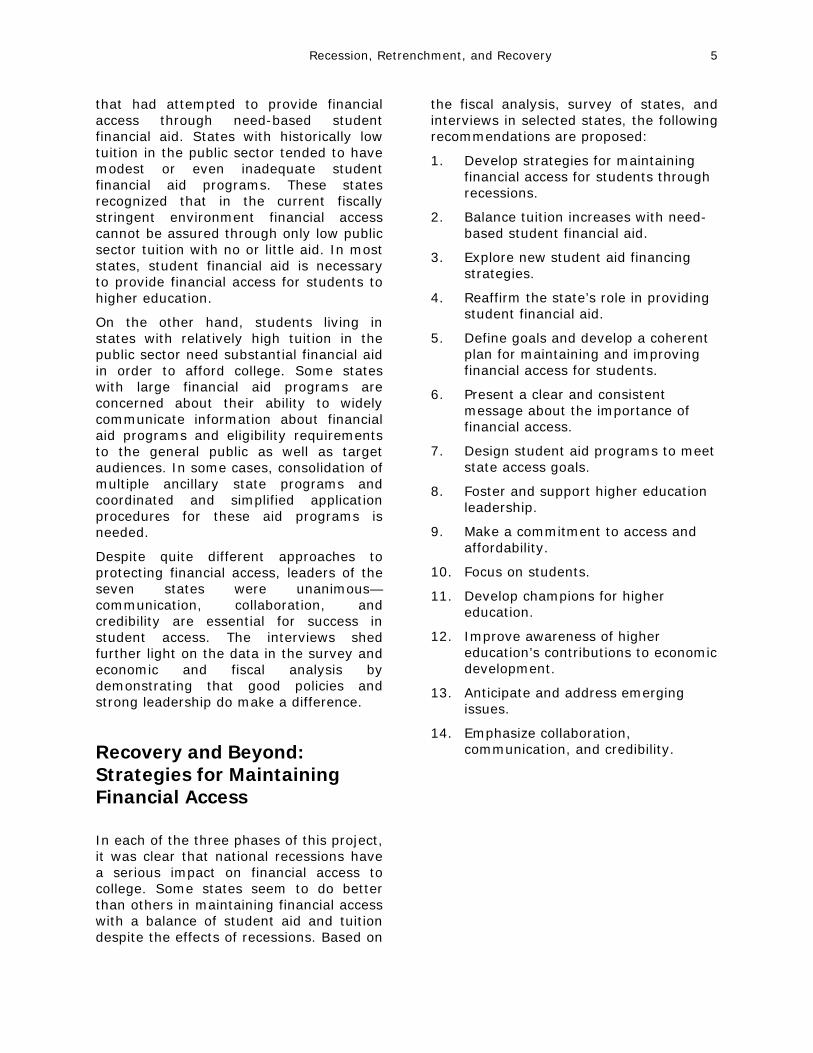
• After three of the four recessions,
tuition increased faster than student aid causing financial access to diminish. Nationally, the aid-to-tuition ratio declined 17.3% following the 1980 recession, 2.3% after the 1980-81 recession, and 3.4% following the 2001 recession. There was an increase in the aid-to-tuition ratio following the 1990-91 recession primarily reflecting a national increase in need-based aid.
• 15 states that incurred reduced
appropriations following the 2001 recession were able to increase financial access for students by placing priority on balancing need-based aid and tuition.
• Family income and student aid did not keep pace with increases in tuition following any of the four recessions. The national average access-cost indicator (net tuition as a percent of 30th percentile family income) did not recover to pre-recession levels following any of the recessions.
Changes in Access Factors 1979 = 1
Public 4-year tuition
Aid per public FTE
Approps per public FTE
Income 30%tile
0.0
0.5
1.0
1.5
2.0
2.5
3.0
79 81 83 85 87 89 91 93 95 97 99 01 03
Public 4-year tuition Aid per public FTEApprops per public FTE Income 30%tile
Retrenchment: The Impact of the 2001 Recession In the second phase of the Recession, Retrenchment, and Recovery project, the chief executive officers of state SHEEO and NASSGAP organizations were surveyed in the spring of 2005. The purpose of the survey was to determine the impact of the 2001 recession on statewide higher education and student aid policies and priorities and discover strategies states used to help maintain financial access to college for their residents. Key findings from the survey included: • Higher education and student financial
aid funding have become lower funding priorities for most states since FY2001 due to competing demands on state revenues. Economic development and workforce preparation have become more important.
• States’ roles in setting policy about
who receives student aid and the purpose of student aid are being
Recession, Retrenchment, and Recovery 3
diluted as increasing amounts of grant aid are provided by institutions through tuition offsets.
• Higher education is more likely to be
seen as a personal benefit than a public benefit, suggesting a lack of understanding of the role of higher education in economic growth. A greater portion of the cost of education is now expected to be paid by the student.
• For many states, tuition offsets—
allocating a percentage of tuition revenue to student aid—represent a last-ditch effort to fund student aid when state funding is not forthcoming.
• State responses suggested that access
had been affected since 2001; more student aid funds were going to traditional college-aged students as opposed to adult learners and more emphasis was being placed on merit as a criterion for eligibility. Initial access to four-year institutions also appears to be threatened for low-income students who are increasingly shifting to lower cost institutions.
Most states cited concerns about structural problems with the state’s economy, Medicaid demands from an aging population, and paying off state deficit financing. Eighteen states thought economic recovery looked promising due to a continually improving economy and revenue growth that had returned to pre-recession levels. Most states who reported their chances for financial recovery as good, however, had concerns about future higher education funding levels. Finally, eight states described their prospects for financial recovery as “weak and of great concern.” States that cited good leadership - either from the Governor, key members of the legislature, the SHEEO and NASSGAP agencies, or coordinated efforts by institutions and sectors of higher education - were more hopeful about their
future. States that cited politics as the key decision factor, however, were considerably less optimistic. States used multiple strategies to help maintain financial access including efforts to protect students from tuition increases using tuition offsets to support low-income students. States cited the use of roundtables, task forces, and statewide planning efforts as ways to engage the “community” in thinking about and addressing higher education and student financial access concerns. Collaboration and unified efforts both within higher education and with local organizations and businesses were seen as an important strategy. Finally, grassroots efforts to involve the public and particularly to work directly with the legislature were key strategies used by states.
Recovery: State Strategies
The third phase of this project consisted of extensive interviews with higher education, student financial aid, and governmental leaders in seven states—Arizona, Illinois, Kansas, Massachusetts, North Carolina, Texas, and Washington. Interviews addressed policies and strategies used by selected states to maintain and expand financial access across successive economic cycles. All state interviews were conducted between February and April of 2006 and a total of 54 individuals were interviewed.
The seven states were selected for in-depth study because they had maintained long-term financial access through the four recessions during the period studied, or they had protected financial access better than others in the two-year period following the 2001 recession. Despite their relative success, all of the states continued to be concerned about maintaining access. Some reported that they had lost ground since the data used in state selection were published and 2006 when the interviews were conducted. Others indicated that the balance between
Recession, Retrenchment, and Recovery 4
tuition and need-based aid had improved since the 2001 recession. None of the states’ policy leaders, however, believed that they were doing as well as they should and none claimed that their state had a perfect program or magic formula for assuring financial access.
The higher education leaders interviewed had remarkably similar stories to tell about what they believed had made a difference in their states. Common themes among the successful states included:
• Successful states defined goals for financial access and developed a plan that was coherent, clear, and made visible to a wide audience in and outside higher education.
• Successful states articulated a message and developed strategies (sometimes using outside experts) focused on the goal of financial access to college for students. They broadly dispersed this message to leaders and constituents, and used language that was easily understood, consistent, and continuous.
• Successful states used student aid programs and aid distribution systems that met state goals for financial access.
• Successful states had strong higher education leaders who successfully mobilized support for access and affordability, reached out to state leaders who were champions for higher education, and enabled higher education to become integral to state government and the well-being of the state’s citizens. Both structure and governance arrangements were not, in themselves, preconditions for success in improving financial access; what was vital, however, were the relationships established by higher education with other leaders that were built on trust, mutual respect, and common interest.
• Successful state leaders placed very high value on the development of a climate for higher education that
included a strong commitment to access and affordability.
• In developing an agenda for access and affordability, leaders in successful states tended to focus on students and advocate for them, but also involved students in decisions about student financial aid and tuition policy.
• Successful state leaders sought and maximized opportunities for collaboration and coordination at every opportunity, working with presidents in all sectors to speak with a unified voice, to identify and develop champions among state government and business leaders, and to work across party lines for the good of higher education.
Four financial access issues faced all states visited and also emerged in a significant number of those surveyed.
• Meeting the needs of the growing Hispanic population
• Providing financial and geographic access
• Achieving tuition-financial aid balance
• Minimizing or at least reducing resource competition within sectors of state government
Solutions for these problems likely cross state boundaries, political party lines, and sector concerns (K-12 public schools, community colleges, universities). These issues could benefit from sector collaboration, study of best practices in other states, and continued study by appropriate research organizations and public policy centers. Organizations such as SHEEO and NASSGAP might play a role in coordinating efforts and disseminating best practices and research.
Despite the similarity across these states, there was a fundamental differences between two groups of states: those that had chosen the low tuition/modest aid approach to ensuring financial access to higher education and those states with higher tuition (whether moderate or high)
Recession, Retrenchment, and Recovery 5
that had attempted to provide financial access through need-based student financial aid. States with historically low tuition in the public sector tended to have modest or even inadequate student financial aid programs. These states recognized that in the current fiscally stringent environment financial access cannot be assured through only low public sector tuition with no or little aid. In most states, student financial aid is necessary to provide financial access for students to higher education.
On the other hand, students living in states with relatively high tuition in the public sector need substantial financial aid in order to afford college. Some states with large financial aid programs are concerned about their ability to widely communicate information about financial aid programs and eligibility requirements to the general public as well as target audiences. In some cases, consolidation of multiple ancillary state programs and coordinated and simplified application procedures for these aid programs is needed.
Despite quite different approaches to protecting financial access, leaders of the seven states were unanimous—communication, collaboration, and credibility are essential for success in student access. The interviews shed further light on the data in the survey and economic and fiscal analysis by demonstrating that good policies and strong leadership do make a difference.
Recovery and Beyond: Strategies for Maintaining Financial Access
In each of the three phases of this project, it was clear that national recessions have a serious impact on financial access to college. Some states seem to do better than others in maintaining financial access with a balance of student aid and tuition despite the effects of recessions. Based on
the fiscal analysis, survey of states, and interviews in selected states, the following recommendations are proposed:
1. Develop strategies for maintaining financial access for students through recessions.
2. Balance tuition increases with need-based student financial aid.
3. Explore new student aid financing strategies.
4. Reaffirm the state’s role in providing student financial aid.
5. Define goals and develop a coherent plan for maintaining and improving financial access for students.
6. Present a clear and consistent message about the importance of financial access.
7. Design student aid programs to meet state access goals.
8. Foster and support higher education leadership.
9. Make a commitment to access and affordability.
10. Focus on students.
11. Develop champions for higher education.
12. Improve awareness of higher education’s contributions to economic development.
13. Anticipate and address emerging issues.
14. Emphasize collaboration, communication, and credibility.

Recession, Retrenchment, and Recovery 6
Recession, Retrenchment, and Recovery 7
Recession, Retrenchment, and Recovery Introduction Purpose of the Project The national recession of 2001 lasted only a few months, from March to November, but it affected states’ economies and subsequently appropriations to higher education for years. Reduced funding caused some higher education systems to consider drastic measures—double-digit percentage increases in tuition, stringent accountability measures, enrollment restrictions, or privatizing public colleges and universities. A particular concern of this project was the impact of recessions and subsequent reductions in higher education appropriations on financial access—the balance of state financial aid and tuition and fees—for students attending public institutions. The purpose of the Recession, Retrenchment, and Recovery Project was to identify states that have successfully maintained financial access for students through economic cycles and to collect and disseminate policy strategies these states used.
Background There were four national recessions between 1979 and 2004 that affected the economies of most states. As tax revenues declined, states had few options—find new sources of funds, cut back on services, and/or reallocate funds to higher priorities. Higher education competed for declining revenues with other priorities, among them were corrections, health care, homeland security, and elementary and secondary schools. Following each recession, funding for higher education in most states stagnated or declined while enrollment in
colleges and universities tended to increase as students sought credentials for employment or bided time until the economy improved. Typically, as the economy improved, jobs increased, states’ revenues rose, and funding for higher education improved. The combined effect of changes in enrollment and resources has produced “roller coaster” funding that hinders effective planning by states and institutions. While the pattern has been consistent through the past four recessions, few higher education systems have developed strategies and policies to deal with recessions. The natural reaction is to weather the storm—raising tuition, making temporary cuts, and postponing expenditures, until the economy cycles upward again as it inevitably will. As a result, during the nadir of an economic cycle, when the need and demand for higher education is highest, access for students may be significantly restricted.
Normal Cycle or Downward Spiral? The 2001 recession lasted only a few months, but its effects on higher education appropriations are still being felt. It remains to be seen whether the 2001 recession and its aftermath represents a normal economic cycle. If this is the case, funding levels will be
“State government leaders operate in a political environment that precludes taking a longer view, leaving all government functions vulnerable to the vicissitudes of the annual budget cycle. Not a single state has found a way to smooth the ups and downs of the business cycle on higher education, indicating how politically difficult the task is.” David Breneman, 2002
Recession, Retrenchment and Recovery 8
restored to pre-recession levels in most states before the next recession. Management of roller-coaster funding will be a continuing challenge. Enrollment growth will also be a major problem and while funding may be restored, it may not keep pace with enrollment in many states.
However, some suggest that the 2001 recession was not just another recession. There is evidence of fundamental changes in the funding model for higher education, and continuing problems are foreseen due to states’ regressive tax systems and structural deficits that would make recovery from future recessions slower and more difficult. (Hovey 1999; Boyd 2002)
Priorities and Policy Choices From the 1950s through the 1970s, higher education expansion was driven by “one overarching objective—that of access to higher education” (National Roundtable, Summer 1998). Improving higher education access meant not only expanding opportunity for more students to enroll in college, including those underrepresented in higher education, but also broadening their choices of institution type, public or private, four-year or two-year. Some states, particularly those in which public institutions served a majority of students, focused on maintaining low tuition at public colleges and universities (Finney & Kelly, 2004). Need-based grant programs coupled with moderate public tuition were strategies emphasized among states that relied on private institutions to provide capacity.
In the 1990s, access to college was already being compromised. As college tuition increased, Federal and state grants failed to keep pace. Between 1986 and 1999, the average Federal Pell grant for students attending public universities dropped from 98 to 57 percent of tuition. State grants decreased by a lesser amount with considerable variation among states. As a result, students have been increasingly turning to student loans. (National Center, 2002)
Since the 1970s, states have set priorities and made policy decisions that have affected students’ ability to pay for college. Underlying all policy considerations are the fundamental questions of who benefits and who pays for higher education. A number of national policy experts and the results of a survey of states clearly indicate that the increasing share of college costs borne by students and families reflects a fundamental shift away from the principle that increasing the population’s educational attainment is a public good as well as a benefit to the individual. In many states, access for students continues to be a high priority but their ability to maintain access has been eroded by changes in the economy and competing demands on state resources. During the 1990s, states employed new tuition and financial aid policies to address new goals. Merit-based financial aid,
“When revenue shortfalls are allocated among state services, higher education is likely to absorb larger cuts than other sectors….When higher education faces cuts in state funding, the state and higher education institutions are likely to shift shortfalls to students and their families by raising tuition….During a recession states are unlikely to make new or additional investments in student financial aid that will offset increases in tuition.” Patrick Callan, 2002
“… within eight years from the time state and local governments close current budget shortfalls they are likely to face gaps that for the nation as a whole approximate 3.4 percent of revenue. A total of 44 states face gaps under these assumptions, with 12 states facing gaps of 5 percent or more of revenue.” Don Boyd, 2002
Recession, Retrenchment and Recovery 9
awarded on the basis of academic achievement rather than financial need, was used to reward better high school preparation for college or encourage gifted students to go to college in their home state. Voucher programs and charter colleges were designed to expand students’ choice among public and private institutions and to reduce state regulation of colleges and universities (Heller, 2003; Wellman, 2003). The remainder of the report is divided into four sections as described below. Chapter 1: The first chapter of this report describes the results of the first phase of this project, analysis of 25-year trends in state appropriations for higher education, allocations to student financial aid, and changes in tuition and fees at public institutions. These trends are examined in the context of national recessions and related changes in states’ economies. Chapter 2: The second phase of the project was a survey of state higher education organizations designed to ascertain how states dealt with the national recession that occurred in 2001. Chapter 2 describes the results of this survey—priorities that guided state funding, program changes, strategies used to maintain financial access, and the outlook for the future. Chapter 3: In the third phase of the project, seven states were selected for further study through interviews of policy leaders in higher education and student financial aid administration. Interviews addressed policies and strategies the selected states used to maintain and expand financial access across successive economic cycles. Chapter 4: Based on what was learned from the fiscal analysis, survey of states, and interviews of policymakers in seven states, recommendations were formulated to serve as resources for states seeking new strategies.

Recession, Retrenchment and Recovery 10
Recession, Retrenchment and Recovery 11
Chapter 1 Consequences of Recession On State Higher Education and Financial Access for Students Introduction In the first phase of the Recession, Retrenchment, and Recovery Project, the similarities and differences among states, and the effects of recessions on higher education funding, tuition and fees, and student financial aid programs were examined. These factors were the focus of the analysis because state policymakers can influence or control them through appropriations, policies, administrative processes, and coordination. While the importance of federal, institutional, and private student financial aid programs is recognized, they are beyond the control of state policymakers and, therefore, not included in the analyses. For the same reasons, costs of attendance beyond tuition and fees are not addressed.
Data and Methods In order to identify states that have successfully maintained financial access for students through economic cycles, the first objective of this project was to examine trends in appropriations, student financial aid funding, and tuition and fees in the context of national recessions and changes in states’ economies. Drawn from widely-used, reliable sources, data were collected for 1979 through 2004, encompassing four recessions. Appendix 1 provides detailed summary data for the states. Appendix 2 provides definitions, sources of the data, and important limitations to the data.
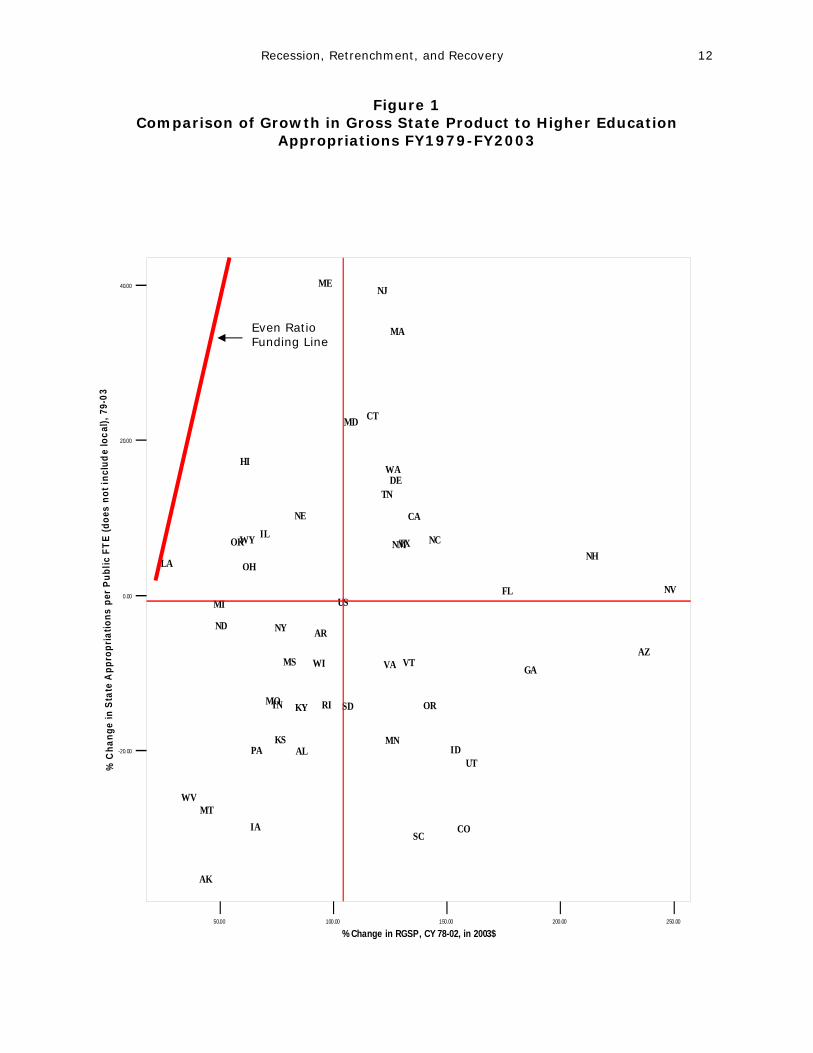
Findings States’ Economies and Higher Education Appropriations Higher education appropriations did not keep pace with growth in the state economy in any state. In all states, the real Gross State Product (GSP) increased faster than higher education appropriations between 1979 and 2003.1 Figure 1 depicts the relationship between a state’s economy and its level of appropriations. The U.S. average for both the percent changes in real GSP and appropriations per public FTE is shown in the intersection of red lines. The even ratio funding line depicts the spots on the graph where increases in appropriations are maintained evenly with increases in the state’s economy (i.e. a 10% increase in the economy correlates with a 10% increase in state appropriations). If any state were above the even ratio funding line, it would indicate that state appropriations were growing more rapidly than the economy, while points below the line indicate the opposite. As the figure shows, not one state has had appropriations growth keep up with the economy during the period of this analysis.
1 Due to data limitations, the analysis of Gross State Product and higher education appropriations covers the period, 1979 to 2003. The other analyses in this chapter include 2004 data.
Recession, Retrenchment, and Recovery 12
Figure 1 Comparison of Growth in Gross State Product to Higher Education
Appropriations FY1979-FY2003
50.00 100.00 150.00 200.00 250.00
% Change in RGSP, CY 78-02, in 2003$
-20.00
0.00
20.00
40.00
% C
hang
e in
Sta
te A
ppro
pria
tions
per
Pub
lic F
TE (d
oes
not i
nclu
de lo
cal),
79-
03
AL
AK
AZ
AR
CA
CO
CT
DE
FL
GA
HI
ID
IL
IN
IA
KS
KY
LA
ME
MD
MA
MI
MN
MS
MO
MT
NE
NV
NH
NJ
NM
NY
NC
ND
OH
OK
OR
PA
RI
SC
SD
TN
TX
US
UT
VTVA
WA
WV
WI
WY
Even Ratio Funding Line

Recession, Retrenchment, and Recovery 13
The upper-left quadrant in Figure 1 houses those states whose economies have fared worse than the U.S. average but maintained appropriations better than the U.S. average. Only 8 states met these criteria: Hawaii, Illinois, Louisiana, Maine, Nebraska, Ohio, Oklahoma, and Wyoming. The state closest to the even funding ratio line, Louisiana, appears there not so much because of increased appropriations as because of a somewhat stagnant economy. The other quadrant that is of interest is the lower-right one, where state economies were performing better than the U.S. average yet did not maintain appropriations at the national average. National Recessions The National Bureau of Economic Research (NBER) is the organization that dates the periods of economic recession. While some think of a recession as two consecutive quarters of declining real GDP, the NBER’s official definition of a recession is “a significant decline in economic activity spread across the economy, lasting more than a few months, normally visible in real GDP, real income, employment, industrial production, and wholesale-retail sales.” There were two recessions in the early 1980s—the first lasting from January through July 1980 and the second beginning in July 1981 and ending in November 1982. While there were technically two separate recessions, the gap between them was only twelve months and many consider them to be one “double-dip” recession lasting 34 months. The double recession of the 1980s was in part brought on by the Federal Reserve itself. During this time, unemployment and inflation were both at very high levels. Economic theory indicates that there is a short-run tradeoff between inflation and unemployment. When Paul Volker was appointed as the new Chair of the Federal Reserve in 1979, he immediately tried to bring inflation under control. The result was even higher
unemployment and, subsequently, a prolonged recession. Coupled with the oil shocks that were also occurring, the recessions in the early 1980s were particularly severe. Economists tend to disagree on the exact cause of the recession that began in July 1990 and ended in March 1991. Some blame the spike in oil prices following Iraq’s invasion of Kuwait in August of 1990; however, the NBER dated the beginning of the recession in July of that year. Interest rates did not seem to be much of a factor, nor was there a decrease in government spending as a result of the end of the Cold War. Regardless of the cause, the recession itself was relatively mild and short-lived, lasting only eight months. Many claim the attacks of September 11th caused the 2001 recession; however, the recession started in March of 2001 and ended in November. One of the more agreed-upon causes of the latest recession was the slide in stock prices before and throughout the recession. The housing boom of the late 1990s was also coming to an end at the onset of the recession. Like the 1990-91 recession, this one was relatively mild and lasted only eight months. Recessions and Higher Education Appropriations In the following discussion on the effects of recessions, the “base year” is the fiscal year in which the recession began. “Post-recession period” is the two fiscal years following the end of the recession. “Recovery year” is the fiscal year in which appropriations or the indicators used in this study returned to base year levels. For example, a recession began in July 1990 (the first month of fiscal year 1991) and ended in March 1991. The base year is fiscal year 1991, the post-recession period comprises fiscal years 1992 and 1993.
Recession, Retrenchment, and Recovery 14
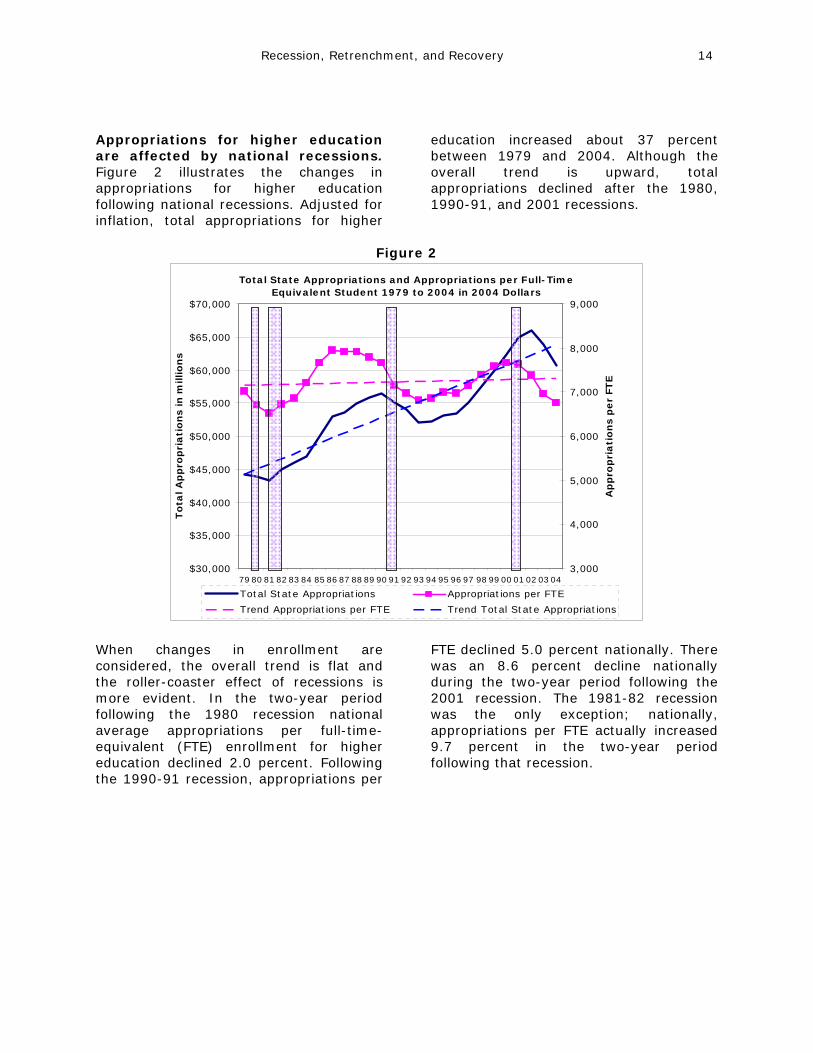
Appropriations for higher education are affected by national recessions. Figure 2 illustrates the changes in appropriations for higher education following national recessions. Adjusted for inflation, total appropriations for higher
education increased about 37 percent between 1979 and 2004. Although the overall trend is upward, total appropriations declined after the 1980, 1990-91, and 2001 recessions.
Figure 2
Total State Appropriations and Appropriations per Full-Time Equivalent Student 1979 to 2004 in 2004 Dollars
$30,000
$35,000
$40,000
$45,000
$50,000
$55,000
$60,000
$65,000
$70,000
79 80 81 82 83 84 85 86 87 88 89 90 91 92 93 94 95 96 97 98 99 00 01 02 03 04
Tota
l A
ppro
pri
ati
ons in m
illions
3,000
4,000
5,000
6,000
7,000
8,000
9,000
Appro
pri
ati
ons p
er
FTE
Total State Appropriations Appropriations per FTE
Trend Appropriations per FTE Trend Total State Appropriations
When changes in enrollment are considered, the overall trend is flat and the roller-coaster effect of recessions is more evident. In the two-year period following the 1980 recession national average appropriations per full-time-equivalent (FTE) enrollment for higher education declined 2.0 percent. Following the 1990-91 recession, appropriations per
FTE declined 5.0 percent nationally. There was an 8.6 percent decline nationally during the two-year period following the 2001 recession. The 1981-82 recession was the only exception; nationally, appropriations per FTE actually increased 9.7 percent in the two-year period following that recession.
Recession, Retrenchment and Recovery 15
Economists consider the double recession of the 1980s to be the most severe and longest lasting of recent recessions. The 1990-91 and 2001 recessions were shorter and economic indicators did not decline as much as in the 1980s. There is a correlation between the severity of a recession and the type of recovery. Relatively severe recessions, like those in the 1980s, are typically followed by rapid and robust recovery. A milder recession, such as those of 1990-91 and 2001, tend to be followed by “relatively weak and protracted recovery.” (Kliesen and Thornton, April 2002) The strong and rapid recovery of higher education appropriations during the 1980s was consistent with the general pattern of the national economy. Both the lowest and highest appropriations per FTE (in 2004 constant dollars) for the 25-year period occurred in the 1980s—1981 and 1986 respectively. In contrast, the decline following the 1991 recessions is less severe but the recovery was slower.
With each successive recession period, more states were affected, declines were larger in higher education appropriations, and it took longer to recover. The higher education appropriation patterns are summarized in Table 2. In the 1980s, state higher
education appropriations were less seriously affected and recovery was steeper and quicker than later recessions. In the two-year period following the 1980 recession, appropriations per FTE declined in 26 states. Despite the second recession in 1981-82, about half of these states had recovered to base-year funding per FTE by 1984. Seven states lost funding per FTE in the two-year period following the 1981-82 recession and all but one had recovered to 1982 levels by 1986.
As shown in Table A in Appendix 1, declines in state appropriations per FTE for higher education ranged from less than one percent in Utah to 16 percent in Iowa during the 1982-83 post-recession period. A majority of the states had recovered to fiscal year 1980 levels by fiscal year 1985 and all but Iowa had recovered by the onset of the 1991 recession. (Iowa did not fully recover to the 1980 level until 1998) During the 1981-82 post-recession period, only seven states experienced declines in appropriations per FTE and all but North Dakota had recovered by 1985. The 1990-91 recession affected more states, and recovery was somewhat slower. Appropriations per FTE for higher education declined in 38 states in the two-year period following this recession,
Table 1 Post-Recession Changes in States’ Appropriations per FTE
And Time to Recovery to Base Year Levels Base Year
FY1980 FY1982 FY1991 FY2001
Recession period Jan to July 1980
July 1981 to Nov 1982
July 1990 to March 1991
March to Nov 2001
% change post-recession
-2.0 +9.7 -5.0 -8.6 National Average Appropriations Per FTE
Recovered to base year
FY1984 * FY1998 na
Decreased appropriations in post-recession period
26 7 38 44 Number of states
Failed to recover by the next recession
1 1 7 na
* Since there was no decline in the post-recession period, no recovery to base year was indicated following the 1981-82 recession.
Recession, Retrenchment and Recovery 16
ranging from less than 1 percent in Michigan to over 16 percent in Rhode Island and Virginia. The national average appropriation per FTE did not recover to the FY1991 levels until FY1998. A majority of states had recovered to 1991 levels by 1997. Six states had not recovered to 1991 funding levels by the onset of the 2001 recession. In the two-year period following the 2001 recession, higher education appropriations per FTE declined in 44 states. By 2004, only one state had recovered to 2001 levels but two additional states had fallen below 2001 levels. Since enrollment data are not available beyond 2004, the analysis ended with that year. However, if one assumes that enrollment did not change, estimates of 2005 and 2006 appropriations per FTE can be considered. Based on this assumption, the data suggest that three states would have recovered to 2001 levels in 2005 and 12 more states would have recovered by 2006. In 2006, three years after the end of the post-recession period, 30 states would not yet have recovered to 2001 funding levels.
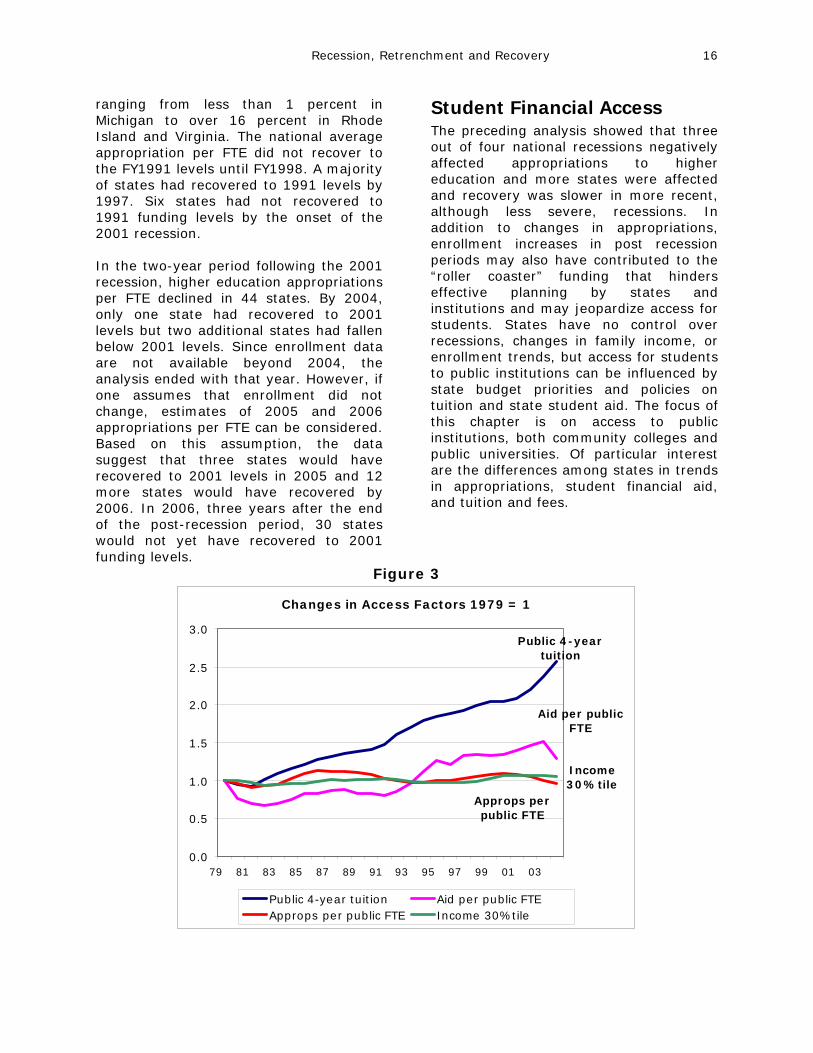
Student Financial Access The preceding analysis showed that three out of four national recessions negatively affected appropriations to higher education and more states were affected and recovery was slower in more recent, although less severe, recessions. In addition to changes in appropriations, enrollment increases in post recession periods may also have contributed to the “roller coaster” funding that hinders effective planning by states and institutions and may jeopardize access for students. States have no control over recessions, changes in family income, or enrollment trends, but access for students to public institutions can be influenced by state budget priorities and policies on tuition and state student aid. The focus of this chapter is on access to public institutions, both community colleges and public universities. Of particular interest are the differences among states in trends in appropriations, student financial aid, and tuition and fees.
Figure 3
Changes in Access Factors 1979 = 1
Public 4-year tuition
Aid per public FTE
Approps per public FTE
Income 30%tile
0.0
0.5
1.0
1.5
2.0
2.5
3.0
79 81 83 85 87 89 91 93 95 97 99 01 03
Public 4-year tuition Aid per public FTEApprops per public FTE Income 30%tile
Recession, Retrenchment and Recovery 17
Factors Affecting Financial Access
Figure 3 compares the national trends in appropriations for higher education per FTE enrollment to tuition and fees, student financial aid per FTE enrollment, and family income. Funding for need-based student aid for students attending public institutions declined during the 1980s but increased significantly during the 1990s, outpacing increases in higher education appropriations, but not keeping up with tuition increases. Family income remained flat throughout the period. At the 30th percentile, income varied less than 10% with slight declines following each recession and similar increases during economic growth.2
Indicators of Financial Access
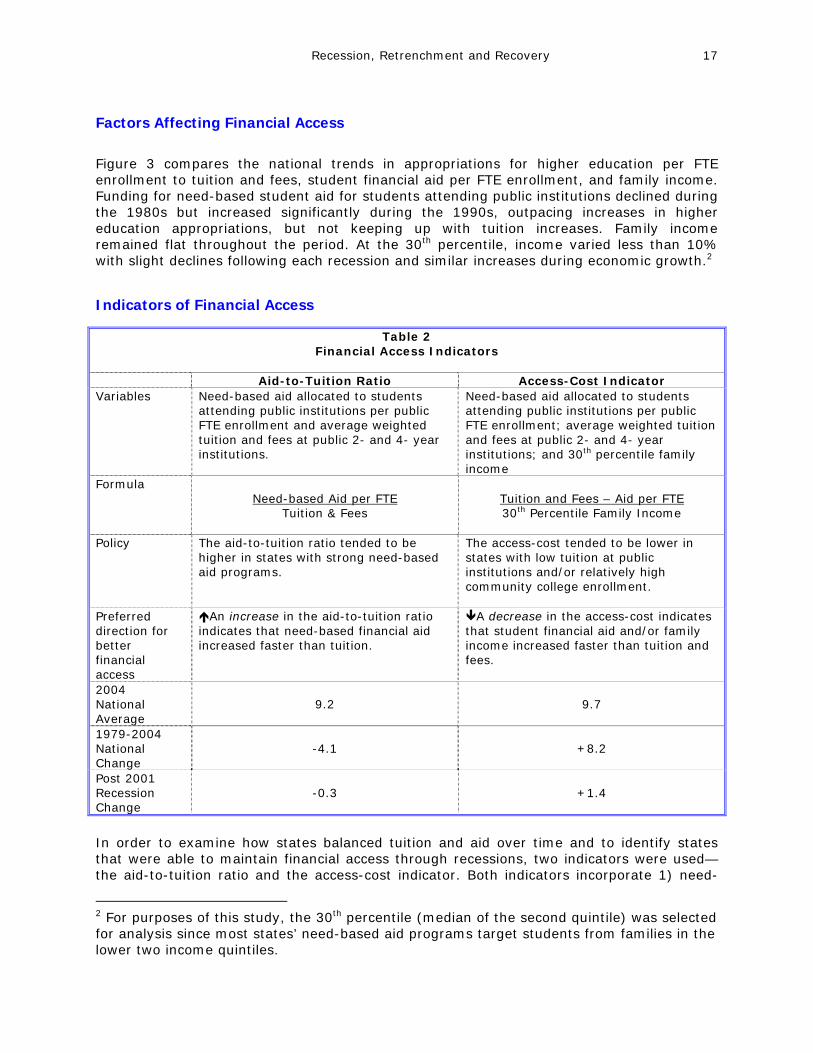
In order to examine how states balanced tuition and aid over time and to identify states that were able to maintain financial access through recessions, two indicators were used—the aid-to-tuition ratio and the access-cost indicator. Both indicators incorporate 1) need-
2 For purposes of this study, the 30th percentile (median of the second quintile) was selected for analysis since most states’ need-based aid programs target students from families in the lower two income quintiles.
Table 2 Financial Access Indicators
Aid-to-Tuition Ratio Access-Cost Indicator Variables Need-based aid allocated to students
attending public institutions per public FTE enrollment and average weighted tuition and fees at public 2- and 4- year institutions.
Need-based aid allocated to students attending public institutions per public FTE enrollment; average weighted tuition and fees at public 2- and 4- year institutions; and 30th percentile family income
Formula Need-based Aid per FTE
Tuition & Fees
Tuition and Fees – Aid per FTE 30th Percentile Family Income
Policy The aid-to-tuition ratio tended to be
higher in states with strong need-based aid programs.
The access-cost tended to be lower in states with low tuition at public institutions and/or relatively high community college enrollment.
Preferred direction for better financial access
An increase in the aid-to-tuition ratio indicates that need-based financial aid increased faster than tuition.
A decrease in the access-cost indicates that student financial aid and/or family income increased faster than tuition and fees.
2004 National Average
9.2 9.7
1979-2004 National Change
-4.1 +8.2
Post 2001 Recession Change
-0.3 +1.4

Recession, Retrenchment and Recovery 18
based aid allocated to students attending public two- and four-year institutions, 2) weighted average tuition and fees at public institutions, and 3) full-time equivalent enrollment at public institutions. The access-cost indicator also reflects 30th percentile family income.3 Both of these indicators use two factors that states can influence or control in efforts to maintain financial access to higher education. Balancing Need-Based Aid and Tuition Higher aid-to-tuition ratios indicate that changes in need-based aid are in balance with tuition and financial access is better for students.4 Between 1979 and 2004, the aid-to-tuition ratio declined from 13.1 to 9.2 or by 30 percent. The all-state average ratio for the twenty-five year period was 9.0. Table B in Appendix 1 provides a summary of the trends and current status of the aid-to-tuition ratio. Figure 4
States varied considerably in the balance of tuition and need-based aid for students attending public institutions. Figure 4 shows the aid-to-tuition ratios for states in 2004.5 The national average was 9.0. The ratios ranged from less than 1 in several states to 24 in California. States that have traditionally had substantial need-based aid programs such as Illinois, New York, New Jersey, Minnesota, and Pennsylvania tended to have higher ratios. States with well-developed, low-cost community college systems, such as California, tended to have relatively high ratios. High ratios were also found in states with recently developed need-based aid programs, such as Texas.
3 See the definitions in Appendix 1 for a discussion of the components and limitations of these measures. 4 The aid-to-tuition ratio indicates how states balanced tuition and aid. States with substantial need-based aid programs for students attending public institutions tend to have relatively high ratios. Some states have relied on low tuition to assure access and may not have substantial aid and consequently relatively low ratios. 5 Alaska and South Dakota do not have need-based aid programs for students attending public institutions.
Aid to Tuition Ratio 2004
0% 5% 10% 15% 20% 25% 30%
A laskaSouth Dakota
GeorgiaA labama
Louis ianaWyoming
HawaiiA rizona
IdahoIowa
North DakotaNew
MissouriU tah
KansasM ichiganMontana
South C arolinaNebraska
O regonTennessee
O hioNevada
A rkansasM iss is s ippi
Rhode Is landMaryland
Wiscons inV ermont
C onnec ticutMaine
FloridaDelaware
O klahomaMassachusetts
KentuckyM innesota
United StatesV irginia
New MexicoWest V irginia
IndianaC olorado
North C arolinaPennsylvania
New JerseyTexas
I llinoisWashington
New YorkC alifornia
Recession, Retrenchment, and Recovery 19
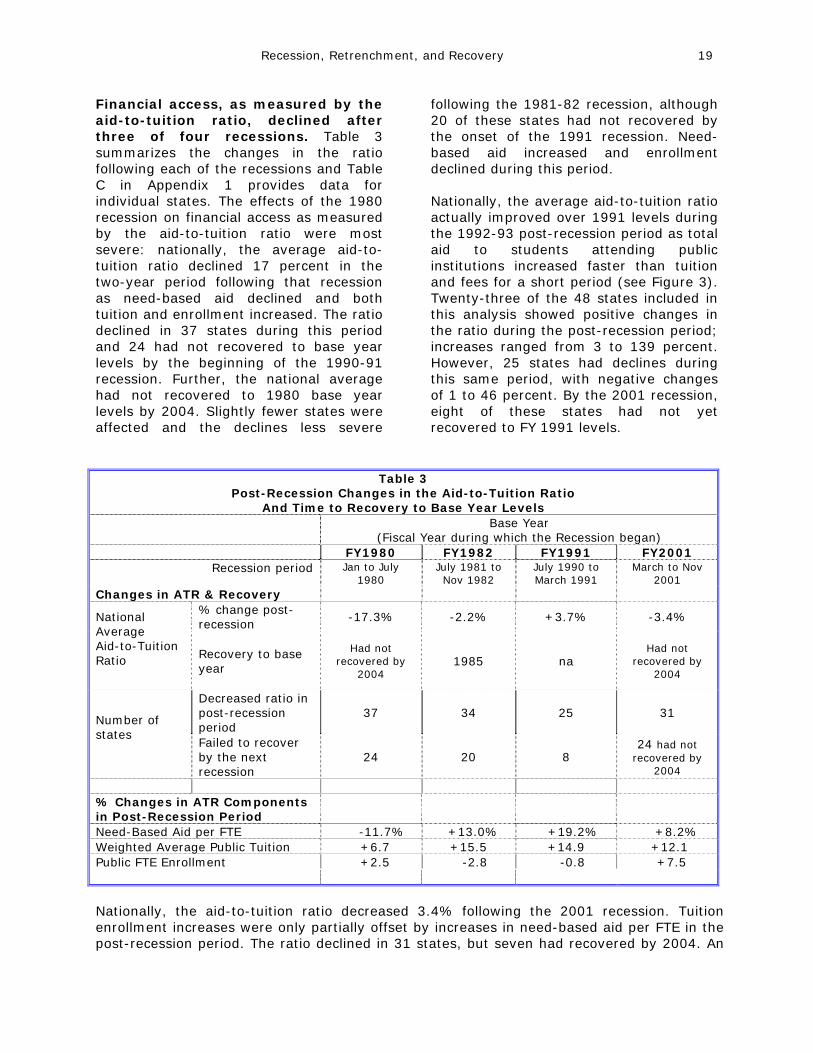
Financial access, as measured by the aid-to-tuition ratio, declined after three of four recessions. Table 3 summarizes the changes in the ratio following each of the recessions and Table C in Appendix 1 provides data for individual states. The effects of the 1980 recession on financial access as measured by the aid-to-tuition ratio were most severe: nationally, the average aid-to-tuition ratio declined 17 percent in the two-year period following that recession as need-based aid declined and both tuition and enrollment increased. The ratio declined in 37 states during this period and 24 had not recovered to base year levels by the beginning of the 1990-91 recession. Further, the national average had not recovered to 1980 base year levels by 2004. Slightly fewer states were affected and the declines less severe
following the 1981-82 recession, although 20 of these states had not recovered by the onset of the 1991 recession. Need-based aid increased and enrollment declined during this period. Nationally, the average aid-to-tuition ratio actually improved over 1991 levels during the 1992-93 post-recession period as total aid to students attending public institutions increased faster than tuition and fees for a short period (see Figure 3). Twenty-three of the 48 states included in this analysis showed positive changes in the ratio during the post-recession period; increases ranged from 3 to 139 percent. However, 25 states had declines during this same period, with negative changes of 1 to 46 percent. By the 2001 recession, eight of these states had not yet recovered to FY 1991 levels.
Table 3 Post-Recession Changes in the Aid-to-Tuition Ratio
And Time to Recovery to Base Year Levels Base Year
(Fiscal Year during which the Recession began) FY1980 FY1982 FY1991 FY2001
Recession period Jan to July 1980
July 1981 to Nov 1982
July 1990 to March 1991
March to Nov 2001
Changes in ATR & Recovery % change post-recession
-17.3% -2.2% +3.7% -3.4% National Average Aid-to-Tuition Ratio
Recovery to base year
Had not recovered by
2004 1985 na
Had not recovered by
2004
Decreased ratio in post-recession period
37 34 25 31 Number of states Failed to recover
by the next recession
24 20 8 24 had not
recovered by 2004
% Changes in ATR Components in Post-Recession Period
Need-Based Aid per FTE -11.7% +13.0% +19.2% +8.2% Weighted Average Public Tuition +6.7 +15.5 +14.9 +12.1 Public FTE Enrollment +2.5 -2.8 -0.8 +7.5 Nationally, the aid-to-tuition ratio decreased 3.4% following the 2001 recession. Tuition enrollment increases were only partially offset by increases in need-based aid per FTE in the post-recession period. The ratio declined in 31 states, but seven had recovered by 2004. An
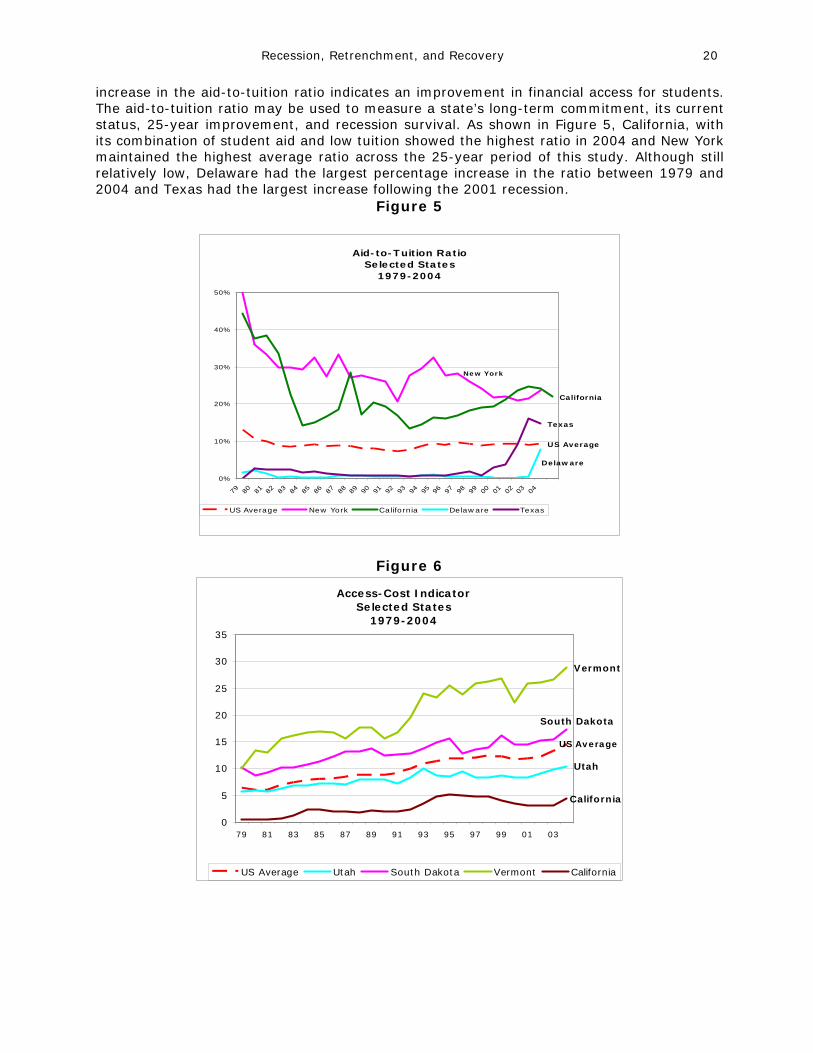
Recession, Retrenchment, and Recovery 20
increase in the aid-to-tuition ratio indicates an improvement in financial access for students. The aid-to-tuition ratio may be used to measure a state’s long-term commitment, its current status, 25-year improvement, and recession survival. As shown in Figure 5, California, with its combination of student aid and low tuition showed the highest ratio in 2004 and New York maintained the highest average ratio across the 25-year period of this study. Although still relatively low, Delaware had the largest percentage increase in the ratio between 1979 and 2004 and Texas had the largest increase following the 2001 recession.
Figure 5
Aid-to-Tuition RatioSelected States
1979-2004
US Average
New York
California
Delaware
Texas
0%
10%
20%
30%
40%
50%
79 80 81 82 83 84 85 86 87 88 89 90 91 92 93 94 95 96 97 98 99 00 01 02 03 04
US Average New York California Delaware Texas
Figure 6
Access-Cost IndicatorSelected States
1979-2004
US Average
Utah
South Dakota
Vermont
California
0
5
10
15
20
25
30
35
79 81 83 85 87 89 91 93 95 97 99 01 03
US Average Utah South Dakota Vermont California
Recession, Retrenchment, and Recovery 21
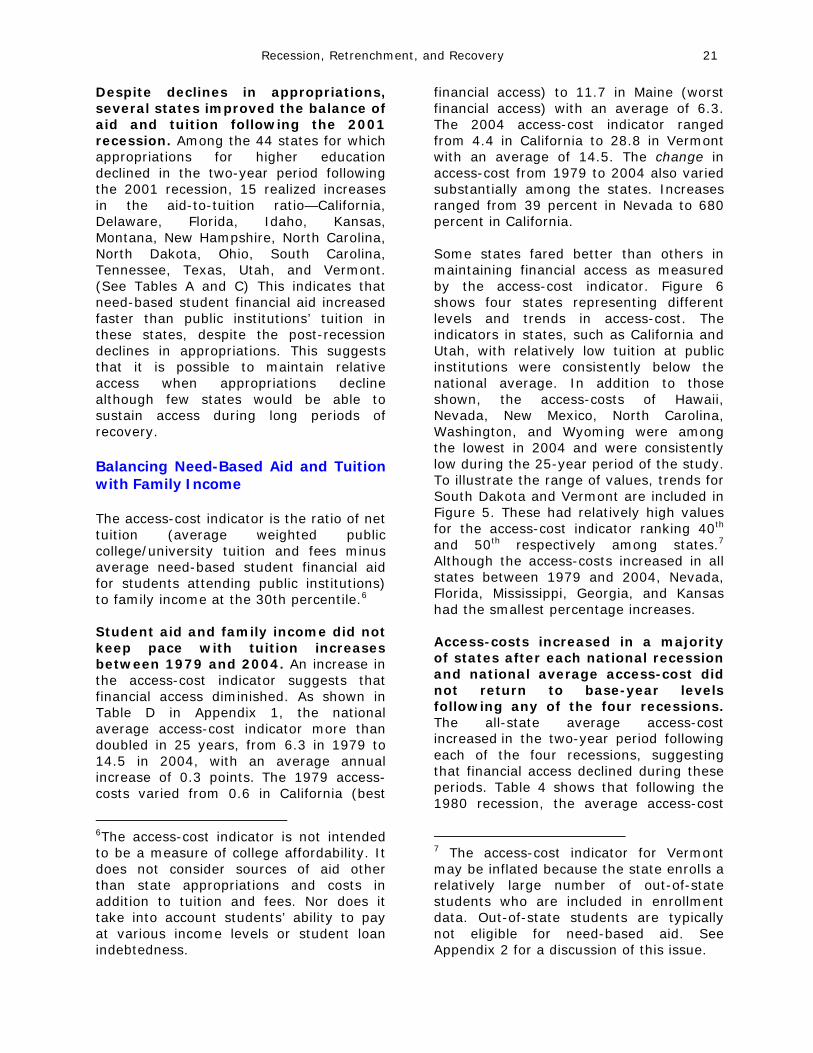
Despite declines in appropriations, several states improved the balance of aid and tuition following the 2001 recession. Among the 44 states for which appropriations for higher education declined in the two-year period following the 2001 recession, 15 realized increases in the aid-to-tuition ratio—California, Delaware, Florida, Idaho, Kansas, Montana, New Hampshire, North Carolina, North Dakota, Ohio, South Carolina, Tennessee, Texas, Utah, and Vermont. (See Tables A and C) This indicates that need-based student financial aid increased faster than public institutions’ tuition in these states, despite the post-recession declines in appropriations. This suggests that it is possible to maintain relative access when appropriations decline although few states would be able to sustain access during long periods of recovery. Balancing Need-Based Aid and Tuition with Family Income The access-cost indicator is the ratio of net tuition (average weighted public college/university tuition and fees minus average need-based student financial aid for students attending public institutions) to family income at the 30th percentile.6 Student aid and family income did not keep pace with tuition increases between 1979 and 2004. An increase in the access-cost indicator suggests that financial access diminished. As shown in Table D in Appendix 1, the national average access-cost indicator more than doubled in 25 years, from 6.3 in 1979 to 14.5 in 2004, with an average annual increase of 0.3 points. The 1979 access-costs varied from 0.6 in California (best
6The access-cost indicator is not intended to be a measure of college affordability. It does not consider sources of aid other than state appropriations and costs in addition to tuition and fees. Nor does it take into account students’ ability to pay at various income levels or student loan indebtedness.
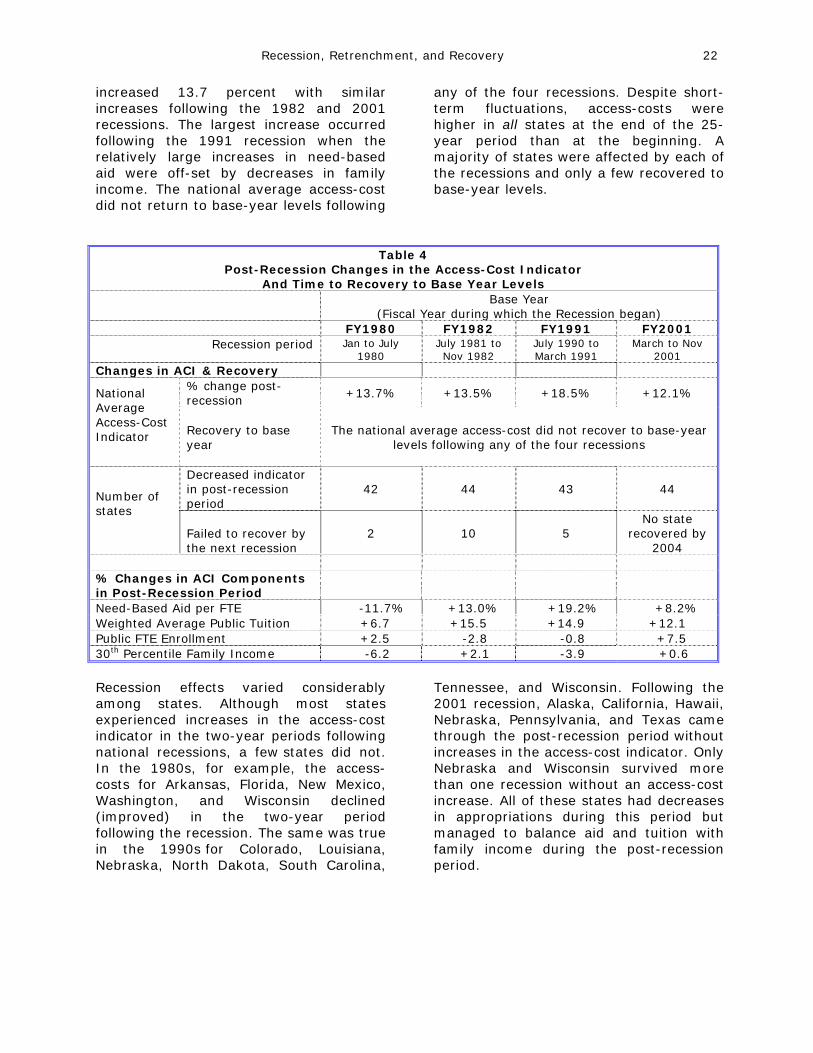
financial access) to 11.7 in Maine (worst financial access) with an average of 6.3. The 2004 access-cost indicator ranged from 4.4 in California to 28.8 in Vermont with an average of 14.5. The change in access-cost from 1979 to 2004 also varied substantially among the states. Increases ranged from 39 percent in Nevada to 680 percent in California. Some states fared better than others in maintaining financial access as measured by the access-cost indicator. Figure 6 shows four states representing different levels and trends in access-cost. The indicators in states, such as California and Utah, with relatively low tuition at public institutions were consistently below the national average. In addition to those shown, the access-costs of Hawaii, Nevada, New Mexico, North Carolina, Washington, and Wyoming were among the lowest in 2004 and were consistently low during the 25-year period of the study. To illustrate the range of values, trends for South Dakota and Vermont are included in Figure 5. These had relatively high values for the access-cost indicator ranking 40th and 50th respectively among states.7 Although the access-costs increased in all states between 1979 and 2004, Nevada, Florida, Mississippi, Georgia, and Kansas had the smallest percentage increases. Access-costs increased in a majority of states after each national recession and national average access-cost did not return to base-year levels following any of the four recessions. The all-state average access-cost increased in the two-year period following each of the four recessions, suggesting that financial access declined during these periods. Table 4 shows that following the 1980 recession, the average access-cost
7 The access-cost indicator for Vermont may be inflated because the state enrolls a relatively large number of out-of-state students who are included in enrollment data. Out-of-state students are typically not eligible for need-based aid. See Appendix 2 for a discussion of this issue.
Recession, Retrenchment, and Recovery 22
increased 13.7 percent with similar increases following the 1982 and 2001 recessions. The largest increase occurred following the 1991 recession when the relatively large increases in need-based aid were off-set by decreases in family income. The national average access-cost did not return to base-year levels following
any of the four recessions. Despite short-term fluctuations, access-costs were higher in all states at the end of the 25-year period than at the beginning. A majority of states were affected by each of the recessions and only a few recovered to base-year levels.
Table 4 Post-Recession Changes in the Access-Cost Indicator
And Time to Recovery to Base Year Levels Base Year
(Fiscal Year during which the Recession began) FY1980 FY1982 FY1991 FY2001
Recession period Jan to July 1980
July 1981 to Nov 1982
July 1990 to March 1991
March to Nov 2001
Changes in ACI & Recovery % change post-recession
+13.7% +13.5% +18.5% +12.1% National Average Access-Cost Indicator
Recovery to base year
The national average access-cost did not recover to base-year levels following any of the four recessions
Decreased indicator in post-recession period
42 44 43 44 Number of states
Failed to recover by the next recession
2 10 5 No state
recovered by 2004
% Changes in ACI Components in Post-Recession Period
Need-Based Aid per FTE -11.7% +13.0% +19.2% +8.2% Weighted Average Public Tuition +6.7 +15.5 +14.9 +12.1 Public FTE Enrollment +2.5 -2.8 -0.8 +7.5 30th Percentile Family Income -6.2 +2.1 -3.9 +0.6 Recession effects varied considerably among states. Although most states experienced increases in the access-cost indicator in the two-year periods following national recessions, a few states did not. In the 1980s, for example, the access-costs for Arkansas, Florida, New Mexico, Washington, and Wisconsin declined (improved) in the two-year period following the recession. The same was true in the 1990s for Colorado, Louisiana, Nebraska, North Dakota, South Carolina,
Tennessee, and Wisconsin. Following the 2001 recession, Alaska, California, Hawaii, Nebraska, Pennsylvania, and Texas came through the post-recession period without increases in the access-cost indicator. Only Nebraska and Wisconsin survived more than one recession without an access-cost increase. All of these states had decreases in appropriations during this period but managed to balance aid and tuition with family income during the post-recession period.

Recession, Retrenchment, and Recovery 23
Selection of States for Further Study The ultimate objective of this analysis was to identify states that have been relatively successful in maintaining financial access for students through economic cycles. Success may take different forms—maintaining a high aid-to-tuition ratio or low average access-cost over time, providing stable indicators over time, or surviving recessions without substantial changes in financial access. Six measures were used to select states—the 1979 to 2004 average, 1979 to 2004 change, and the change after the 2001 recession for both the aid-to-tuition ratio and the access-cost indicator. In tables B through E in Appendix 1, 31 states are high-lighted that rank in the top ten on one or more of the six measures. Other factors were considered so that the policy strategies might have relevance to multiple states. States were selected from each regional higher education organization and to represent different enrollment sizes and patterns. Other factors were considered including enrollment growth, affordability, participation rates, and degree completion. Some states that have done well in maintaining financial access were not selected for further study because of their unique circumstances. Nevada and Wyoming, for example, rated well on several measures, but their economies differ so substantially from other states that their strategies would not be transferable. Similarly, it is unlikely that most states could now replicate California’s long-term commitment to low tuition and broad access. Also considered was the current policy environment in the states and the extent to which policy leaders would be available to assist in the study. The states selected for further study include Arizona and Washington, members of the Western Interstate Consortium for Higher Education (WICHE). Arizona’s
average access-cost indicator was among the 10 lowest and it was relatively stable between 1979 and 2004. Arizona survived the 2001 post-recession period with only a small increase in the access-cost indicator. Illinois and Kansas are members of the Midwest Higher Education Consortium (MHEC). Kansas maintained a stable ACI while Illinois’ strong need-based financial aid program was reflected in a consistently high aid-to-tuition ratio. Kansas was representative of states with relatively low total enrollment. North Carolina and Texas are members of the Southern Regional Education Board (SREB). North Carolina was notable for its low access-cost indicator in 2004 and its stability through 1979 to 2004. Data for Texas showed stability in the aid-to-tuition ratio through the entire period and for the 2001 post-recession period. Among New England states, Massachusetts was chosen because of a high, stable aid-to-tuition ratio.
Summary and Discussion The purpose of the Recession, Retrenchment, and Recovery Project was to examine the effects of recessions on financial access for students, to identify states that have successfully maintained financial access through economic cycles, and to collect and disseminate policy strategies these states used. This chapter described the results of the first phase of this project, analysis of 25-year trends in state appropriations for higher education, allocations to student financial aid, and changes in tuition and fees at public institutions. There were four national recessions between 1979 and 2004 that affected the economies of most states. Following each recession, funding for higher education in nearly all states stagnated or declined while enrollment in colleges and universities tended to increase as students sought credentials for employment. The
Recession, Retrenchment, and Recovery 24
combined effect of changes in enrollment and resources has produced “roller coaster” funding that hinders effective planning by states and institutions. The analysis described in this chapter showed that: • Three of the four recessions negatively
affected funding for higher education—total appropriations as well as appropriations per FTE enrollment. Following the 2001 recession, appropriations per FTE declined in 44 states.
• In each successive decade, recessions
affected more states, percentage declines in higher education appropriations were larger, and it took longer to recover.
• Financial access for students depends
on tuition, student aid, demographic changes, and family income. State policymakers can only influence or control decisions about tuition and student aid, although they need to consider income and demographic changes in policy development.
• After three of the four recessions,
tuition increased faster than student aid causing financial access to diminish. Following the 2001 recession, the aid-to-tuition ratio declined in 31 states.
• 15 states that incurred reduced
appropriations following the 2001 recession were able to increase financial access for students by placing priority on balancing need-based aid and tuition.
• Family income and student aid did not
keep pace with increases in tuition following any of the four recessions. The national average access-cost indicator did not recover to pre-recession levels following any of the recessions.
• The aid-to-tuition ratio and the access-
cost indicator identified states that had
a long-term commitment to balancing tuition costs with student aid. Also notable were states that had improved substantially during the 25-year period and those that were able to protect financial access following the 2001 recession
Recession, Retrenchment, and Recovery 25
Chapter 2 Impact of the 2001 Recession On State Higher Education and Student Financial Aid Policies and Priorities Survey Analysis
Introduction The first phase of the project was a fiscal analysis to identify 25-year trends in higher education appropriations, student financial aid, and tuition. Once the fiscal analysis was underway the second phase of the project, a survey of state higher education organizations, commenced to ascertain how they dealt with the national recession that occurred in 2001. The purpose of the survey was to: • Identify priorities that guided state
funding and allocation decisions between FY2001 and FY2005.
• Identify changes made in programs
and policies in response to decreased higher education appropriations.
• Learn about strategies states used to
help maintain financial access. • Assess how states regard their current
fiscal condition and outlook for recovery.
Additionally, data from the survey were used to inform the selection process and develop the protocol used in the state interview phase of the Project. Background Student access and affordability for higher education have been issues of concern for the past four decades, since the concepts of equal educational opportunity and
education as an entrée to upward mobility became broad national and state policy directives. The fulfillment of these broad policy concepts at the state level, however, continues to be tied to the amount of funding made available for higher education. During these same decades, while state support for higher education has increased, it has done so through the “boom and bust” cycles that saw disproportionate cuts during fiscally difficult times and generous increases during prosperous times (National Center, 2004.) This is best illustrated by Figure 2 in Chapter 1. The impact of the most recent recession was depicted in the 2004-2005 Almanac of the Chronicle of Higher Education: “In just the past four years, a sluggish economy has forced states to close a combined $235 billion shortfall in their budgets. They did that in part by slashing appropriations for public colleges, by putting few new dollars toward student aid for those attending both public and private institutions, and, of course, by raising tuition and fees.” Between FY2001 and FY2004, state appropriations for higher education clearly showed the impact of the national recession; in 21 states, appropriations in FY2004 were less than in FY2001 and when measured in constant dollars, decreased in 36 states. Further, when appropriations per FTE were considered, the level of state support per student decreased in 44 states.
Recession, Retrenchment, and Recovery 26
State student aid held up somewhat better during this time period; funding decreased in 10 states and when measured in constant dollars per FTE, decreased in 19 of the 48 states with state need-based aid programs. And while tuition per FTE at public institutions increased an average of 22 percent nationally between FY2001 and FY2004, state grant aid increased by 20 percent. Faced with decreased appropriations and decreased purchasing power, public institutions as well as state grant agencies were faced with decisions about where and for whom to tighten the belt. For some state higher education organizations enduring the recession was a matter of minor reallocations and adjustments; for others, it was about fundamental restructuring and unintended shifts in policy. Finding out what kinds of decisions states made – how they adjusted policies and programs and what strategies they used to maintain financial access during recessionary times - should be useful to other states and key policymakers as they prepare for the next economic recession.
Survey Overview The broad research questions for the survey were: 1. What priorities guided budget decisions
for the state and higher education during the most recent recession?
2. What specific program and policy changes have been made in response to appropriations levels for higher education and student aid and what are the resulting implications for financial access?
3. What long-term strategies have states developed to maintain financial access through changing economic cycles?
4. How do higher education officials regard their state’s current financial condition and future outlook for recovery?
In order to answer the research questions, a survey was conducted of chief executive officers of the state NASSGAP and SHEEO agencies. Notice of the impending survey was sent to participants during the late spring of 2005 and a subsequent e-mail message provided a link to the survey that could be submitted electronically, faxed, or mailed. Pre-testing was conducted with staff - other than the chief executive officers - at five NASSGAP and SHEEO organizations as well as with two former SHEEO CEOs.
The Respondents Questionnaires were sent to the SHEEO membership that included 56 higher education coordinating and governing boards located in 49 states, and to the NASSGAP member agencies in each state. Of the 50 NASSGAP organizations, 27 were also the state SHEEO. Of the total 79 agencies surveyed, 63 responses were received; 27 from combined SHEEO/NASSGAP agencies, 23 from SHEEO agencies, and 13 from NASSGAP agencies. Each state was represented by at least one respondent and 13 states provided responses from two agencies. In cases where more than one questionnaire was received from a state, responses were averaged to produce a single score. No significant difference was found between SHEEO and NASSGAP agency responses in those states with multiple responses. As part of the survey protocol, respondents were ensured confidentiality; therefore this report does not identify any individual respondents or attribute responses to a specific state.
Survey Results Three separate questionnaires were developed, one for SHEEO agencies, one for NASSGAP agencies, and one for combined agencies. The latter – shown in Appendix 3 - contained all survey questions; the NASSGAP version excluded two questions pertaining to only SHEEO’s
Recession, Retrenchment, and Recovery 27
and the SHEEO version excluded certain financial aid questions. Therefore, the number responding to each question will not always add to 50. In addition, respondents may have skipped certain questions. Most questions allowed respondents to indicate their level of agreement on a five-point response scale. For reporting purposes, however, responses such as “much more important,” and “more important” were combined into the “more important” category. The remainder of this section provides survey results based on the four primary research questions. Analysis was also completed based on the regional higher education organization with which the state was affiliated. These organizations include the Midwest Higher Education Commission, the New England Board of
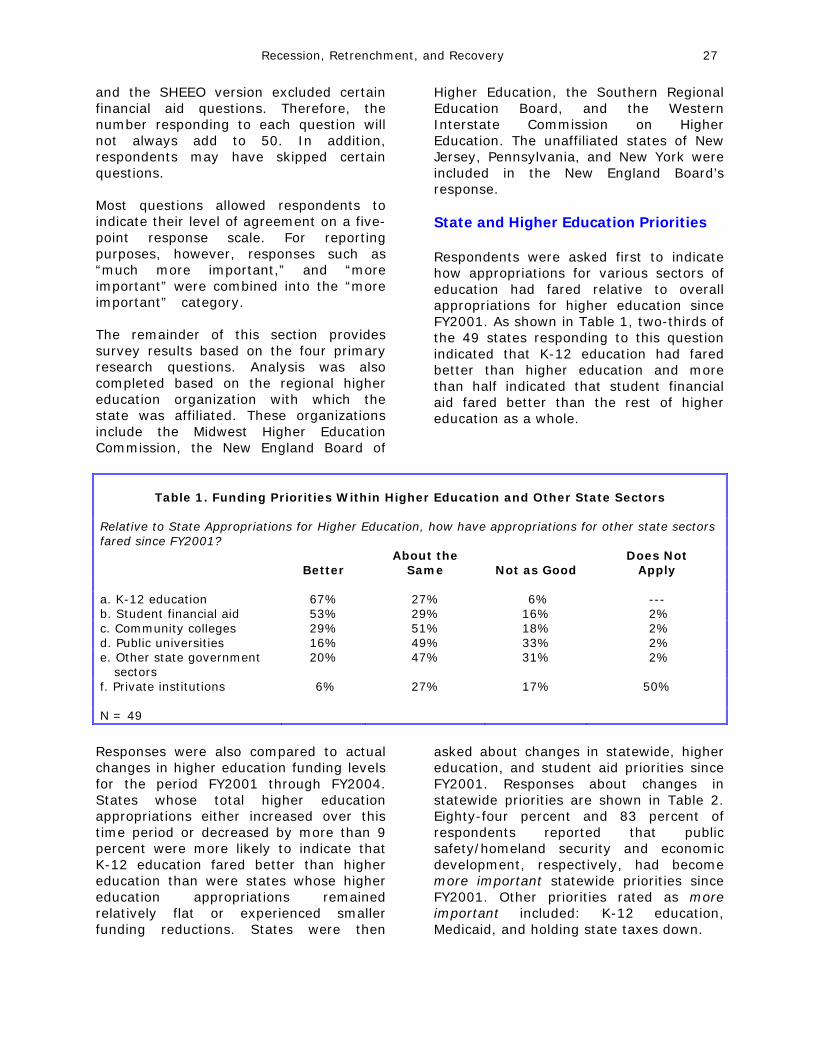
Higher Education, the Southern Regional Education Board, and the Western Interstate Commission on Higher Education. The unaffiliated states of New Jersey, Pennsylvania, and New York were included in the New England Board’s response. State and Higher Education Priorities Respondents were asked first to indicate how appropriations for various sectors of education had fared relative to overall appropriations for higher education since FY2001. As shown in Table 1, two-thirds of the 49 states responding to this question indicated that K-12 education had fared better than higher education and more than half indicated that student financial aid fared better than the rest of higher education as a whole.
Table 1. Funding Priorities Within Higher Education and Other State Sectors Relative to State Appropriations for Higher Education, how have appropriations for other state sectors fared since FY2001?
Better About the
Same
Not as Good Does Not
Apply a. K-12 education 67% 27% 6% --- b. Student financial aid 53% 29% 16% 2% c. Community colleges 29% 51% 18% 2% d. Public universities 16% 49% 33% 2% e. Other state government
sectors 20% 47% 31% 2%
f. Private institutions 6% 27% 17% 50% N = 49 Responses were also compared to actual changes in higher education funding levels for the period FY2001 through FY2004. States whose total higher education appropriations either increased over this time period or decreased by more than 9 percent were more likely to indicate that K-12 education fared better than higher education than were states whose higher education appropriations remained relatively flat or experienced smaller funding reductions. States were then
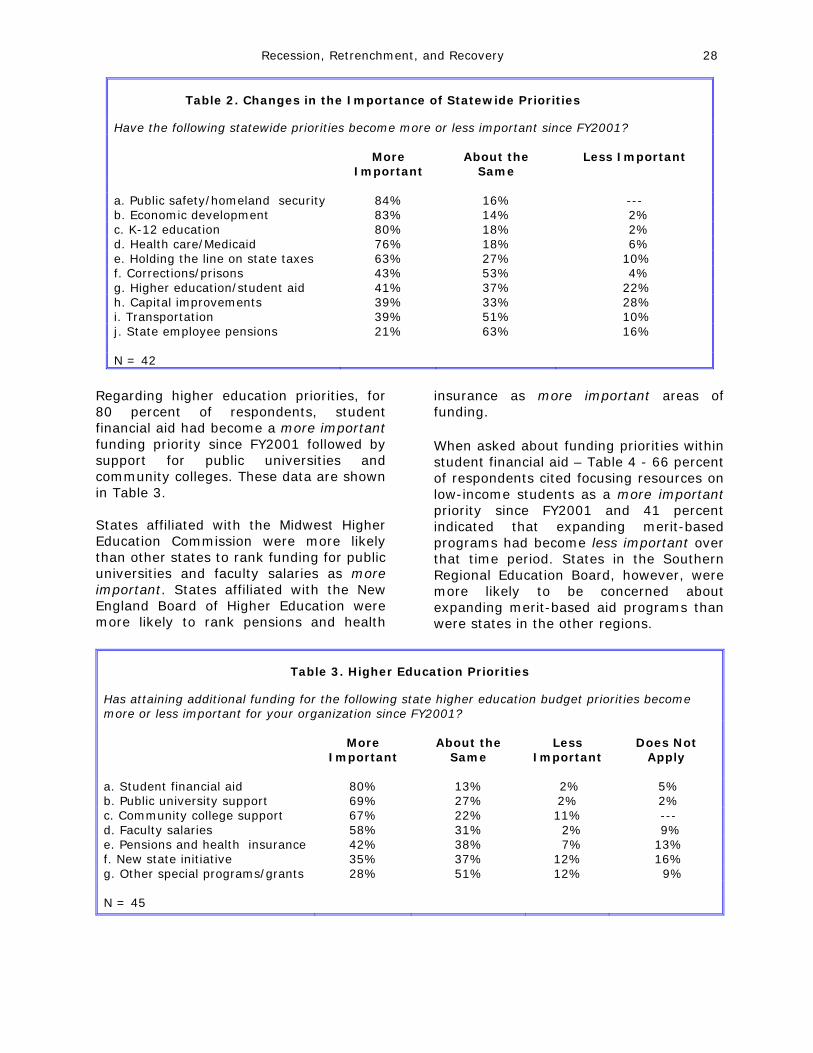
asked about changes in statewide, higher education, and student aid priorities since FY2001. Responses about changes in statewide priorities are shown in Table 2. Eighty-four percent and 83 percent of respondents reported that public safety/homeland security and economic development, respectively, had become more important statewide priorities since FY2001. Other priorities rated as more important included: K-12 education, Medicaid, and holding state taxes down.
Recession, Retrenchment, and Recovery 28
Table 2. Changes in the Importance of Statewide Priorities
Have the following statewide priorities become more or less important since FY2001?
More
Important
About the
Same
Less Important
a. Public safety/homeland security 84% 16% --- b. Economic development 83% 14% 2% c. K-12 education 80% 18% 2% d. Health care/Medicaid 76% 18% 6% e. Holding the line on state taxes 63% 27% 10% f. Corrections/prisons 43% 53% 4% g. Higher education/student aid 41% 37% 22% h. Capital improvements 39% 33% 28% i. Transportation 39% 51% 10% j. State employee pensions 21% 63% 16% N = 42
Regarding higher education priorities, for 80 percent of respondents, student financial aid had become a more important funding priority since FY2001 followed by support for public universities and community colleges. These data are shown in Table 3. States affiliated with the Midwest Higher Education Commission were more likely than other states to rank funding for public universities and faculty salaries as more important. States affiliated with the New England Board of Higher Education were more likely to rank pensions and health
insurance as more important areas of funding. When asked about funding priorities within student financial aid – Table 4 - 66 percent of respondents cited focusing resources on low-income students as a more important priority since FY2001 and 41 percent indicated that expanding merit-based programs had become less important over that time period. States in the Southern Regional Education Board, however, were more likely to be concerned about expanding merit-based aid programs than were states in the other regions.
Table 3. Higher Education Priorities Has attaining additional funding for the following state higher education budget priorities become more or less important for your organization since FY2001?
More Important
About the
Same
Less
Important
Does Not
Apply a. Student financial aid 80% 13% 2% 5% b. Public university support 69% 27% 2% 2% c. Community college support 67% 22% 11% --- d. Faculty salaries 58% 31% 2% 9% e. Pensions and health insurance 42% 38% 7% 13% f. New state initiative 35% 37% 12% 16% g. Other special programs/grants 28% 51% 12% 9% N = 45
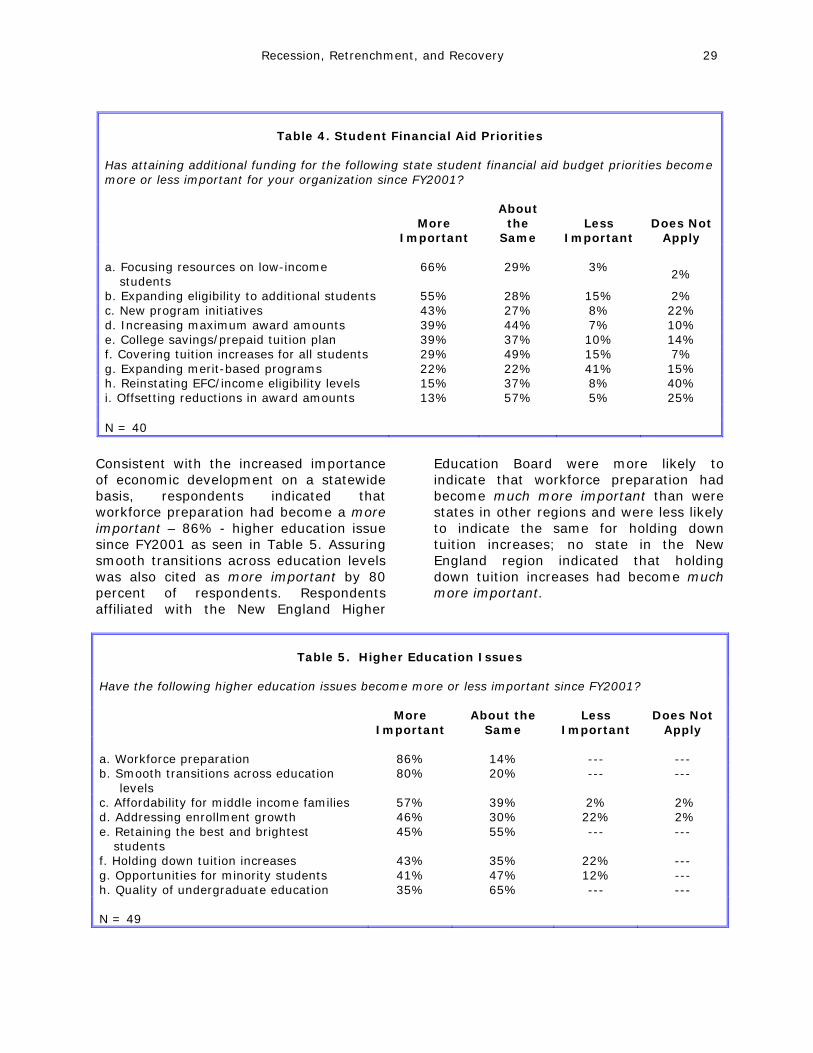
Recession, Retrenchment, and Recovery 29
Table 4. Student Financial Aid Priorities Has attaining additional funding for the following state student financial aid budget priorities become more or less important for your organization since FY2001?
More Important
About the
Same
Less
Important
Does Not
Apply a. Focusing resources on low-income
students 66% 29% 3%
2%
b. Expanding eligibility to additional students 55% 28% 15% 2% c. New program initiatives 43% 27% 8% 22% d. Increasing maximum award amounts 39% 44% 7% 10% e. College savings/prepaid tuition plan 39% 37% 10% 14% f. Covering tuition increases for all students 29% 49% 15% 7% g. Expanding merit-based programs 22% 22% 41% 15% h. Reinstating EFC/income eligibility levels 15% 37% 8% 40% i. Offsetting reductions in award amounts 13% 57% 5% 25% N = 40
Consistent with the increased importance of economic development on a statewide basis, respondents indicated that workforce preparation had become a more important – 86% - higher education issue since FY2001 as seen in Table 5. Assuring smooth transitions across education levels was also cited as more important by 80 percent of respondents. Respondents affiliated with the New England Higher
Education Board were more likely to indicate that workforce preparation had become much more important than were states in other regions and were less likely to indicate the same for holding down tuition increases; no state in the New England region indicated that holding down tuition increases had become much more important.
Table 5. Higher Education Issues Have the following higher education issues become more or less important since FY2001? More
Important About the
Same Less
Important Does Not
Apply a. Workforce preparation 86% 14% --- --- b. Smooth transitions across education
levels 80% 20% --- ---
c. Affordability for middle income families 57% 39% 2% 2% d. Addressing enrollment growth 46% 30% 22% 2% e. Retaining the best and brightest
students 45% 55% --- ---
f. Holding down tuition increases 43% 35% 22% --- g. Opportunities for minority students 41% 47% 12% --- h. Quality of undergraduate education 35% 65% --- --- N = 49

Recession, Retrenchment, and Recovery 30
Additional tabulations were completed based on the state’s Access Cost Indicator (ACI) calculated during the fiscal analysis phase of the study. The ACI was derived by subtracting average state public need-based aid from average public institution tuition and dividing the remainder by family income based on the median of the second income quintile for each state. Low ACIs were associated with better financial access. For the survey analysis, states were divided into approximately three equal groups based on their ACI in FY2004. “Low” ACIs were values less than 12 and “high” ACIs were greater than 16. States in the “high” ACI group were more likely than states in the “low” ACI group to indicate that retaining the best and brightest students, and holding down tuition increases had become more important priorities in their states since FY2001.
Program and Policy Changes The second section of the survey focused on program and policy changes made since FY2001 in response to higher education and student aid appropriation levels and the implications of these
changes for financial access. Since 19 states experienced reductions in student financial aid appropriations per FTE during this time, one concern was how they managed their student aid programs with reduced funding. Respondents were first asked about policy changes in their primary state-funded student aid program since FY2001. As shown in Table 6, 19 states indicated no changes had been made in program policy attributable to reduced or inadequate funding. Of the 23 states reporting changes, the primary impact appeared to be in loss of purchasing power for students; 9 states reported a decreased or flat maximum award and seven states indicated not addressing tuition increases in award determination. The number of eligible students was also constrained through the use of stricter expected family contribution (EFC) or family income cutoffs reported by seven states and stricter academic requirements reported by five states. Most states used multiple strategies; the average was 2.6 program changes per state for those reporting changes.
Table 6. Program and Policy Changes in Primary Need-Based Aid Programs
Since FY2001 what programmatic or policy changes have been made in your primary need-based aid program that can be attributed to reduced or inadequate funding?
#Yes
%
a. No changes made 19 45% b. Decreased or frozen maximum award 9 21% c. No recognition of tuition increases 7 17% d. Stricter limits on family income/EFC cutoff 7 17% e. Depressed budget used in award calculation 7 17% f. Stricter academic requirements 5 12% g. Percentage reduction to award 4 10% h. Earlier application deadlines 3 7% i. Stricter limits on aggregate award usage 3 7% N = 42
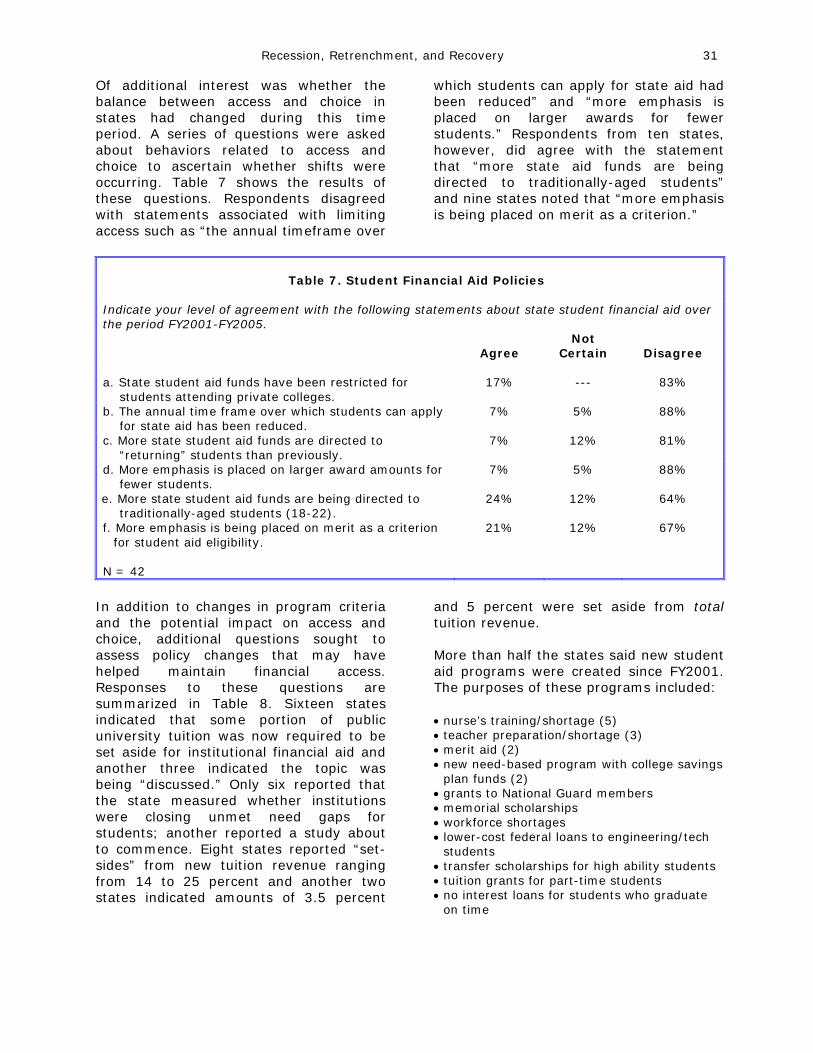
Recession, Retrenchment, and Recovery 31 Of additional interest was whether the balance between access and choice in states had changed during this time period. A series of questions were asked about behaviors related to access and choice to ascertain whether shifts were occurring. Table 7 shows the results of these questions. Respondents disagreed with statements associated with limiting access such as “the annual timeframe over
which students can apply for state aid had been reduced” and “more emphasis is placed on larger awards for fewer students.” Respondents from ten states, however, did agree with the statement that “more state aid funds are being directed to traditionally-aged students” and nine states noted that “more emphasis is being placed on merit as a criterion.”
Table 7. Student Financial Aid Policies
Indicate your level of agreement with the following statements about state student financial aid over the period FY2001-FY2005.
Agree Not
Certain
Disagree a. State student aid funds have been restricted for
students attending private colleges. 17% --- 83%
b. The annual time frame over which students can apply for state aid has been reduced.
7% 5% 88%
c. More state student aid funds are directed to “returning” students than previously.
7% 12% 81%
d. More emphasis is placed on larger award amounts for fewer students.
7% 5% 88%
e. More state student aid funds are being directed to traditionally-aged students (18-22).
24% 12% 64%
f. More emphasis is being placed on merit as a criterion for student aid eligibility.
21% 12% 67%
N = 42
In addition to changes in program criteria and the potential impact on access and choice, additional questions sought to assess policy changes that may have helped maintain financial access. Responses to these questions are summarized in Table 8. Sixteen states indicated that some portion of public university tuition was now required to be set aside for institutional financial aid and another three indicated the topic was being “discussed.” Only six reported that the state measured whether institutions were closing unmet need gaps for students; another reported a study about to commence. Eight states reported “set-sides” from new tuition revenue ranging from 14 to 25 percent and another two states indicated amounts of 3.5 percent
and 5 percent were set aside from total tuition revenue. More than half the states said new student aid programs were created since FY2001. The purposes of these programs included: • nurse’s training/shortage (5) • teacher preparation/shortage (3) • merit aid (2) • new need-based program with college savings
plan funds (2) • grants to National Guard members • memorial scholarships • workforce shortages • lower-cost federal loans to engineering/tech
students • transfer scholarships for high ability students • tuition grants for part-time students • no interest loans for students who graduate
on time
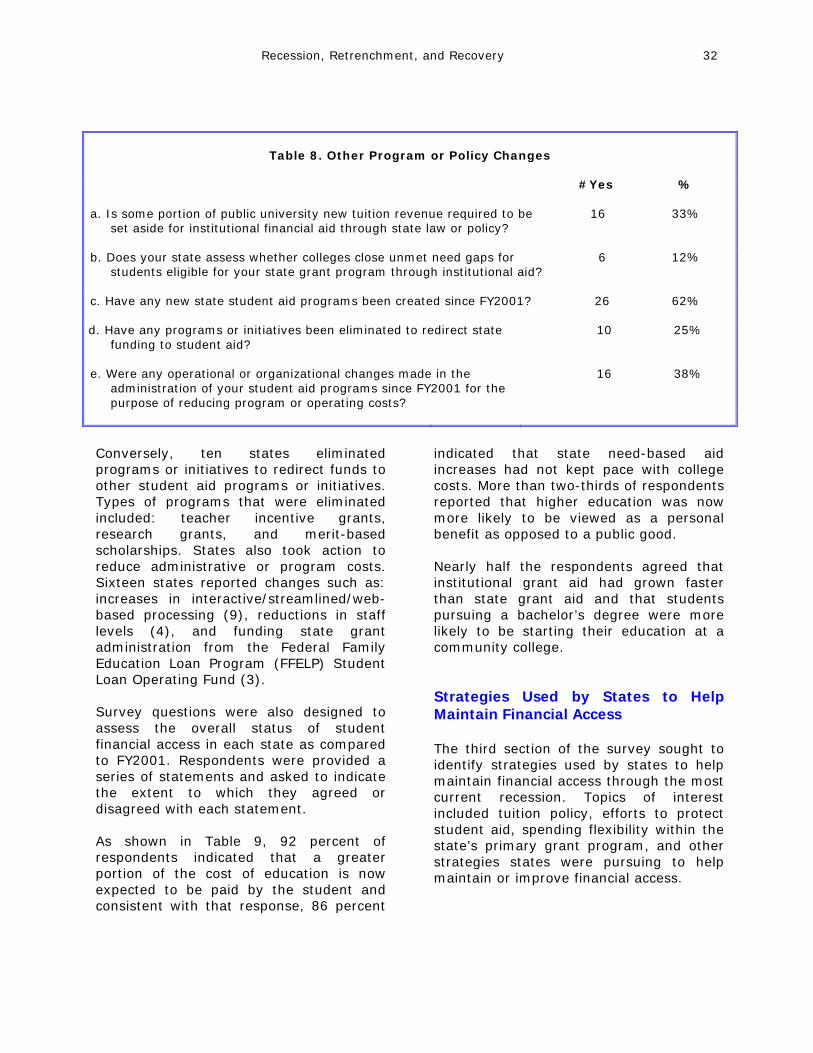
Recession, Retrenchment, and Recovery 32
Conversely, ten states eliminated programs or initiatives to redirect funds to other student aid programs or initiatives. Types of programs that were eliminated included: teacher incentive grants, research grants, and merit-based scholarships. States also took action to reduce administrative or program costs. Sixteen states reported changes such as: increases in interactive/streamlined/web-based processing (9), reductions in staff levels (4), and funding state grant administration from the Federal Family Education Loan Program (FFELP) Student Loan Operating Fund (3). Survey questions were also designed to assess the overall status of student financial access in each state as compared to FY2001. Respondents were provided a series of statements and asked to indicate the extent to which they agreed or disagreed with each statement. As shown in Table 9, 92 percent of respondents indicated that a greater portion of the cost of education is now expected to be paid by the student and consistent with that response, 86 percent
indicated that state need-based aid increases had not kept pace with college costs. More than two-thirds of respondents reported that higher education was now more likely to be viewed as a personal benefit as opposed to a public good. Nearly half the respondents agreed that institutional grant aid had grown faster than state grant aid and that students pursuing a bachelor’s degree were more likely to be starting their education at a community college. Strategies Used by States to Help Maintain Financial Access The third section of the survey sought to identify strategies used by states to help maintain financial access through the most current recession. Topics of interest included tuition policy, efforts to protect student aid, spending flexibility within the state’s primary grant program, and other strategies states were pursuing to help maintain or improve financial access.
Table 8. Other Program or Policy Changes
#Yes
%
a. Is some portion of public university new tuition revenue required to be set aside for institutional financial aid through state law or policy?
16 33%
b. Does your state assess whether colleges close unmet need gaps for students eligible for your state grant program through institutional aid?
6 12%
c. Have any new state student aid programs been created since FY2001?
26 62%
d. Have any programs or initiatives been eliminated to redirect state funding to student aid?
10 25%
e. Were any operational or organizational changes made in the administration of your student aid programs since FY2001 for the purpose of reducing program or operating costs?
16 38%
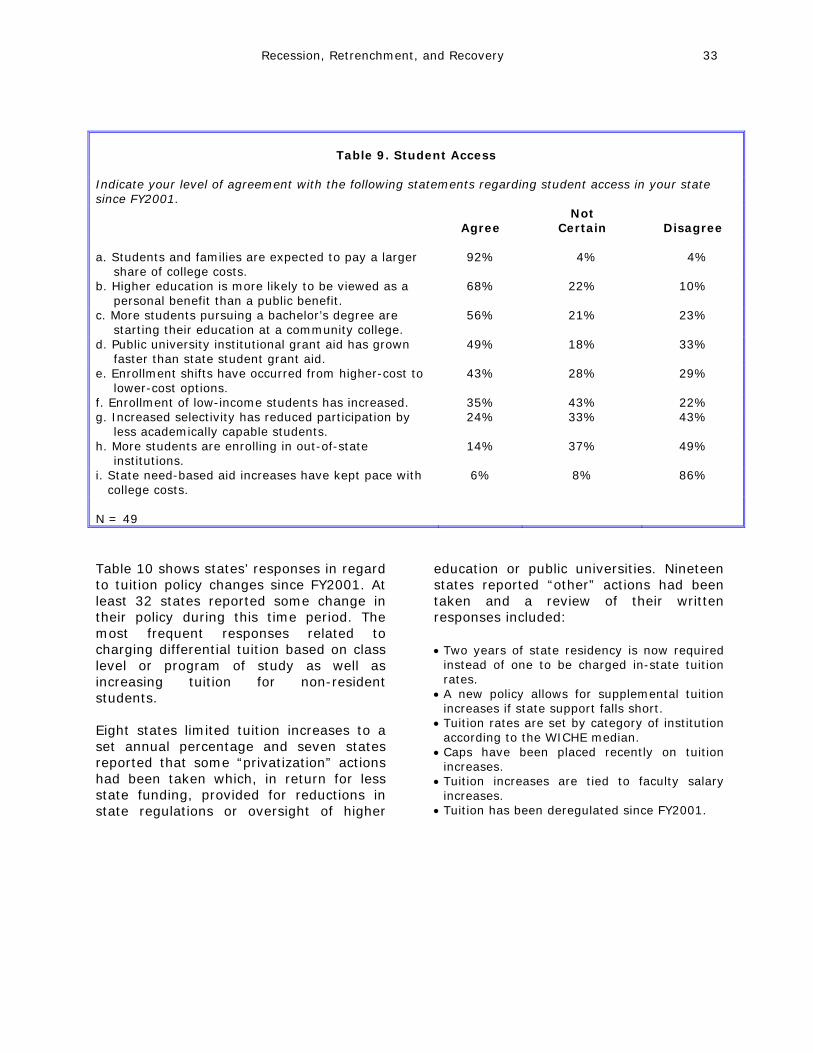
Recession, Retrenchment, and Recovery 33
Table 9. Student Access
Indicate your level of agreement with the following statements regarding student access in your state since FY2001.
Agree Not
Certain
Disagree a. Students and families are expected to pay a larger
share of college costs. 92% 4% 4%
b. Higher education is more likely to be viewed as a personal benefit than a public benefit.
68% 22% 10%
c. More students pursuing a bachelor’s degree are starting their education at a community college.
56% 21% 23%
d. Public university institutional grant aid has grown faster than state student grant aid.
49% 18% 33%
e. Enrollment shifts have occurred from higher-cost to lower-cost options.
43% 28% 29%
f. Enrollment of low-income students has increased. 35% 43% 22% g. Increased selectivity has reduced participation by
less academically capable students. 24% 33% 43%
h. More students are enrolling in out-of-state institutions.
14% 37% 49%
i. State need-based aid increases have kept pace with college costs.
6% 8% 86%
N = 49 Table 10 shows states’ responses in regard to tuition policy changes since FY2001. At least 32 states reported some change in their policy during this time period. The most frequent responses related to charging differential tuition based on class level or program of study as well as increasing tuition for non-resident students. Eight states limited tuition increases to a set annual percentage and seven states reported that some “privatization” actions had been taken which, in return for less state funding, provided for reductions in state regulations or oversight of higher
education or public universities. Nineteen states reported “other” actions had been taken and a review of their written responses included: • Two years of state residency is now required
instead of one to be charged in-state tuition rates.
• A new policy allows for supplemental tuition increases if state support falls short.
• Tuition rates are set by category of institution according to the WICHE median.
• Caps have been placed recently on tuition increases.
• Tuition increases are tied to faculty salary increases.
• Tuition has been deregulated since FY2001.
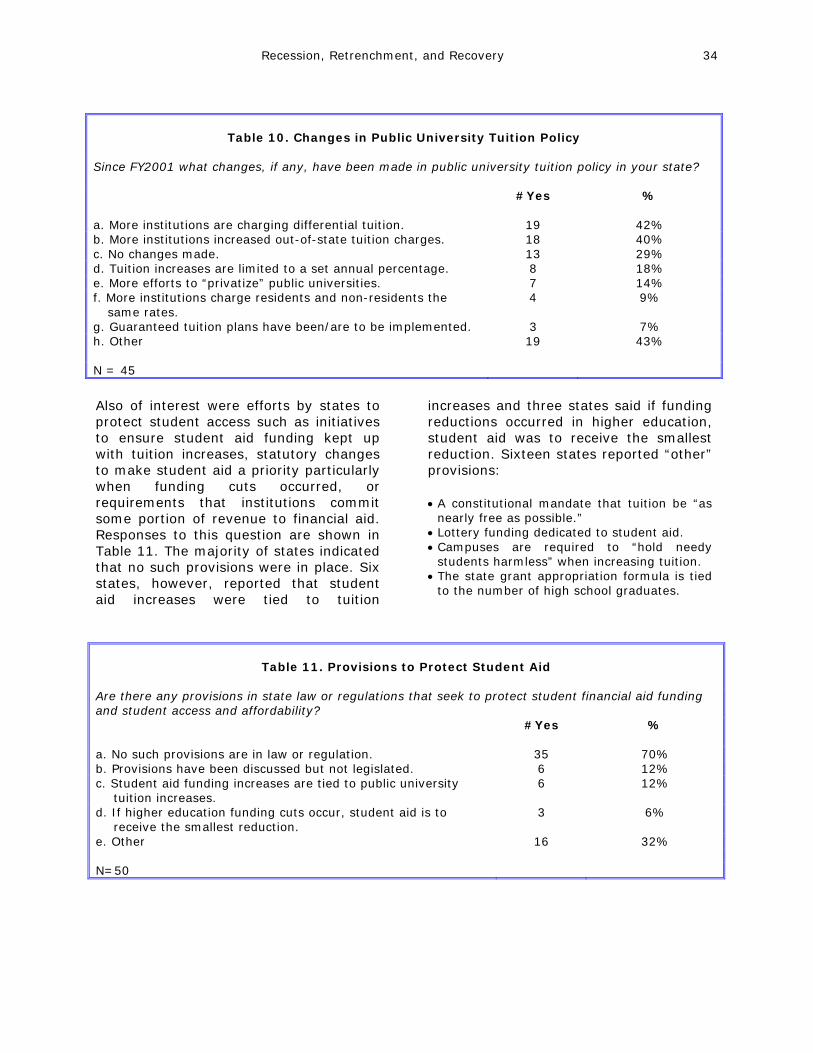
Recession, Retrenchment, and Recovery 34
Table 10. Changes in Public University Tuition Policy
Since FY2001 what changes, if any, have been made in public university tuition policy in your state? #Yes
%
a. More institutions are charging differential tuition. 19 42% b. More institutions increased out-of-state tuition charges. 18 40% c. No changes made. 13 29% d. Tuition increases are limited to a set annual percentage. 8 18% e. More efforts to “privatize” public universities. 7 14% f. More institutions charge residents and non-residents the
same rates. 4 9%
g. Guaranteed tuition plans have been/are to be implemented. 3 7% h. Other 19 43% N = 45
Also of interest were efforts by states to protect student access such as initiatives to ensure student aid funding kept up with tuition increases, statutory changes to make student aid a priority particularly when funding cuts occurred, or requirements that institutions commit some portion of revenue to financial aid. Responses to this question are shown in Table 11. The majority of states indicated that no such provisions were in place. Six states, however, reported that student aid increases were tied to tuition
increases and three states said if funding reductions occurred in higher education, student aid was to receive the smallest reduction. Sixteen states reported “other” provisions: • A constitutional mandate that tuition be “as
nearly free as possible.” • Lottery funding dedicated to student aid. • Campuses are required to “hold needy
students harmless” when increasing tuition. • The state grant appropriation formula is tied
to the number of high school graduates.
Table 11. Provisions to Protect Student Aid
Are there any provisions in state law or regulations that seek to protect student financial aid funding and student access and affordability? #Yes
%
a. No such provisions are in law or regulation. 35 70% b. Provisions have been discussed but not legislated. 6 12% c. Student aid funding increases are tied to public university
tuition increases. 6 12%
d. If higher education funding cuts occur, student aid is to receive the smallest reduction.
3 6%
e. Other 16 32% N=50
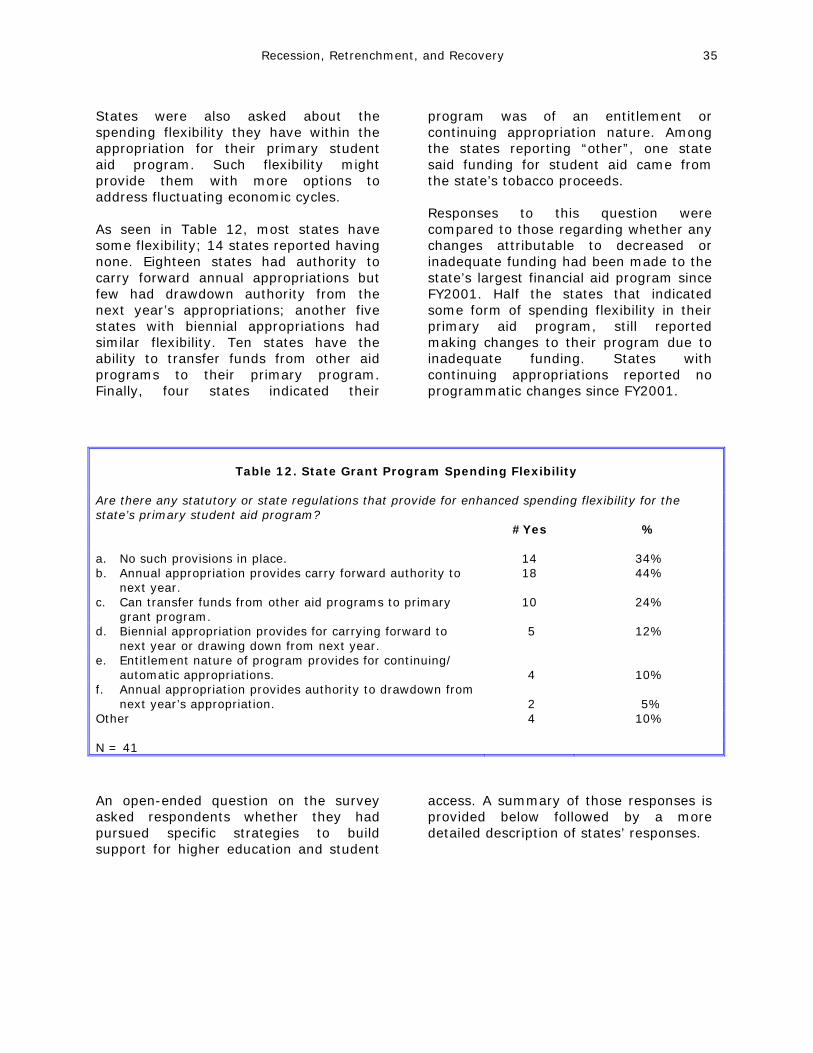
Recession, Retrenchment, and Recovery 35
States were also asked about the spending flexibility they have within the appropriation for their primary student aid program. Such flexibility might provide them with more options to address fluctuating economic cycles. As seen in Table 12, most states have some flexibility; 14 states reported having none. Eighteen states had authority to carry forward annual appropriations but few had drawdown authority from the next year’s appropriations; another five states with biennial appropriations had similar flexibility. Ten states have the ability to transfer funds from other aid programs to their primary program. Finally, four states indicated their
program was of an entitlement or continuing appropriation nature. Among the states reporting “other”, one state said funding for student aid came from the state’s tobacco proceeds. Responses to this question were compared to those regarding whether any changes attributable to decreased or inadequate funding had been made to the state’s largest financial aid program since FY2001. Half the states that indicated some form of spending flexibility in their primary aid program, still reported making changes to their program due to inadequate funding. States with continuing appropriations reported no programmatic changes since FY2001.
Table 12. State Grant Program Spending Flexibility
Are there any statutory or state regulations that provide for enhanced spending flexibility for the state’s primary student aid program? #Yes
%
a. No such provisions in place. 14 34% b. Annual appropriation provides carry forward authority to
next year. 18 44%
c. Can transfer funds from other aid programs to primary grant program.
10 24%
d. Biennial appropriation provides for carrying forward to next year or drawing down from next year.
5 12%
e. Entitlement nature of program provides for continuing/ automatic appropriations.
4
10%
f. Annual appropriation provides authority to drawdown from next year’s appropriation.
2
5%
Other 4 10% N = 41
An open-ended question on the survey asked respondents whether they had pursued specific strategies to build support for higher education and student
access. A summary of those responses is provided below followed by a more detailed description of states’ responses.
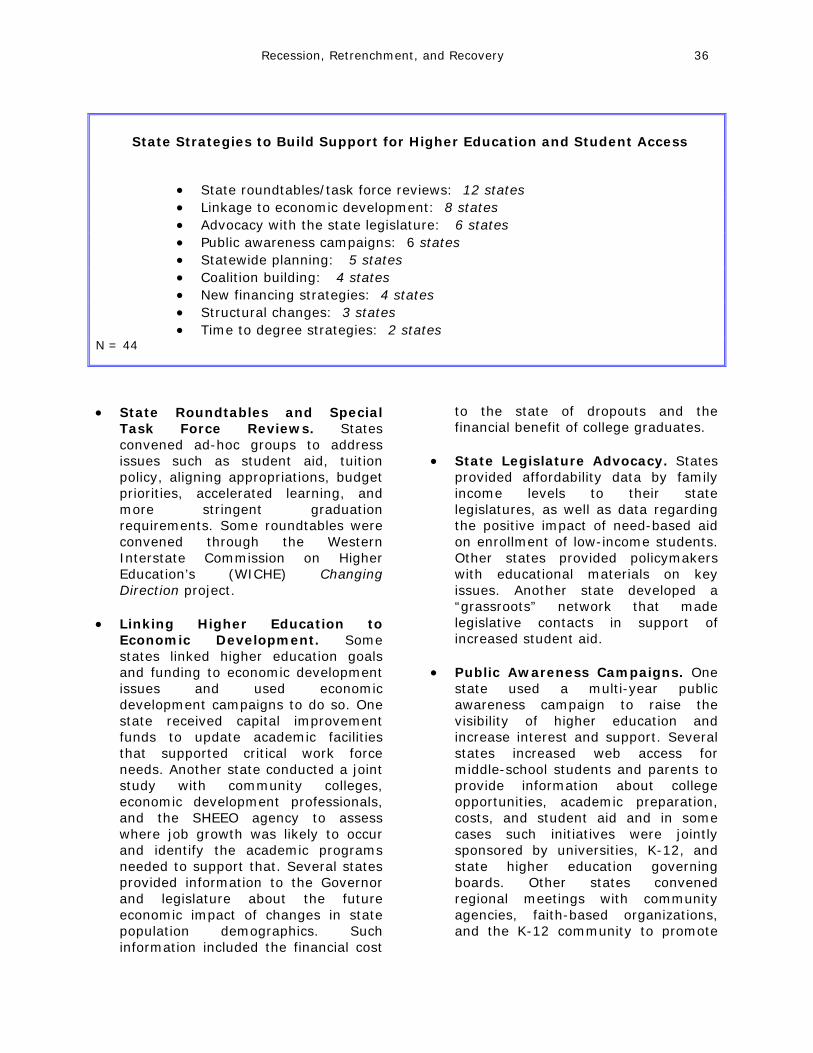
Recession, Retrenchment, and Recovery 36
State Strategies to Build Support for Higher Education and Student Access
• State roundtables/task force reviews: 12 states • Linkage to economic development: 8 states • Advocacy with the state legislature: 6 states • Public awareness campaigns: 6 states • Statewide planning: 5 states • Coalition building: 4 states • New financing strategies: 4 states • Structural changes: 3 states • Time to degree strategies: 2 states
N = 44
• State Roundtables and Special
Task Force Reviews. States convened ad-hoc groups to address issues such as student aid, tuition policy, aligning appropriations, budget priorities, accelerated learning, and more stringent graduation requirements. Some roundtables were convened through the Western Interstate Commission on Higher Education’s (WICHE) Changing Direction project.
• Linking Higher Education to
Economic Development. Some states linked higher education goals and funding to economic development issues and used economic development campaigns to do so. One state received capital improvement funds to update academic facilities that supported critical work force needs. Another state conducted a joint study with community colleges, economic development professionals, and the SHEEO agency to assess where job growth was likely to occur and identify the academic programs needed to support that. Several states provided information to the Governor and legislature about the future economic impact of changes in state population demographics. Such information included the financial cost
to the state of dropouts and the financial benefit of college graduates.
• State Legislature Advocacy. States
provided affordability data by family income levels to their state legislatures, as well as data regarding the positive impact of need-based aid on enrollment of low-income students. Other states provided policymakers with educational materials on key issues. Another state developed a “grassroots” network that made legislative contacts in support of increased student aid.
• Public Awareness Campaigns. One
state used a multi-year public awareness campaign to raise the visibility of higher education and increase interest and support. Several states increased web access for middle-school students and parents to provide information about college opportunities, academic preparation, costs, and student aid and in some cases such initiatives were jointly sponsored by universities, K-12, and state higher education governing boards. Other states convened regional meetings with community agencies, faith-based organizations, and the K-12 community to promote
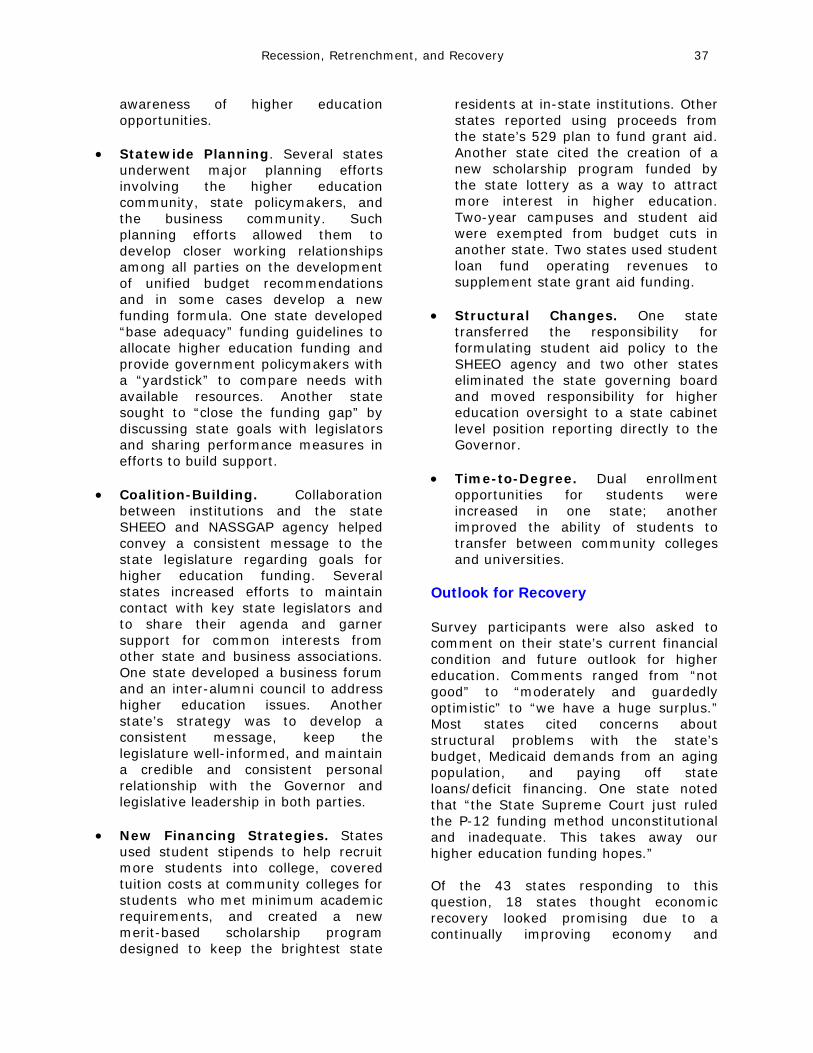
Recession, Retrenchment, and Recovery 37
awareness of higher education opportunities.
• Statewide Planning. Several states
underwent major planning efforts involving the higher education community, state policymakers, and the business community. Such planning efforts allowed them to develop closer working relationships among all parties on the development of unified budget recommendations and in some cases develop a new funding formula. One state developed “base adequacy” funding guidelines to allocate higher education funding and provide government policymakers with a “yardstick” to compare needs with available resources. Another state sought to “close the funding gap” by discussing state goals with legislators and sharing performance measures in efforts to build support.
• Coalition-Building. Collaboration
between institutions and the state SHEEO and NASSGAP agency helped convey a consistent message to the state legislature regarding goals for higher education funding. Several states increased efforts to maintain contact with key state legislators and to share their agenda and garner support for common interests from other state and business associations. One state developed a business forum and an inter-alumni council to address higher education issues. Another state’s strategy was to develop a consistent message, keep the legislature well-informed, and maintain a credible and consistent personal relationship with the Governor and legislative leadership in both parties.
• New Financing Strategies. States
used student stipends to help recruit more students into college, covered tuition costs at community colleges for students who met minimum academic requirements, and created a new merit-based scholarship program designed to keep the brightest state
residents at in-state institutions. Other states reported using proceeds from the state’s 529 plan to fund grant aid. Another state cited the creation of a new scholarship program funded by the state lottery as a way to attract more interest in higher education. Two-year campuses and student aid were exempted from budget cuts in another state. Two states used student loan fund operating revenues to supplement state grant aid funding.
• Structural Changes. One state transferred the responsibility for formulating student aid policy to the SHEEO agency and two other states eliminated the state governing board and moved responsibility for higher education oversight to a state cabinet level position reporting directly to the Governor.
• Time-to-Degree. Dual enrollment
opportunities for students were increased in one state; another improved the ability of students to transfer between community colleges and universities.
Outlook for Recovery Survey participants were also asked to comment on their state’s current financial condition and future outlook for higher education. Comments ranged from “not good” to “moderately and guardedly optimistic” to “we have a huge surplus.” Most states cited concerns about structural problems with the state’s budget, Medicaid demands from an aging population, and paying off state loans/deficit financing. One state noted that “the State Supreme Court just ruled the P-12 funding method unconstitutional and inadequate. This takes away our higher education funding hopes.” Of the 43 states responding to this question, 18 states thought economic recovery looked promising due to a continually improving economy and
Recession, Retrenchment, and Recovery 38
revenue growth that had returned to pre-recession levels. Most states that reported their chances for financial recovery as good, however, had concerns about future higher education funding levels noting:
“Higher education funding may remain flat due to competing demands and the recognition that higher education can raise its own revenue.” “Demographics dictate that we will not return to the same funding levels for higher education as in the past. Health care, human services, and K-12 education will increase their financial draw.”
“Tuition and fee increases will likely continue to outstrip need-based aid increases.”
Another 17 states responding to this question were more guarded in their expectations about financial recovery, using words such as “tepid,” “slow,” and “fragile.” Specific comments included:
“State expenditures have shrunk with the largest reduction coming from higher education. This is not due to economic conditions which were marginal but conscious decisions by the legislative and executive branches to shrink revenues through tax cuts.” “Financial recovery will slow and be much less vigorous than that of the nation. Funding for higher education will not be a major priority. “
“A mild recovery has been going on for two years but we are concerned about another downward trend in the economy.”
Finally, eight states described their prospects for financial recovery as “weak and of great concern.” Their comments included:
“The state has reeled during this downturn and we are gravely concerned about the ability to reengineer the state employment base from manufacturing to a high technology/information base.”
“Revenue projections are expected to slow. Along with state cuts this will impact education. A constitutional amendment dealing with K-12 class size will eat up a significant portion of state revenues.”
States also cited a number of concerns related to the future. States concerned about financial recovery were also concerned about state tax policy. They noted:
“There is no political appetite to increase state taxes.” “Tax cuts are at least equally important in the future as economic recovery.” “Tax cuts in the 1990s have produced structural problems and with no tax pledges are all over the map, we will face tough funding issues.”
Other concerns about the future of higher education and student financial aid included:
“We are very concerned that the state will continue to reward students with merit awards to further political goals rather than need-based aid to achieve public policy goals.”
“Our greatest concern is that political power of the public institutions will outweigh the practical affect of student financial aid and its focus on students with the most need.” “Many institutions have increased funding for merit scholarships spending over 35 percent of tuition income.” “In a block grant state institutional need is always in contest with state financial aid for more dollars, so strong institutional support for student financial aid is lacking.”
And some final words of advice from states:
“We’re experienced great leadership from a new Chancellor who unified institutions and as a result, higher education is seen in a more favorable light by the legislature.”
Recession, Retrenchment, and Recovery 39
“It’s important to keep the ‘issue’ in the forefront and not let state policy and budget people lose sight of the problem.” “Placing more funds in the hands of students makes them more ‘valuable’ to institutions and this increases their power to promote change and innovation.”
Analysis of Responses This survey was conducted in the spring of 2005 at a time when most states’ higher education appropriations were starting to rebound although data from the fiscal analysis phase of this Project shows that by FY2006, 30 states still had not recovered to their FY2001 funding levels when assessed by FTE in real terms. The survey’s central finding is that higher education and student financial aid funding have become lower funding priorities for most states since FY2001. This can be attributed to a number of factors including structural budget deficits as a result of the growing demand on state revenues for such items as Medicaid, revenue shortfalls resulting from a shift in consumption from goods to services, and state elected officials’ distaste for increasing taxes. K-12 funding has seemed to fare better over this time period than higher education but in some states this is due to lack of compliance with federal requirements and the need to increase state funding or lose substantial federal support. K-12 funding also appeared to fare better than higher education when states’ fiscal conditions improved or when dramatic budget cuts were needed; higher education and agencies other than K-12 took the brunt of those cuts. When states experienced limited or no reductions, however, the cuts appeared to be across the board. Interestingly, states reported that economic development (84%) and workforce preparation (86%) have
become more important state priorities since FY2001 but also that higher education is more likely to be seen as a personal benefit that a public benefit (68%). This suggests a lack of understanding about the role of higher education in economic growth or as one respondent indicated, “legislators don’t seem to make the connection.” Respondents also said a greater portion of the cost of education is now expected to be paid by the student. Whether this is a deliberate public policy decision or the unintended result of other state priorities consuming what new funding is available, is unclear. Given the number of states, however, that have constitutional or policy directives that define the level of support to be provided and indicate this level is not currently being achieved, suggests that state lawmakers regard helping students with colleges costs as secondary to other state priorities. Such states fall into the mold that, “Once tuition and appropriations were determined, policymakers looked at the budget dust to determine how much was left over for financial aid” (WICHE, 2003). Perhaps another unintended policy change is suggested by the level of agreement with such statements as “public university institutional grant aid is growing faster than state financial aid” and “state aid is not keeping pace with college costs.” These statements suggest that states’ roles in setting policy about who receives student aid and the purpose of student aid are being diluted as increasing amounts of grant aid are provided by institutions through tuition offsets. For many states, faced with rising tuition costs, tuition offsets may represent a last-ditch effort to fund student aid when state funding is not forthcoming. Effectively, however, the burden to support low-income students at public universities is being passed from taxpayers to tuition payers. Finally, the survey provides evidence that access is being limited. Respondents generally disagreed with statements that
Recession, Retrenchment, and Recovery 40
earlier state aid application deadlines were occurring and that funding was more focused on “returning” students, however, there was more agreement that funds were directed to traditionally-aged students – rather than later-applying nontraditional students - and that merit was having a larger role in determining eligibility. Further, access, to four-year institutions also appears to be threatened for low-income students. According to respondents more students pursuing a bachelor’s degree are initially enrolling at community colleges (56%) and enrollment shifts are being seen from higher-cost to lower-cost institutions (49%). States, however, are busily involved in pursuing strategies to help secure increased funding for higher education and student aid. And those that cited good leadership - either from the Governor, key members of the legislature, the SHEEO and NASSGAP agencies, or coordinated efforts by institutions and sectors of higher education - were more hopeful about their future. States that cited politics as the key decision factor, however, were considerably less optimistic. Conclusion The second phase of the Recession, Retrenchment, and Recovery Project was a survey of the chief executive officers of state SHEEO and NASSGAP organizations in the spring of 2005. The purpose of the survey was to determine the impact of the 2001 recession on statewide higher education and student aid policies and priorities and discover strategies states used to help maintain financial access to college for their residents. States reported that since FY2001 more emphasis had been placed on statewide priorities such as homeland security, economic development, and K-12 education and less emphasis on higher
education and student aid funding. Within higher education, however, the top funding priority was student financial aid and key higher education issues were workforce preparation and smooth transitions across educational levels. In response to relatively flat or reduced appropriations for the majority of states over the time period of the study, about half the states had made changes to their primary need-based aid program that either reduced the level of support being provided to students in the face of rising costs, or eliminated previously qualified students from eligibility. State responses suggested that access was affected; more student aid funds were now going to traditionally-aged students and more emphasis was being placed on merit as a criterion for eligibility. Importantly, respondents also cited shifts in enrollment from higher-cost to lower-cost institutions. States used multiple strategies to help maintain financial access including efforts in 16 states to protect students from tuition increases through tuition offsets for low-income students. States cited the use of roundtables, task forces, and statewide planning efforts as ways to engage the “community” in thinking about and addressing higher education and student financial access concerns. Collaboration and unified efforts both within higher education and with local organizations and business were seen as an important strategy. Finally, grassroots efforts to involve the public and particularly to work directly with the legislature were key strategies used by states. Most states expressed continued concern about funding for higher education in the face of competing state priorities and state structural budget deficits and a concomitant concern about the ability of student aid to keep pace with continued tuition increases.
Recession, Retrenchment, and Recovery 41
Chapter 3 State Visit Report Introduction The purpose of the Recession, Retrenchment, and Recovery Project was to examine the effects of recessions on financial access to college, to identify states that have been relatively successful in maintaining financial access for students through economic cycles, and to collect and disseminate policy strategies used by these states.
This chapter addresses the third phase of the Project, visits to seven states in the spring of 2006 with in-person interviews of 54 selected state higher education leaders and policymakers.
Overview of Research Methods
In the fieldwork phase of the Project, the objectives were to identify and visit a small number of states that had been able to maintain financial access for students, identify and interview leaders in higher education and in state government who were knowledgeable about state higher education funding and student financial aid, and collect policy strategies developed by these states for dissemination. Data sources and the methodology for selection of states are provided in Appendix 2. The interview process focused on the following four research objectives:
• Attributes of a Successful Higher Education System: To what do states attribute success in protecting financial access for students to the state’s colleges and universities?
• Structure and Relationships: How has
the state’s higher education structure
and relationships among key officials affected financial access goals for students?
• Major Financial Access Challenges:
What are the major challenges to student’ financial access, what are the current issues?
• Advice for Other States: What other
states have been successful at protecting financial access, and what advice do states’ have for others attempting to maintain financial access?
A list of the policymakers participating in interviews is provided in Appendix 4.
Findings The findings from visits to seven states are presented in a manner that focuses on the major questions contained in the interview protocol and utilize examples, quotations, and statistics from states as illustrations rather than report on states individually. Relative to other states in their regions, each of the seven states included in this phase of the Project ranked in the top ten on one or more measures of financial access based on the indicators used.
Planning and Coordination How states achieve success in providing financial access to college State leaders were asked initially about their success in maintaining financial
Recession, Retrenchment, and Recovery 42
access and to what they attributed their success. Define goals, develop a coherent plan. A majority of the seven states emphasized that to be successful in financial access to college the higher education system needs to have goals that are defined, visible, and coherent. In turn, the budget needs to be visibly tied to the policy goals for higher education in the state and to the broader state policy goals. In states where higher education appears to be achieving its budgetary and policy objectives, it was evident that higher education operated effectively within the state’s policy system. In Massachusetts, for instance, a state higher education leader said that “Affordability became a plank in the Governor’s platform.”
As budget goals are being formulated into a plan, some states choose to use budgetary formulas. States that successfully used formulas to define higher education’s funding needs reported that the formula had credibility among higher education and governmental leaders. They attributed this credibility to the simplicity of the formula and broad involvement of constituents in its development. One state leader noted that the formula became “a neutral third party in budget negotiations.” Whether or not budget formulas are used needs to be considered in relation to the historical pattern of higher education in the state and whether the use of formulas will add stability or possibly reduce flexibility. In budget development using formulas, consideration may be given to measures such as enrollment growth and academic program mix but these are not a precondition for success.
State leaders strongly suggested that it was important to include specific goals for student aid as part of a plan for achieving financial access for students and for the aid programs to be designed to achieve priorities. Goals typically defined who was to be eligible for aid, the level of support to be provided by the state, and whether the purpose was to provide access or choice, or both. As articulated in North Carolina, student aid was seen as an effective mechanism to encourage students to attend college in their home state. Eligibility for need-based aid was tied either to financial need where college costs were considered in determining eligibility, or to ability to pay where awards were linked to family income. Achieving financial access to higher education can be met, also, through low tuition. One state leader in North Carolina noted that low tuition was a definitive policy choice that a state can consider; “Think of low tuition as an endowment; once you spend it (by increasing tuition) where do you go? It shouldn’t be spent on one governor’s watch.”
Higher education leaders in these seven states emphasized that it is important to link tuition decisions and financial aid funding in the budget development process. In a majority of these states and in over 20 states in the survey, tuition set-asides (i.e. taking a defined portion of a tuition increase and earmarking it for need-based student financial aid) were being used with needy students who frequently were held harmless against tuition increases. These states indicated that student aid should not be an “add-on” or afterthought, perhaps getting buried in the bureaucracy. Rather, student aid should be a fundamental part of a
“Affordability became a plank in the
Governor’s platform.”
“Think of low tuition as an endowment; once you spend it (by increasing tuition) where do you go? It shouldn’t be spent on one
governor’s watch.”
Recession, Retrenchment, and Recovery 43
state’s higher education master plan, and it is logical to link student aid with attainment of an affordability goal, much as Texas did in 2001 with Closing the Gaps, the strategic plan for Texas higher education. Using tuition caps, however, was not a successful strategy in Massachusetts because it shifted the focus from tuition to student fees which subsequently increased to an excessively high level. Once tuition caps were removed, public institutions increased fees substantially in a short period of time, student aid did not keep pace, and financial access declined.
North Carolina identified a new funding stream for student aid; revenue from the Escheats Fund, an unclaimed property fund, had not been tapped previously to support state operations. As part of a comprehensive plan to align tuition and student aid, revenues from this source were dedicated to supporting the state’s primary need-based student aid program. It may be questionable whether many states would have such undedicated funds available, but consideration needs to be given to the potential sources of revenue for student aid initiatives. Several states noted that ways to leverage resources in order to attract more funding need to be found. As part of this process, higher education has an opportunity to demonstrate efficiencies, economies of scale, and increased accountability. In Arizona, statewide program initiatives were being undertaken in order to increase efficiency in the delivery of higher education courses. In Kansas and in Illinois, higher education leaders realized that academic programs might be reduced or eliminated when enrollment was consistently less than originally planned.
Communicate a clear and consistent message about access and affordability. Higher education officials in the selected states indicated that after developing financial access as a policy goal with a coherent plan for accomplishment, messages about the goal
were developed and communicated consistently and with wide dissemination. First, state leaders indicated that higher education needed to speak with a unified voice about student access and affordability. Those with strong private sectors suggested that involving the leadership of these institutions in planning and including their students in student aid programs united all of higher education in support of goals and budgets.
Second, the message should be taken to governmental leaders. In Texas, higher education used a number of easily remembered phrases, such as ‘We’re losing our competitive edge’ and ‘we’re lowering the quality of life in this state,’ to promote the plan. In Illinois, access and choice were articulated continuously, but “the message cannot be a one-year ‘shot’; the higher education agenda must be focused and consistent.” Higher education leaders in North Carolina and Texas also noted that the message about financial access to higher education was repeated “until they (the legislature) started using our language.”
Third, those interviewed indicated that messages need to reach a wide audience of potential supporters in state government but also business leaders, news editors, community leaders, and the general public. Financial access and affordability are major public policy issues and as such, these and other related issues such as tuition levels, mandatory fees, and availability of loans, need to be communicated to and discussed by the larger public.
In the development of a strategy for the accomplishment of policy goals such as financial access and affordability,
The message about financial access to higher education was repeated “until the legislature started using
our language.”
Recession, Retrenchment, and Recovery 44
successful states have a process for these goals to be made public and then achieved. An appropriate data set is developed along with credible analyses to support the message about financial access and affordability. Some officials suggested a wise investment was to use external consultants, such as demographers who can examine population trends specific to a state or region, as was done by higher education in at least three states. A Texas higher education leader noted that “We wanted the plan to be persuasive of the negative consequences that will occur if we don’t close the gaps (involving underachievers and low-income students).”
Select student aid options that meet state goals. In successful states, goals for a student financial aid program are articulated in clear and convincing language. In Texas and North Carolina, for instance, the goal is to help those in the lowest family income quartile with an expected family contribution (EFC) of less than $4000 per year, and Washington uses a percentage of median family income. Whether or not student aid based on merit is utilized is a decision that needs to be compatible with state policy goals. During the state visits for the Recession, Retrenchment, and Recovery Project, it was evident that state higher education leaders believed that merit aid should not supplant need-based student financial aid. Washington and Illinois phased out relatively small merit-based aid programs when additional funding was needed for need-based aid. A North Carolina higher education leader advised that “We preached need-based aid, not merit aid.” An income cap on eligibility requirements for a merit aid program was discussed as a policy option in states visited and in survey responses.
State leaders pointed out that there will be a number of decisions that need to be made about the structure and delivery of a state’s primary financial aid program. Few generalizations can be made that are applicable across all states because of the
unique circumstances of states’ history, political culture, higher education traditions, and student aid preferences. Such decisions about financial aid programs include the following:
• Should state grant programs be sector-specific or combined in a single primary program?
• Should the state financial aid agency be within or separate from the state higher education agency?
• Should administration of student financial aid programs be centralized, decentralized, or a hybrid of the two and, therefore, what is the role of campus-based administration of state student financial aid programs?
State leaders generally agreed that centralizing student financial aid at the state level helped them meet statewide goals. It was noted also that student financial aid programs tend to be created as the need and opportunity arise, resulting in multiple state programs, each with a different name, eligibility requirements, and application procedures. The result was frequently a confusing array of separate if not isolated student aid programs that are difficult to present to potential applicants in a clear and systematic fashion. States cited the difficulty in eliminating such programs without sunset provisions as they garner support from individual state legislators.
Focus on students. Interviewees advised that effects on students should be the major consideration in the development of changes in tuition and financial aid policy. A student financial aid program needs to be a fundamental building block of a statewide effort to increase student access to higher education. During the visits to the seven states, state leaders emphasized that low-income students (defined in different ways in different states) should not be affected disproportionately by increases in tuition and fees. This might mean that financially needy students should be held harmless from tuition increases, and this view was
Recession, Retrenchment, and Recovery 45
expressed by state higher education leaders in several states. Appropriate student groups, in fact, might be involved in state higher education forums that make decisions on financial aid policy and in discussions on increased tuition revenue spending, such as occurred in Kansas.
Consistent with a focus on students are outreach efforts to low-income, first-generation, minority, and special needs students. In Washington, a 529 College Savings Program is used to market opportunities for college. In Illinois, a Website (College Zone) provides information and facilitates students’ application for student financial aid. And, the College Foundation of North Carolina (www.CFNC.org) provides student-friendly information about college and allows students to develop portfolios for college admission. The site is widely marketed on billboards and other media and gets more “hits” from 8th graders than 12th graders. A Massachusetts higher education leader advised that “Provide enough aid to make a difference to needy students. The amount now going to them is so small it makes little difference.” Moreover, the concern is for these students in all institutions, not those only enrolled in public institutions. The same Massachusetts higher education leader emphasized that “We represent all low-income students; you have to be sure the legislature and policymakers understand we are for all students, not just those at state-supported institutions.”
Relationships
Productive relationships in and outside higher education are critically important to success State leaders were asked next about the structure of higher education in their states and what role that played in maintaining financial access. In addition, relationships among key policymakers and higher education leaders were identified and examined. Develop champions for higher education. In establishing a base of support for higher education, state leaders indicated it was imperative to reach outside the higher education community to enlist the support of the governor as well as legislative leaders. It was noted that credibility is established by higher education with state government leaders when higher education is accountable for promises made, and as credibility improves over time higher education is seen as more reliable. Leaders in Illinois, Texas, and Washington emphasized the need to support legislative staff with credible agenda-free analyses when called upon for information. The goal is for higher education to establish trusting, credible relationships in both executive and legislative branches of government as well as with the public. Leaders also sought to identify, develop, and grow champions for higher education among those who might not be that knowledgeable or experienced in higher education but who might be interested in what higher education has to offer. Student aid issues may present a unique opportunity for higher education to seek broad representation on task forces and study groups. While improving student aid may provide an immediate focus for external involvement, continued involvement in higher education by key citizens and state government officials is a valuable resource for higher education. Texas is one state that has put significant resources into student aid in recent years;
“We represent all low-income students; you have to be sure the
legislature and policymakers understand we are for all students, not just those at state-supported
institutions.”

Recession, Retrenchment, and Recovery 46
“the creation and funding of the Texas Grant Program was the result of three champions all of whom were elected officials,” noted one Texas public official. Several higher education leaders noted that there are times, however, when higher education may not incur the favor of an incoming governor, and during those years it may be difficult for higher education to establish a collaborative relationship with the governor and staff. During such times, higher education may be more successful working with legislative leaders than with the governor, and state higher education leaders can draw upon the support and leadership of influential college and university presidents. But, when an incoming governor has interest in higher education, there is an opportunity for higher education to establish a working relationship. When a central issue in higher education becomes a plank in the Governor’s platform, as occurred in Massachusetts, a unique opportunity is presented to higher education for collaboration.
The current Arizona Governor was previously the State Attorney General and in that capacity had a working relationship with higher education. Both Texas and Washington officials indicated that given the frequency of legislator turnover, especially in the house of representatives, higher education may be more successful working with majority members in the state senate if there is a lack of opportunity to work with the state’s top official. There are few state leaders, however, that can match the visibility and presence of a governor. Higher education must maximize every opportunity for collaboration. In turn, state government and political leaders can be involved in the contribution that higher education makes to the state’s economy and quality of life.
Commitment to financial access and affordability. As important as financial access and affordability were as goals, states noted that they also serve as values that are a core part of the higher education system. As values, they help provide a foundation for the system, and they underlie critically-important areas such as policies for tuition, fees, and student financial aid. A former public official in Washington State indicated that “our legislature and governor believe that an increase in tuition is equal to an increase in aid; it takes time and effort to build such a value.” Three of the seven states visited had Constitutional provisions related to financial access and affordability (North Carolina, Washington, and Arizona). The latter has a Constitutional provision “that the instruction furnished shall be as free as possible” (Arizona Constitution, Article 11, Section 6). State higher education policymakers indicated, however, that success in building a commitment to access and affordability is much easier to verbalize than actually accomplish.
It was evident that the seven states selected for interviews had strong leaders who were fully committed to higher education at the campus, system, and coordinating/ governing board level. Policymakers indicated that higher education is viewed by those both inside and outside the higher education system as being a vital part of the state’s economy and a critical component in the state’s participation in the global economy. Arizona and other state higher education policymakers pointed out that not only does higher education serve the state by providing education services, but also strong higher educational institutions
“…our legislature and governor believe that an increase in tuition is equal to an increase in aid; it takes time and
effort to build such a value.”
Recession, Retrenchment, and Recovery 47
attract academically well-prepared students who, if they remain in the state, can add significantly to the state’s economy and quality of life. Colleges and universities, including community colleges, are vital means to widening opportunities, both educational and economic, to low-income students and minorities. Perhaps most important, higher education fosters financial access as a basic part of the state’s culture, pride, ethos, and “how we think about ourselves,” as noted by a North Carolina observer.
Opportunities for coordination and collaboration. These seven states included states having coordinating boards (IL, MA, TX, WA) as well as states with governing boards (AZ, KS, NC). In some states, higher education board members were focused on broad issues of policy and fundamental direction, not details of administration and implementation. It was also clear that these were highly committed, experienced leaders who worked hard to establish positive relationships with institutional leaders and endeavored to create positive working relationships with governors, state legislators, and their staffs. Positive collaborative relationships crossed political party lines and were not characteristic of one political party. In one state, years of Republican control of the statehouse gave way to a Democrat Governor who had not had a positive, collaborative working relationship with higher education to the detriment of public universities, community colleges, and the student financial aid agency. In another state, a conservative Republican house cut funding for financial aid dramatically. In other states, positive relationships were created with governors of both political parties and with state legislators.
The more than 50 higher education and other leaders interviewed as part of this Project said, with few exceptions, that higher education needs to speak with a unified voice especially in forums outside higher education. Divisiveness seldom
results in success for higher education. There are many individual examples to support this belief, including the following:
• State higher education officials meeting with the Governor’s Cabinet regularly (NC,MA)
• Strong leadership by the flagship CEO
(IL,KA,TX,WA) [it is possible for flagship universities to play a strong leadership role in increasing the focus on student access.]
• Policymakers (higher education and
state government) working together (AZ,IL,KS)
• Higher education reaching out to
collaborate with the business community (MA, WA,TX)
None of these activities, necessarily by themselves, are synonymous with the principle of “higher education speaking with a unified voice,” but they are indicative of activities that tend to support such collaborative activity. A Massachusetts fiscal officer reflected on the importance of state higher education leaders reaching out to private colleges and universities; “Private institutions have a stake in the higher education budget.” In the absence of these kinds of activities, it will become more difficult for higher education to speak with one voice, especially in the public forums of the executive and legislative branches. What tends to happen as the result of collaboration between higher education and state government leaders are opportunities for increasing efficiency, effectiveness, and productivity. An example is the opportunity higher education may have to trade dollars for autonomy by increasing the flexibility given to higher education for budgetary and administrative processes at a time when additional dollars for higher education may not be forthcoming because of lack of resources in state budgets.
Recession, Retrenchment, and Recovery 48
One area of concern that emerged from state visits pertained to community colleges. In several states, community colleges had not been brought to the table for open discussion on matters of interest to both community colleges and four-year universities. In serving the state’s citizens and increasing opportunities for students to enroll in higher education, community colleges play a critical role. The interest of four-year institutions in community colleges needs to go beyond matters involving only baccalaureate transfer programs. Whether or not community colleges are part of the state higher education agency or have a separate board, leaders in Illinois, Washington, and Kansas indicated that they need to become full partners in defining higher education issues, particularly on access and affordability, in which all higher education sectors have a stake. Kansas leaders pointed to numerous examples of where community college participation is integral:
• Transfer of students from community colleges (all programs, not just baccalaureate transfer two-year programs) to four-year institutions
• Formulating articulation agreements
between community colleges and public universities
• Examining trends in high school
graduation rates • Improving preparation for college
among high schools • Identifying early college opportunities
such as dual enrollment and summer programs
Challenges Future challenges to higher education systems in achieving success in financial access to college State leaders were asked about emerging concerns and problems that likely would pose future challenges in achieving and improving financial access to college. One set of issues was mentioned in all states, and the other included issues emphasized in certain states. Financial access issues in all states. There were four issues of financial access that were mentioned as emerging major challenges by virtually all states. The predominant issue was the rapid growth and size of the Hispanic population. This issue ranged from crisis proportions in Arizona and Texas, the two border states among the seven states visited, to an issue of importance in the other states, as are concerns involving other minority populations.
There were three other major challenges that virtually all seven states are dealing with: financial and geographic access, the tuition-financial aid balance, and competition for scarce resources.
It was universally agreed that there was a need to maximize college opportunity for low-income students, and in recent years this issue has become much more involved than only providing resources for need-based grants although financial aid is still key. Efforts to increase college enrollment rates and success have included outreach programs and middle schools initiatives such as the Federal GEAR UP Program. Two states also specifically cited Indiana’s 21st Century Scholars Program as a model to encourage college preparation and participation for low-income middle school students,
Related to financial access is the issue of the balance between tuition and student financial aid. As tuition increases, the cost to students increases unless student aid
Recession, Retrenchment, and Recovery 49
levels are raised enough to close the increasing gap in unmet need. During the state visits, states increasingly cited the issue of tuition-aid balance, and several indicated that tuition set-asides were now being implemented. In all cases, however, the set-aside was awarded by the institution and based on financial need.
The fourth “universal” issue affecting all seven states visited is the competition for scarce resources among major areas of state government spending. Until 1991, higher education was the 2nd largest area of state government expenditure, 2nd only to spending for K-12 public schools. In 1991, health care surpassed higher education as a major expenditure. Following public schools, health care, and higher education, other major expenditures are spending for welfare (aid to families with dependent children) and corrections and some would add homeland security. Another unique quality of higher education, as an item of state government spending, is its discretionary nature, unlike the other areas which are mandated (required) expenditures by state law. While spending levels can be changed by rewriting the enabling legislation, it is easier to reduce expenditure levels to an area like higher education which is discretionary. Beginning in the 1990’s a number of states began reducing higher education budgets in order to free up resources for other areas of mandated spending within state government. This combination of competition for resources along with discretionary spending has created problems for continuity of higher education budgets.
Financial access issues affecting particular states. There were three other sets of issues mentioned in some but not all states. First, there were financial access issues such as guaranteed tuition and the debt burden for students because of over reliance on loans as a source of revenue for college. Guaranteed tuition is an assurance that the tuition price paid by incoming first-year students
will remain at that level until graduation. While this policy, a statutory requirement, has been used by public universities in Illinois, detractors would say that it makes institutional planning more difficult because of the inability to predict operating cost increases for the next four years and for tuition to increase significantly from one freshman class to another. Since substantial tuition increases began in the late 1980s in public higher education, students have increasingly turned to loans in order to finance their college education. The amount of student loans, both as an average and collectively, has grown rapidly and the national media, public policy researchers, and higher education leaders in some of the states visited cited student indebtedness as a serious concern with the potential to affect the national economy on a long-term basis.
A second set of issues focused on conditions in some states, both fiscal and political, that may result in higher education being in a disadvantaged position. There is the competition for scarce resources mentioned earlier, and in combination with the discretionary nature of higher education funding a difficult situation can be created for college and university leaders. There are structural deficits in a number of states that make fiscal conditions especially challenging for higher education, should a future recession occur. And, in some states a conservative political climate exists that may result in the desire to elevate reducing taxes to a higher priority than spending for higher education because this is judged as more attractive to voters.
A third area of concern in some states involved community colleges. The issues included transfer and articulation, and whether or not community colleges should offer baccalaureate degrees. In Arizona, Illinois, and Kansas, as well as in other states, community college transfer and articulation between community college and university academic programs has become a major issue.
Recession, Retrenchment, and Recovery 50
A related issue is baccalaureate completion or “time to degree” concerns. Another aspect related to baccalaureate completion involves the possibility of community colleges offering bachelor’s degrees. This is a public policy issue that has become visible in some states, including Arizona and Illinois.
Concluding Observations
Seven states were selected for in-depth study because they had maintained long-term financial access through the four recessions during the period studied, or they had protected financial access better than others in the two-year period following the 2001 recession. Despite their relative success, all seven states continued to be concerned about maintaining access. Some reported that they had lost ground between 2003 (last year of the data for the indicators used in selection) and 2006 when the interviews were conducted. Others indicated that the balance between tuition and need-based aid had improved since 2003 but none of the states’ policy leaders believed they were doing as well as they should and none claimed that their state had a perfect program or magic formula for assuring financial access.
The higher education leaders interviewed had remarkably similar stories to tell about what they believed had made a difference in their states. The similarity in their accounts pertained to the importance of strong higher education leadership at the state and institutional level including the state higher education board and the flagship president as well as state government leaders who champion and support higher education; the value of a plan that includes defined goals and a budget linked with policy goals; and a clear message about access and affordability. One higher education leader emphasized communication, collaboration, and credibility as the keys to success.
Despite the similarity across these states, there was a fundamental difference between states that had chosen the low tuition/modest aid approach to ensuring financial access to higher education and those states with higher tuition (whether moderate or high) that had attempted to provide financial access through need-based student financial aid. States with historically low tuition in the public sector tended to have modest or even inadequate student financial aid programs. These states recognize that in the current fiscally stringent environment financial access cannot be assured through only low public sector tuition with little or no aid.
On the other hand, states with relatively high tuition in the public sector are likely to find it impossible to reduce tuition and will need strong financial aid programs to support their low-income students. Sometimes in states with large financial aid programs, communication about eligibility requirements and program benefits is lacking to the general public. In other cases, consolidation of existing minor programs and providing easily understood instructions about application procedures for aid programs are needed.
The four issues, termed “universal” issues, of financial access were common to all seven states. They included the following:
• Needs of Hispanic students, both financial and preparation for college, in virtually all seven states.
• Barriers to college attendance for many students are both financial and geographic; financial need is exacerbated by low-income, poverty, and inadequate academic preparation for college – geographic barriers include residence and institutional issues that act to prevent students otherwise anxious to attend college from being able to do so, such as home location, transportation to a facility where college instruction is given (including distance education),
Recession, Retrenchment, and Recovery 51
and hours when classes and academic advising are available.
• The need to balance tuition with need-based financial aid in order to encourage college attendance by low-income students.
• Competition for scarce resources that places higher education at a disadvantage because of its fundamental discretionary nature.
Recession, Retrenchment, and Recovery 52
Chapter 4 Recovery and Beyond: Strategies for Maintaining Financial Access
The national recession of 2001 lasted only a few months but, like the recessions of the 1980s and 1990s, it affected states’ economies and appropriations to higher education for years. A particular concern for higher education policy makers is the impact of recessions on financial access—the balance of state financial aid and tuition and fees—for students attending public institutions.
The Recession, Retrenchment, and Recovery Project examined the effects of recessions on financial access to college over a 25-year period and surveyed states about the effects of the 2001 recession. States from each region that had been relatively successful in maintaining financial access were selected and policy strategies used by these states were identified through interviews with policy leaders. Based on the project results, the following recommendations are suggested:
1. Develop strategies for maintaining financial access for students through recessions.
National recessions are inevitable and their effect on financial access for students is predictable. Analysis of 25-year trends in state higher education appropriations demonstrated that there are positive relationships between the national economy and the economies of states and the strength of a state’s economy and higher education appropriations. Between 1979 and 2003, higher education appropriations did not keep pace with economic growth in any state.
Higher education funding and financial access for students declined in many states following each of the four recessions between 1979 and 2004. Three
of the last four recessions negatively affected funding for higher education and in each successive decade recessions affected more states, declines were larger, and recovery longer. Therefore, it is critical that states develop strategies to protect student access during the next recession.
2. Balance tuition increases with need-based student financial aid.
Following recessions, tuition tends to increase faster than student aid and family income. States need to continually balance tuition levels with the availability of student aid in order to maintain financial access.
Given the significant tuition increases that occurred following the 2001 recession, need-based student financial aid has become a necessary and vital part of a state’s higher education system. Maintaining low or moderate tuition in public institutions alone does not offer sufficient financial access. Student financial aid, particularly need-based aid, is necessary in all states.
3. Explore new student aid financing strategies.
Dedicated revenue sources—lottery revenues, state special purpose funds, 529 plans, and Federal Family Education Loan Program operating funds—were cited as options to shore up state need-based aid and assure continuing support. In addition, states have either eliminated, consolidated, or down-sized programs based on merit as well as other non-need aid programs. However, states reporting “rainy day” funding options including the ability to carry forward portions of appropriations to subsequent years or transfer funds from one program to another, did not necessarily fare better in
Recession, Retrenchment, and Recovery 53
balancing financial access from year to year. Rather, this approach appeared to be a strategy designed to assist with annual fiscal management and spend-down of program funds.
4. Reaffirm the state’s role in providing student financial aid.
Significant tuition increases that occur during recessionary periods have not been offset by state need-based aid funding in most states particularly since FY2001. As a result, two activities are occurring; institutions are unilaterally providing additional student aid from increased tuition revenues and other sources, and, state tuition set-asides are being implemented. In both cases, the responsibility to support low-income students at public institutions has been transferred from taxpayers to tuition payers. State policymakers need to determine if these funding approaches meet their access, choice, and completion goals for low-income students.
5. Define goals and develop a coherent plan for maintaining and improving financial access for students.
States achieving success in financial access to college define goals for financial access and develop a plan that is coherent, clear, and made visible to a wide audience in and outside higher education.
6. Present a clear and consistent message about the importance of financial access.
States that are successful in financial access to college articulate a message and develop a strategy (sometimes using consultants) focused on the goal of financial access to college for students, broadly dispersed to leaders and constituents, using language that is easily understood, consistent, and frequently reiterated.
7. Design student aid programs to meet state access goals.
Successful states use student aid options that meet state goals and delivery systems (state-based, institution-based, centralized, and decentralized) that help achieve state goals.
8. Foster and support higher education leadership.
States that have made progress in financial access for students have strong higher education leaders who have successfully mobilized support for access and affordability, reached out to state leaders who are champions for higher education, and provided leadership to enable higher education to become integral to state government and the well-being of the state’s citizens. It is worth noting that both structure and governance arrangements are not, in themselves, preconditions for success in improving financial access; what is vital, however, are the relationships established by higher education with other leaders that are built on trust, mutual respect, and common interest.
9. Make a commitment to access and affordability.
State leaders placed very high value on the development of a climate for higher education that includes a commitment to and high value on access and affordability.
10. Focus on students.
In developing an agenda for access and affordability, leaders tended to focus on students and advocate for them, but also involve students in decisions made on student financial aid.
11. Develop champions for higher education.
State leaders sought and maximized opportunities for collaboration and coordination at every opportunity, working with presidents in all sectors to speak with a unified voice, developing champions among state government and business leaders, seeking to identify and develop
Recession, Retrenchment, and Recovery 54
new champions for higher education among state and public leaders, and working across party lines for the good of higher education.
12. Improve awareness of higher education’s contributions to economic development.
State leaders cited the lack of awareness of the significant contribution of higher education to states’ economic development goals through workforce preparation and the importance of support for higher education and student aid in achieving these goals. Some states used demographers to present data describing the education pipeline and resulting economic impact if state opportunities for vocational or higher education are inadequate. Governmental leaders tend to be more open to seeing higher education’s role in economic development during times of recession.
13. Anticipate and address emerging issues.
Four financial access issues face all states visited and also emerged in a significant number of those surveyed. These issues of meeting the needs of the Hispanic population, providing financial and geographic access, achieving tuition-financial aid balance, and minimizing or at least reducing resource competition are among those issues where solutions likely cross state boundaries, political party lines, and sector concerns (K-12 public schools, community colleges, universities). Their solution could benefit from sector collaboration rather than competition or isolation, a study of best practices that are working in other states (where organizations such as SHEEO and NASSGAP might play a critical coordinating and disseminating role), and continued study by appropriate research organizations and public policy centers.
14. Emphasize collaboration, communication, and credibility.
In addition to the planning, administrative and policy activities of individual higher
education agencies and institutions, it is critically important that their leaders seek every opportunity to collaborate with all state higher education agencies and institutions, with governmental leaders, and with private sector business and industry. It is critical that the messages and activities all be highly credible in order to achieve success in protecting student access in times of recession. In addition, plans and activities should successfully communicate the priority of student access to the higher education community, governmental leaders and the lay public.

Recession, Retrenchment, and Recovery 55
Recession, Retrenchment, and Recovery 56
References and Bibliography Arnone, Michael. August 15, 2003. Students face another year of big tuition increases in many states. The Chronicle of Higher Education. Breneman, David W. (2002, June 14). For colleges, this is not just another recession. The Chronicle of Higher Education. Breneman, David W. April 25, 2003. Why a public college wants to send in-state tuition soaring. The Chronicle of Higher Education. Burd, Stephen. May 2, 2003. High stakes on tuition. The Chronicle of Higher Education. Callan, Patrick M. February 2002. Coping with Recession. National Center for Public Policy and Higher Education. San Jose, CA Finney, Joni E. and Kelly, Patrick J. Jul/Aug 2004. Affordability. Change, Vol. 36. Gold, Steven D. 1995. The Fiscal Crisis of the States. Washington, D.C., Georgetown University Press. Hebel, Sara. September 9, 2003. Colleges debate ways to vary tuition among students and increase revenue. The Chronicle of Higher Education. Heller, Donald E. Fall 2004. A bold proposal. National Crosstalk. Heller, Donald E. (2003, January). State Financial Aid and College Access, National Dialogue on Student Financial Aid Hovey, Harold A. July 1999. State Spending for Higher Education in the Next Decade. National Center for Public Policy and Higher Education. San Jose, CA. Jacobson, Jennifer. September 19, 2003. Students sue states over tuition increases but face an uphill battle. The Chronicle of Higher Education. Kliesen, Kevin L. and Thornton, Daniel L. Does a Mild Recession Imply a Weak Recovery? National Economic Trends, April 2002 Lingenfelter, Paul. 2004. The national higher education scene. Presentation at the Symposium on Financing Higher Education. Normal, IL: Illinois State University, Center for the Study of Education Policy. National Center for Educational Statistics. 2004. A Decade of Undergraduate Student Aid: 1989-90 to 1999-2000. Reports on National Postsecondary Student Aid Studies (NPSAS) data to look at changes in student aid by school type.
Recession, Retrenchment, and Recovery 57
National Center for Public Policy and Higher Education. 2002. Losing Ground. A National Status Report on the Affordability of American Higher Education. San Jose, CA. National Center for Public Policy and Higher Education. 2004. College Affordability in Jeopardy. A summary of state higher education appropriations, tuition and fees, and per capita personal income for FY2002 and FY2003. ----------. February 2003. Public college tuition soars, higher education appropriations plummet. Center News. San Jose, CA. National Roundtable. Summer 1998. A very public agenda. National Crosstalk. Palmer, James C. 2004. State appropriations for higher education, 2004-05. The Chronicle of Higher Education, December 17. Peterson, Peter G. 2004. Running on Empty. New York: Farrar, Straus & Giroux. State Higher Education Executive Officers. 2004. State Higher Education Finance FY 2003. Denver. State Higher Education Executive Officers. 2005. State Higher Education Finance FY 2004. Denver. State Higher Education Appropriations (year). Annually from 1962 through 1990. Washington: D.C. National Association of State Universities and Land-Grant Colleges. Continued under the same title. Annually from 1991 through 1998. State Higher Education Executive Officers, Denver. Continued as www.coe.ilstu.edu/grapevine. Wellman, Jane (2002). Accounting for State Student Aid: How State Policy and Student Aid Connect. The Institute for Higher Education. Young, Jeffrey R. November 1, 2002. Public-college tuition jumps at highest rate in 10 years. The Chronicle of Higher Education.
Recession, Retrenchment, and Recovery 58
Appendix 1 Tables
Table A: State Appropriations for Higher Education per FTE, Percent Change in Two-Year Post-Recession Periods and Year of Recovery Table B, Aid-to-Tuition Ratio 1979, 2004, Average, Percent Change and Rank among States Table C: Aid-to-Tuition Ratio, Percent Changes in Two-year Post Recession Periods and Year of Recovery Table D: Access-Cost Indicator, 1979, 2004, Average, Percent Change and Rank among States Table E: Access-Cost Indicator, Percent Changes in Two-year Post Recession Periods and Year of Recovery

Recession, Retrenchment, and Recovery 59
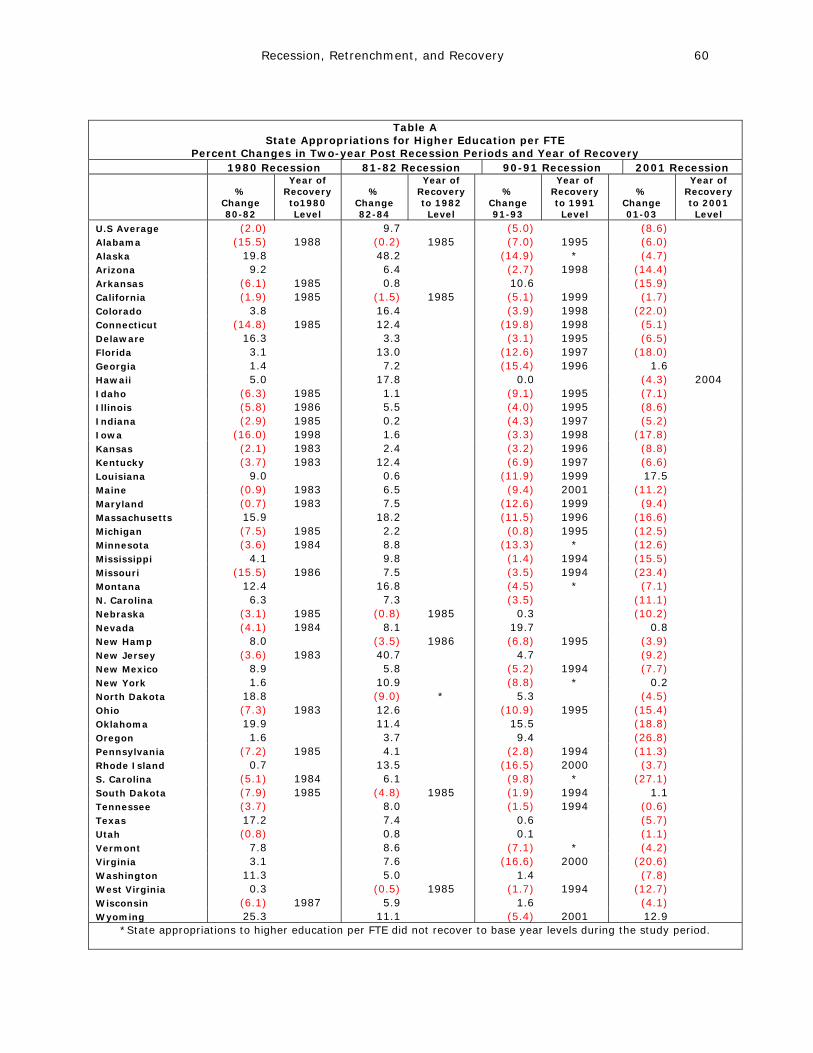
Recession, Retrenchment, and Recovery 60
Table A
State Appropriations for Higher Education per FTE Percent Changes in Two-year Post Recession Periods and Year of Recovery
1980 Recession 81-82 Recession 90-91 Recession 2001 Recession
% Change 80-82
Year of Recovery to1980 Level
% Change 82-84
Year of Recovery to 1982 Level
% Change 91-93
Year of Recovery to 1991 Level
% Change 01-03
Year of Recovery to 2001 Level
U.S Average (2.0) 9.7 (5.0) (8.6) Alabama (15.5) 1988 (0.2) 1985 (7.0) 1995 (6.0) Alaska 19.8 48.2 (14.9) * (4.7) Arizona 9.2 6.4 (2.7) 1998 (14.4) Arkansas (6.1) 1985 0.8 10.6 (15.9) California (1.9) 1985 (1.5) 1985 (5.1) 1999 (1.7) Colorado 3.8 16.4 (3.9) 1998 (22.0) Connecticut (14.8) 1985 12.4 (19.8) 1998 (5.1) Delaware 16.3 3.3 (3.1) 1995 (6.5) Florida 3.1 13.0 (12.6) 1997 (18.0) Georgia 1.4 7.2 (15.4) 1996 1.6 Hawaii 5.0 17.8 0.0 (4.3) 2004 Idaho (6.3) 1985 1.1 (9.1) 1995 (7.1) Illinois (5.8) 1986 5.5 (4.0) 1995 (8.6) Indiana (2.9) 1985 0.2 (4.3) 1997 (5.2) Iowa (16.0) 1998 1.6 (3.3) 1998 (17.8) Kansas (2.1) 1983 2.4 (3.2) 1996 (8.8) Kentucky (3.7) 1983 12.4 (6.9) 1997 (6.6) Louisiana 9.0 0.6 (11.9) 1999 17.5 Maine (0.9) 1983 6.5 (9.4) 2001 (11.2) Maryland (0.7) 1983 7.5 (12.6) 1999 (9.4) Massachusetts 15.9 18.2 (11.5) 1996 (16.6) Michigan (7.5) 1985 2.2 (0.8) 1995 (12.5) Minnesota (3.6) 1984 8.8 (13.3) * (12.6) Mississippi 4.1 9.8 (1.4) 1994 (15.5) Missouri (15.5) 1986 7.5 (3.5) 1994 (23.4) Montana 12.4 16.8 (4.5) * (7.1) N. Carolina 6.3 7.3 (3.5) (11.1) Nebraska (3.1) 1985 (0.8) 1985 0.3 (10.2) Nevada (4.1) 1984 8.1 19.7 0.8 New Hamp 8.0 (3.5) 1986 (6.8) 1995 (3.9) New Jersey (3.6) 1983 40.7 4.7 (9.2) New Mexico 8.9 5.8 (5.2) 1994 (7.7) New York 1.6 10.9 (8.8) * 0.2 North Dakota 18.8 (9.0) * 5.3 (4.5) Ohio (7.3) 1983 12.6 (10.9) 1995 (15.4) Oklahoma 19.9 11.4 15.5 (18.8) Oregon 1.6 3.7 9.4 (26.8) Pennsylvania (7.2) 1985 4.1 (2.8) 1994 (11.3) Rhode Island 0.7 13.5 (16.5) 2000 (3.7) S. Carolina (5.1) 1984 6.1 (9.8) * (27.1) South Dakota (7.9) 1985 (4.8) 1985 (1.9) 1994 1.1 Tennessee (3.7) 8.0 (1.5) 1994 (0.6) Texas 17.2 7.4 0.6 (5.7) Utah (0.8) 0.8 0.1 (1.1) Vermont 7.8 8.6 (7.1) * (4.2) Virginia 3.1 7.6 (16.6) 2000 (20.6) Washington 11.3 5.0 1.4 (7.8) West Virginia 0.3 (0.5) 1985 (1.7) 1994 (12.7) Wisconsin (6.1) 1987 5.9 1.6 (4.1) Wyoming 25.3 11.1 (5.4) 2001 12.9
*State appropriations to higher education per FTE did not recover to base year levels during the study period.
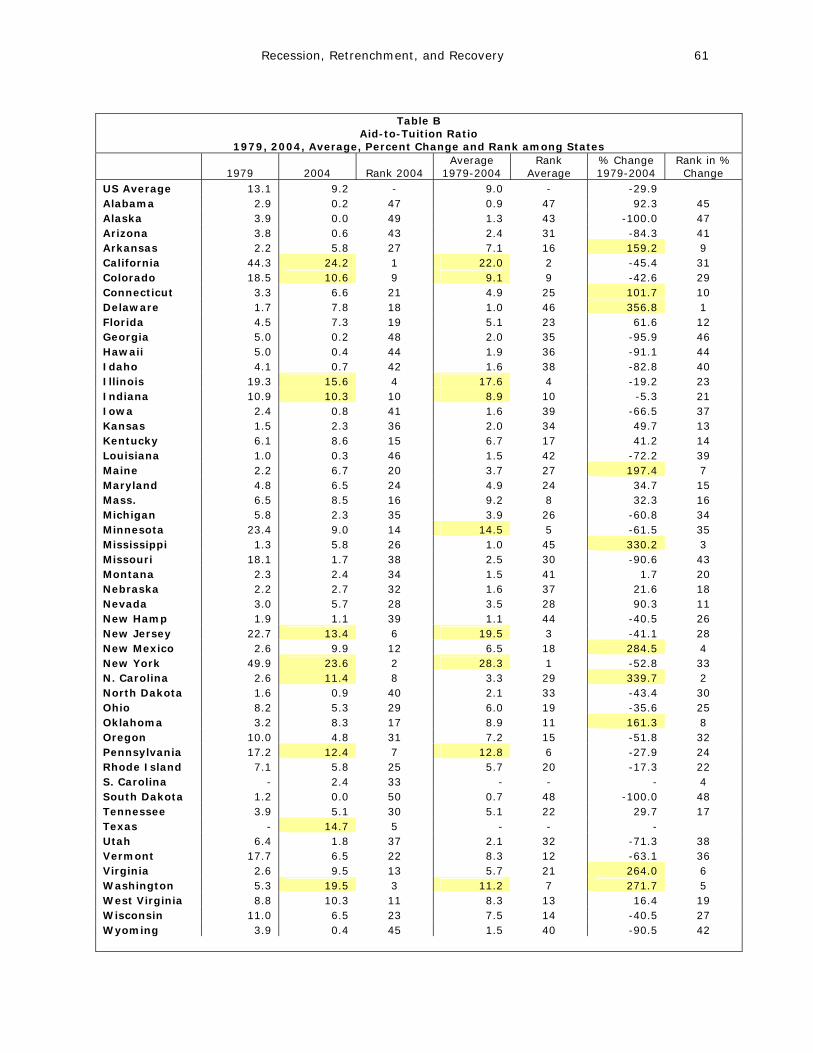
Recession, Retrenchment, and Recovery 61
Table B
Aid-to-Tuition Ratio 1979, 2004, Average, Percent Change and Rank among States
1979 2004 Rank 2004
Average 1979-2004
Rank Average
% Change 1979-2004
Rank in % Change
US Average 13.1 9.2 - 9.0 - -29.9 Alabama 2.9 0.2 47 0.9 47 92.3 45 Alaska 3.9 0.0 49 1.3 43 -100.0 47 Arizona 3.8 0.6 43 2.4 31 -84.3 41 Arkansas 2.2 5.8 27 7.1 16 159.2 9 California 44.3 24.2 1 22.0 2 -45.4 31 Colorado 18.5 10.6 9 9.1 9 -42.6 29 Connecticut 3.3 6.6 21 4.9 25 101.7 10 Delaware 1.7 7.8 18 1.0 46 356.8 1 Florida 4.5 7.3 19 5.1 23 61.6 12 Georgia 5.0 0.2 48 2.0 35 -95.9 46 Hawaii 5.0 0.4 44 1.9 36 -91.1 44 Idaho 4.1 0.7 42 1.6 38 -82.8 40 Illinois 19.3 15.6 4 17.6 4 -19.2 23 Indiana 10.9 10.3 10 8.9 10 -5.3 21 Iowa 2.4 0.8 41 1.6 39 -66.5 37 Kansas 1.5 2.3 36 2.0 34 49.7 13 Kentucky 6.1 8.6 15 6.7 17 41.2 14 Louisiana 1.0 0.3 46 1.5 42 -72.2 39 Maine 2.2 6.7 20 3.7 27 197.4 7 Maryland 4.8 6.5 24 4.9 24 34.7 15 Mass. 6.5 8.5 16 9.2 8 32.3 16 Michigan 5.8 2.3 35 3.9 26 -60.8 34 Minnesota 23.4 9.0 14 14.5 5 -61.5 35 Mississippi 1.3 5.8 26 1.0 45 330.2 3 Missouri 18.1 1.7 38 2.5 30 -90.6 43 Montana 2.3 2.4 34 1.5 41 1.7 20 Nebraska 2.2 2.7 32 1.6 37 21.6 18 Nevada 3.0 5.7 28 3.5 28 90.3 11 New Hamp 1.9 1.1 39 1.1 44 -40.5 26 New Jersey 22.7 13.4 6 19.5 3 -41.1 28 New Mexico 2.6 9.9 12 6.5 18 284.5 4 New York 49.9 23.6 2 28.3 1 -52.8 33 N. Carolina 2.6 11.4 8 3.3 29 339.7 2 North Dakota 1.6 0.9 40 2.1 33 -43.4 30 Ohio 8.2 5.3 29 6.0 19 -35.6 25 Oklahoma 3.2 8.3 17 8.9 11 161.3 8 Oregon 10.0 4.8 31 7.2 15 -51.8 32 Pennsylvania 17.2 12.4 7 12.8 6 -27.9 24 Rhode Island 7.1 5.8 25 5.7 20 -17.3 22 S. Carolina - 2.4 33 - - - 4 South Dakota 1.2 0.0 50 0.7 48 -100.0 48 Tennessee 3.9 5.1 30 5.1 22 29.7 17 Texas - 14.7 5 - - - Utah 6.4 1.8 37 2.1 32 -71.3 38 Vermont 17.7 6.5 22 8.3 12 -63.1 36 Virginia 2.6 9.5 13 5.7 21 264.0 6 Washington 5.3 19.5 3 11.2 7 271.7 5 West Virginia 8.8 10.3 11 8.3 13 16.4 19 Wisconsin 11.0 6.5 23 7.5 14 -40.5 27 Wyoming 3.9 0.4 45 1.5 40 -90.5 42
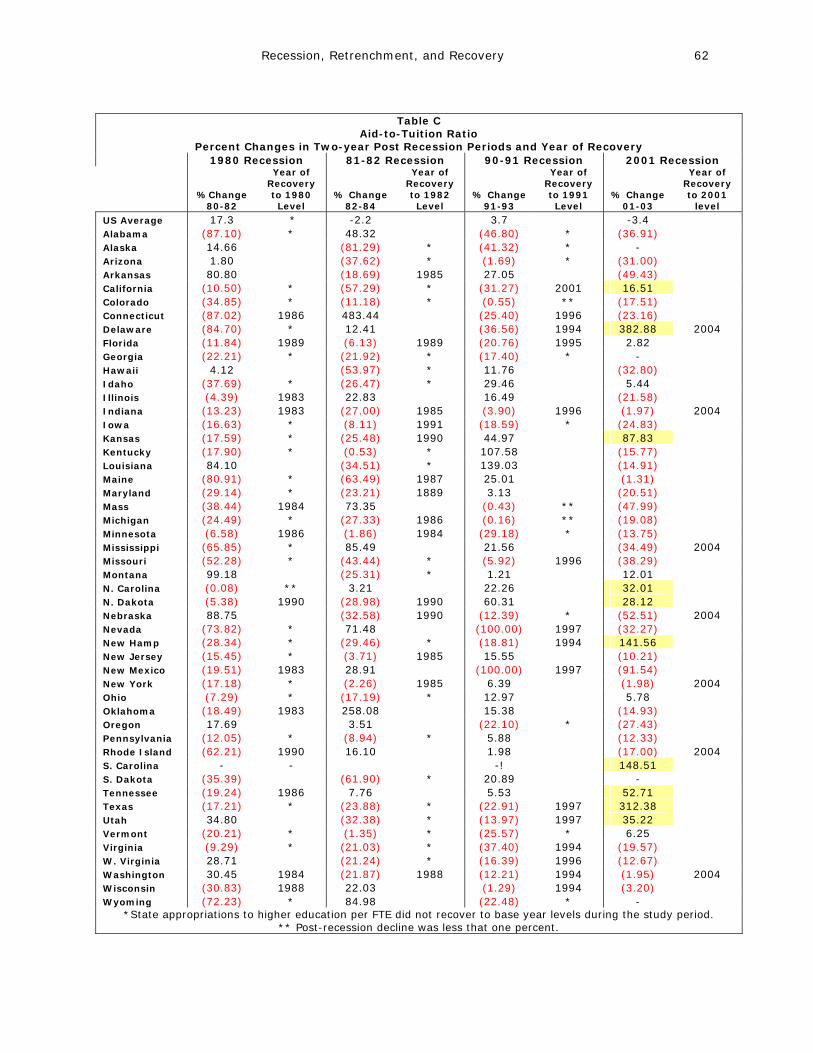
Recession, Retrenchment, and Recovery 62
Table C
Aid-to-Tuition Ratio Percent Changes in Two-year Post Recession Periods and Year of Recovery
1980 Recession 81-82 Recession 90-91 Recession 2001 Recession
%Change
80-82
Year of Recovery to 1980 Level
% Change 82-84
Year of Recovery to 1982 Level
% Change 91-93
Year of Recovery to 1991 Level
% Change 01-03
Year of Recovery to 2001
level
US Average 17.3 * -2.2 3.7 -3.4 Alabama (87.10) * 48.32 (46.80) * (36.91) Alaska 14.66 (81.29) * (41.32) * - Arizona 1.80 (37.62) * (1.69) * (31.00) Arkansas 80.80 (18.69) 1985 27.05 (49.43) California (10.50) * (57.29) * (31.27) 2001 16.51 Colorado (34.85) * (11.18) * (0.55) ** (17.51) Connecticut (87.02) 1986 483.44 (25.40) 1996 (23.16) Delaware (84.70) * 12.41 (36.56) 1994 382.88 2004 Florida (11.84) 1989 (6.13) 1989 (20.76) 1995 2.82 Georgia (22.21) * (21.92) * (17.40) * - Hawaii 4.12 (53.97) * 11.76 (32.80) Idaho (37.69) * (26.47) * 29.46 5.44 Illinois (4.39) 1983 22.83 16.49 (21.58) Indiana (13.23) 1983 (27.00) 1985 (3.90) 1996 (1.97) 2004 Iowa (16.63) * (8.11) 1991 (18.59) * (24.83) Kansas (17.59) * (25.48) 1990 44.97 87.83 Kentucky (17.90) * (0.53) * 107.58 (15.77) Louisiana 84.10 (34.51) * 139.03 (14.91) Maine (80.91) * (63.49) 1987 25.01 (1.31) Maryland (29.14) * (23.21) 1889 3.13 (20.51) Mass (38.44) 1984 73.35 (0.43) ** (47.99) Michigan (24.49) * (27.33) 1986 (0.16) ** (19.08) Minnesota (6.58) 1986 (1.86) 1984 (29.18) * (13.75) Mississippi (65.85) * 85.49 21.56 (34.49) 2004 Missouri (52.28) * (43.44) * (5.92) 1996 (38.29) Montana 99.18 (25.31) * 1.21 12.01 N. Carolina (0.08) ** 3.21 22.26 32.01 N. Dakota (5.38) 1990 (28.98) 1990 60.31 28.12 Nebraska 88.75 (32.58) 1990 (12.39) * (52.51) 2004 Nevada (73.82) * 71.48 (100.00) 1997 (32.27) New Hamp (28.34) * (29.46) * (18.81) 1994 141.56 New Jersey (15.45) * (3.71) 1985 15.55 (10.21) New Mexico (19.51) 1983 28.91 (100.00) 1997 (91.54) New York (17.18) * (2.26) 1985 6.39 (1.98) 2004 Ohio (7.29) * (17.19) * 12.97 5.78 Oklahoma (18.49) 1983 258.08 15.38 (14.93) Oregon 17.69 3.51 (22.10) * (27.43) Pennsylvania (12.05) * (8.94) * 5.88 (12.33) Rhode Island (62.21) 1990 16.10 1.98 (17.00) 2004 S. Carolina - - -! 148.51 S. Dakota (35.39) (61.90) * 20.89 - Tennessee (19.24) 1986 7.76 5.53 52.71 Texas (17.21) * (23.88) * (22.91) 1997 312.38 Utah 34.80 (32.38) * (13.97) 1997 35.22 Vermont (20.21) * (1.35) * (25.57) * 6.25 Virginia (9.29) * (21.03) * (37.40) 1994 (19.57) W. Virginia 28.71 (21.24) * (16.39) 1996 (12.67) Washington 30.45 1984 (21.87) 1988 (12.21) 1994 (1.95) 2004 Wisconsin (30.83) 1988 22.03 (1.29) 1994 (3.20) Wyoming (72.23) * 84.98 (22.48) * -
*State appropriations to higher education per FTE did not recover to base year levels during the study period. ** Post-recession decline was less that one percent.
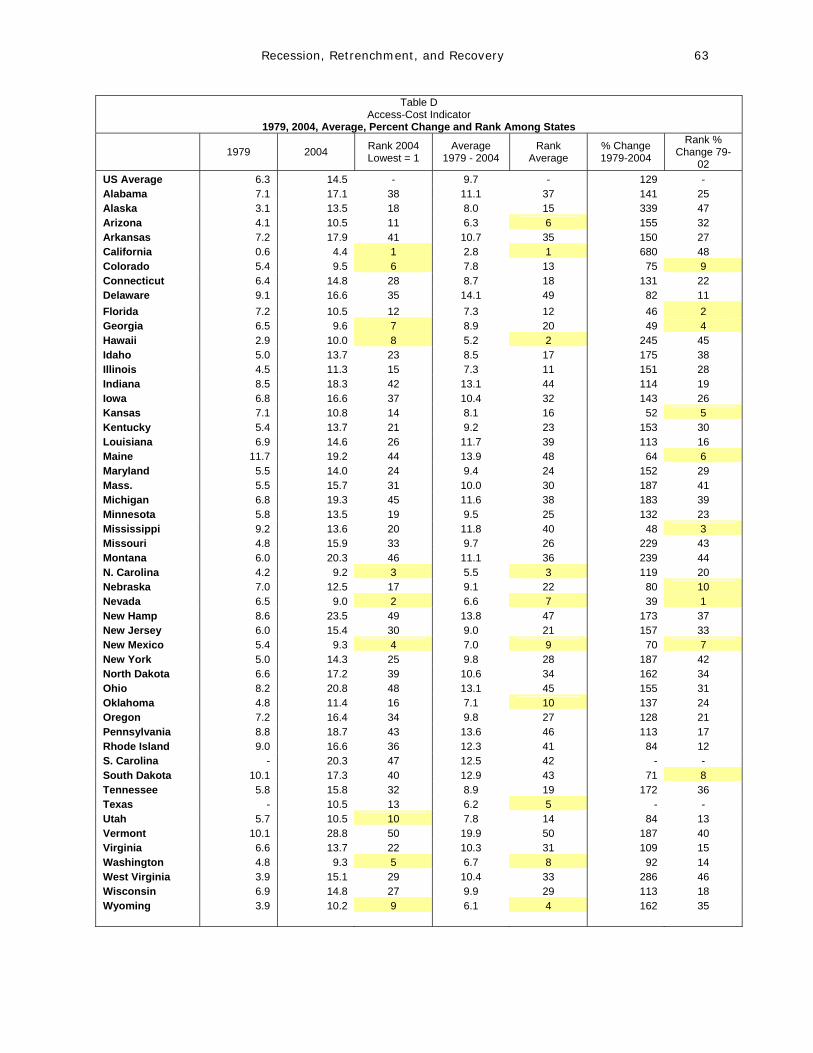
Recession, Retrenchment, and Recovery 63
Table D Access-Cost Indicator
1979, 2004, Average, Percent Change and Rank Among States
1979 2004 Rank 2004 Lowest = 1
Average 1979 - 2004
Rank Average
% Change 1979-2004
Rank % Change 79-
02 US Average 6.3 14.5 - 9.7 - 129 - Alabama 7.1 17.1 38 11.1 37 141 25 Alaska 3.1 13.5 18 8.0 15 339 47 Arizona 4.1 10.5 11 6.3 6 155 32 Arkansas 7.2 17.9 41 10.7 35 150 27 California 0.6 4.4 1 2.8 1 680 48 Colorado 5.4 9.5 6 7.8 13 75 9 Connecticut 6.4 14.8 28 8.7 18 131 22 Delaware 9.1 16.6 35 14.1 49 82 11 Florida 7.2 10.5 12 7.3 12 46 2 Georgia 6.5 9.6 7 8.9 20 49 4 Hawaii 2.9 10.0 8 5.2 2 245 45 Idaho 5.0 13.7 23 8.5 17 175 38 Illinois 4.5 11.3 15 7.3 11 151 28 Indiana 8.5 18.3 42 13.1 44 114 19 Iowa 6.8 16.6 37 10.4 32 143 26 Kansas 7.1 10.8 14 8.1 16 52 5 Kentucky 5.4 13.7 21 9.2 23 153 30 Louisiana 6.9 14.6 26 11.7 39 113 16 Maine 11.7 19.2 44 13.9 48 64 6 Maryland 5.5 14.0 24 9.4 24 152 29 Mass. 5.5 15.7 31 10.0 30 187 41 Michigan 6.8 19.3 45 11.6 38 183 39 Minnesota 5.8 13.5 19 9.5 25 132 23 Mississippi 9.2 13.6 20 11.8 40 48 3 Missouri 4.8 15.9 33 9.7 26 229 43 Montana 6.0 20.3 46 11.1 36 239 44 N. Carolina 4.2 9.2 3 5.5 3 119 20 Nebraska 7.0 12.5 17 9.1 22 80 10 Nevada 6.5 9.0 2 6.6 7 39 1 New Hamp 8.6 23.5 49 13.8 47 173 37 New Jersey 6.0 15.4 30 9.0 21 157 33 New Mexico 5.4 9.3 4 7.0 9 70 7 New York 5.0 14.3 25 9.8 28 187 42 North Dakota 6.6 17.2 39 10.6 34 162 34 Ohio 8.2 20.8 48 13.1 45 155 31 Oklahoma 4.8 11.4 16 7.1 10 137 24 Oregon 7.2 16.4 34 9.8 27 128 21 Pennsylvania 8.8 18.7 43 13.6 46 113 17 Rhode Island 9.0 16.6 36 12.3 41 84 12 S. Carolina - 20.3 47 12.5 42 - - South Dakota 10.1 17.3 40 12.9 43 71 8 Tennessee 5.8 15.8 32 8.9 19 172 36 Texas - 10.5 13 6.2 5 - - Utah 5.7 10.5 10 7.8 14 84 13 Vermont 10.1 28.8 50 19.9 50 187 40 Virginia 6.6 13.7 22 10.3 31 109 15 Washington 4.8 9.3 5 6.7 8 92 14 West Virginia 3.9 15.1 29 10.4 33 286 46 Wisconsin 6.9 14.8 27 9.9 29 113 18 Wyoming 3.9 10.2 9 6.1 4 162 35
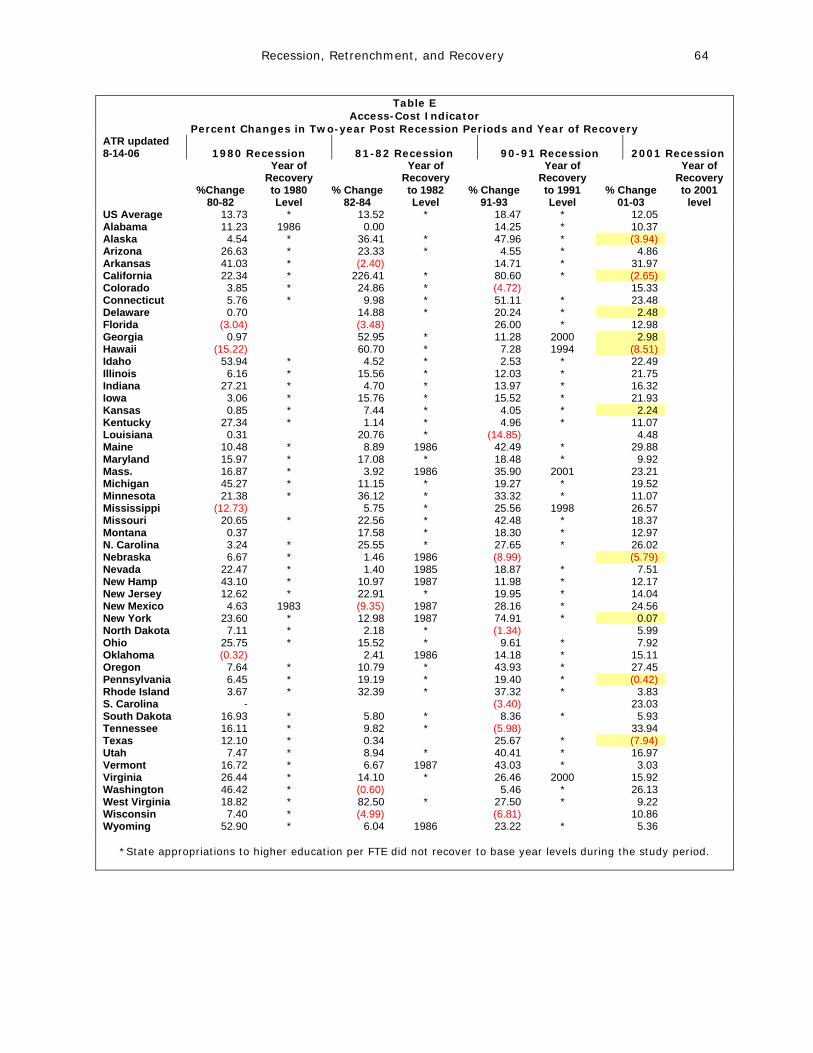
Recession, Retrenchment, and Recovery 64
Table E Access-Cost Indicator
Percent Changes in Two-year Post Recession Periods and Year of Recovery ATR updated 8-14-06 1980 Recession 81-82 Recession 90-91 Recession 2001 Recession
%Change
80-82
Year of Recovery to 1980 Level
% Change 82-84
Year of Recovery to 1982 Level
% Change 91-93
Year of Recovery to 1991 Level
% Change 01-03
Year of Recovery to 2001
level US Average 13.73 * 13.52 * 18.47 * 12.05 Alabama 11.23 1986 0.00 14.25 * 10.37 Alaska 4.54 * 36.41 * 47.96 * (3.94) Arizona 26.63 * 23.33 * 4.55 * 4.86 Arkansas 41.03 * (2.40) 14.71 * 31.97 California 22.34 * 226.41 * 80.60 * (2.65) Colorado 3.85 * 24.86 * (4.72) 15.33 Connecticut 5.76 * 9.98 * 51.11 * 23.48 Delaware 0.70 14.88 * 20.24 * 2.48 Florida (3.04) (3.48) 26.00 * 12.98 Georgia 0.97 52.95 * 11.28 2000 2.98 Hawaii (15.22) 60.70 * 7.28 1994 (8.51) Idaho 53.94 * 4.52 * 2.53 * 22.49 Illinois 6.16 * 15.56 * 12.03 * 21.75 Indiana 27.21 * 4.70 * 13.97 * 16.32 Iowa 3.06 * 15.76 * 15.52 * 21.93 Kansas 0.85 * 7.44 * 4.05 * 2.24 Kentucky 27.34 * 1.14 * 4.96 * 11.07 Louisiana 0.31 20.76 * (14.85) 4.48 Maine 10.48 * 8.89 1986 42.49 * 29.88 Maryland 15.97 * 17.08 * 18.48 * 9.92 Mass. 16.87 * 3.92 1986 35.90 2001 23.21 Michigan 45.27 * 11.15 * 19.27 * 19.52 Minnesota 21.38 * 36.12 * 33.32 * 11.07 Mississippi (12.73) 5.75 * 25.56 1998 26.57 Missouri 20.65 * 22.56 * 42.48 * 18.37 Montana 0.37 17.58 * 18.30 * 12.97 N. Carolina 3.24 * 25.55 * 27.65 * 26.02 Nebraska 6.67 * 1.46 1986 (8.99) (5.79) Nevada 22.47 * 1.40 1985 18.87 * 7.51 New Hamp 43.10 * 10.97 1987 11.98 * 12.17 New Jersey 12.62 * 22.91 * 19.95 * 14.04 New Mexico 4.63 1983 (9.35) 1987 28.16 * 24.56 New York 23.60 * 12.98 1987 74.91 * 0.07 North Dakota 7.11 * 2.18 * (1.34) 5.99 Ohio 25.75 * 15.52 * 9.61 * 7.92 Oklahoma (0.32) 2.41 1986 14.18 * 15.11 Oregon 7.64 * 10.79 * 43.93 * 27.45 Pennsylvania 6.45 * 19.19 * 19.40 * (0.42) Rhode Island 3.67 * 32.39 * 37.32 * 3.83 S. Carolina - (3.40) 23.03 South Dakota 16.93 * 5.80 * 8.36 * 5.93 Tennessee 16.11 * 9.82 * (5.98) 33.94 Texas 12.10 * 0.34 25.67 * (7.94) Utah 7.47 * 8.94 * 40.41 * 16.97 Vermont 16.72 * 6.67 1987 43.03 * 3.03 Virginia 26.44 * 14.10 * 26.46 2000 15.92 Washington 46.42 * (0.60) 5.46 * 26.13 West Virginia 18.82 * 82.50 * 27.50 * 9.22 Wisconsin 7.40 * (4.99) (6.81) 10.86 Wyoming 52.90 * 6.04 1986 23.22 * 5.36
*State appropriations to higher education per FTE did not recover to base year levels during the study period.

Recession, Retrenchment, and Recovery 65
Recession, Retrenchment, and Recovery 66
Appendix 2 Data and Research Design
This appendix provides information about the data used in two phases of the Recession, Retrenchment, and Recovery Project—the fiscal analysis (Chapter 1) and in the selection of states in which interviews of policymakers were conducted (Chapter 3). The fiscal analysis drew upon several national databases to examine the relationships between national recessions and states’ economies and between states’ economies and higher education appropriations. In addition, trends in appropriations, tuition and fees, and student financial aid during a 25-year period, 1979 to 2004, were examined and the effects of recessions on factors that determine financial access to college for students were described.
The research design utilized in selecting states for interviews involved examination of data collected by the Project in the initial two phases of the Project dealing with state funding and student financial aid. Preparation for interviews relied upon a qualitative strategy involving in-person interviews and document gathering before and during the state visits. While position identification was an important guideline in identifying potential higher education and state leaders to be interviewed, a broad range of leaders knowledgeable of state higher education funding and student financial aid were included. These included professors, researchers, policy analysts, institutional administrators, journalists, consultants, and others in state government. Especially valuable were those higher education leaders and officials who had formerly held leadership positions, including those recently retired; some of these interviews were conducted by telephone although 54 were on-site interviews.
Definitions, Limitations, and Sources of Data
Access-Cost Indicator is a measure of the balance of state need-based aid allocated to students attending public institutions and weighted average tuition and fees at public institutions with family income.
ACI = Tuition and Fees – Grant Aid per FTE 30th Percentile Family Income
Data for tuition and fees were available only for public four-year institutions and two-year institutions separately, but the available public student financial aid data did not provide a breakout for two- and four-year public institutions. To deal with this issue, a weighted Average Public Tuition and Fees (APTF) was calculated as follows:
APTF = (2yr T&F x 2yr FTE) + (4yr T&F x 4yr FTE) Total Public FTE
This study focused on states that have maintained financial access for students through economic recessions. The advantage of the access-cost indicator is that it accommodates the differences among states in approaches to providing access, particularly for low-income students. However, the access-cost indicator alone is not sufficient to draw conclusions about financial access or changes in access in a state. Described in this section are limitations and considerations related to each of the data sets used in the access-cost indicator calculation. Each of the data sets are widely used and drawn
Recession, Retrenchment, and Recovery 67
from reliable sources. This analysis focuses on the factors that states can influence or control (tuition and fees at public institutions and state grant aid) and conditions that are unique to each state (enrollment trends and family income). Other costs besides tuition are not included in the access-cost indicator. Arguably the greatest costs of attending public higher education in most states are living expenses (room and board), foregone earnings, books, supplies, and incidental fees. Other financial aid sources besides state aid are not included in the access-cost indicator. Chief among these are federal aid (Pell Grants), private aid, and institutional aid.
Aid-to-Tuition Ratio is the ratio of need-based aid allocated to students attending public institutions to the average weighted tuition and fees at public institutions. Consumer Price Index was used in this study to adjust dollars for inflation. The Index was obtained from the U.S. Department of Labor, Bureau of Labor Statistics. www.bis.gov Family Income is the average total income for a family converted to 2004 dollars using the Consumer Price Index. The data were provided by Pinkerton Computer Consultants, Inc. and were drawn from the Current Population Survey of the Bureau of Census March Supplement. In the calculation of the access-cost indicator, the 30th percentile of family income was used. The income data are derived from samples taken by the Bureau of the Census. Because of the inherent nature of sample data, the variance of the data from year to year in the sample is likely to be greater than that in the population. Full-Time Equivalent (FTE) Enrollment is undergraduate enrollment at public 2-year and 4-year institutions. FTE is calculated from historical fall headcount enrollment by sector and attendance pattern as follows:
FTE = Headcount Full-Time Enrollment + 1/3 Headcount Part-Time Enrollment
Headcount data were obtained through a special request to the National Center for Education Statistics (NCES). While NCES has reported FTE enrollment since the early 1980s, the method of calculation changed twice in the time period under consideration in this study. Therefore, it was decided to use headcount data and to use a consistent method to estimate FTE enrollment, as recommended by NCES. FTE enrollment was calculated from headcount data which included out-of-state students. In states where out-of-state students represent a significant portion of total enrollment in public institutions, appropriations and student financial aid would be understated. Data on residence of all students are not available. However, data on residence and migration of first-time freshmen gives some idea of the distribution of out-of-state students. According to 2002 residence and migration data, a majority of states fell within ±10 percentage points of the national average. The 12 states listed below show a higher proportion of first-time freshmen from out of state. Of particular concern are Rhode Island and Vermont, states with relatively small enrollments where significant enrollment of out-of-state students might alter conclusions.
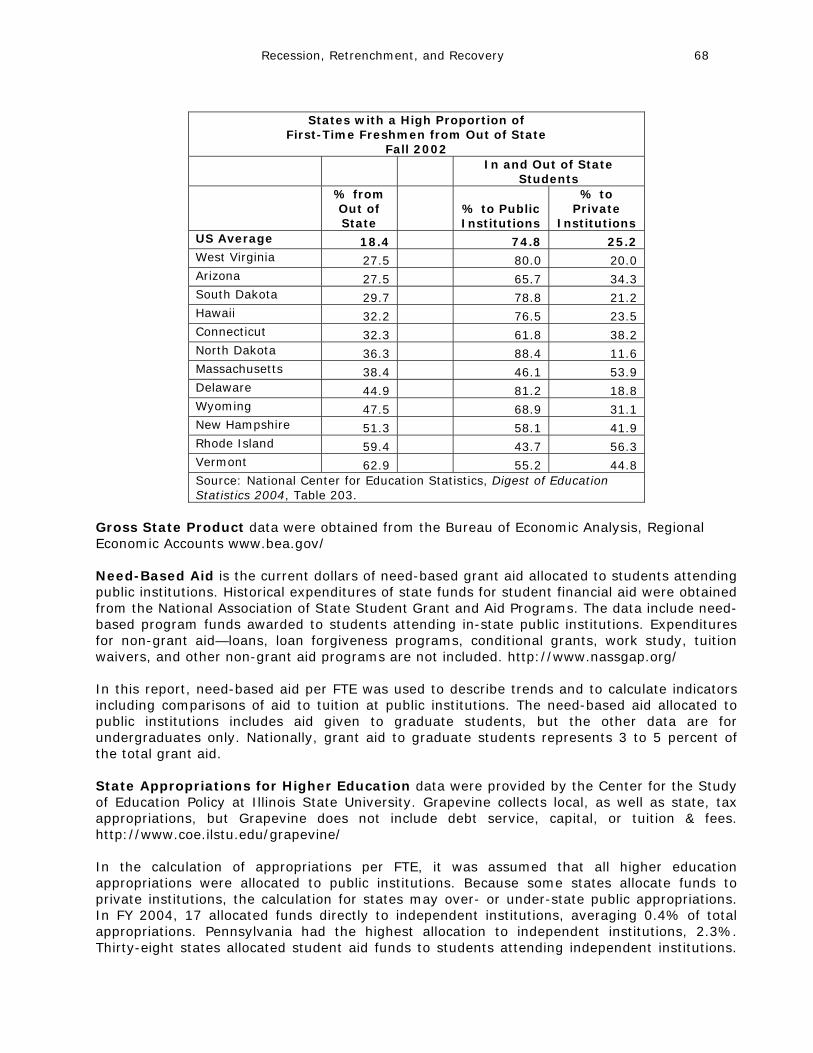
Recession, Retrenchment, and Recovery 68
States with a High Proportion of
First-Time Freshmen from Out of State Fall 2002
In and Out of State Students
% from Out of State
% to Public Institutions
% to Private
Institutions US Average 18.4 74.8 25.2 West Virginia 27.5 80.0 20.0 Arizona 27.5 65.7 34.3 South Dakota 29.7 78.8 21.2 Hawaii 32.2 76.5 23.5 Connecticut 32.3 61.8 38.2 North Dakota 36.3 88.4 11.6 Massachusetts 38.4 46.1 53.9 Delaware 44.9 81.2 18.8 Wyoming 47.5 68.9 31.1 New Hampshire 51.3 58.1 41.9 Rhode Island 59.4 43.7 56.3 Vermont 62.9 55.2 44.8 Source: National Center for Education Statistics, Digest of Education Statistics 2004, Table 203.
Gross State Product data were obtained from the Bureau of Economic Analysis, Regional Economic Accounts www.bea.gov/ Need-Based Aid is the current dollars of need-based grant aid allocated to students attending public institutions. Historical expenditures of state funds for student financial aid were obtained from the National Association of State Student Grant and Aid Programs. The data include need-based program funds awarded to students attending in-state public institutions. Expenditures for non-grant aid—loans, loan forgiveness programs, conditional grants, work study, tuition waivers, and other non-grant aid programs are not included. http://www.nassgap.org/ In this report, need-based aid per FTE was used to describe trends and to calculate indicators including comparisons of aid to tuition at public institutions. The need-based aid allocated to public institutions includes aid given to graduate students, but the other data are for undergraduates only. Nationally, grant aid to graduate students represents 3 to 5 percent of the total grant aid. State Appropriations for Higher Education data were provided by the Center for the Study of Education Policy at Illinois State University. Grapevine collects local, as well as state, tax appropriations, but Grapevine does not include debt service, capital, or tuition & fees. http://www.coe.ilstu.edu/grapevine/ In the calculation of appropriations per FTE, it was assumed that all higher education appropriations were allocated to public institutions. Because some states allocate funds to private institutions, the calculation for states may over- or under-state public appropriations. In FY 2004, 17 allocated funds directly to independent institutions, averaging 0.4% of total appropriations. Pennsylvania had the highest allocation to independent institutions, 2.3%. Thirty-eight states allocated student aid funds to students attending independent institutions.
Recession, Retrenchment, and Recovery 69
These allocations averaged 2.7% of the total higher education appropriation and Pennsylvania was highest with 8.8%. (SHEEO, State Higher Education Finance, 2005). Tuition and Fees are comprised of resident undergraduate annual tuition and required fees for flagship universities, state colleges and universities, and community colleges. A weighted average tuition and fees for public institutions in current dollars was calculated based on full-time-equivalent enrollment. The historical tuition and fees data were provided by the Higher Education Coordinating Board of Washington. Data for state colleges and universities and community colleges are based on a sample of institutions within each state. “4-year tuition and fees” is the average annual undergraduate tuition and required fees at selected public regional universities and the flagship university in each state. “2-year tuition and fees” is the average for representative community colleges. www.hecb.wa.gov/ Research Procedures for Selection of States for Interviews A fundamental purpose of Recession, Retrenchment, and Recovery was to identify states that had been successful in maintaining fiscal access for students to higher education through economic cycles. Success may take different forms – maintaining a high aid-to-tuition ratio or low average access-cost over time, providing stable indicators over time, or surviving recessions without substantial changes in financial access. The aid-to-tuition ratio and the access-cost indicator were helpful analytic devices in examining student aid and financial strategies used by states over time. A number of variables were considered (see list below), but initially it was ensured that states to be selected were representative of geographic regions and enrollment size in the public sector. Other variables included the following:
• Percent of students enrolled in community colleges • Enrollment change over time • Chance for college by age 19 (in 2000) • Percent of age 18-24 enrolled in college • Percent of age 25-49 enrolled part-time in postsecondary education • Associate degrees as a percent of high school graduates three years earlier • Bachelor’s degrees as a percent of high school graduates six years earlier • Percent of income needed to pay for college expenses minus financial aid (at
community colleges and also at four-year public institutions) These characteristics of enrollment, participation, and degree completion provided additional understanding of state outcomes with respect to student aid and cost. Particular attention was paid to three measures for the aid-to-tuition ratio and the access-cost indicator: the 1979 to 2003 average, the 1979 to 2003 change, and the change after the 2001 recession (for both indicators). Of the 50 states, 31 were in the top 10 on one or more of these various measures, and 13 ranked in the top 10 on both the ATR and the ACI indicators.
The ACI and ATR figures for the seven states are shown in Tables 1 and 2. Averages were calculated for two time periods: 1979 through 2004 (the entire time period of the study), and 1999-2003 (more recent years including the 2001 recession and two years after). On the ACI, the rank changes were similar between the two time periods with the exception of Texas which ranked 2nd lowest overall but 5th in the more recent period. The reason for this change in the Texas indicator resulted from a considerable increase in student financial aid.
Regarding the aid-to-tuition ratio, Illinois is highest within the seven states, Kansas has the lowest ATR (6th) for the overall time frame of the study, and Arizona is lowest for the 1999-2003 period. Texas data are not included in the 1979-2004 period because it had virtually no need-based student financial aid program in 1979.
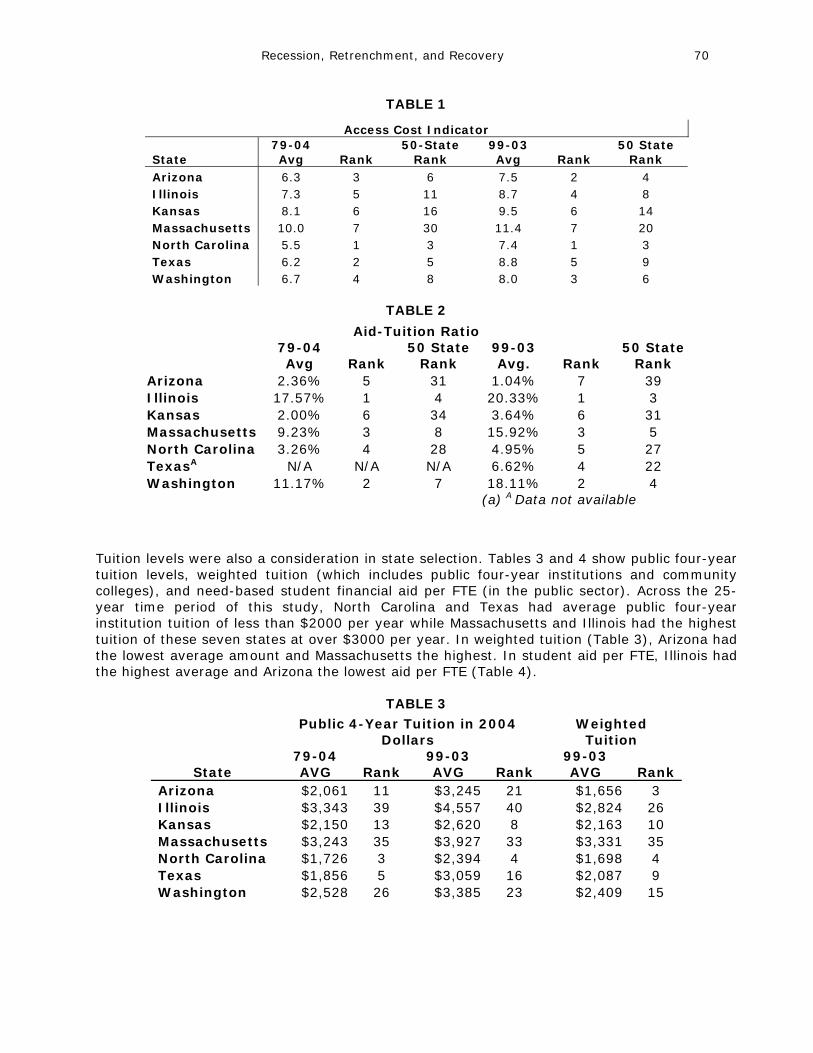
Recession, Retrenchment, and Recovery 70
TABLE 1
Access Cost Indicator
State 79-04 Avg Rank
50-State Rank
99-03 Avg Rank
50 State Rank
Arizona 6.3 3 6 7.5 2 4 Illinois 7.3 5 11 8.7 4 8 Kansas 8.1 6 16 9.5 6 14 Massachusetts 10.0 7 30 11.4 7 20 North Carolina 5.5 1 3 7.4 1 3 Texas 6.2 2 5 8.8 5 9 Washington 6.7 4 8 8.0 3 6
TABLE 2
Aid-Tuition Ratio
79-04 Avg Rank
50 State Rank
99-03 Avg. Rank
50 State Rank
Arizona 2.36% 5 31 1.04% 7 39 Illinois 17.57% 1 4 20.33% 1 3 Kansas 2.00% 6 34 3.64% 6 31 Massachusetts 9.23% 3 8 15.92% 3 5 North Carolina 3.26% 4 28 4.95% 5 27 TexasA N/A N/A N/A 6.62% 4 22 Washington 11.17% 2 7 18.11% 2 4
(a) A Data not available
Tuition levels were also a consideration in state selection. Tables 3 and 4 show public four-year tuition levels, weighted tuition (which includes public four-year institutions and community colleges), and need-based student financial aid per FTE (in the public sector). Across the 25-year time period of this study, North Carolina and Texas had average public four-year institution tuition of less than $2000 per year while Massachusetts and Illinois had the highest tuition of these seven states at over $3000 per year. In weighted tuition (Table 3), Arizona had the lowest average amount and Massachusetts the highest. In student aid per FTE, Illinois had the highest average and Arizona the lowest aid per FTE (Table 4).
TABLE 3
Public 4-Year Tuition in 2004
Dollars Weighted
Tuition
State 79-04 AVG Rank
99-03 AVG Rank
99-03 AVG Rank
Arizona $2,061 11 $3,245 21 $1,656 3 Illinois $3,343 39 $4,557 40 $2,824 26 Kansas $2,150 13 $2,620 8 $2,163 10 Massachusetts $3,243 35 $3,927 33 $3,331 35 North Carolina $1,726 3 $2,394 4 $1,698 4 Texas $1,856 5 $3,059 16 $2,087 9 Washington $2,528 26 $3,385 23 $2,409 15
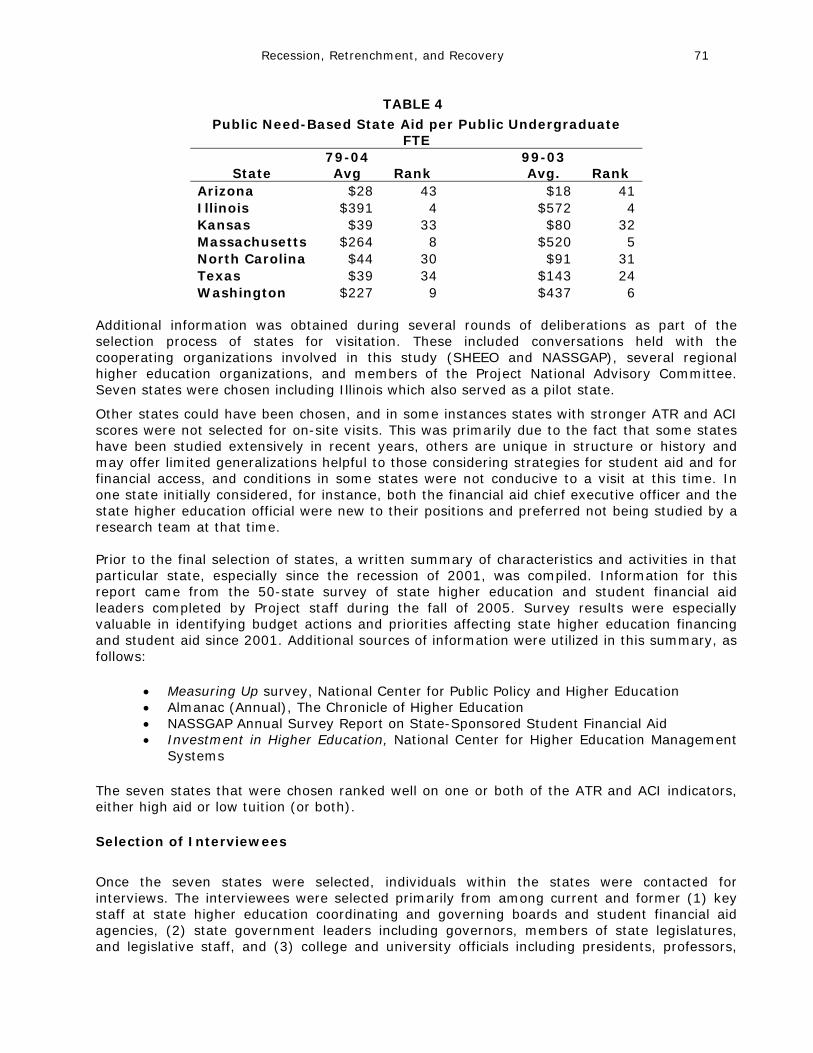
Recession, Retrenchment, and Recovery 71
TABLE 4
Public Need-Based State Aid per Public Undergraduate FTE
State 79-04 Avg Rank
99-03 Avg. Rank
Arizona $28 43 $18 41 Illinois $391 4 $572 4 Kansas $39 33 $80 32 Massachusetts $264 8 $520 5 North Carolina $44 30 $91 31 Texas $39 34 $143 24 Washington $227 9 $437 6
Additional information was obtained during several rounds of deliberations as part of the selection process of states for visitation. These included conversations held with the cooperating organizations involved in this study (SHEEO and NASSGAP), several regional higher education organizations, and members of the Project National Advisory Committee. Seven states were chosen including Illinois which also served as a pilot state.
Other states could have been chosen, and in some instances states with stronger ATR and ACI scores were not selected for on-site visits. This was primarily due to the fact that some states have been studied extensively in recent years, others are unique in structure or history and may offer limited generalizations helpful to those considering strategies for student aid and for financial access, and conditions in some states were not conducive to a visit at this time. In one state initially considered, for instance, both the financial aid chief executive officer and the state higher education official were new to their positions and preferred not being studied by a research team at that time. Prior to the final selection of states, a written summary of characteristics and activities in that particular state, especially since the recession of 2001, was compiled. Information for this report came from the 50-state survey of state higher education and student financial aid leaders completed by Project staff during the fall of 2005. Survey results were especially valuable in identifying budget actions and priorities affecting state higher education financing and student aid since 2001. Additional sources of information were utilized in this summary, as follows:
• Measuring Up survey, National Center for Public Policy and Higher Education • Almanac (Annual), The Chronicle of Higher Education • NASSGAP Annual Survey Report on State-Sponsored Student Financial Aid • Investment in Higher Education, National Center for Higher Education Management
Systems
The seven states that were chosen ranked well on one or both of the ATR and ACI indicators, either high aid or low tuition (or both).
Selection of Interviewees
Once the seven states were selected, individuals within the states were contacted for interviews. The interviewees were selected primarily from among current and former (1) key staff at state higher education coordinating and governing boards and student financial aid agencies, (2) state government leaders including governors, members of state legislatures, and legislative staff, and (3) college and university officials including presidents, professors,
Recession, Retrenchment, and Recovery 72
and researchers. A total of 54 on-site interviews were completed with the number of interviewees per state ranging from 5 to 12; on average, 8 people were interviewed in each state.
Questions Addressed As selection of the states moved toward completion, a protocol was developed for use as an interview schedule. Approximately 30 questions were formulated in four broad categories, as follows: • Attributes of a successful higher education system, i.e. a state system that has been
successful at protecting financial access for students to the state’s colleges and universities • Structure and relationships: how has the state’s higher education structure and
relationships among key officials affected financial access goals for students? • Major financial access challenges: what are the major challenges to student’ financial
access, what are the current issues, and how are they being addressed? • Other states: what other states have been successful at protecting financial access, and
what advice would you have for others who attempt to maintain financial access? The interview protocol was developed over three months, and utilized in a field test with several state higher education leaders. Questions were clarified, revised, and a PowerPoint presentation was developed using Project data and tailored to each state to be visited. Interviews lasted between one and three hours. At least two and usually three Project staff attended each interview. Most interviews were with a single higher education leader, although a few involved several staff.

Recession, Retrenchment, and Recovery 73
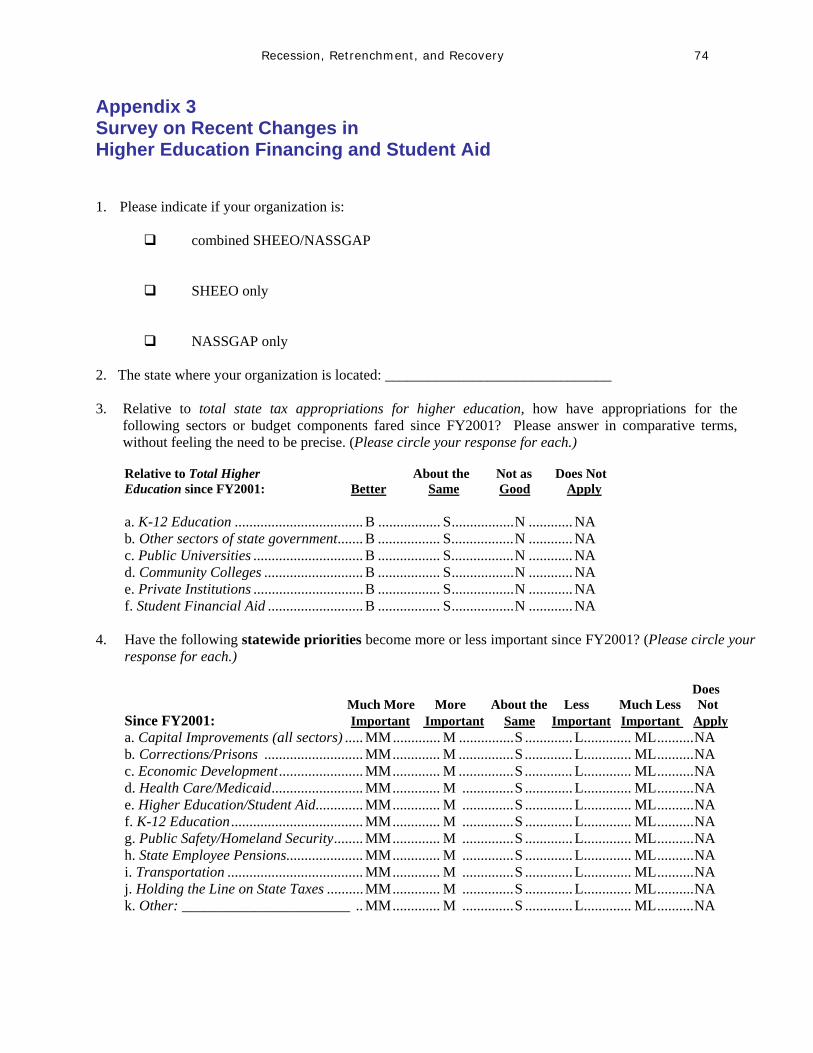
Recession, Retrenchment, and Recovery 74
Appendix 3 Survey on Recent Changes in Higher Education Financing and Student Aid
1. Please indicate if your organization is:
combined SHEEO/NASSGAP
SHEEO only NASSGAP only 2. The state where your organization is located: _______________________________ 3. Relative to total state tax appropriations for higher education, how have appropriations for the
following sectors or budget components fared since FY2001? Please answer in comparative terms, without feeling the need to be precise. (Please circle your response for each.)
Relative to Total Higher About the Not as Does Not Education since FY2001: Better Same Good Apply a. K-12 Education ...................................B ................. S.................N ............ NA b. Other sectors of state government.......B ................. S.................N ............ NA c. Public Universities ..............................B ................. S.................N ............ NA d. Community Colleges ...........................B ................. S.................N ............ NA e. Private Institutions ..............................B ................. S.................N ............ NA f. Student Financial Aid ..........................B ................. S.................N ............ NA 4. Have the following statewide priorities become more or less important since FY2001? (Please circle your
response for each.) Does
Much More More About the Less Much Less Not Since FY2001: Important Important Same Important Important Apply a. Capital Improvements (all sectors) .....MM............. M ...............S ............. L............. ML..........NA b. Corrections/Prisons ...........................MM ............. M ...............S ............. L............. ML..........NA c. Economic Development.......................MM ............. M ...............S ............. L............. ML..........NA d. Health Care/Medicaid.........................MM ............. M ..............S ............. L............. ML..........NA e. Higher Education/Student Aid.............MM ............. M ..............S ............. L............. ML..........NA f. K-12 Education....................................MM ............. M ..............S ............. L............. ML..........NA g. Public Safety/Homeland Security........MM ............. M ..............S ............. L............. ML..........NA h. State Employee Pensions.....................MM ............. M ..............S ............. L............. ML..........NA i. Transportation .....................................MM ............. M ..............S ............. L............. ML..........NA j. Holding the Line on State Taxes ..........MM ............. M ..............S ............. L............. ML..........NA k. Other: _______________________ ..MM ............. M ..............S ............. L............. ML..........NA
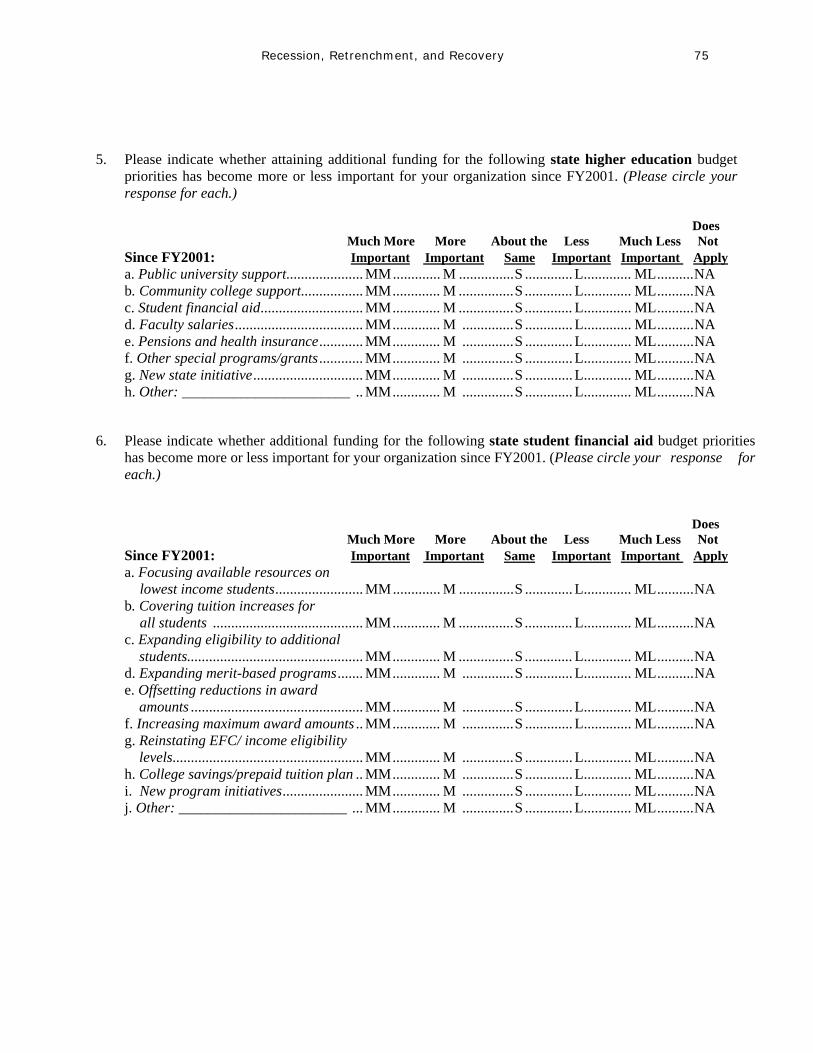
Recession, Retrenchment, and Recovery 75
5. Please indicate whether attaining additional funding for the following state higher education budget priorities has become more or less important for your organization since FY2001. (Please circle your response for each.)
Does Much More More About the Less Much Less Not Since FY2001: Important Important Same Important Important Apply a. Public university support.....................MM............. M ...............S ............. L............. ML..........NA b. Community college support.................MM ............. M ...............S ............. L............. ML..........NA c. Student financial aid............................MM ............. M ...............S ............. L............. ML..........NA d. Faculty salaries...................................MM ............. M ..............S ............. L............. ML..........NA e. Pensions and health insurance............MM ............. M ..............S ............. L............. ML..........NA f. Other special programs/grants ............MM ............. M ..............S ............. L............. ML..........NA g. New state initiative..............................MM ............. M ..............S ............. L............. ML..........NA h. Other: _______________________ ..MM ............. M ..............S ............. L............. ML..........NA 6. Please indicate whether additional funding for the following state student financial aid budget priorities
has become more or less important for your organization since FY2001. (Please circle your response for each.) Does
Much More More About the Less Much Less Not Since FY2001: Important Important Same Important Important Apply a. Focusing available resources on lowest income students........................MM............. M ...............S ............. L............. ML..........NA b. Covering tuition increases for all students .........................................MM ............. M ...............S ............. L............. ML..........NA c. Expanding eligibility to additional students................................................MM ............. M ...............S ............. L............. ML..........NA d. Expanding merit-based programs.......MM ............. M ..............S ............. L............. ML..........NA e. Offsetting reductions in award amounts ...............................................MM ............. M ..............S ............. L............. ML..........NA f. Increasing maximum award amounts ..MM ............. M ..............S ............. L............. ML..........NA g. Reinstating EFC/ income eligibility levels....................................................MM ............. M ..............S ............. L............. ML..........NA h. College savings/prepaid tuition plan ..MM ............. M ..............S ............. L............. ML..........NA i. New program initiatives......................MM ............. M ..............S ............. L............. ML..........NA j. Other: _______________________ ...MM ............. M ..............S ............. L............. ML..........NA
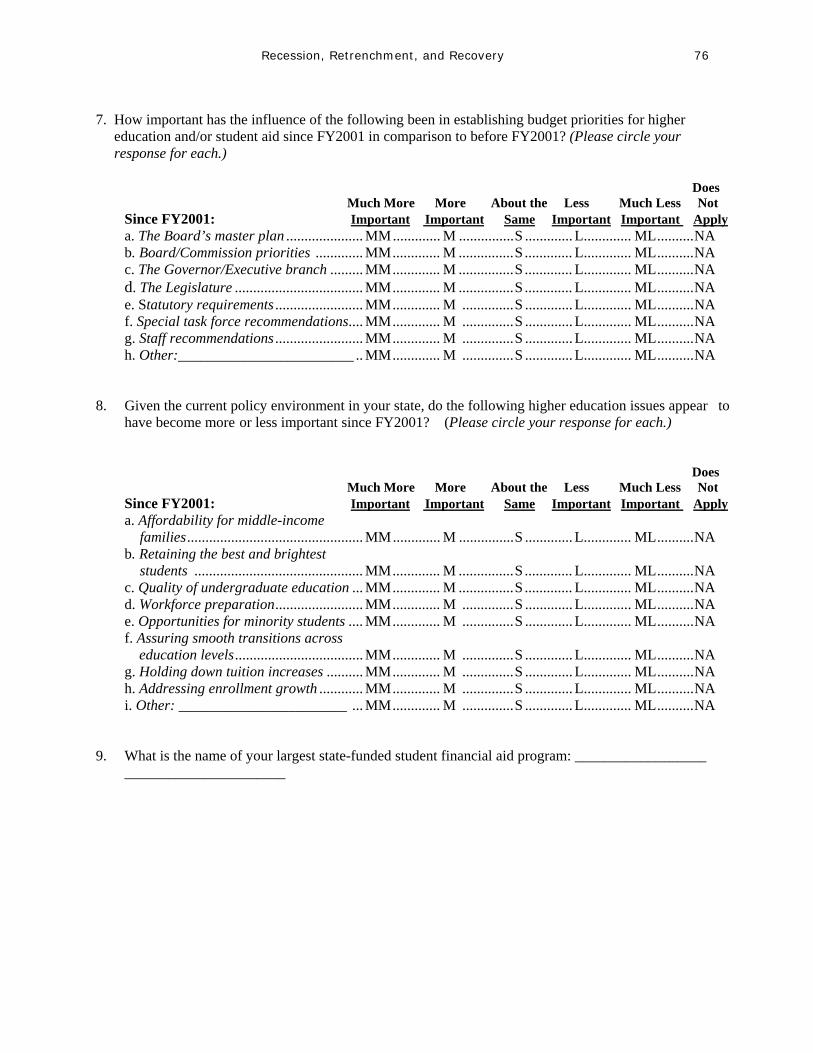
Recession, Retrenchment, and Recovery 76
7. How important has the influence of the following been in establishing budget priorities for higher education and/or student aid since FY2001 in comparison to before FY2001? (Please circle your response for each.) Does Much More More About the Less Much Less Not Since FY2001: Important Important Same Important Important Apply a. The Board’s master plan .....................MM............. M ...............S ............. L............. ML..........NA b. Board/Commission priorities .............MM ............. M ...............S ............. L............. ML..........NA c. The Governor/Executive branch .........MM ............. M ...............S ............. L............. ML..........NA d. The Legislature ...................................MM ............. M ...............S ............. L............. ML..........NA e. Statutory requirements ........................MM ............. M ..............S ............. L............. ML..........NA f. Special task force recommendations....MM ............. M ..............S ............. L............. ML..........NA g. Staff recommendations ........................MM ............. M ..............S ............. L............. ML..........NA h. Other:________________________ ..MM ............. M ..............S ............. L............. ML..........NA 8. Given the current policy environment in your state, do the following higher education issues appear to
have become more or less important since FY2001? (Please circle your response for each.) Does
Much More More About the Less Much Less Not Since FY2001: Important Important Same Important Important Apply a. Affordability for middle-income families................................................MM............. M ...............S ............. L............. ML..........NA b. Retaining the best and brightest students ..............................................MM ............. M ...............S ............. L............. ML..........NA c. Quality of undergraduate education ...MM ............. M ...............S ............. L............. ML..........NA d. Workforce preparation........................MM ............. M ..............S ............. L............. ML..........NA e. Opportunities for minority students ....MM ............. M ..............S ............. L............. ML..........NA f. Assuring smooth transitions across education levels...................................MM ............. M ..............S ............. L............. ML..........NA g. Holding down tuition increases ..........MM ............. M ..............S ............. L............. ML..........NA h. Addressing enrollment growth ............MM ............. M ..............S ............. L............. ML..........NA i. Other: _______________________ ...MM ............. M ..............S ............. L............. ML..........NA 9. What is the name of your largest state-funded student financial aid program: __________________ ______________________
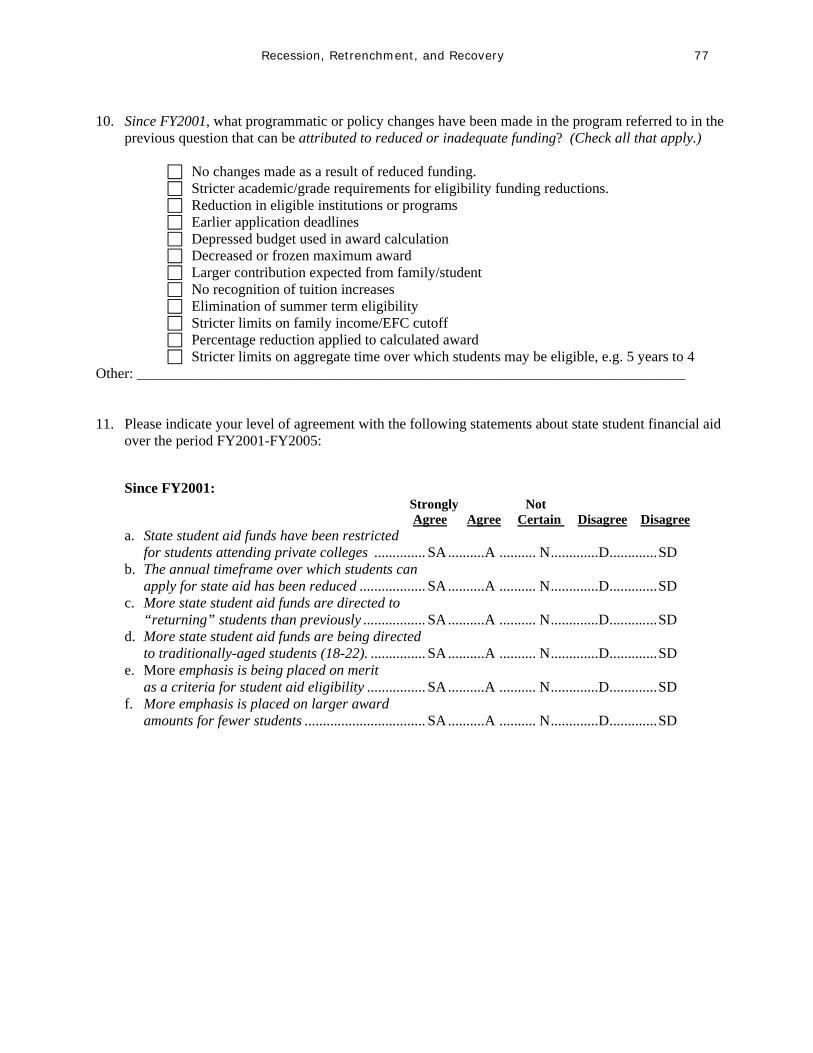
Recession, Retrenchment, and Recovery 77
10. Since FY2001, what programmatic or policy changes have been made in the program referred to in the
previous question that can be attributed to reduced or inadequate funding? (Check all that apply.)
No changes made as a result of reduced funding. Stricter academic/grade requirements for eligibility funding reductions. Reduction in eligible institutions or programs Earlier application deadlines Depressed budget used in award calculation Decreased or frozen maximum award Larger contribution expected from family/student No recognition of tuition increases Elimination of summer term eligibility Stricter limits on family income/EFC cutoff Percentage reduction applied to calculated award Stricter limits on aggregate time over which students may be eligible, e.g. 5 years to 4
Other: ___________________________________________________________________________ 11. Please indicate your level of agreement with the following statements about state student financial aid
over the period FY2001-FY2005:
Since FY2001: Strongly Not Agree Agree Certain Disagree Disagree a. State student aid funds have been restricted for students attending private colleges ..............SA..........A .......... N.............D.............SD b. The annual timeframe over which students can apply for state aid has been reduced ..................SA..........A .......... N.............D.............SD c. More state student aid funds are directed to “returning” students than previously ................. SA..........A .......... N.............D.............SD d. More state student aid funds are being directed to traditionally-aged students (18-22). ...............SA..........A .......... N.............D.............SD e. More emphasis is being placed on merit as a criteria for student aid eligibility ................SA..........A .......... N.............D.............SD f. More emphasis is placed on larger award amounts for fewer students .................................SA..........A .......... N.............D.............SD
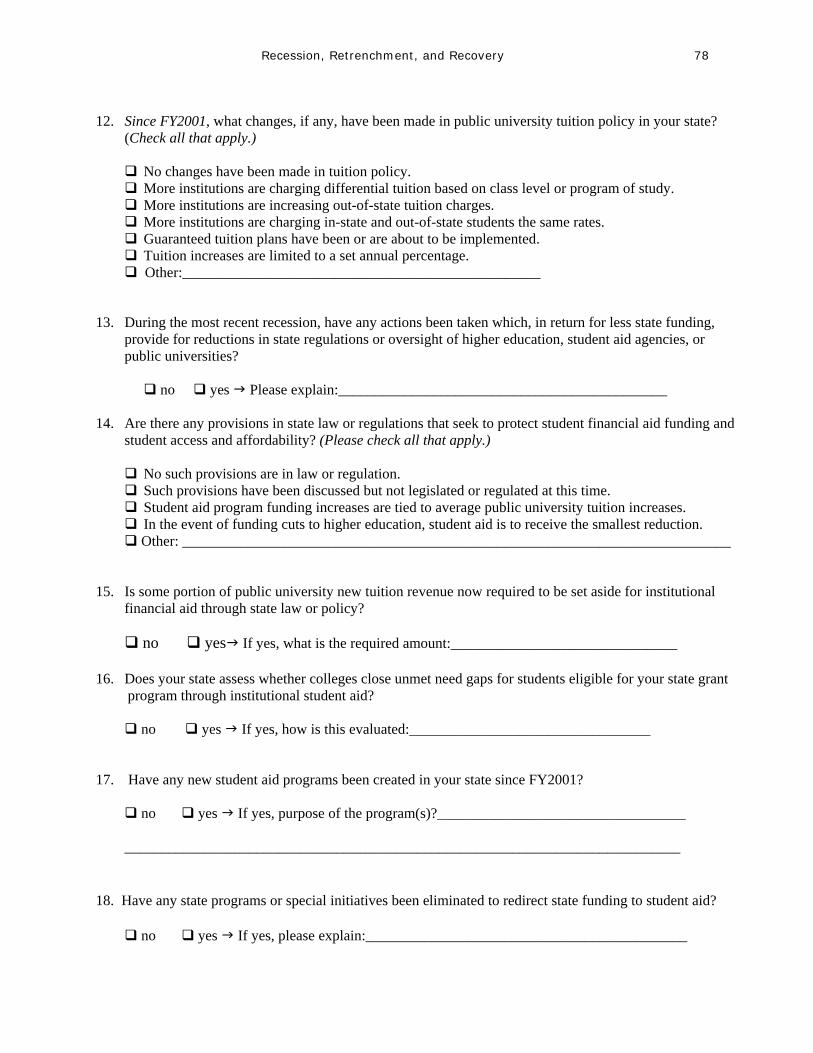
Recession, Retrenchment, and Recovery 78
12. Since FY2001, what changes, if any, have been made in public university tuition policy in your state?
(Check all that apply.) No changes have been made in tuition policy. More institutions are charging differential tuition based on class level or program of study. More institutions are increasing out-of-state tuition charges. More institutions are charging in-state and out-of-state students the same rates. Guaranteed tuition plans have been or are about to be implemented. Tuition increases are limited to a set annual percentage. Other:_________________________________________________ 13. During the most recent recession, have any actions been taken which, in return for less state funding,
provide for reductions in state regulations or oversight of higher education, student aid agencies, or public universities?
no yes Please explain:_____________________________________________ 14. Are there any provisions in state law or regulations that seek to protect student financial aid funding and student access and affordability? (Please check all that apply.) No such provisions are in law or regulation. Such provisions have been discussed but not legislated or regulated at this time. Student aid program funding increases are tied to average public university tuition increases. In the event of funding cuts to higher education, student aid is to receive the smallest reduction. Other: ___________________________________________________________________________ 15. Is some portion of public university new tuition revenue now required to be set aside for institutional
financial aid through state law or policy? no yes If yes, what is the required amount:_______________________________ 16. Does your state assess whether colleges close unmet need gaps for students eligible for your state grant
program through institutional student aid? no yes If yes, how is this evaluated:_________________________________ 17. Have any new student aid programs been created in your state since FY2001? no yes If yes, purpose of the program(s)?__________________________________ ____________________________________________________________________________ 18. Have any state programs or special initiatives been eliminated to redirect state funding to student aid? no yes If yes, please explain:____________________________________________
Recession, Retrenchment, and Recovery 79
19. Have any operational or organizational changes been made in the administration of your student aid
programs since FY2001 for the purpose of reducing program or operating costs? no yes If yes, please explain:____________________________________________ 20. Are there any statutory or state regulations that provide for enhanced spending flexibility for the state’s primary student aid program? (Check all that apply.) Our agency is allowed to transfer monies from other student aid programs to the primary need- based aid program. Biennial appropriation provides for carrying forward to next year or drawing down from next year. Annual appropriation provides carry forward authority to next year. Annual appropriation provides authority to drawdown/borrow from next year’s appropriation. Entitlement nature of program provides for continuing/automatic appropriations. No such provisions are in place. Other:______________________________________________________________________ 21. Please indicate your level of agreement with the statements below – whether or not you have data to support your position - regarding student access in your state since FY2001. (Please circle your response.) Since FY2001: Strongly Not Strongly Agree Agree Certain Disagree Disagree a. Increased selectivity has reduced participation by less academically capable students ................SA..........A .......... N.............D.............SD b. Enrollment shifts have occurred from higher- cost to lower-cost options .....................................SA..........A .......... N.............D.............SD c. Enrollment of low-income students has increased .............................................................SA..........A .......... N.............D.............SD d. More students are enrolling in out-of-state institutions ...........................................................SA..........A .......... N.............D.............SD e. Higher education is more likely to be viewed as a personal benefit than a public benefit. ..............SA..........A .......... N.............D.............SD f. Public university institutional student grant aid has grown faster than state student grant aid ......SA..........A .......... N.............D.............SD g. State need-based student aid increases have kept pace with college costs ................................SA..........A .......... N.............D.............SD h. More students pursuing a bachelor’s degree are starting their education at a community college .SA..........A .......... N.............D.............SD i. Students and families are expected to pay a larger share of college costs .............................SA..........A .......... N.............D.............SD j. Other:_________________________________ .SA..........A .......... N.............D.............SD 22. Have you undertaken any specific strategies to build support for higher education and student access in
your state? Are there strategies that might help build such support?
Recession, Retrenchment, and Recovery 80
23. Are there other states that you think have built successful strategies for maintaining support for higher education and student access? 24. From your perspective, what is the outlook for financial recovery in your state? What are your greatest concerns for the future of higher education and student financial aid in your state? 25. Is there anything else you think it would be important for us to know regarding higher education and
student financial aid in your state during the past few years?

Recession, Retrenchment, and Recovery 81
Recession, Retrenchment, and Recovery 82
Appendix 4 Policymakers and Higher Education Leaders Interviewed
Michael Baumgartner, Deputy Director for Planning & Budgeting, Illinois Board of Higher Education Robert Bellah, member, Arizona Board of Regents Gary Benson, former Legislative Staff Member and Fiscal Analyst, Washington Higher Education Coordinating Board Linda Blessing, former Executive Director, Arizona Board of Regents Molly Corbett Broad, former President, University of North Carolina Steve Brooks, Executive Director, North Carolina Education Assistance Authority Don Brown, Director, THECB Foundation and former Commissioner, Texas Higher Education Coordinating Board Jane Caldwell, Director of Grants and Special Programs, TX HECB Bill Chance, Staff Director, Washington Learns, Governor’s Commission on Education Jim Coffman, Professor and former Provost, Kansas State University Mark Denke, Assistant Director, Arizona Board of Regents
Lindy Eakin, Vice President for Administration, University of Kansas Ruta Fanning, WA State Auditor & former Director, Governor’s Office of Financial Management Teri Flack, Deputy Commissioner Texas Higher Education Coordinating Board Betty Gebhardt, Associate Director of Student Financial Assistance, Washington Higher Education Coordinating Board Judy Gill, Chancellor, Massachusetts Board of Regents Milton Glick, Executive Vice President and Provost, Arizona State University Les Goodchild, Dean, School of Education, University of Massachusetts, Boston Bill Greeney, Budget Officer, Office of the Governor, Arizona Mary Alice Grobbins, Dir. of Financial Services, WA State Board of Community & Technical Colleges Pat Haeuser, Associate Vice President for Planning, Northern Arizona University Lois Hollis, Assistant Commissioner, Texas Higher Education Coordinating Board Judy Erwin, Executive Dir., Illinois Board of Higher Education & former Chair of
Recession, Retrenchment, and Recovery 83
the Higher Education Committee, Illinois House of Representatives Stephanie Jacobson, Associate Director, Arizona Board of Regents Jack Jewett, Former Chair and member, Arizona Board of Regents Robert Kanoy, Senior Vice President for Academic and Student Affairs, UNC John Klacik, Director of Student Financial Assistance, Washington Higher Education Coordinating Board Dan Layzell, Asst VP for Strategic Planning & Policy Analysis, University of Illinois Larry Lee, Deputy Director, Guaranteed Education Tuition 529 College Savings Program, Washington Peter Likins, President, University of Arizona Diane Lindeman, Director of Student Financial Aid, Kansas Board of Regents Gary Locke, former Governor, State of Washington Elizabeth McDuffie, Director of Grants, Training & Outreach, North Carolina Education Assistance Authority Larry Matejka, Executive Director, Illinois Student Assistance Commission Clantha McCurdy, Associate Vice Chancellor, Student Financial Assistance, Massachusetts Board of Regents Cathy McGonigle, Deputy Executive Director, Arizona Board of Regents
Kelly Oliver, Director of Finance, Kansas Board of Regents Shirley Ort, Associate Provost & Director of Scholarships & Student Aid, University of North Carolina April Osborn, Executive Director, Arizona Commission on Postsecondary Education Ginger Ostro, Director of Ed. and Human Services, Illinois Governor’s Office of Management & Budget Ed Phillips, Medical Campus, Vice Chancellor for Administration, KU Medical Center Tom Rawson, Vice President for Administration, Kansas State University Bill Ratliff, former Senator and Lieutenant Governor, Texas Reggie Robinson, President and CEO, Kansas Board of Regents David Schulenburger, Executive Vice President and Provost, University of Kansas Rachelle Sharpe, Program and Policy Analyst, Student Financial Aid, Washington Higher Education Coordinating Board Joel Sideman, Executive Director, Arizona Board of Regents Kurt Steinberg, Associate Vice Chancellor, Fiscal Affairs, MBOR Jim Sulton, Executive Director, Washington Higher Education Coordinating Board Bridget Terry-Long, Associate Professor, Harvard University
Recession, Retrenchment, and Recovery 84
Richard Wagner, former Executive Director, Illinois Board of Higher Education Marc Webster, Higher Education Budget Analyst, Governor’s Office of Financial Management, WA
Hope Williams, President, North Carolina Independent Colleges and Universities Theo Yu, Senior State Government Budget Associate, Governor’s Office of Financial Management, WA