receptor modeling studies for the characterization of air...
TRANSCRIPT
Receptor Modeling Studies for the Receptor Modeling Studies for the Characterization of Air Pollution Characterization of Air Pollution Sources in Valenzuela Sampling SiteSources in Valenzuela Sampling Site
PRECIOSA CORAZON B. PABROA
Research Group: Flora L. Santos, Preciosa Corazon B. Pabroa, Joseph Michael D. Racho, Ryan P. Morco, Angel T. Bautista VII, Camille Grace D. Bucal, Gloria Jimenez and Danilo Cuyco
PRECIOSA CORAZON B. PABROA
How important is “air”?How important is “air”?
On the average, a person needs at least 30 lbs of air everyday to live, but only about 3 lbs of water and 1.5 lbs of food.
A person can live about 5 weeks without A person can live about 5 weeks without food and about 5 days without water, but only 5 minutes without air.
BackgroundBackground
� The Philippine Nuclear Research Institute (PNRI) has undertaken monitoring of particulate matter in the PM10 range, primarily to demonstrate the important primarily to demonstrate the important use of nuclear and related analytical techniques (NATs) to generate multi-element data for use in receptor modeling.
BackgroundBackground
� Air pollution in Metro Manila and its adverse impacts to health is a source of concern to various stakeholders.
� The government is trying to address the � The government is trying to address the problem but lacks scientific data on which to base policies to improve air quality.
� In this study, receptor modeling is applied to air particulate matter collected at the Valenzuela sampling site to characterize the air pollution sources in the area.
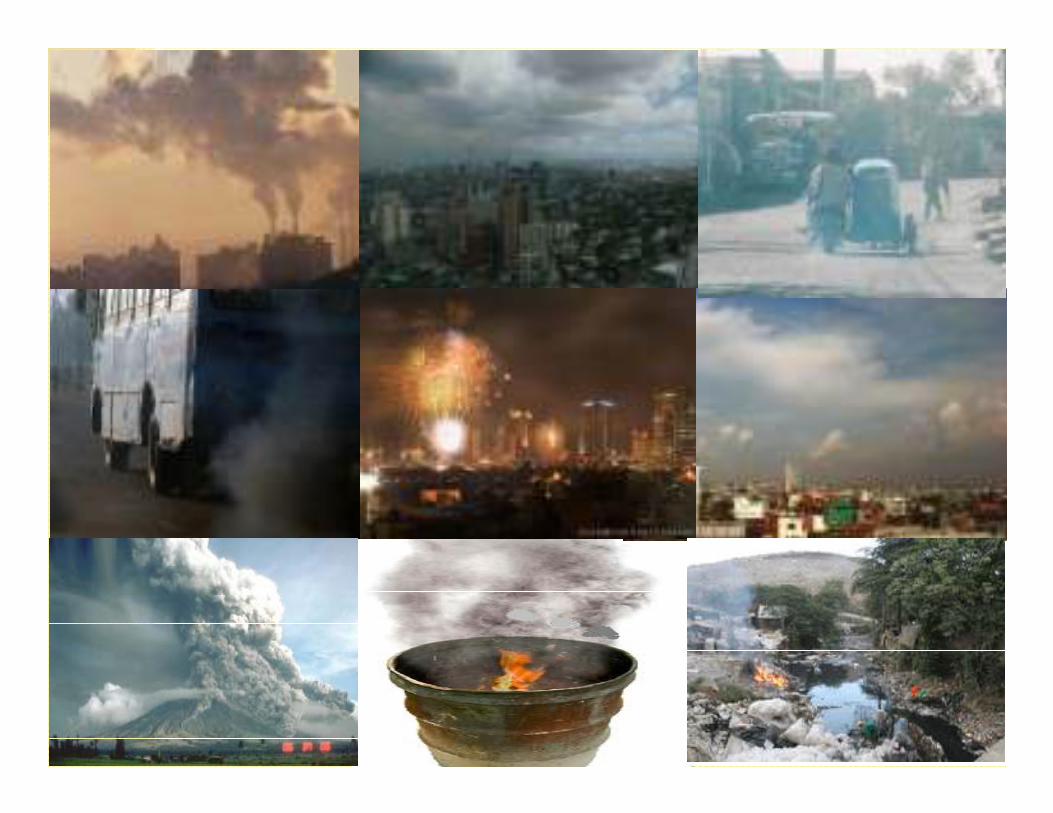
Air Pollution: Historical Background Air Pollution: Historical Background
� air pollution from human activities can be said to have originated with the discovery of fire
http://images.search.yahoo.com/images/
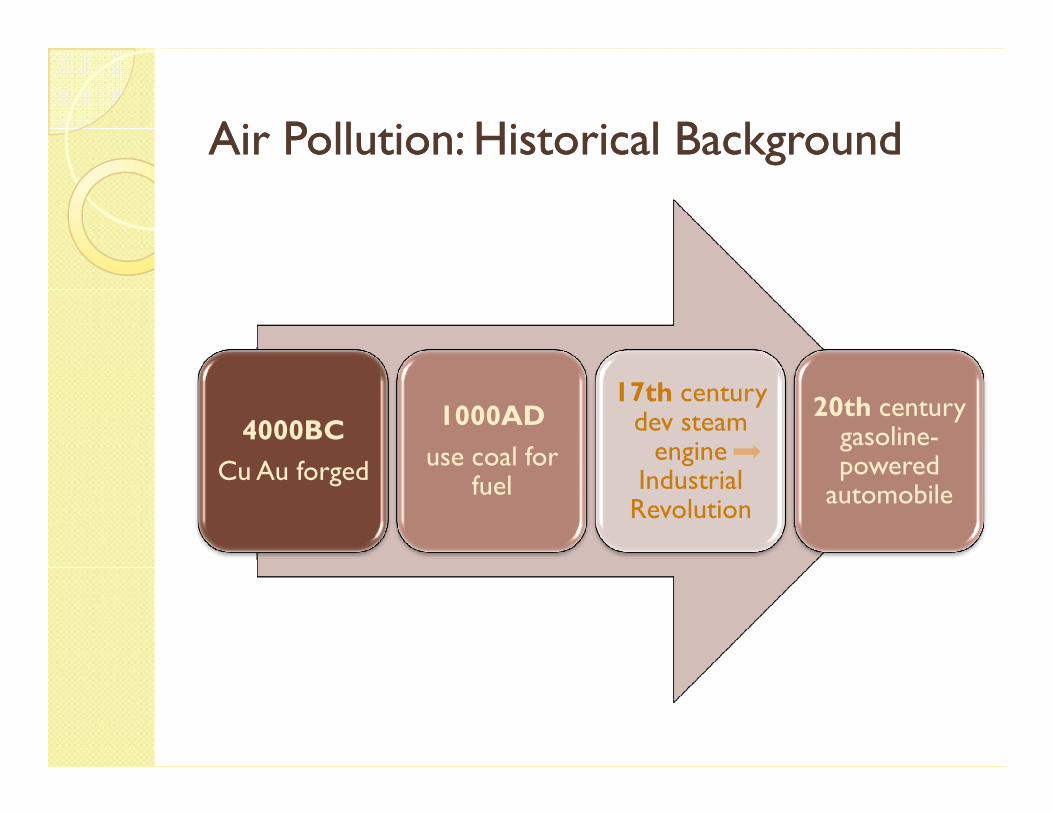
Air Pollution: Historical Background Air Pollution: Historical Background
1000AD17th century
dev steam 20th century
4000BC
Cu Au forged
1000AD
use coal for fuel
17th century dev steam
engine Industrial
Revolution
20th century gasoline-powered
automobile
Air Pollution ControlAir Pollution Control
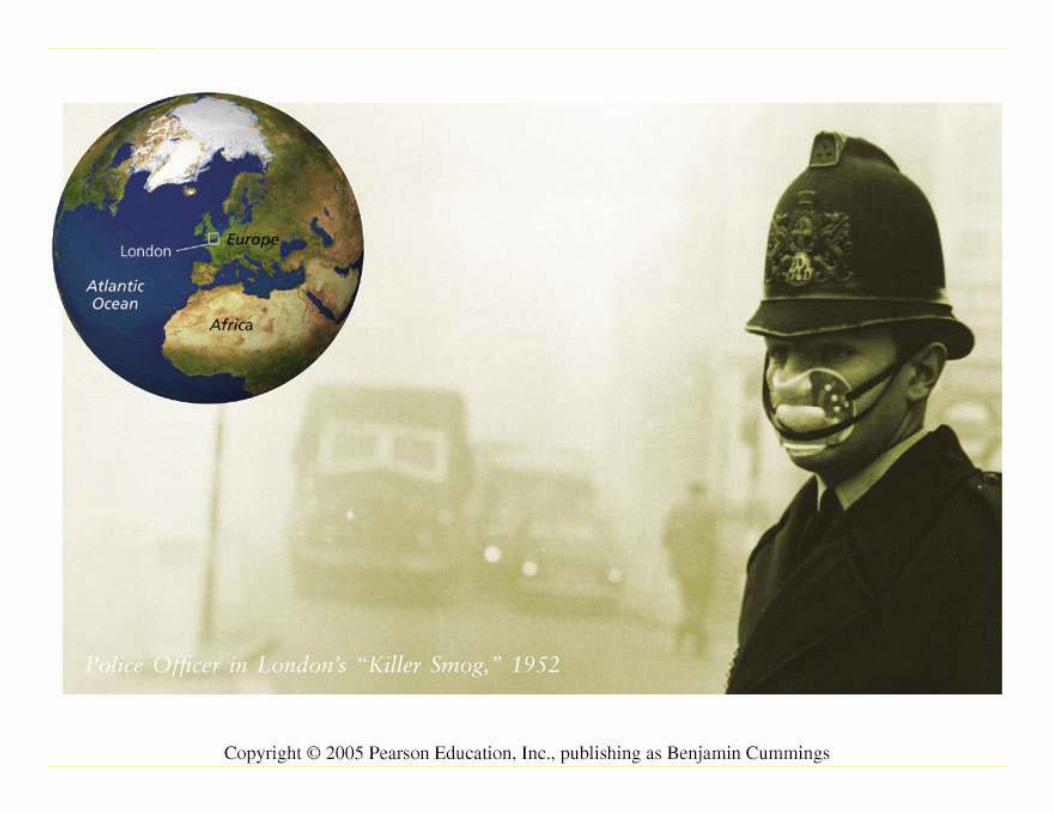
� The early "killer smog" episodes in Meuse Valley, Belgium (1930), Donora, Pa (1948), and London, UK (1952) provided starkevidence of deleterious respiratory and evidence of deleterious respiratory and cardiovascular health effects of severe air pollution exposure.
� initiation of air pollution control started at mid-1900
Meuse Valley “Killer Smog” in 1930Meuse Valley “Killer Smog” in 1930
� On February 12, 1930, 60 people died and thousands became seriously ill when industrial air emissions from coal-powered factories were trapped over a powered factories were trapped over a 15-mile-long stretch of farms in the Meuse Valley.

Donora “Killer Smog” in 1948Donora “Killer Smog” in 1948
Donora, a small industrial town in western Pennsylvania, experienced a temperature inversion
Air pollutants mostly from the
�This is what Donora looked like at noon on Oct. 29, 1948, as a deadly smog created by a temperature inversion and industrial plant emissions enveloped the town.
Air pollutants mostly from the local steel mill, wire mill and zinc plants were trapped in the valley where the town was situated
Intense smog hung in the air and persisted for about 1 week resulting to death of 20 people and illness of about 600 others
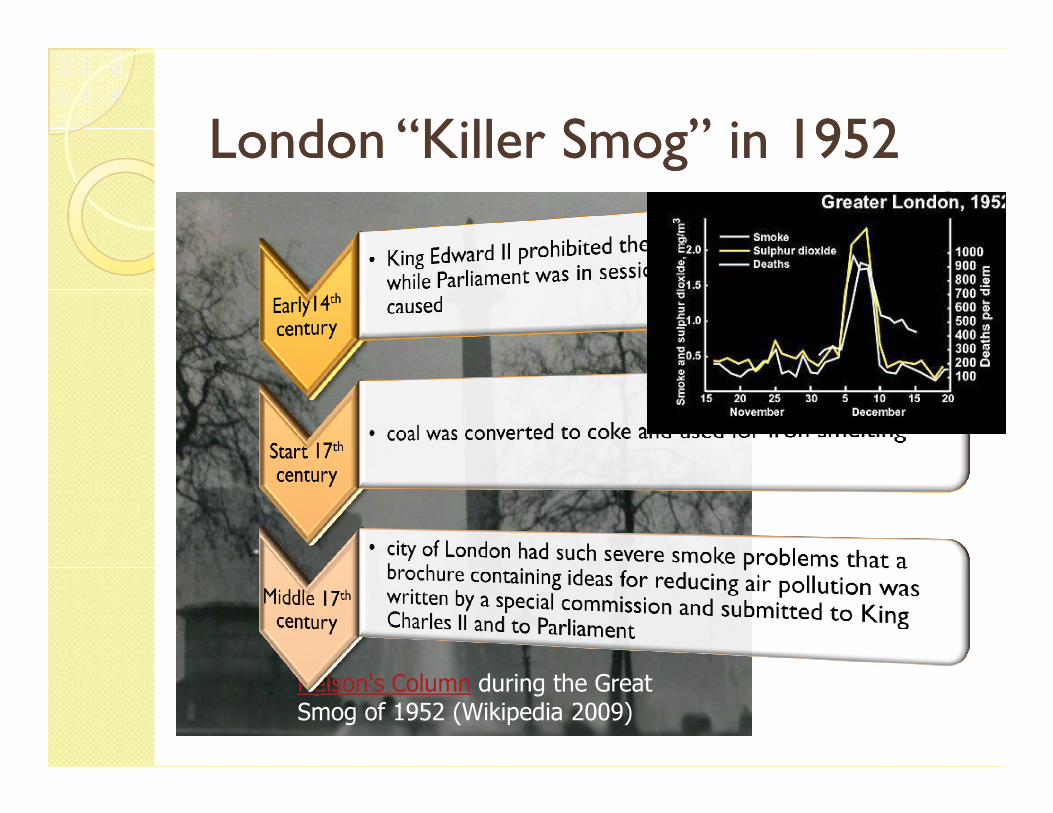
London “Killer Smog” in 1952London “Killer Smog” in 1952
Nelson's Column during the Great Smog of 1952 (Wikipedia 2009)
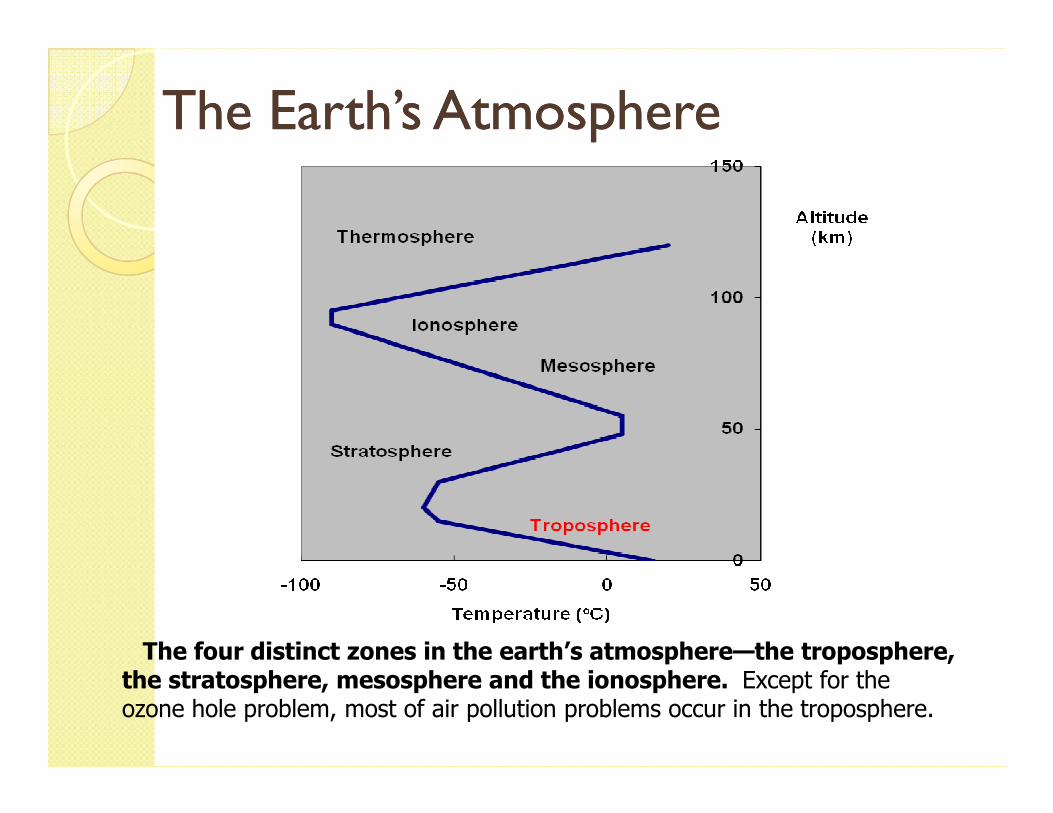
The Earth’s AtmosphereThe Earth’s Atmosphere
The four distinct zones in the earth’s atmosphere—the troposphere, the stratosphere, mesosphere and the ionosphere. Except for the ozone hole problem, most of air pollution problems occur in the troposphere.
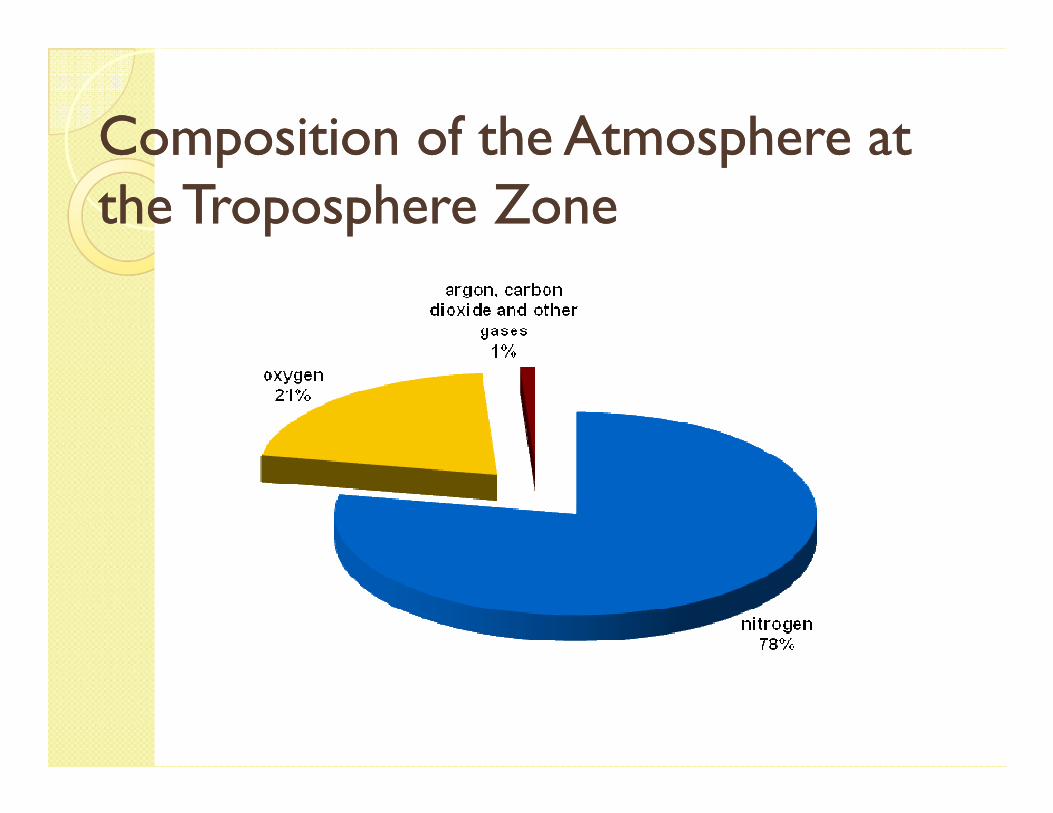
Composition of the Atmosphere at Composition of the Atmosphere at the Troposphere Zonethe Troposphere Zone
��Air PollutionAir Pollution
- defined as the presence of certain substances in the air in
�high enough concentrations and for
�long enough durations to cause�long enough durations to cause
� undesirable effects
General Distinction General Distinction among Air Pollutantsamong Air Pollutants
�anthropogenic vs natural sources
�primary pollutants vs secondary pollutants
�occur indoors as well as outdoors (ambient)(ambient)
�2 kinds of ambient pollutants
- criteria pollutants and
- hazardous air pollutants
General Distinction General Distinction among Air among Air Pollutants (1)Pollutants (1)
� Air pollution may be anthropogenic (caused by human activities), or
� may also result from natural causes such as that from volcanic discharges, smoke as that from volcanic discharges, smoke and gases from forest fires, windblown dust from deserts, salt seaspray, pollen grains, and other naturally occurring substances
General Distinction General Distinction among Air among Air Pollutants (2)Pollutants (2)
� Primary pollutants are emitted directly into the air from a specific source, either mobile (ex. automobiles) or stationary (such as a coal-fired electric power generating stations).electric power generating stations).
� Secondary pollutants, however, are not emitted directly from a source, but are formed in the atmosphere by complex chemical reactions involving the primary pollutants and sunlight.
General Distinction General Distinction among Air among Air Pollutants (3)Pollutants (3)
� Criteria Pollutants – are emitted in relatively large quantities by various sources and tend to threaten human health or welfare
� Hazardous Air Pollutants – discharge is not as � Hazardous Air Pollutants – discharge is not as voluminous as that of the criteria pollutants, they are considered to be immediately harmful to human health and are, for the most part, associated with certain specific sources
Criteria PollutantsCriteria Pollutants
� Five primary criteria pollutants include the gases sulfur dioxide (SO2), nitrogen oxides (NOx), and carbon monoxide (CO), solid or liquid particulates (smaller (CO), solid or liquid particulates (smaller than 10µm) or PM10, and particulate lead (Pb).
� Ozone (O3) is the secondary criteria pollutant.
Criteria Pollutant StandardsCriteria Pollutant Standards
� Primary Standards – established to protect public health
� Secondary Standards – established to protect against nonhealth effects, such as protect against nonhealth effects, such as crop damage or visibility

� Particulate matter of most concern with regard to adverse effects on human health are generally less than 10µm in size and are referred to as PM10. are referred to as PM10.
� PM10 is further classified as coarse particles referred to as PM10-2.5 and fine particles referred to as PM2.5.
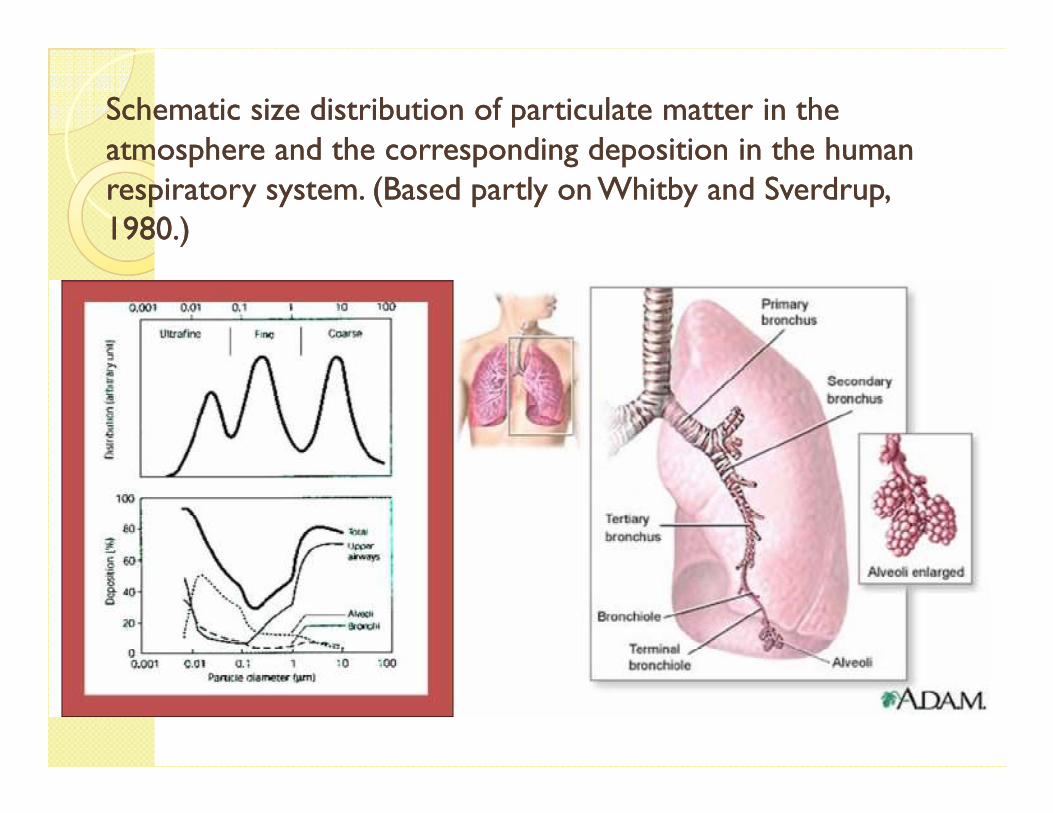
Schematic size distribution of particulate matter in the Schematic size distribution of particulate matter in the atmosphere and the corresponding deposition in the human atmosphere and the corresponding deposition in the human respiratory system. (Based partly on Whitby and Sverdrup, respiratory system. (Based partly on Whitby and Sverdrup, 1980.)1980.)
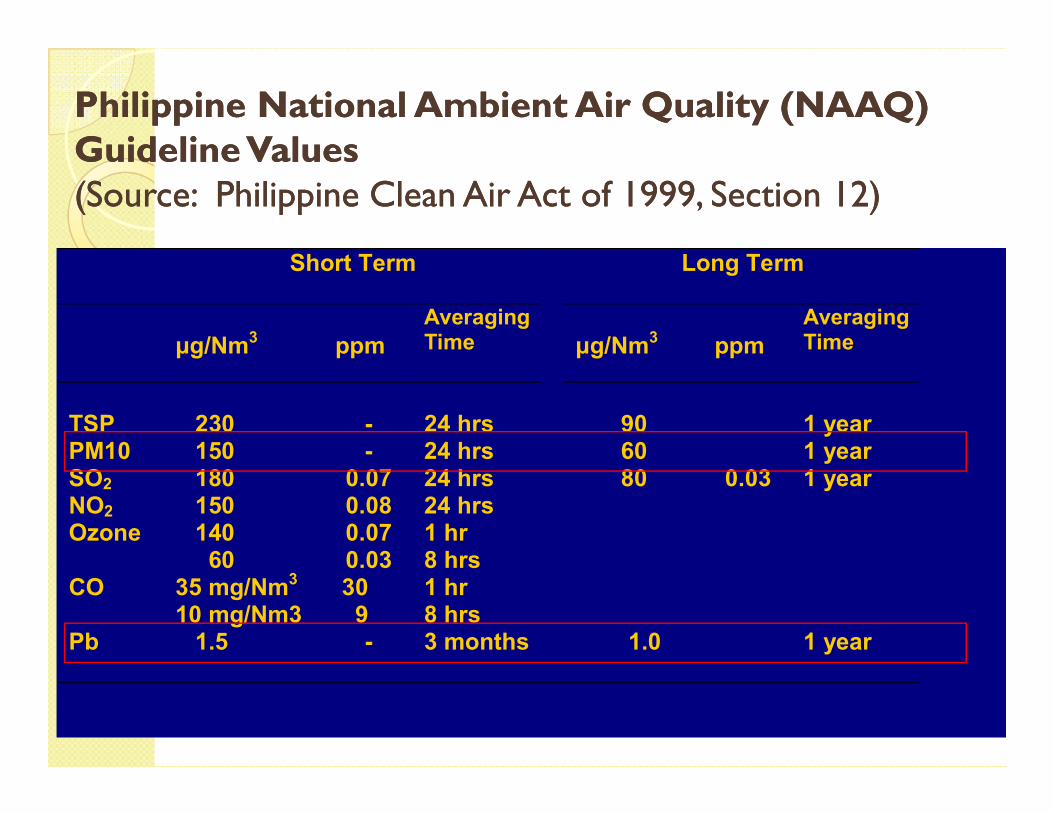
Philippine National Ambient Air Quality (NAAQ) Philippine National Ambient Air Quality (NAAQ) Guideline ValuesGuideline Values(Source: Philippine Clean Air Act of 1999, Section 12)(Source: Philippine Clean Air Act of 1999, Section 12)
Short Term
Long Term
µg/Nm3
ppm
Averaging Time
µg/Nm3
ppm
Averaging Time
TSP
230
-
24 hrs
90
1 year
PM10 150 - 24 hrs 60 1 year SO2 180 0.07 24 hrs 80 0.03 1 year NO2 150 0.08 24 hrs Ozone 140 0.07 1 hr 60 0.03 8 hrs CO 35 mg/Nm3 30 1 hr 10 mg/Nm3 9 8 hrs Pb 1.5 - 3 months 1.0 1 year
Lead (Pb)Lead (Pb)
� Harmful environmental pollutant.
� Poisonous metal.
� Has been shown to cause damage to the nervous connections especially in young nervous connections especially in young children resulting in blood and brain disorders.
PNRI Air Pollution Research at PNRI Air Pollution Research at the Valenzuela Sampling Sitethe Valenzuela Sampling Sitethe Valenzuela Sampling Sitethe Valenzuela Sampling Site
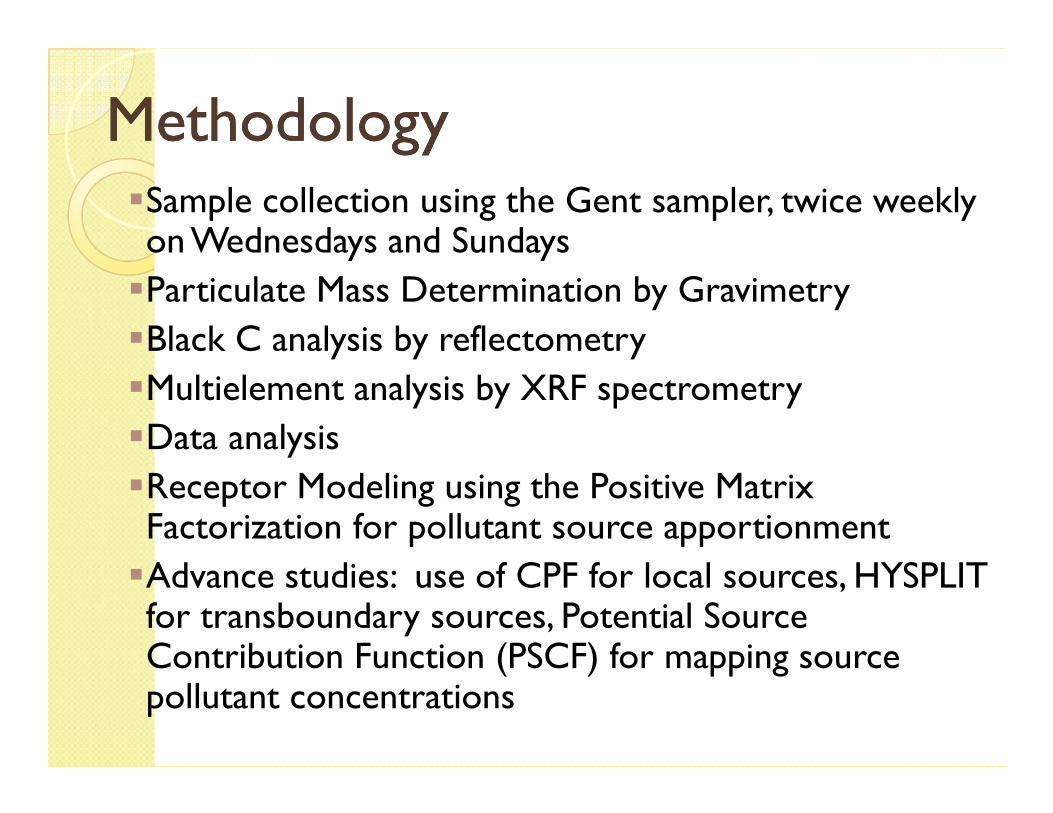
MethodologyMethodology�Sample collection using the Gent sampler, twice weekly on Wednesdays and Sundays
�Particulate Mass Determination by Gravimetry
�Black C analysis by reflectometry
�Multielement analysis by XRF spectrometry �Multielement analysis by XRF spectrometry
�Data analysis
�Receptor Modeling using the Positive Matrix Factorization for pollutant source apportionment
�Advance studies: use of CPF for local sources, HYSPLIT for transboundary sources, Potential Source Contribution Function (PSCF) for mapping source pollutant concentrations

PNRI air monitoring stationsPNRI air monitoring stationsValenzuela 2/04 to date
Ateneo de ManilaUniversity (10/98 – to date)
Map of Metro Manila air shed from www.hangin.org
NAMRIA, (03/04 to 03/06)(10/09 – start with EMB)
Poveda Learning Center (10/01 to date)
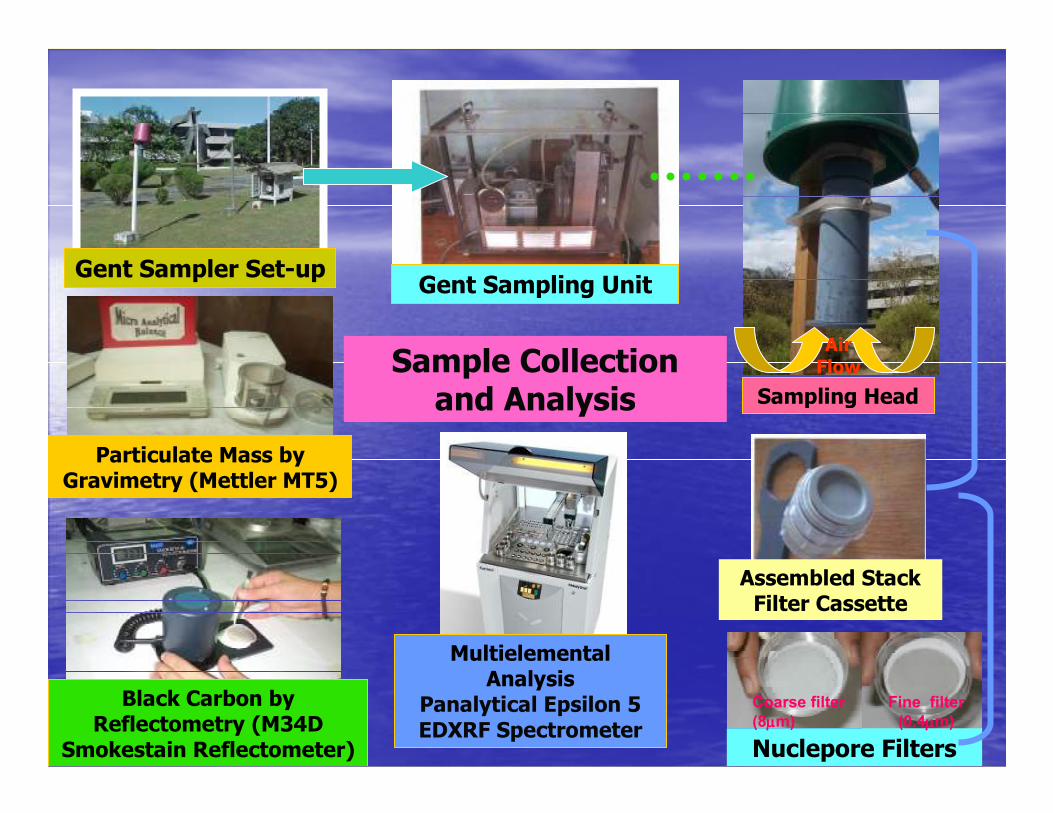
Sampling Head
Sample Collection and Analysis
Gent Sampler Set-upGent Sampling Unit
Air Flow
Sampling Head
Sample Collection and Analysis
Gent Sampler Set-upGent Sampling Unit
Air Flow
Particulate Mass by Gravimetry (Mettler MT5)
Black Carbon by Reflectometry (M34D
Smokestain Reflectometer)
Multielemental Analysis
Kevex 771-EDX Spectrometer
Nuclepore Filters
and Analysis
Coarse filter (8µµµµm)
Assembled Stack Filter Cassette
Fine filter
(0.4µµµµm)
Sampling Head
Particulate Mass by Gravimetry (Mettler MT5)
Black Carbon by Reflectometry (M34D
Smokestain Reflectometer)
MultielementalAnalysis
Panalytical Epsilon 5 EDXRF Spectrometer
Nuclepore Filters
and Analysis
Coarse filter
(8µµµµm)
Assembled Stack Filter Cassette
Fine filter
(0.4µµµµm)
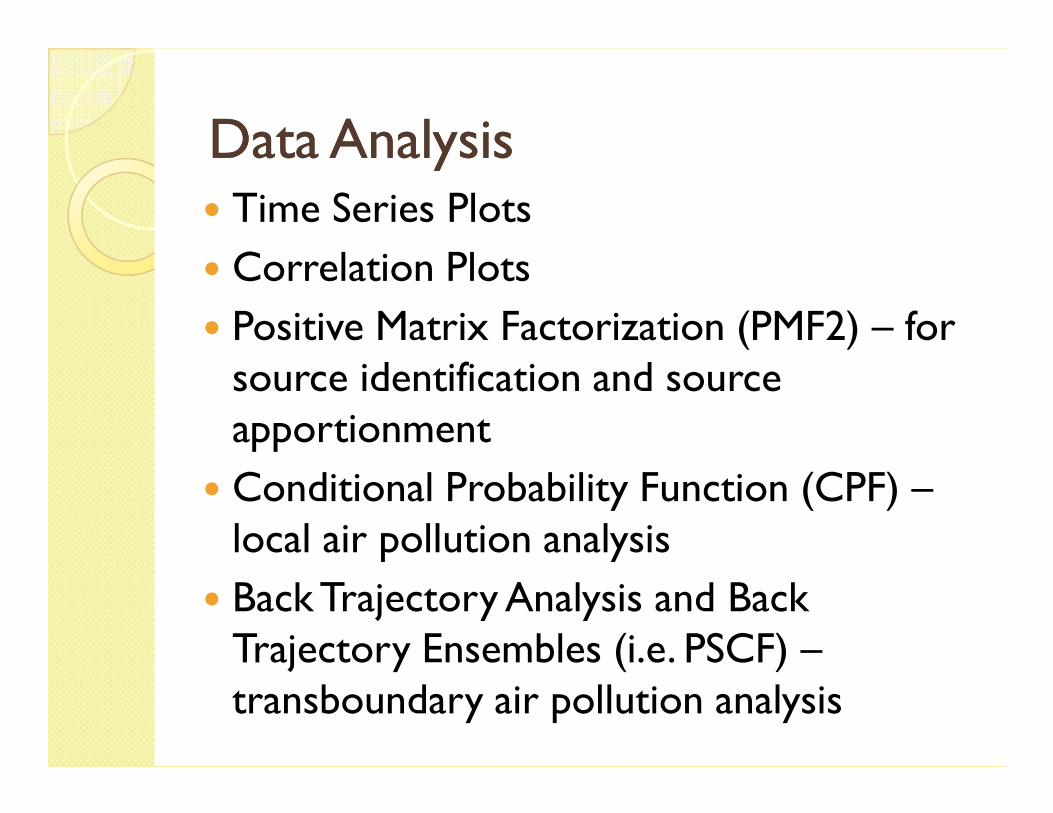
Data AnalysisData Analysis� Time Series Plots
� Correlation Plots
� Positive Matrix Factorization (PMF2) – for source identification and source apportionmentapportionment
� Conditional Probability Function (CPF) –local air pollution analysis
� Back Trajectory Analysis and Back Trajectory Ensembles (i.e. PSCF) –transboundary air pollution analysis
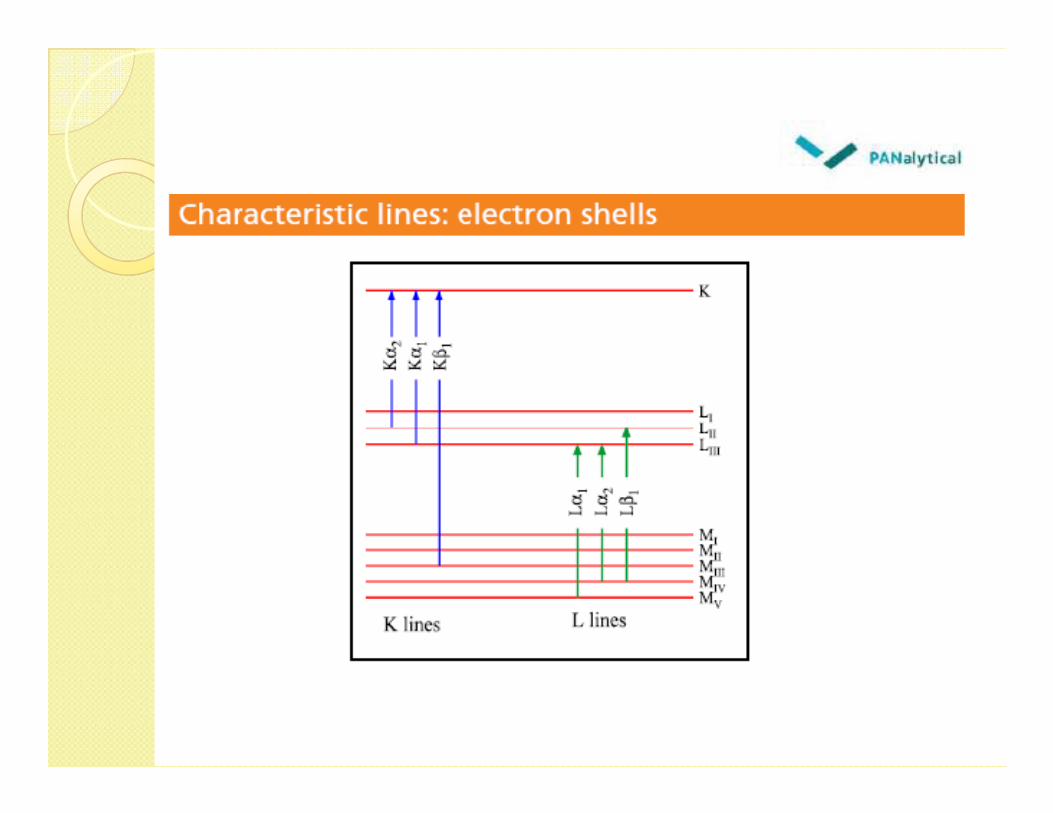
Principles of Principles of XX--ray ray FluorescenceFluorescence
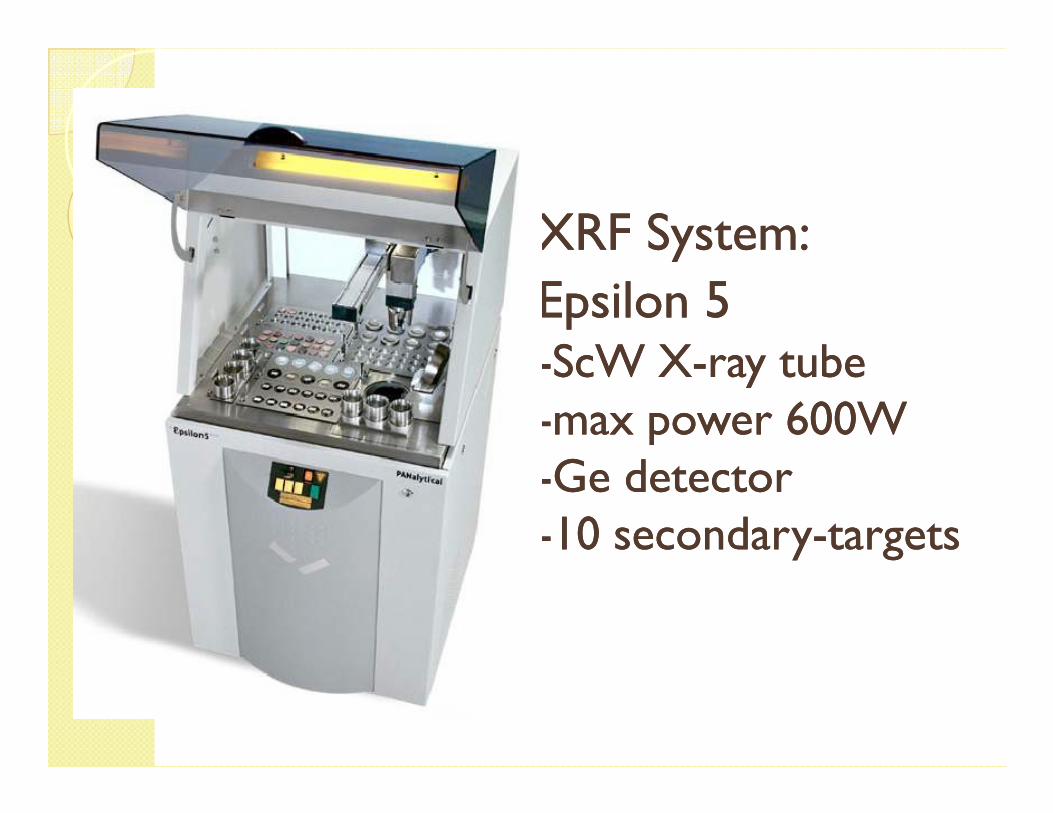
XRF XRF System:System:
Epsilon 5Epsilon 5--ScWScW XX--ray tuberay tube--max power 600Wmax power 600W--max power 600Wmax power 600W--GeGe detectordetector--10 secondary10 secondary--targetstargets
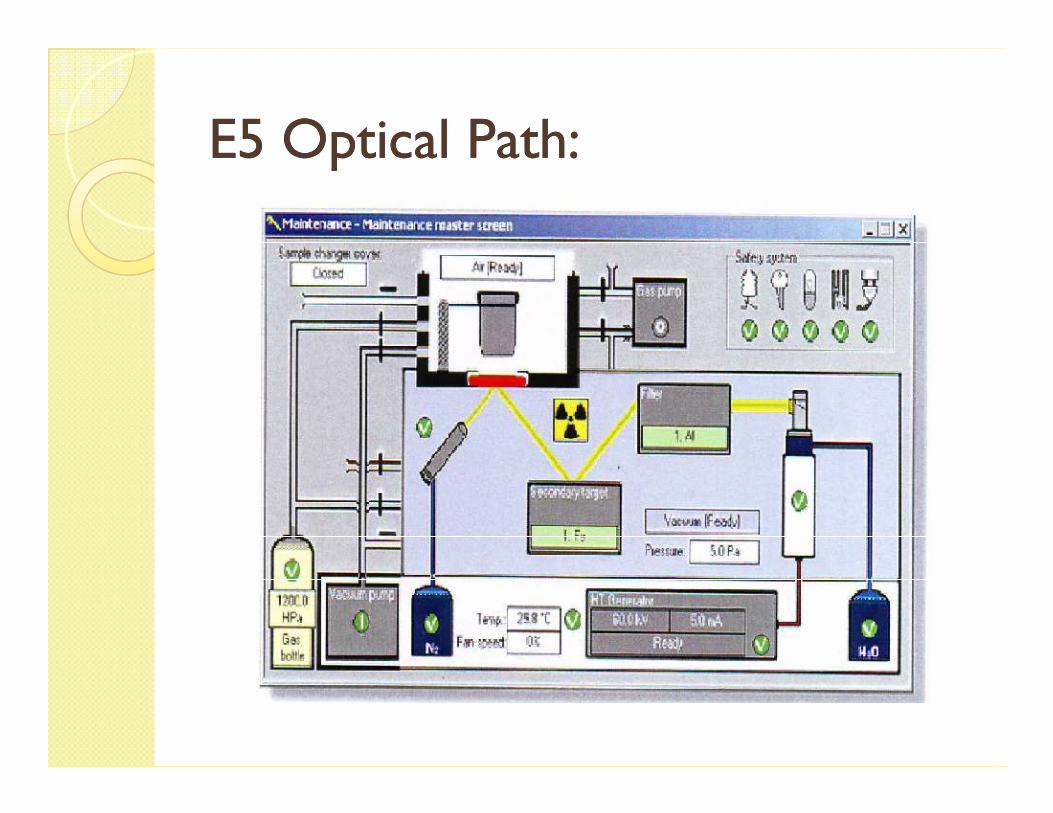
E5 Optical Path:E5 Optical Path:
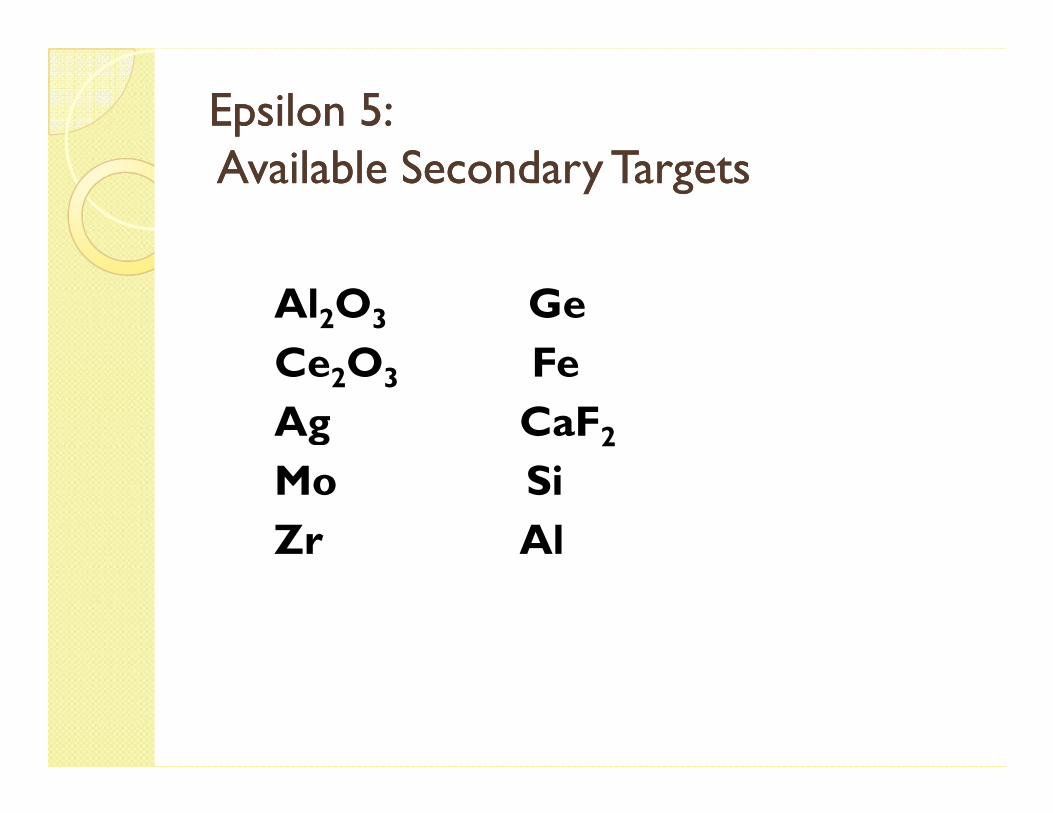
Epsilon 5: Epsilon 5: Available Secondary TargetsAvailable Secondary Targets
Al2O3 Ge
Ce2O3 Fe
Ag CaFAg CaF2Mo Si
Zr Al
Quantitation:Quantitation:
�Classical Calibration
�Auto Quantify or “standardless” quantitation (uses Fundamental quantitation (uses Fundamental Parameters)
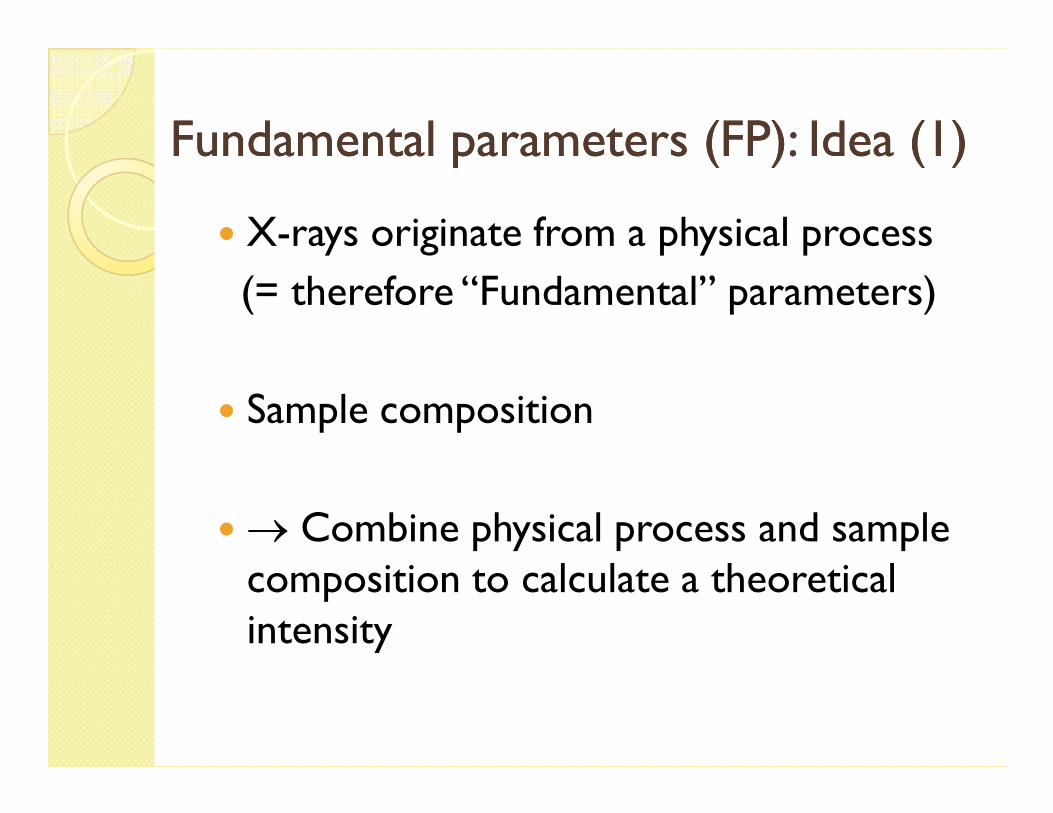
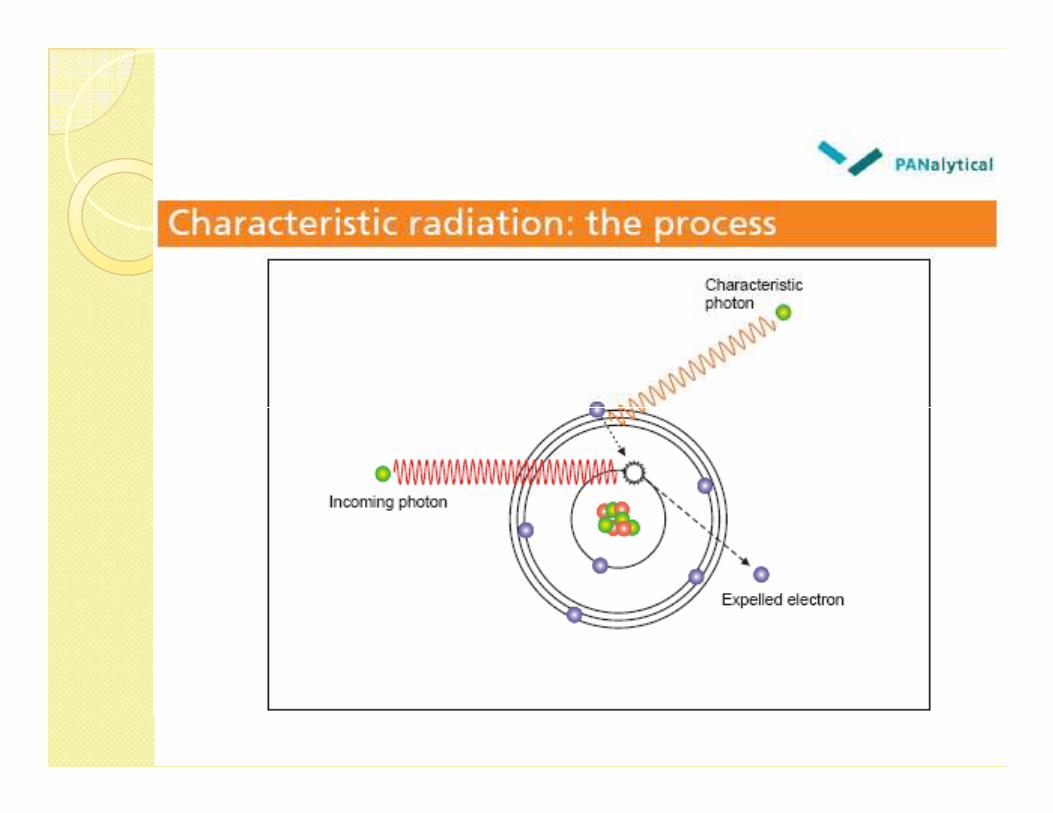
Fundamental parameters (FP): Idea (1)Fundamental parameters (FP): Idea (1)
� X-rays originate from a physical process
(= therefore “Fundamental” parameters)
� Sample composition� Sample composition
� → Combine physical process and sample composition to calculate a theoretical intensity
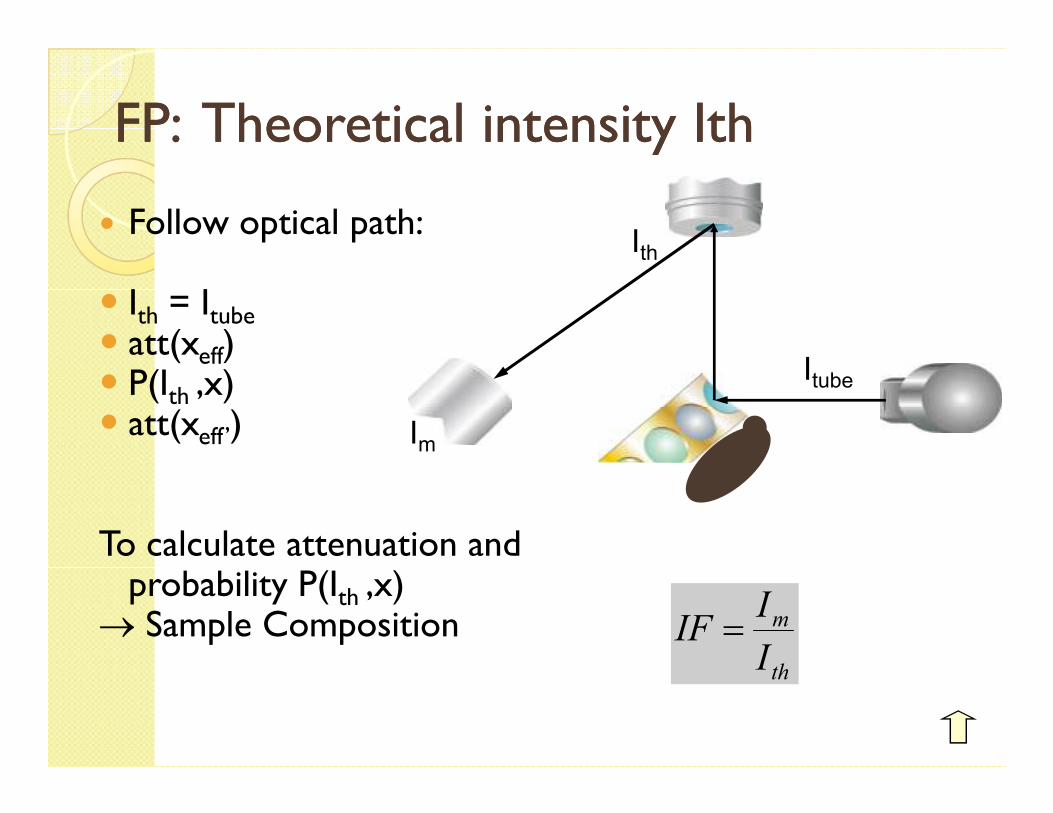
FP: Theoretical intensity IthFP: Theoretical intensity Ith
� Follow optical path:
� Ith = Itube
� att(xeff) � P(Ith ,x)� att(x )
TubeItube
Ith
th
� att(xeff’)
To calculate attenuation and probability P(Ith ,x)
→ Sample Composition th
m
I
IIF =
TargetIm
Sample SpectraSample Spectraof SRM2783 of SRM2783
(Air Particulate on Filter Media)(Air Particulate on Filter Media)(Air Particulate on Filter Media)(Air Particulate on Filter Media)
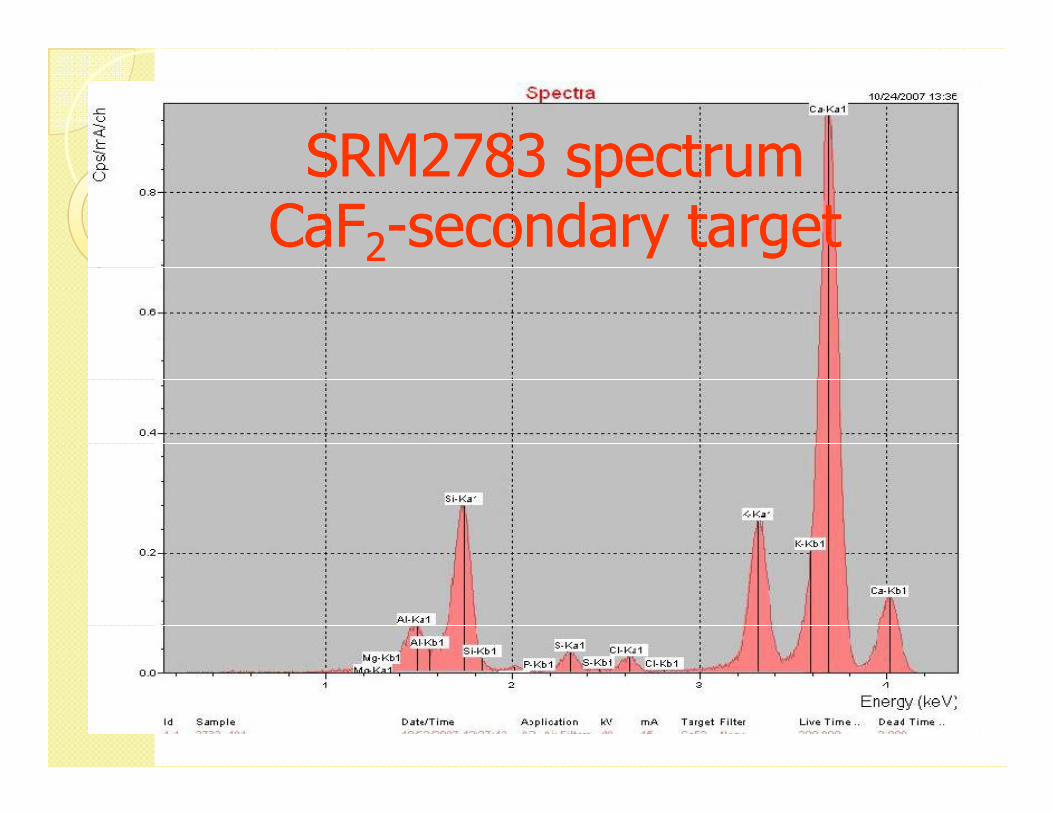
SRM2783 spectrum SRM2783 spectrum CaFCaF22--secondary targetsecondary target
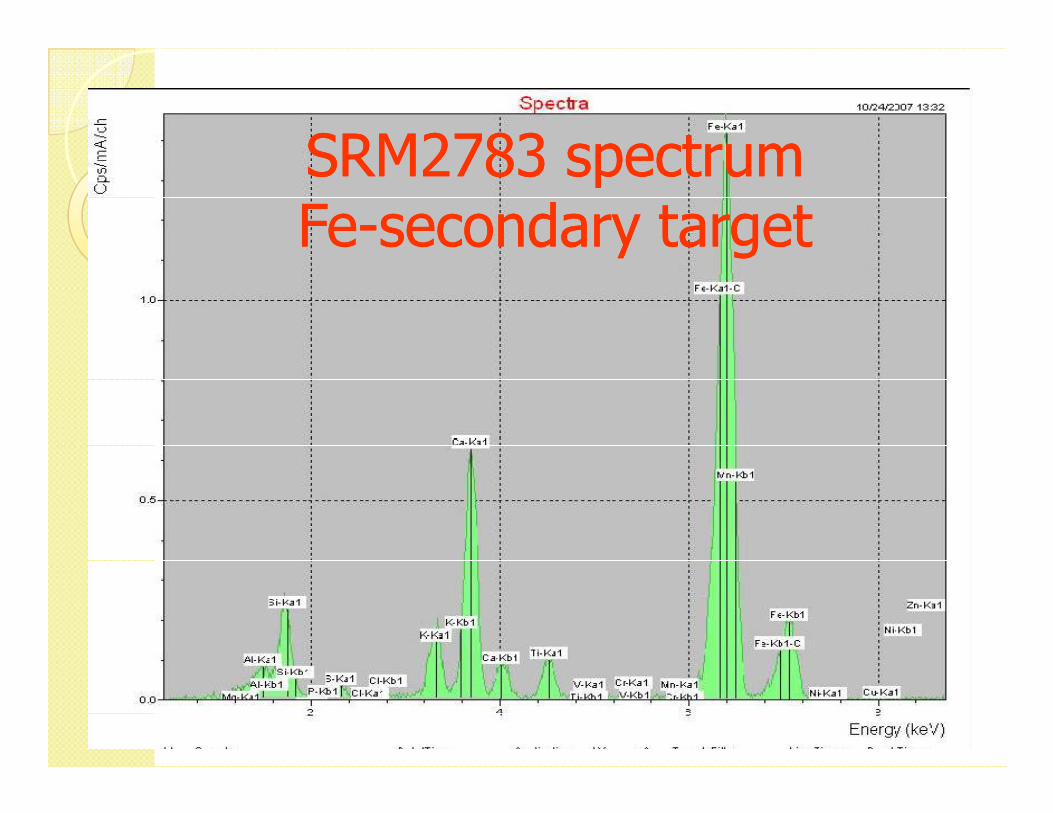
SRM2783 spectrum SRM2783 spectrum FeFe--secondary targetsecondary target
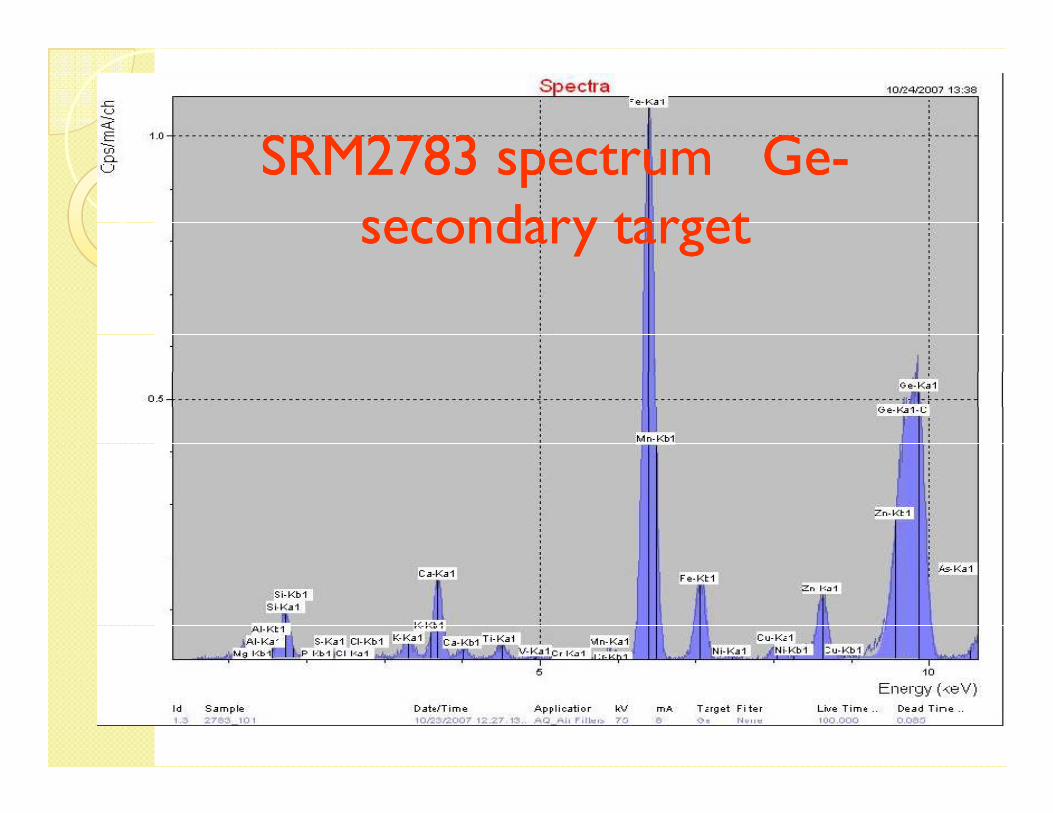
SRM2783 spectrum GeSRM2783 spectrum Ge--secondary targetsecondary target
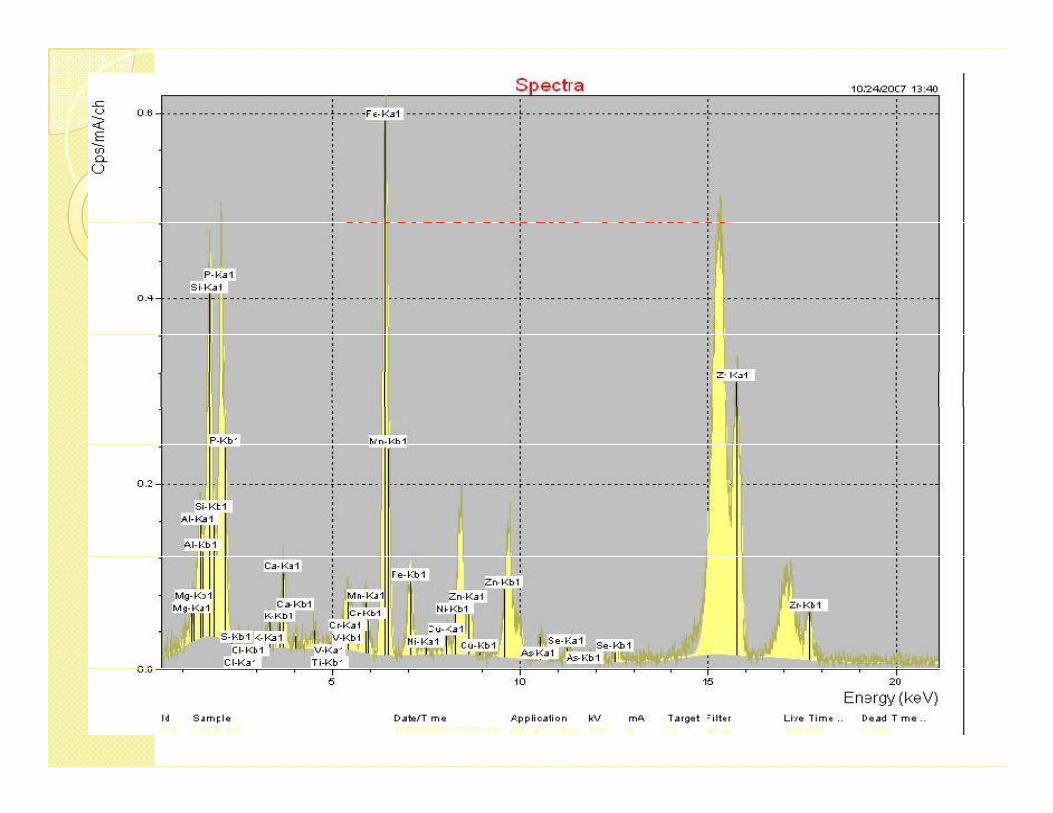
SRM2783 spectrum ZrSRM2783 spectrum Zr--secondary targetsecondary target
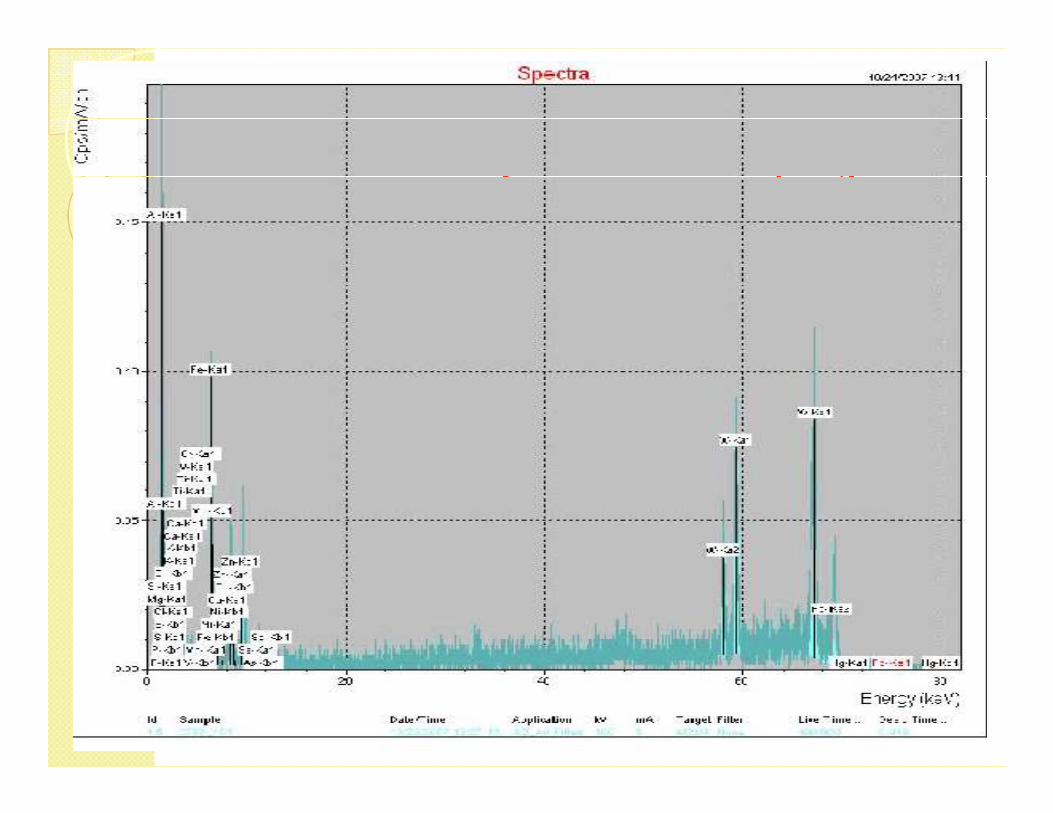
SRM2783 spectrum AlSRM2783 spectrum Al22OO33--secondary targetsecondary target
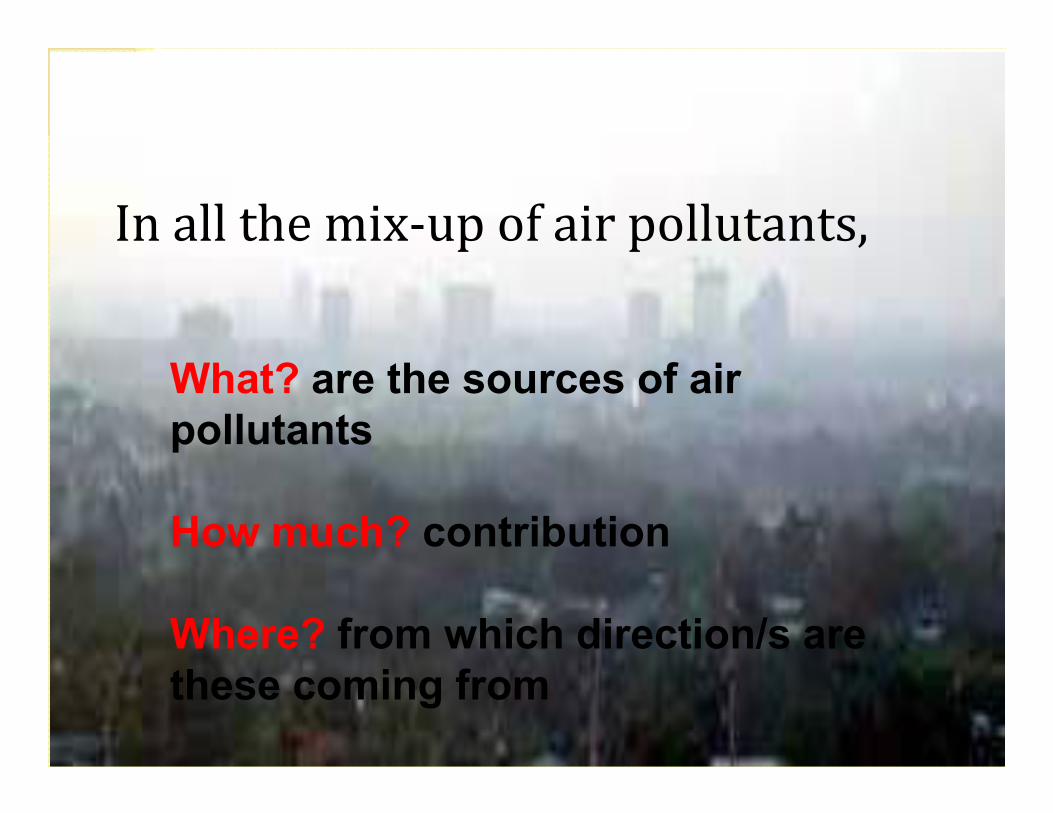
In all the mixIn all the mix--up of air pollutants,up of air pollutants,
What? are the sources of air
pollutants
In all the mix-up of air pollutants,
pollutants
How much? contribution
Where? from which direction/s are
these coming from

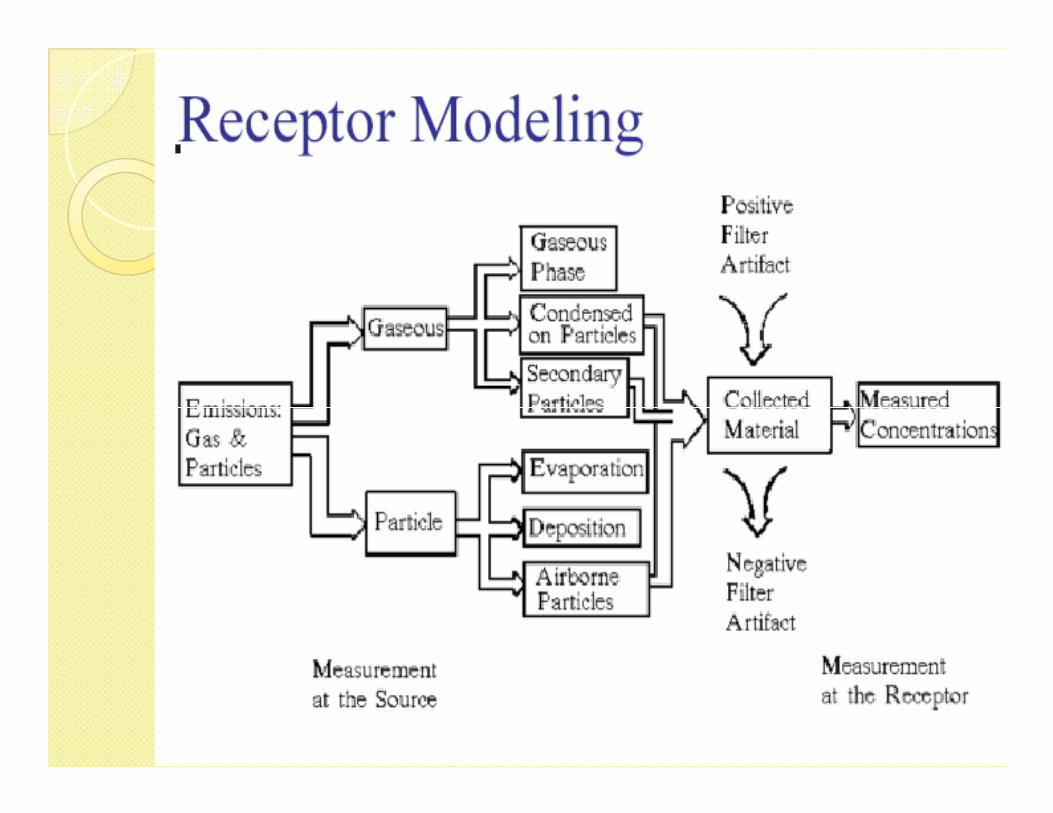
Receptor ModellingReceptor Modelling
Receptor models are focused on the behavior of the ambient environment at the point of impact as opposed to the source-oriented models (or dispersion source-oriented models (or dispersion models) that focus on the transport, dilution, and transformations that begin at the source and follow the pollutants to the sampling or receptor site.
POSITIVE POSITIVE MATRIX MATRIX FACTORIZATION FACTORIZATION
(PMF)(PMF)
� positively constrained factor analysis with � positively constrained factor analysis with individual weighting of matrix elements
� takes into account standard deviations of observed data values
Interpretation Interpretation of PMF Resultsof PMF Results
� Source composition factor: F factor
◦ Source identification
Source contribution factor: G factor� Source contribution factor: G factor
◦ Times variations of source contributions
◦ Source apportionment (with MLR analysis)
RESULTSRESULTS� PM10 and PM2.5 Levels in Valenzuela
� Pb Levels in Valenzuela
� Source identification and source apportionment in Valenzuelaapportionment in Valenzuela
� Locating pollution sources
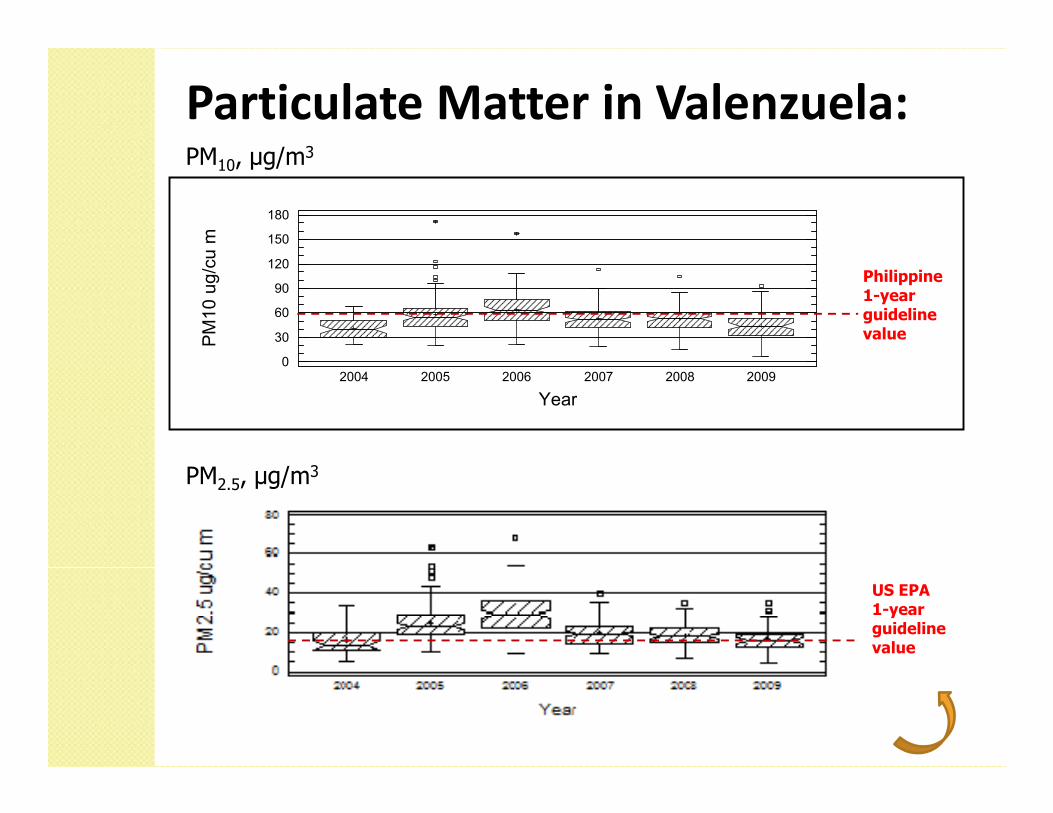
PM10, µg/m3
Particulate Matter in Valenzuela:
PM
10
ug
/cu
m
Year
2004 2005 2006 2007 2008 20090
30
60
90
120
150
180
Philippine 1-year guideline value
PM2.5, µg/m3
Year
US EPA 1-year guideline value
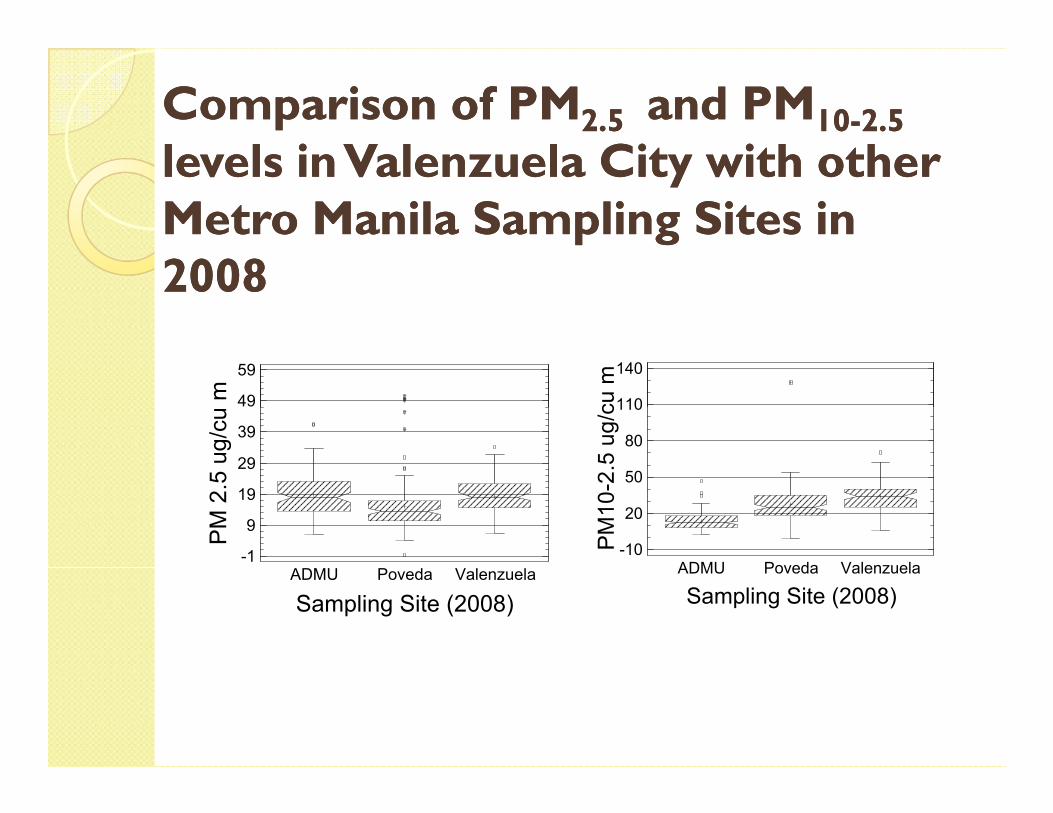
Comparison of PMComparison of PM2.5 2.5 and PMand PM1010--2.52.5
levels in Valenzuela City with other levels in Valenzuela City with other Metro Manila Sampling Sites in Metro Manila Sampling Sites in 2008 2008
PM
2.5
ug
/cu
m 49
59
PM
10
-2.5
ug
/cu
m
110
140
PM
2.5
ug
/cu
m
Sampling Site (2008)
ADMU Poveda Valenzuela-1
9
19
29
39
49
PM
10
-2.5
ug
/cu
mSampling Site (2008)
ADMU Poveda Valenzuela-10
20
50
80
110
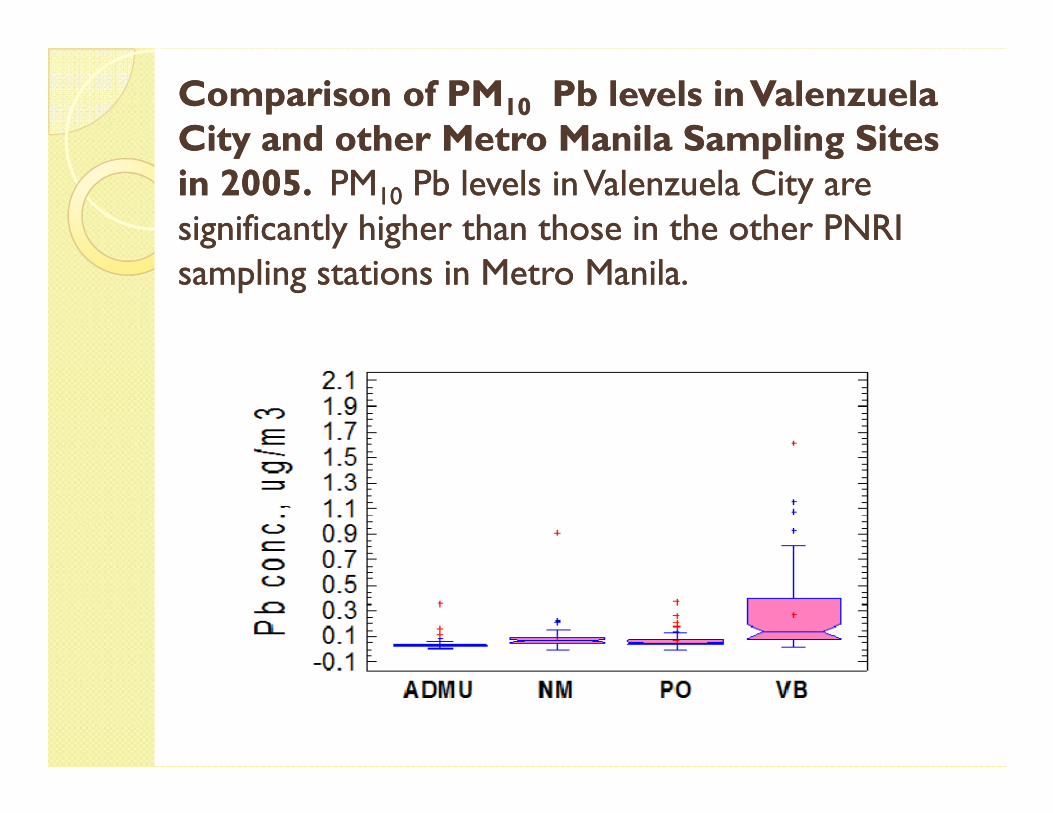
Comparison of PMComparison of PM1010 PbPb levels in Valenzuela levels in Valenzuela City and other Metro Manila Sampling Sites City and other Metro Manila Sampling Sites in in 20052005. . PMPM1010 PbPb levels in Valenzuela City are levels in Valenzuela City are significantly higher than those in the other PNRI significantly higher than those in the other PNRI sampling stations in Metro Manila. sampling stations in Metro Manila.
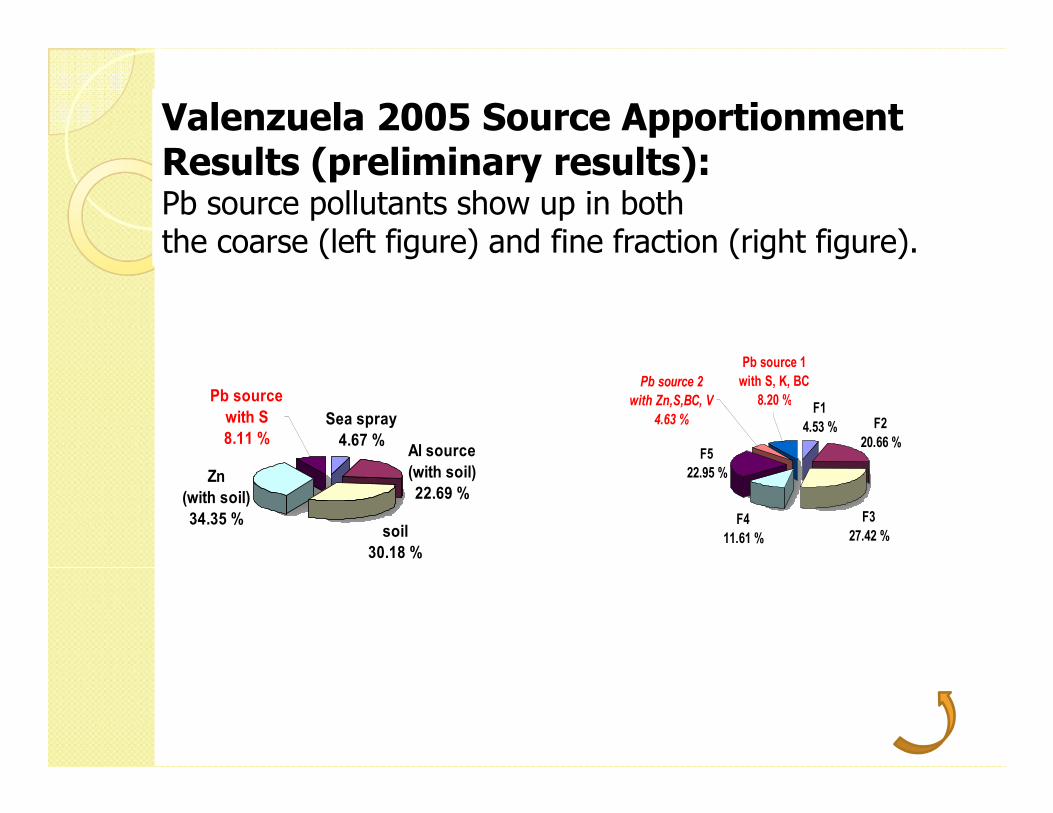
Valenzuela 2005 Source Apportionment Results (preliminary results):Pb source pollutants show up in both the coarse (left figure) and fine fraction (right figure).
Pb source
with S
Pb source 2
with Zn,S,BC, V
Pb source 1
with S, K, BC
8.20 %F1
Sea spray
4.67 %
with S
8.11 %Al source
(with soil)
22.69 %Zn
(with soil)
34.35 %soil
30.18 %
F5
22.95 %
F4
11.61 %
with Zn,S,BC, V
4.63 %
8.20 %F1
4.53 % F2
20.66 %
F3
27.42 %
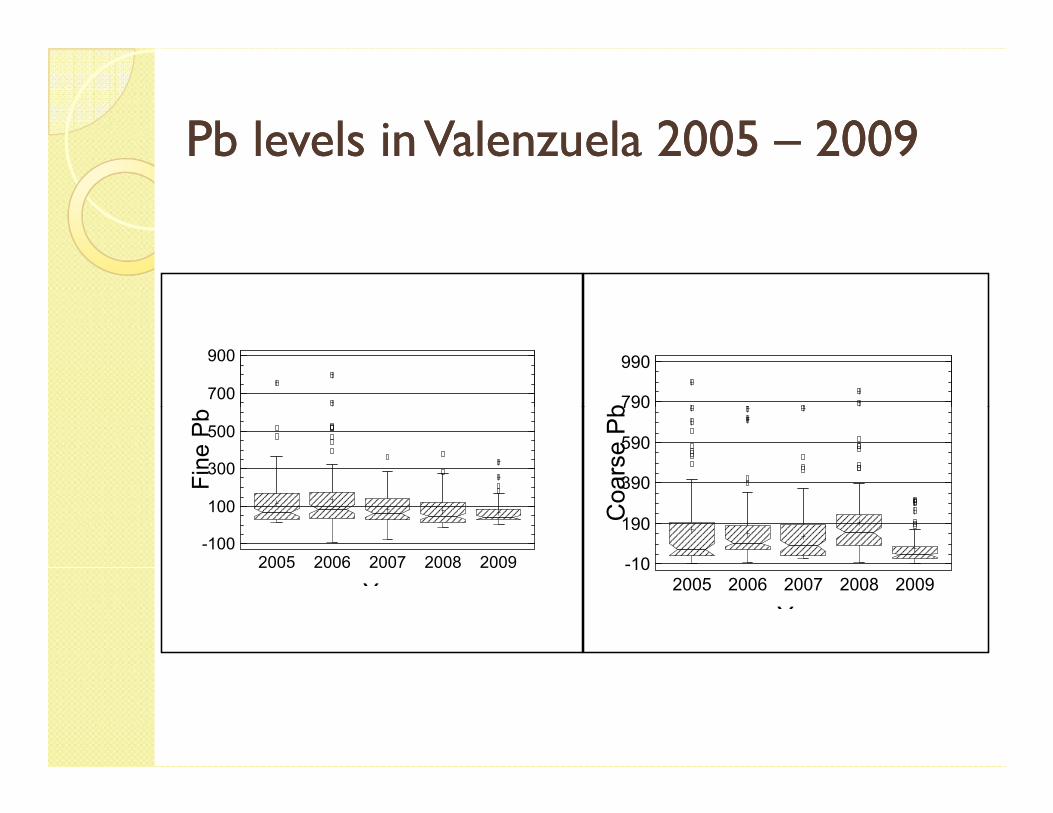
PbPb levels in Valenzuela 2005 levels in Valenzuela 2005 –– 20092009
700
900
Co
ars
e P
b790
990
Fin
e P
b
Year
2005 2006 2007 2008 2009-100
100
300
500
Co
ars
e P
bYear
2005 2006 2007 2008 2009-10
190
390
590
790
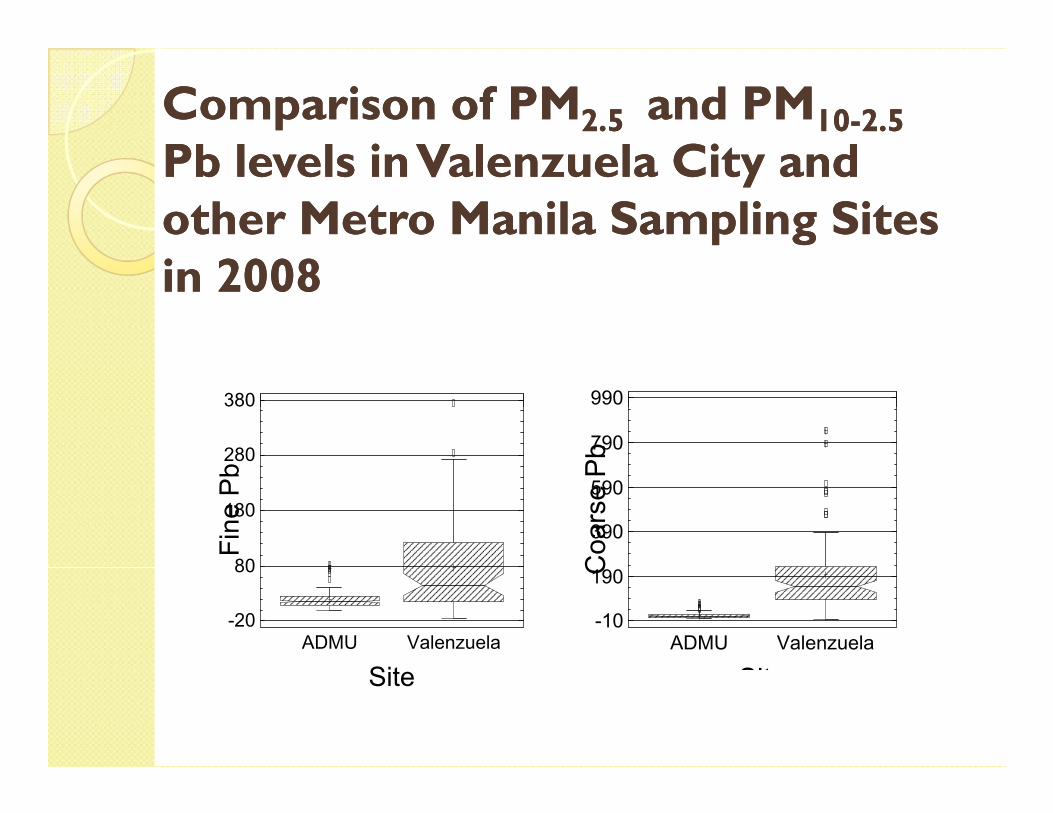
Comparison of PMComparison of PM2.5 2.5 and PMand PM1010--2.52.5
PbPb levels in Valenzuela City and levels in Valenzuela City and other Metro Manila Sampling Sites other Metro Manila Sampling Sites in 2008in 2008
380
990
Fin
e P
b
Site
ADMU Valenzuela
-20
80
180
280
380
Co
ars
e P
b
Site
ADMU Valenzuela-10
190
390
590
790
990
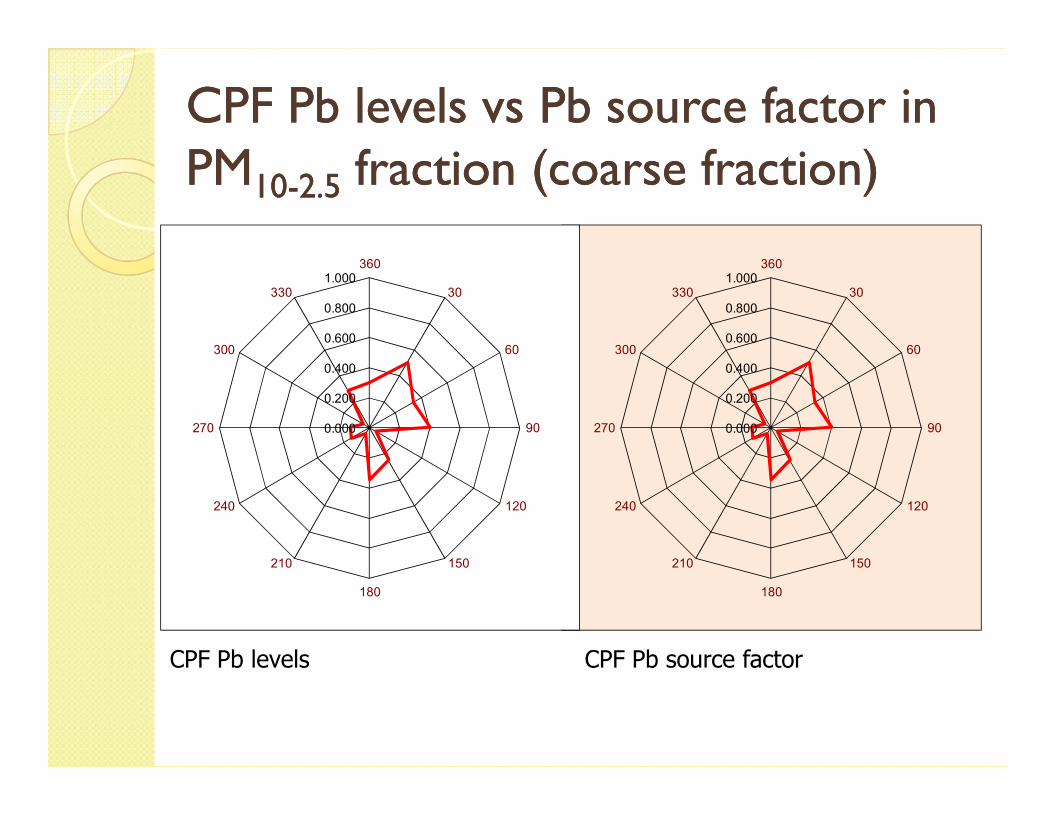
CPF CPF PbPb levels vs levels vs PbPb source factor in source factor in PMPM1010--2.52.5 fraction (coarse fraction)fraction (coarse fraction)
0.200
0.400
0.600
0.800
1.000360
30
60300
330
0.200
0.400
0.600
0.800
1.000360
30
60300
330
CPF Pb levels CPF Pb source factor
0.000 90
120
150
180
210
240
2700.000 90
120
150
180
210
240
270
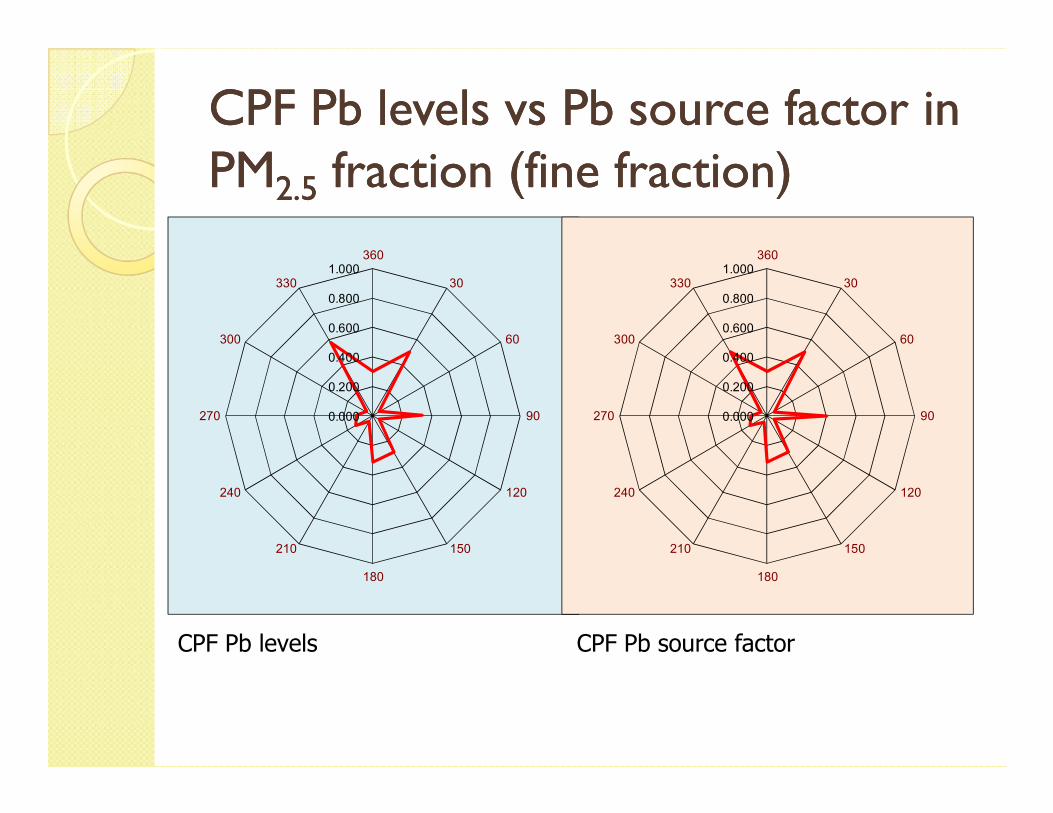
CPF CPF PbPb levels vs levels vs PbPb source factor in source factor in PMPM2.52.5 fraction (fine fraction)fraction (fine fraction)
0.200
0.400
0.600
0.800
1.000360
30
60300
330
0.200
0.400
0.600
0.800
1.000360
30
60300
330
0.000 90
120
150
180
210
240
270 0.000 90
120
150
180
210
240
270
CPF Pb levels CPF Pb source factor
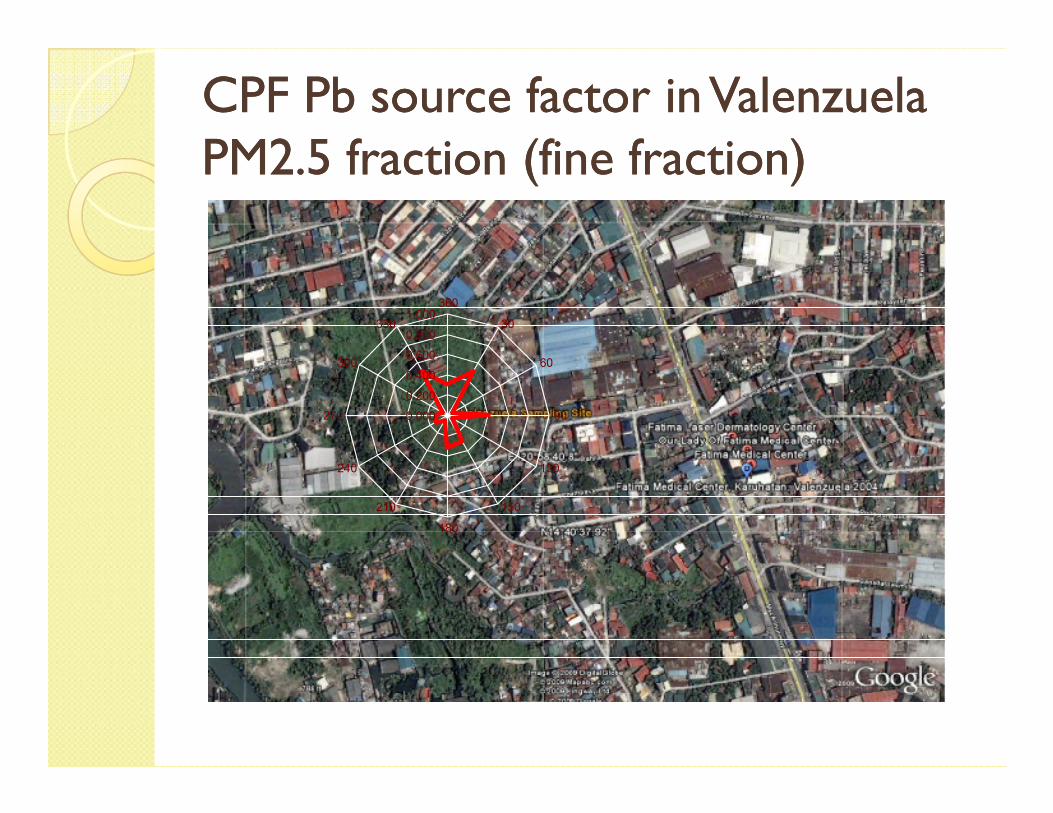
CPF CPF PbPb source factor in Valenzuela source factor in Valenzuela PMPM22..5 5 fraction (fine fraction)fraction (fine fraction)
0.200
0.400
0.600
0.800
1.000360
30
60300
330
0.000 90
120
150
180
210
240
270
Conclusions and RecommendationsConclusions and RecommendationsHigher air particulate and Pb levels are observed for
the Valenzuela sampling site.
The high Pb levels in the area is a reflection of Pb pollutant sources found in both the fine and the coarse fractions by receptor modeling.
Results in Valenzuela City indicate the need to do a more comprehensive evaluation of the area to
Results in Valenzuela City indicate the need to do a more comprehensive evaluation of the area to determine the sources of Pb and formulate measures to bring down its ambient levels.
There is a need for further research to study the health impacts of the elevated levels of Pb in Valenzuela to the population in the surrounding areas.
AcknowledgementsAcknowledgements
� Equipment and manpower development were funded by the International Atomic Energy Agency (IAEA) through the technical cooperation project on “Air Pollution Source Apportionment Using Nuclear and Related Analytical Techniques”.
� The project on “Particulate Matter Monitoring by Nuclear and Related Analytical Techniques and Source and Related Analytical Techniques and Source Apportionment in Valenzuela, Metro Manila” was funded by the Philippine Council for Industry and Energy Research and Development (PCIERD).
� Valenzuela sampling site is co-located with the automated air sampling station of the Environmental Management Bureau.
� Staff in-charge of regular sampling activities and maintenance of the air samplers are Ms. Gloria Jimenez and Mr. Danilo Cuyco.

Thank Thank you you for your attention!for your attention!for your attention!for your attention!