recentralization of central tokyo and planning...
TRANSCRIPT

Recentralization of Central Tokyo
and Planning Responses
Sang Kyung An
Introduction
Since the late 1990s,there have been several spatial transformations in Tokyo
metropolitan region and in the lives of its inhabitants. Central to the transforma-
tions has been a rapid population influx into inner-city areas whose populations
have steadily declined over the last three decades,and high-rise construction boom
in central Tokyo.
The Japanese bubble economy collapsed in the early 1990s and long economic
recession followed. The period from then to early 2000s has been labeled the‘lost
decade’. In the midst of the extended stagnation,it is ironic that all around the city,
but principally in inner-city areas,skyscrapers and population recovery have been
occurring. In recent years, the population increase in inner-city areas has been
growing at a greater pace than suburban ones. At first glance, the phenomenon
surely seems like gentrification process that has mainly been experienced in other
advanced capitalist cities, the process of physical renovation and neighborhood
change accompanying the influx of affluent people into deteriorating areas that may
displace poorer residents. Researchers argue that the nature of the process
identified in central Tokyo differs from that of western countries including racial
and class components(Waley 1997;Yabe 2003).
However,gentrification is no longer isolated or restricted to a few advanced
cities. Today,it has gradually evolved into a crucial urban regeneration strategy
for global interurban competition in cities around the world (Smith 2002).
Currently,central to the urban restructuring in Tokyo is urban regeneration strategy
to enhance its global economic competitiveness through state interventions. There-
fore,it is difficult to say that recentralization phenomenon and new developments
in Tokyo in recent years have no relationship with the wave of gentrification as a
1 Journal of Regional Development Studies(2008)
Faculty of Regional Development Studies,Toyo University,Japan
global urban strategy. It is also interesting that the phenomenon is occurring in
large cities across the country,not only in Tokyo.
First, this paper examines the changing pattern and its nature of population
trends in Tokyo at regional and local scale,focusing on population recovery in city
center. Then it seeks the causes of recentralization of central Tokyo,in the respect
of both market forces and public interventions and its consequences. Second,the
planning responses to socio-economic changes in 1990s are reviewed and their
impacts on urban structure and built environment are explored. Third,this paper
also examines the process of urban generation strategy in Japan through private
sector property development and its relationship with spatial planning since 2000.
The implications of these findings are then explored.
The Changing Faces of Tokyo since the Late 1990:Population Recentralization
Geographical Context
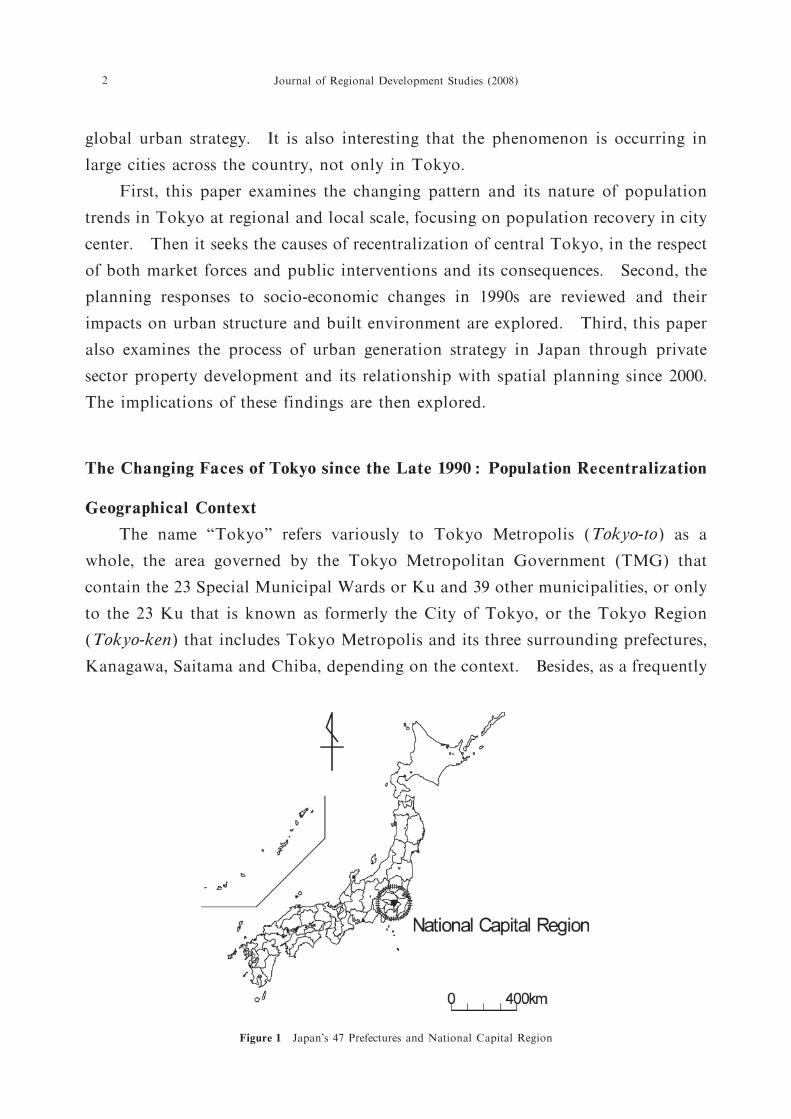
The name “Tokyo”refers variously to Tokyo Metropolis (Tokyo-to) as a
whole, the area governed by the Tokyo Metropolitan Government (TMG) that
contain the 23 Special Municipal Wards or Ku and 39 other municipalities,or only
to the 23 Ku that is known as formerly the City of Tokyo,or the Tokyo Region
(Tokyo-ken)that includes Tokyo Metropolis and its three surrounding prefectures,
Kanagawa,Saitama and Chiba,depending on the context. Besides,as a frequently
Journal of Regional Development Studies(2008)
Figure 1 Japan’s 47 Prefectures and National Capital Region
2

being used term,there is the National Capital Region (Shuto-ken)which includes
the Tokyo Region plus Ibaraki,Tochigi,Gunma and Yamanashi prefectures(Fig-
ure 1).
The term“Central Tokyo”in this paper is referred to as the 23 Ku of Tokyo
Metropolis. The area has 8.66 million residents in October 2007 that accounts for
67.8% of total population (12,790,000)of Tokyo Metropolis. The Tokyo Region
has 36.47 million populations at 2005 Census,the world’s most populous metropoli-
tan area and the National Capital Region has 44.37 million people that represent 28.
5% and 34.7% of the national total population,respectively(Table 1).
AN:Recentralization of Central Tokyo and Planning Responses
Figure 2 Tokyo Metropolis and Central Tokyo (23 Ku)
Table 1 Population of Tokyo Region and National Capital Region (figures in millions)
1980 1985 1990 1995 2000 2005
National Capital Region 35.70 37.62 39.40 40.40 41.32 42.38
growth rate 6.2% 5.3% 4.7% 2.6% 2.3% 2.6%
Tokyo Region 28.70 30.27 31.80 32.57 33.42 34.48
growth rate 6.2% 5.5% 5.1% 2.4% 2.6% 3.22%
Saitama prefecture 5.42 5.86 6.40 6.76 6.94 7.05
Chiba prefecture 4.73 5.15 5.55 5.80 5.93 6.06
Kanagawa Prefecture 6.92 7.43 7.98 8.25 8.49 8.79
Tokyo Metropolis 11.62 11.83 11.85 11.77 12.06 12.58
Central Tokyo 8.35 8.35 8.16 7.97 8.14 8.49
Source:Ministry of Internal Affairs and Communications,Bureau of Statistics,Population Census of Japan,
Each year.
101:Chiyoda 102:Chuo 103:Minato
104:Shinjuku 105:Bunkyo 106:Taito
107:Sumida 108:Koto 109 :Shinagawa 110:Meguro 111:Ota
112:Setagaya 113:Shibuya 114:Nakano 115:Suginami
116:Toshima 117:Kita 118:Arakawa 119 :Itabashi 120:Nerima
121:Adachi 122:Katsushika 123:Edogawa
3

Nature of Changes in Population and Residential Trends
This section examines the nature of changing patterns in population in Tokyo
at two scales,Regional and local scale. To begin with,let’s look at the changes in
the National Capital Region (NCR) and Tokyo region as a regional and sub-
regional scale. In the NCR, population in-
creased in the period from 1995 to 2000 in all
prefectures(Figure 3). However,for the period
from 2000 to 2005,while only Tokyo metropolis
(4.2%)and Kanagawa prefecture(3.5%)experi-
enced higher growth rate than the previous five
year, Gunma, Ibaraki, Yamanashi prefectures
that are far away from Tokyo lost the residents.
Similar patterns were also shown in Tokyo
region, although population has increased in
the entire region (Table 1 and Figure 4).
Population has been decreasing at suburban
areas of three prefectures,principally of Saitama
prefecture while it has been on a strong increas-
ing trend in inner-city areas of Tokyo.
Compared with the changes between 1990 and
1995 when there has been a hollowing out at the
Figure 3 Population Changes in
NCR,1995-2005
Source:Ibid,2005
Figure 4 Population Changes in Tokyo Region
Source:Ministry of Infrastructure,Land and Transport (MILT),
White Paper on National Capital Region 2006,2006.6
4 Journal of Regional Development Studies(2008)
center and growth in the suburban areas,the trends have been completely reverse
since the late 1990. It reveals that the roles of suburban areas which has played to
accommodate the population flowing in the capital region and contribute to
restraining a rapid population increase in central Tokyo has gradually been
weakening (MLIT 2006).
Next,looking at changes in population in central Tokyo (23 Ku),population
level has been rapidly rising after many years of decline. In three core areas,
particularly,the population growth rate was so high.The proportional population
growth and decline occurred much faster and higher,the closer to downtown(Table
2). For example,while three core areas where once the growth rate declined by
-18.16% grew by 21.67% between 2000 and 2005,those of the 5 inner Ku and 15
Table 2 Change in Population in Tokyo Metropolis(in percentages)
1975-1980 1980-1985 1985-1990 1990-1995 1995-2000 2000-2005
3 core Ku -6.22 -4.04 -18.16 -8.43 10.01 21.67
5 inner Ku -7.85 -3.29 -9.60 -6.17 2.37 4.67
15 outer Ku -2.37 0.86 -0.21 -1.55 -1.77 3.63
Central Tokyo -3.40 0.03 -2.29 -2.40 2.10 4.36
Tokyo Metropolis -0.43 1.81 0.17 -0.68 2.46 4.31
Source:Ministry of Internal Affairs and Communications,Bureau of Statistics,Population Census of Japan,Each
year,
Chiyoda,Chuo,and Minato Ku Shibuya,Shinjuku,Toshima,Bunkyo,and Taito Ku
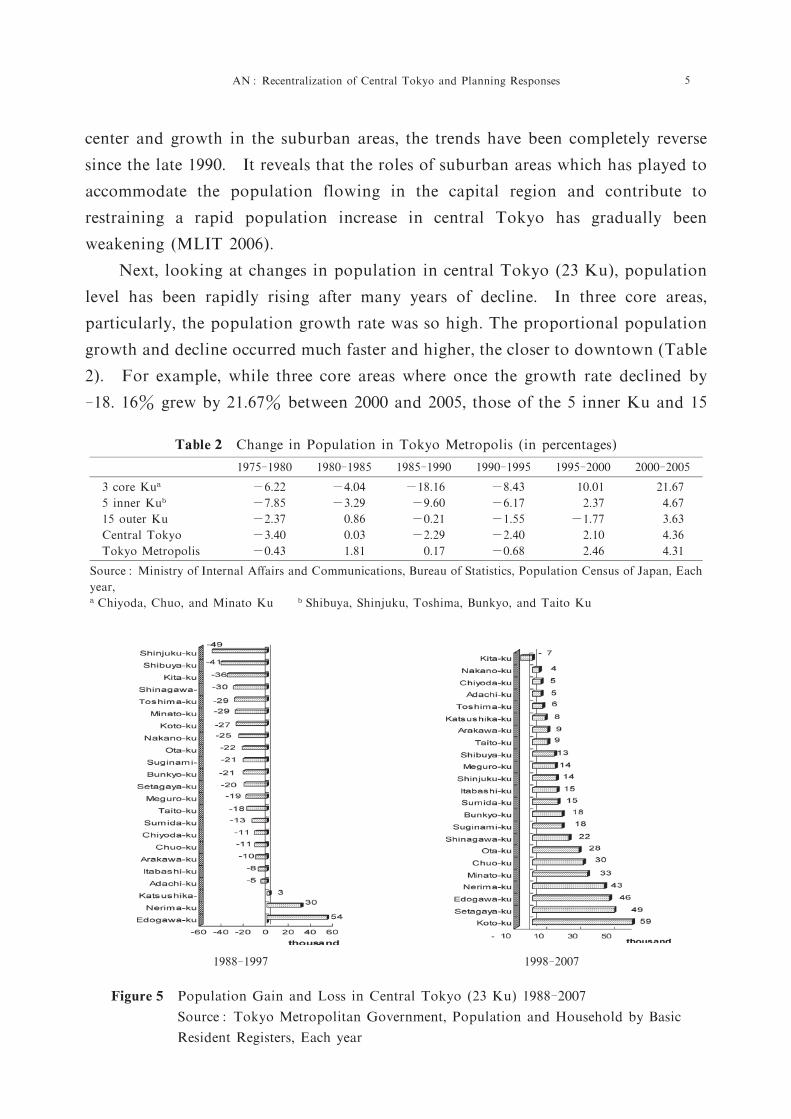
Figure 5 Population Gain and Loss in Central Tokyo (23 Ku)1988-2007
Source:Tokyo Metropolitan Government,Population and Household by Basic
Resident Registers,Each year
1988-1997 1998-2007
5 AN:Recentralization of Central Tokyo and Planning Responses

outer Ku increased to 4.67% and 3.63% from-9.60% and-0.21% during the same
period,respectively.
Figure 5 shows a comparison of real numeric population change in central
Tokyo during the two periods, 1988-1997 and 1998-2007, which has completely
different features. Between 1988 and 1997, while only three Ku-Katsushika,
Nerima,and Edogawa Ku-experienced population growth, 20 of 23 Ku suffered
population declines and 11 Ku lost more than 20,000 residents.
However,between 1998 and 2007,all of Ku except only Kita-ku experienced
population increase and eight Ku among them gained more than 20,000 residents.
The common element among almost all of eight Ku was not their income level but
their location. Six of eight Ku-Edogawa,Koto,Chuo,Minato,Shinagawa,and
Ota Ku-were located along Tokyo Bay.
The six waterfront Ku experienced a combined increase in population of
217,669 that accounts for less than 50% of total growth of central Tokyo(23 Ku)for
last decade. Koto-ku in the waterfront areas gained the largest population(59,481)
for the last ten years in central Tokyo,where it lost 27,1472 residents between 1988
and 1997. According to Jacobs (2005), the growth in these areas came from
immigration from other Ku,suburban parts of Tokyo metropolis and Kanagawa
prefecture.
Meanwhile,these in-migrants were largely consisted of young and middle-aged
households. According to a survey result by MILT (2006), 65.1% of net-inflow
households into 3 core areas for the 5 years up to 2003 were households with head
aged less than 44. On the other hand,regarding the households with a head aged
65 and over,number of out-migrants exceeded in-migrants by 834. Yabe(2003)
also observed that single and multi-income households accounted for a high
proportion of the movers.
However,such a process has occurred different ways from that of gentrification
that has experienced in other advanced capitalist cities since 1950s. Generally,
gentrification defines as the process by which higher income households displace
lower income residents of neighborhood,changing the essential character and flavor
of that neighborhood (Kennedy and Leonard 2001,Smith 2002). Thus,displace-
ment of low income residents is one of the defining components of gentrification.
The problem is that the displacement is taking place involuntarily, that is, the
replacement of those original residents who would prefer to stay there,but because
of rapidly increasing rents rather than forced evictions,cannot afford to do so. In
6 Journal of Regional Development Studies(2008)

Tokyo,However,recent researches indicate that the influx of new comers has taken
place without displacing existing renters and home owners (Takagi 2002,Sonobe
2001). Also,Table 3 shows that there were few changes in rank of 3 core Ku and
waterfront Ku in 23 Ku in terms of household income between 1990 and 2003 where
their growth rate was relatively much higher than others since 1995. Waley(1997)
concluded that what Tokyo has experienced is not gentrification but the construc-
tion of limited number of new high-rise prestige complexes in relatively central parts
of the city. Actually,much urban and housing development has occurred on a
landfill in the bay or,using the large plots of land once occupied by storage and
distribution facilities and industrial facilities.
Factors Contributing to Recentralization and Its Consequences
Causes First of all, falling land prices by collapse of bubble economy was a key
ingredient for recentralization of population into inner areas. During the bubble
economy,and especially at its peak in 1990,property prices in Japan likely deviated
from their true values due to temporary demand and speculation. The commercial
and residential prices rose to above three times the price of its pre-bubble time
prices. As the result, population level in 23 Ku which has consecutively
maintained the excess of net inflow of migrants from areas within Tokyo metropolis
and other prefectures since 1950 changed to the excess of net-outflow to other areas
since 1987.
Since 1991 and the end of bubble economy, however, the prices had fallen
Table 3 Household Income of 3 Core Ku and Waterfront Ku,and Their Ranks
1990-2003(100 yen)
1990 Rank 2000 Rank 2003 Rank
23 Ku 47,500 43,460 41,780
Chiyoda 106,430 1 75,290 1 73,660 2
Chuo 69,560 3 50,790 7 51,370 6
Minato 80,310 2 72,980 2 76,750 1
Koto 41,280 17 38,830 15 37,160 13
Edogawa 41,300 16 39,750 13 37,160 14
Shinagawa 45,420 13 43,350 11 41,470 12
Ota 47,470 11 44,270 8 41,910 9
Source:Nihon Marketing Kyoiku Center,2004
7 AN:Recentralization of Central Tokyo and Planning Responses
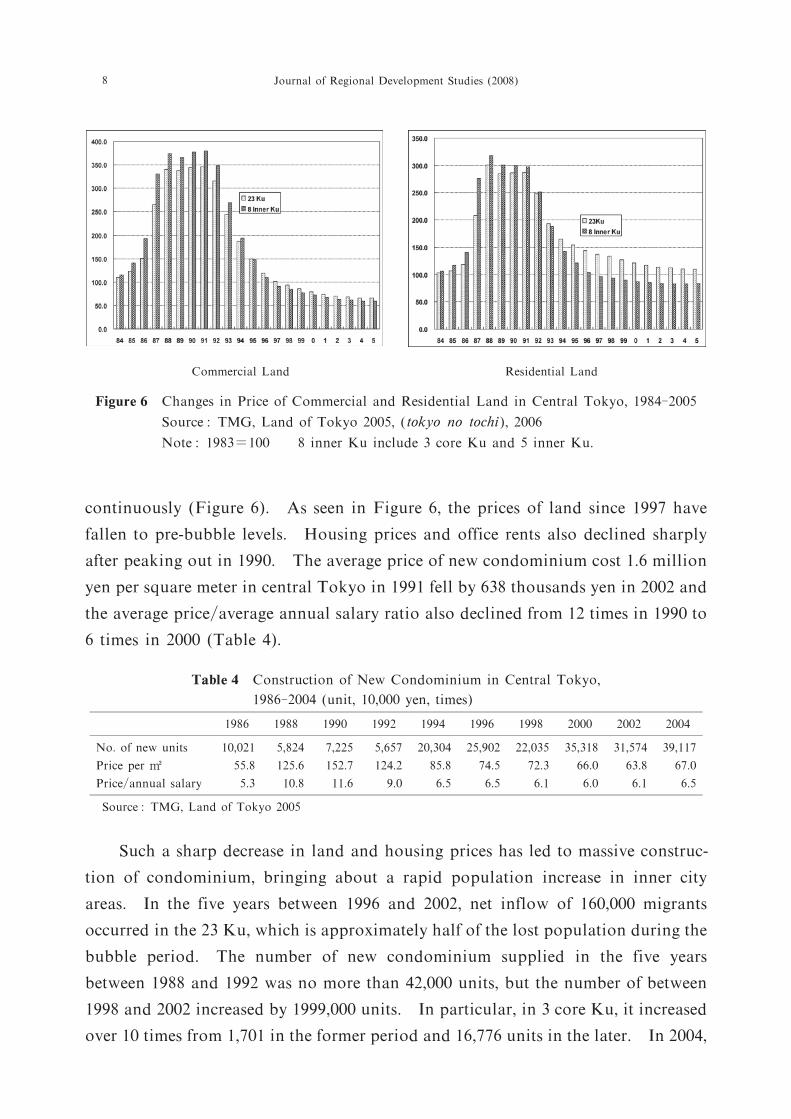
continuously(Figure 6). As seen in Figure 6,the prices of land since 1997 have
fallen to pre-bubble levels. Housing prices and office rents also declined sharply
after peaking out in 1990. The average price of new condominium cost 1.6 million
yen per square meter in central Tokyo in 1991 fell by 638 thousands yen in 2002 and
the average price/average annual salary ratio also declined from 12 times in 1990 to
6 times in 2000(Table 4).
Such a sharp decrease in land and housing prices has led to massive construc-
tion of condominium, bringing about a rapid population increase in inner city
areas. In the five years between 1996 and 2002, net inflow of 160,000 migrants
occurred in the 23 Ku,which is approximately half of the lost population during the
bubble period. The number of new condominium supplied in the five years
between 1988 and 1992 was no more than 42,000 units,but the number of between
1998 and 2002 increased by 1999,000 units. In particular,in 3 core Ku,it increased
over 10 times from 1,701 in the former period and 16,776 units in the later. In 2004,
Figure 6 Changes in Price of Commercial and Residential Land in Central Tokyo,1984-2005
Source:TMG,Land of Tokyo 2005,(tokyo no tochi),2006
Note:1983=100 8 inner Ku include 3 core Ku and 5 inner Ku.
Table 4 Construction of New Condominium in Central Tokyo,
1986-2004(unit,10,000 yen,times)
1986 1988 1990 1992 1994 1996 1998 2000 2002 2004
No.of new units 10,021 5,824 7,225 5,657 20,304 25,902 22,035 35,318 31,574 39,117
Price per㎡ 55.8 125.6 152.7 124.2 85.8 74.5 72.3 66.0 63.8 67.0
Price/annual salary 5.3 10.8 11.6 9.0 6.5 6.5 6.1 6.0 6.1 6.5
Source:TMG,Land of Tokyo 2005
Commercial Land Residential Land
8 Journal of Regional Development Studies(2008)

it reached more than 39,000 units at its peak (Table 4).
It is notable that so called one room mansion supplied explosively during the
1980s and showed declining tendency after the bubble burst is booming again since
1997. The major differences from the boom in the late 1980s are their size and
location of their construction. Less than 20 square-meters accounted for 71.3% of
total one room mansion in 1990. But,while 20 square-meters over and 25 less
accounted for 78%, 20 square-meters less accounted for only 10.6% in 2002.
Looking at their location,52.3% of them were built in 12 inner Ku in 1990. But,
22.1%were built there in 2002. Meanwhile,42.7% of total were built in 3 core Ku
in 2002,as compared to the only 0.7% in 1990. As mentioned above,growth in
single family in these areas brought about rise in demand for one room mansion.
Along with such a one room mansion boom, the rapidly growing supply for
high-rise condominium more than 20 storey also contributed to the recentralization
of population in the region (Table 5).
While economic forces like changing land and housing market seem to drive the
population influx into downtown, government policies of the past and present
facilitated the process.
At the end of bubble economy between the late 1980s and early 1990,many
residential areas in inner city areas including three core Ku have faced serious
problems such as closure of shops and collapse of communities by their rapid
replacement of low-rise housing and small commerce to office building and high-rise
developments. Central and local governments attempted a variety of policy
measures to preserve communities and to curb the falling population level.
Government adopted a policy of comprehensive redevelopment that involved the
purchase of land and the construction of unifunctional high-rise housing estates,and
some incentive and subsidy measures to promote housing construction in inner-city
areas. Several core Ku pursued measures to subsidize rents and extend credits for
Table 5 New High-rise Condominium Units of 20 Storey or Over
1999 2000 2001 2002 2003
Chiyoda 500
Minato 244 257 330 15 211
Chuo 1,078 925 288 608
3 core Ku 244 1,335 1,755 303 819
23 Ku 1,590 2,990 4,130 4,419 2,132
Source:Hirose, M. (2005),“Impacts of Recentralization of Tokyo on Urban Structure and Travel Demand,”
Transportation and Economy 65(8),p.18.(Japanese)
9 AN:Recentralization of Central Tokyo and Planning Responses

young people moving in or wishing to remain, including direct intervention like
supply of social housing. Besides,it was required in some central areas that when
new commercial developments were undertaken,a certain proportion of building
had to be occupied by housing for the purpose of protecting concentration of special
land uses in neighborhood (RICE, 2000). However, in the respect of that the
growth of population began in the late 1990s,there remain some questions that how
effective these measures were on population recovery in inner-city areas.
Furthermore,Hatta(2006)argues that a major factor behind this new phenome-
non is a series of statutory changes implemented in the early 2000s to promote urban
regeneration with the relaxation of FAR control in the late 1990s,and government’
s abandonment of the ideology of“balanced development”,long-held philosophy
that served as the backbone of various policies, and the abolishment of Factory
Restriction Law. Basically,decentralization policies were main direction for all of
spatial policies and plans,because heavy concentration of population and economic
function has been considered major problems to be solved. Factory Restriction
Law was a measure introduced in 1959 designed to remove from the 23 Ku large
factories,university campus,and other such inefficient users of land. These policy
measures were partly successful in the respect of industrial development of suburban
and local areas. But,pace and intensity of concentration of the function in central
Tokyo has not been easily slowed and weakened.
The roles of government involved in these changes are discussed further in next
sections.
Consequences
Recentralization of Tokyo is double-edged sword. It has caused both positive
and negative impacts. It has led to revitalization of city neighborhoods on the one
hand,and it has imposed on costs on certain groups or geographical spaces,on the
other hand.
First,commuting times (hour away from home) for salary men and students
into 3 core Ku that has consistently lengthened by 1995 began to decrease from 2000
for the fist time. Average commuting times into the region dropped from approxi-
mately 71 minutes in 1995 to 69 minutes in 2000. The proportion of commuting
time less than one hour has gradually decreased from 40.1% in 1980 to 33.1% in
1995. However,it reversed to 35.0% in 2000,representing increasing proximity to
workplace. The reduction of commuting time is attributable to the growth of
10 Journal of Regional Development Studies(2008)

residing population in city center.
Second,the number of children with population recovery in inner Tokyo has
continued to grow. In Japan,since the basic unit of territory based community is
mainly consisted by primary school district,the increase of children means growth
in opportunity to interact with residents in community through nurturing children
and their education,consequently,helping revitalization of community.
Third,growth of residing population in city center,particularly in Minaoto-ku
and Chuo-ku where rapid population recovery is occurring has brought many retail
shops for local residents to the areas which are necessary for a stable and vigorous
community.
Fourth, the high-rise condominium boom created severe conflicts, in part
because they brought with them deterioration of landscape,but even more because
they blocked direct sunlight to neighboring houses.
Fifth, conflicts between older and new residents are appearing. A growing
number of new residents moving into high-rise housing is not likely to lead to
well-balanced local communities. Disparities in lifestyle between those living in
high-rise blocks or one room mansion and the old residents of two storey houses are
great.
Sixth, lack of public service provision such as primary school and nursery
school capacity has occurred in some neighborhoods due to rapid growth in number
of children.
Urban Restructuring in Tokyo in 1990s and Planning Responses
When examining the policies for urban growth and management in Tokyo in
1990s,it is impossible to ignore the urban structuring that occurred in the 1980s,
particularly the second half of the decade,which was at a turning point in its urban
development.
The bubble economy began in the mid 1980s impacted on the built environment
and urban structure in Tokyo in various ways. They can be summarized as
follows:a rapid growth in office space,skyrocketing land price,displacement of
housing and evictions of communities,deregulation of urban planning and construc-
tion, and active redevelopment projects. (Hayakawa and Hirayama 1991;Ma-
chimura 1992)
A rapidly rising demand for office space was created as the city’s economy
11 AN:Recentralization of Central Tokyo and Planning Responses

adopted new roles in the global control of capital and the global businesses were
heavily concentrated in central Tokyo. Land for office building increased to 30%
in the five years from 1986 to 1991. Even so,the office vacancy rate dropped to low
rate of around 0.3% in central Tokyo. This promptly led to abnormal rise in land
price in the center of Tokyo first and then spread to Tokyo region and to all of
Japan’s major cities. As seen in Figure 6,the average price of commercial land in
8 inner Ku increased nearly four times between 1983 and 1991.
Relaxation of city planning was carried out throughout the 1980s. Inspired by
the neo-liberal policies of Reagan and Thatcher,Japanese government led by then
Prime Minister Nakasone promoted policies of deregulation, the use of private
enterprise and privatization,the expansion of domestic demand,and fiscal retrench-
ment (Sorensen 2003)These were essential elements of minkatsu policy,meaning
something like the active use of the dynamism of private enterprise. Hayakawa and
Hirayama (1991) call minkatsu “a mechanism for reorganizing urban space in
pursuit of economic growth”. The major measures adopted by minkatsu policy
were relaxation of zoning regulation and disposal of public land. The deregulation
that this entailed focused on encouraging redevelopment in central Tokyo. Specifi-
cally, they were to increase floor area ratio in inner city areas, rezone residential
zone to commercial, and relax the regulation on development in ‘urbanization
control area’where urbanization should be basically restricted and was designated
in urban fringe area. The disposal of public land to private sectors in pursuit of
urban redevelopment was largely connected with the privatization of Japan
National Railways.
In addition to these measures, the 4 Capital Regional Development Plan
proposed the restructuring of mono-centric regional structure to poly-centric one,by
construction of 11 existing urban centers(later 4 centers were added)as“satellite
business sub-centers”in 1986. Its purposes were to discourage the over-concent-
ration of business function and reduce negative externalities in Central Tokyo.
However, these subsidiary centers created new and supplementary functions and
helped expand and reinforce the role of Tokyo, rather than absorbing excess
capacity from Tokyo.
The policy of reinforcing Tokyo was also implemented at Tokyo Metropolitan
Government level. Six sub-centers(Shinjuku,Shibuya,Ikebukuro,Ueno,Kinshi-
cho,and Osaki)were designated to form poly-centric urban structure within the
inner area in 1983(Sorensen 2001). While,the CBD area(3 core Ku)was designat-
12 Journal of Regional Development Studies(2008)

ed as the global finance and
information center, these sub-
centers were proposed to pre-
vent the further expansion of
the CBD. To these centers was
added a seventh on reclaimed
land on Tokyo bay in 1988,
called the waterfront sub-center
(Figure 7). The waterfront
sub-center was chosen as a pri-
mary area to enhance Tokyo’s
global communication and
exchange function(Saito 2003). Thus,in the 1980s,spatial plans made by national
and local governments were to facilitate redevelopment and intensification of central
Tokyo and hence further accelerated a huge property development boom.
The bubble economy burst in the early 1990s. Following the burst,the nation’
s financial system almost collapsed under bad real estate loans,and the country has
suffered economic stagnation since 1991 and to 2005. The average real GDP
annual growth between 1991 and 2003 did not exceed 1%. Japanese government
attempted various measures for economy recovery such as expansion of public
expenditure by issuance of government bonds,adoption of low interest rate close to
zero percent,tax reduction policy,and expansion of money supply. In particular,
huge public spending was injected on infrastructure development in an attempt to
restart economic growth. The public investment in the form of supplementary
budgets amounting to approximately 66 trillion yen propped up the economy.
Notwithstanding,the spending on major public works has not been to link autono-
mous recovery of economy. As a result, decrease in domestic demand resulting
from the extended recession led to the excessive of supply,and in turn deflation
spiral effect accompanying decline in consumer price and real GDP coincidentally
since 1998 was continued.
Japanese economy and the system of Japan Inc.that once was area of study as
a successful model of economic development from all countries in the world
changed to that of criticism,expressing it as sinking sun from the rising sun. The
public mood in Japan also changed from one of great confidence to one of
uncertainty and pessimism. The 1990s has,thus,been labeled the lost decade.
Figure 7 Third Long-term Plan for the Tokyo
Metropolis,1991
13 AN:Recentralization of Central Tokyo and Planning Responses

Meanwhile,by the late 1980s,there was increasing public pressure to address the
land inflation crisis. A number of government related measures related began to
move from deregulation to strong planning and the tighter regulation of property
development. The emphasis in planning and development field was also shifted on
quality of life. There was a significant strengthening of City Planning Law includ-
ing provision of Master Planning and improved zoning regulations in 1992. Eight
zoning categories were subdivided into twelve,allowing for more detailed control of
land uses. Policies designed to attract younger residents and tempt existing resi-
dents to stay in inner city areas was also introduced in this period.
However,the persistence of the economic crisis led to moves to deregulate the
property development industry to make land development profitable once again to
compensate for bubble-related losses. In the late 1990s, significant increases in
allowable building heights and volumes in order to make urban redevelopment
more profitable were made in Building Standards Law.
Urban Regeneration Strategy and Spatial Planning in Tokyo
At several times during the 1990s,there were signs of turn-around to economy
recovery. But,the economy couldn’t enter upon upward phase of economic cycle
in spite of various recovery measures. By the end of 1990s, a new approach to
economy recovery was emerging. Japanese government began to seek the cause of
long-term depression from Japanese system and standard in which the state always
safeguarded national industry,lifetime employment system,equalitarian approach,
and main bank system under which business corporations and their main bankers
are closely and effectively connected. It was recognized that these traditional
Japanese system could not provide the answers and that,rather than a new set of
polices,a shift in the framework of economics,social and education itself in the light
of the global standard is needed.
The government announced an‘Emergency Economic Package’that sought to
approach the problem from a fundamental perspective. As part of this package,the
government set up the“Headquarters for Urban Regeneration”within the cabinet in
2001. The headquarter states the significance of urban regeneration as follows:
The basic significance of revitalizing the urban areas,which are the source
of vitality in Japan in the 21st century,is to heighten their attractiveness and
14 Journal of Regional Development Studies(2008)

international competitivenesse.......Moreover, such revitalization of urban
areas would draw forth the capital and know-how that exist in the private
sectors,direct them toward the urban areas,which in turn would arouse new
demand and lead to the realization of economic revitalization. Additionally,
the revitalization of urban areas would contribute to the disposal of the
non-performing loans issue through the liquidity of land assets(MLIT 2002)
As shown in the statement,the focus of the act was placed on the strengthening
international competitiveness of Japanese cities,promotion of private involvement
in urban development,economy recovery,and disposal of bad loans. Basically,the
urban regeneration strategy consists of three main programs:urban regeneration
project by state initiative, urban development by private investment, and urban
regeneration project in nationwide to be carried out by local government and NPO
or voluntary sector. The centerpiece of these urban regeneration strategies is second
program,full support including deregulation and financial and taxation incentives
for private urban development projects. To promote actively the project, the
government enacted the Special Urban Regeneration (Urban Renaissance)Act in
June of 2002. Looking at the ideological agenda,it is similar again to the one of
minkatsu that prevailed under the Nakasone government in the early 1980s.
Controls and restrictions have been further loosened,with a series of measures that
have significantly relaxed Floor Area Ratios(FARs)(waley 2007).
Headquarter for urban regeneration has authority to designate Urban Regenera-
tion Area in which greatly weakened development regulation will apply and relaxed
FAR bonus system can be permitted directly by central government instead of
requiring local government consultation (Sorensen 2003). Thus,by giving cabinet
authority to designate regeneration areas,the central government has made it much
easier and faster to grant approval for huge FAR bonus for redevelopment of inner
city sites into high-rise global space. Large-scale redevelopment projects sites
carried out since 2002 in Tokyo and other large metropolitan areas are mostly urban
regeneration areas designated by this act.
Figure 8 represents eight areas designated by this act in Central Tokyo,which
consists of total 2,514 ha. All of sites in Tokyo are in central areas. The size of
projects in terms of floor space and height of buildings has been successively
increased,as new rules have allowed for ever-great relaxation of existing regulation
(table 6 and 7). After a 15 years period of decline,land prices started rising again
15 AN:Recentralization of Central Tokyo and Planning Responses

in Tokyo in the latter part of 2005.
Spatial Planning and Policies in Tokyo
Since the late 1990s when Ishihara was elected new Governor of Tokyo,
planning thinking and planning strategies of Tokyo have been changed dramati-
cally. He proposed to revitalize Tokyo again as Japan’s leading city and an
important world player. His idea was reflected in the planning documents for-
mulated successively by Tokyo Metropolitan Government (TMG) in the years
following the election. The words“increasing attractiveness,competition,world or
global city”appear frequently in these documents. “The Tokyo Plan 2000”iden-
tifies the Tokyo’s task as being necessary for it to become a global city. “Urban
White Paper of Tokyo 2000”also refers to the competitive aspect of the global
Figure 8 Urban Regeneration Areas in Tokyo
Source:Prime Minister and His Cabinet,Headquarter
for Urban Regeneration,2007
Table 6 Number of Buildings with a Height 100m or Over(Including Residential
Building)1,000㎡
00 01 02 03 04 05 06 Total
No of Buildings 14 9 23 19 20 21 22 128
Total Floor Area 838.2 858.5 2,701.4 1,752.9 1,235.8 1,834.0 1,455.0 10,675.8
Source:Hirose, M. (2005),“Impacts of Recentralization of Tokyo on Urban Structure and Travel Demand,”
Transportation and Economy 65(8),p.19.(Japanese)
16 Journal of Regional Development Studies(2008)

world. The priorities of urban policy in Tokyo were mainly placed on attracting
inward investment and increasing economic competitiveness.
These ideas have been reflected in the strategic planning. First of all,regard-
ing the role of CBD, the new strategy,with its emphasis on competitiveness, has
focused on the importance of the agglomeration of business functions in central
core. Thus,TMG proposed to revitalize the central core areas and develop it as a
location to boost Japanese economy(Saito and Thornley 2003).
The second debate point in the strategic planning was the location of new
capital. Although the consensus on the over-concentration in Tokyo and the
resulting problems has diminished after the bubble collapse,relocation of capital
function is still a live issue. TMG has consistently opposed to such a move and are
challenging central government on this issue. The Tokyo Megalopolis Concept
“(TMG 2001) formulated in 2001 proposes the inclusion of central government
functions in the region by constructing the”circular megalopolis structure”. The
plan takes a regional approach,linking Tokyo metropolis,Saitama,Chiba,Kanag-
awa prefectures and Yokohama,Kawasaki and Chiba cities,which would allocate
various functions including central administrative functions to the above said zones,
and allow for dynamic exchange among zones and the development of attractive city
life(Figure 9)
Table 7 Large-scale Urban Development Projects Completed between 2002 and 2007
area Name of project Total floor space(㎡)Previous land use Present land use Completed year
Otemachi/
Marunouchi/
yurakucho
8 projects including
Tokyo Station and Mar
unouchi Building
1,385,260 No change Office,commercial 2002~2007
-
Akasaka/
Roppongi/
Omotesando
Roppongi Hills,
Tokyo Midtown,
Omotesando Hills
1,388,991 Housing, com
mercial, offices,
public land
Office, commercial,
residential, recrea
tional
2003~2006-
-
Nihonbashi Koredo,
Mitsui Tower
233,855 Office, commer
cial
Office,commercial 2004,2005-
Akihabara Akiabara Daibiru,
UDX
211,676 Wholesale mar
ket, Railway
yard
Office, commercial,
hotel,residential
2005,2006-
Shiodome Shio
site
4 blocks 1,147,808 Railway yard Office, commercial,
hotel,residential
2002~2005
Shinagawa East 6 projects 596,112 Railway yard Office, commercial,
hotel,residential
2003~2004
Source:Nikkei BP,Tokyo Projects
17 AN:Recentralization of Central Tokyo and Planning Responses

Concluding Remarks
It seems fair to conclude that the recentralization process of central Tokyo
differs more or less from that of gentrification which has largely been experienced
in western cities. Although limited number of new high-rise prestige complexes
were supplied in relatively central parts of the city, much urban and housing
development has occurred on landfill in the bay or,using large plots of land once
occupied by industrial facilities and company housing and Japan Railway.
It is interesting finding that young and middle-aged households accounted for
a high proportion of the movers. Increased in smaller household and multiple-
income households are another characteristic. Because of need less space,they buy
one room mansion nearby center. In the case of multiple income households,they
tend to locate more centrally in order to minimize transportation costs. Increase in
these households has given both positive and negative impacts on neighborhood
changes. Positive impacts have been decreased traffic congestion and swindling
commutes by proximity to workplace and revitalizing neighborhoods. Negative
impacts have been conflicts between old and new residents,landscape and sunlight
right conflicts,rising crime rate,and lack of public service provision.
It is clear that wide range of different types of public intervention involved in
the late 1990s,particularly urban regeneration strategy and policies,have facilitated
Figure 9 Tokyo Megalopolis Concept
18 Journal of Regional Development Studies(2008)

the recentralization process of central Tokyo. The urban generation process has
several interrelated characteristics. First,the role of state in the urban development
projects has changed. Government has withdrawn almost entirely from the projects
and the partnership between private capital and public sectors in the name of PFI
and PPP in the reconstruction of government building and public facilities was
intensified. Second, Japanese capital has played a more important role in the
development process than global capital,unlike other global cities where new influx
of global capital into large mega-development in urban center has been remarkable.
In the Japanese case,most of projects have been led almost entirely by Japanese
private sector consortia. The third characteristic is outward expansion of urban
generation projects from the urban center,attracting people and capital into the city
and reinforcing the city function more and more.
It is also worth noting that the policies and spatial planning at national and
local level since 1990s have focused on further reinforcing Tokyo in the name of
building a competitive global city. A growing gap between larger metropolitan
areas and local areas in recent years is no doubt attributable to these policies and
ideological shift from equity to efficiency in the development field.
References
Hatta,T(2006),Economics of Urban Recentralization,Tokyo:Nihonkeizai Shinbunsha.(Japanese)
Hayakawa,K.and Hirayama,Y.(1991),“The Impact of the Minkatsu Policy on Japanese Housing
and Land Use,”Environment and Planning D :Society and Space,9 :151-164.
Hirose,M.(2005),“Impacts of Recentralization of Tokyo on Urban Structure and Travel Demand,”
Transportation and Economy 65(8):p.14-22.(Japanese)
Jacobs,A.J. (2005),“Has Central Tokyo Experienced Uneven Development?An Examination of
Tokyo’s 23 Ku relative to America’largest Urban Centers,”Journal of Urban Affairs,27(5):
521-555.
Kennedy,M.and Leonard,P(2001),“Dealing with Neighborhood change:A Primer on Gentrifica-
tion and policy Choices,”A Discussion Paper Prepared for The Brookings Institution Center on
Urban and Metropolitan Policy.The Brookings Institution.
Machimura, T. (1992), “The Urban Restructuring process in Tokyo in the 1980s:Transforming
Tokyo into World City,”International Journal of Urban and Regional Research, 16(1):
114-128.
Ministry of Internal Affairs and Communications,Bureau of Statistics,Population Census of Japan,
Each Year
19 AN:Recentralization of Central Tokyo and Planning Responses

Ministry of Infrastructure,Land and Transport (MILT) (2006),White Paper on National Capital
Region 2006.
Nihon Marketing Kyoiku Center(2004),Individual Income Indicators,Kyoiku Center.
Research Institute of Construction and Economy(RICE)(2000),Construction Economy Report,35
Saito, A. (2003), “Global City Formation in Capitalist Development State:Tokyo and the
Waterfront Sub-center Project,”Urban Studies,40(2):283-308
Saito,A.and Thornley,A.(2003),“Shifts in Tokyo’s World City Status and the Urban Planning
response,Urban Studies,40(4):665-683.
Smith,N. (2002),”New Globalism,New Urbanism:Gentrification as a global Urban Strategy,”
Antipode,34(3):427-449.
Sonobe,A.(2001),Contemporary Urban Sociology,Tokyo:Dosinto
Sorensen,A.(2001),“Subcentres and Satellites Cities:Tokyo’s 20th Century Experience of Planned
Polycentrism,”International Planning Studies,681):9-32.
Soresen,A.(2003),“Building World City Tokyo:Globalization and Conflict over Urban Space,”
Annals of Regional Science,37:519-531.
Takagi (2002),“City center and Inner Area,”Urban Sociology toward 21 Century,Kikuchi and
Egami (eds.),Tokyo:Gakumonsha(Japanese)
Tokyo Metropolitan Government,Population and Household by Basic Resident Registers,Each year
Tokyo Metropolitan Government (2003), White Paper on Housing in Tokyo (Tokyo Jutaku
Hakusho)
Tokyo Metropolitan Government (2006),Land of Tokyo 2005,(tokyo no tochi)
Waley, P. (1997), “Tokyo:Patterns of Familiarity and partitions of difference,”The American
behavioral Scientist,41(3):396-428.
Waley,P.(2007),“Tokyo-as-World-City:Reassessing the Role of Capital and The State in Urban
Restructuring,”44(8):1465-1490.
Yabe,Naoto (2003),“Population Recovery in Inner Tokyo in the Late 1990s:A Questionnaire
Survey in Minato Ward,”Jinbunchiri,55(3):79-94.(Japanese)
20 Journal of Regional Development Studies(2008)